
Abstract
We present a stochastic dynamic simulation model for exploration and extraction of seafloor massive sulfide (SMS) mineral deposits on the Norwegian Continental Shelf (NCS). The model is developed based on selected industry knowledge, expectations, and perceptions elicited through a participatory systems mapping session with 82 participants and 20 in-depth interviews with experts from industry, academia, and the public policy sector. Using the model, we simulate the expected ranges of resource- and economic potential. The simulation results indicate an expected commercial resource base of 1.8 to 3 million tons of copper, zinc, and cobalt, in which copper makes out the most significant part. Relating to the expected commercial resource base, we highlight a discrepancy between academic and industrial expectations, in which the academic expectations are more conservative than the industrial expectations. The corresponding net present values lie in the range of a net present loss of 970 million USD up to a net present gain of 2.53 billion USD, in which the academic expectations are projected to yield a negative net present value, while the industrial expectations are projected to yield a positive net present value. Closer investigation of the results reveals that one of the main challenges regarding SMS exploration and extraction is the initial exploration costs associated with coring operations. These costs are expected to be high with today’s exploration technology. Moreover, they occur relatively early in time compared to revenue-generating activity, which has a significant negative impact on the net present value of the industry due to discounting. Thus, a key focus of the industry should be to find ways to reduce the costs associated with coring operations and/or the time it takes from initial exploration to extraction and generation of revenue.
Introduction
Global commercial supply of critical minerals is based on onshore mining and recycling (Kaluza et al. 2018; United States Geological Survey (USGS) 2020). However, the onshore industry is facing declining resources, falling ore grades, and increasing extraction costs (Watari et al. 2019). At the same time, population growth, economic growth, and the green shift are increasing the demand for metals (International Energy Agency (IEA) 2021; Kaluza et al. 2018; Watzel et al. 2020). According to today’s projections, the future demand for metals can only partly be satisfied through extraction from onshore sites and increased recycling (International Energy Agency (IEA) 2021; Ministry of Petroleum and Energy 2021; Sparenberg 2019; Watzel et al. 2020). This may pave the way for alternative mining, such as deep-sea mining (Bang and Trellevik 2022b).
The deep sea may be earth’s final frontier—it is poorly explored and the knowledge gaps are significant (Lusty and Murton 2018). Nevertheless—the deep sea is known to hold significant deposits of critical minerals (Hein et al. 2013; Petersen et al. 2016; Sharma 2017). Marine mineral deposits were first identified in the 1870s (Sparenberg 2019; Volkmann and Lehnen 2018). Since then, deposits have been identified both in international waters and within different countries’ exclusive economic zones (EEZs). Several attempts have also been made to extract marine minerals, but none of these attempts has yet been commercially successful (Childs 2020; Hyman et al. 2022; Toro et al. 2020). Nevertheless, new attempts are in progress, and it is possible that the future holds a mining industry including an onshore mining sector and a commercially viable deep-sea mining sector.
Seabed minerals have been identified in Norwegian waters, primarily in the form of sulfides and manganese crusts (NPD 2021; Pedersen et al. 2021; Pedersen and Bjerkgård 2016). Sulfides contain mainly lead, zinc, copper, gold, and silver, while manganese crusts contain manganese and iron, and small amounts of titanium, cobalt, nickel, cerium, zirconium, and rare earths.
In 2019, the Norwegian parliament passed a marine minerals act and the parliament is scheduled to vote on the formal opening of the Norwegian EEZ for commercial mineral exploration and extraction in 2023, pending an ongoing environmental impact assessment (NPD 2021; Pedersen et al. 2021; Regjeringen.no 2021).
At least three mineral exploration and production companies have already been established in Norway. These are currently positioning themselves for the scheduled opening in 2023. The authors have also identified at least four substantial industrial corporations engaging and investing in the potential marine minerals industry, as well as initiatives by a plethora of service and technology providers, historically catering to other subsea industries. A conservative estimate by the authors indicate that some 300 million NOK have already been invested in the marine minerals initiatives on the Norwegian Continental Shelf (NCS)—with significantly larger investments in the pipeline.Footnote 1
Although an opening is in progress and investments are being made, there is currently limited knowledge about the mineral resource potential on the NCS, and whether extraction will be profitable. The Norwegian marine minerals industry is barely in its infancy—currently without parliamentary consensus to proceed—seeking to extract resources that are poorly explored, in an environment that is poorly understood, using technology that has yet to be developed and proven. Thus, the future of the Norwegian mining industry is riddled with uncertain, unknown, and even unknowable factors.
Motivated by the lack of literature on deep-sea mining on the NCS, and the otherwise limited literature on deep-sea mining, this study maps and synthesizes the industrial complex evolving around exploration and extraction of marine minerals from seafloor massive sulfides (SMS) on the Norwegian continental shelf. Based on the mapping and synthesis, it simulates possible industry development trajectories, the expected resource potential, and the expected economic potential, per selected material including knowledge, expectations, and perceptions regarding the geological resources, available technology for exploration and extraction, operational factors, commercial factors, and regulatory factors.
To achieve the objectives, a simulation model is developed based on literature and database reviews, observation, participatory modelling, as well as qualitative interviews, with a wide array of stakeholders and experts. The broad-spectrum approach affords access to a comprehensive range of information. This in turn, enables description, modelling and simulation of current consensus and various scenarios. The environmental aspect of deep-sea mining is important and a significant uncertainty for the industry. However, this aspect is largely left out of the scope of this study.
Methods
We build an exploratory system dynamics model with stochastic features based on numerical and written databases as well as knowledge, expectations, and perceptions elicited from experts and stakeholders. By way of Monte Carlo simulation and sensitivity analysis, we explore possible development trajectories and uncertainties. We run simulations for various resource scenarios and conduct sensitivity analyses for key variables and parameters pertaining to the resource base, discounting, costs, and revenue.
System dynamics is useful for mapping and simulating complex and uncertain systems. This makes it appropriate for achieving the objectives of this study. System dynamics has a strong tradition for making use of data extracted from a number of different sources, including numerical, written, and mental databases (Forrester 1987, 2007; Forrester 1992; Luna-Reyes and Andersen 2003a; Sterman 2002). Mental databases include information such as subjective expert knowledge, experience, expectations, and perceptions. Such information can be valuable, especially when the numerical and written databases are limited and/or incomplete, which is typical for emerging industries such as the deep-sea mining industry.
Since the numerical and written databases for mineral resources and deep-sea mining on the NCS are scarce, the work presented here employs transferable analogous concepts or technological principles familiar from related and more established domains, such as onshore mining and offshore oil and gas. Moreover, it relies on information from the mental databases of stakeholders and experts. Through organized engagement with experts and stakeholders, we map structural elements, elicit parameter values, and perceptions of uncertainty as they are described by people with first-hand insight to the possibly emerging industry, including stakeholders and experts from industry, government, and academia. This pragmatic and comprehensive approach to information gathering allows access to information that is currently unavailable in terms of numerical and written data. This in turn puts us in position to form a full perspective of the possibly emerging industry.
The structural elements and parameters applied in the model are elicited through four consecutive and iterative steps including review of numerical and written databases, observation, participatory modelling, and iterative disconfirmatory interviews. Figure 1 illustrates the model development process used to formulate the model presented in this study. The height of the polygon indicates the boundaries of the model scope., i.e., a higher height of the polygon suggests that more elements are included and vice versa. Saturation indicates the rate to which the model structure is confirmed by triangulation between participating stakeholders and experts. Model validity indicates the level to which the model structure is accepted. The utility indicates the usefulness of the model. With limited access to numerical and written data, the model starts off with a narrow scope, low validity, and low utility. Through the qualitative steps, the model boundaries increase, as new information is retrieved. Through the modelling process, the model boundaries are focused on relevant structure for research objectives, while both validity and utility increase.
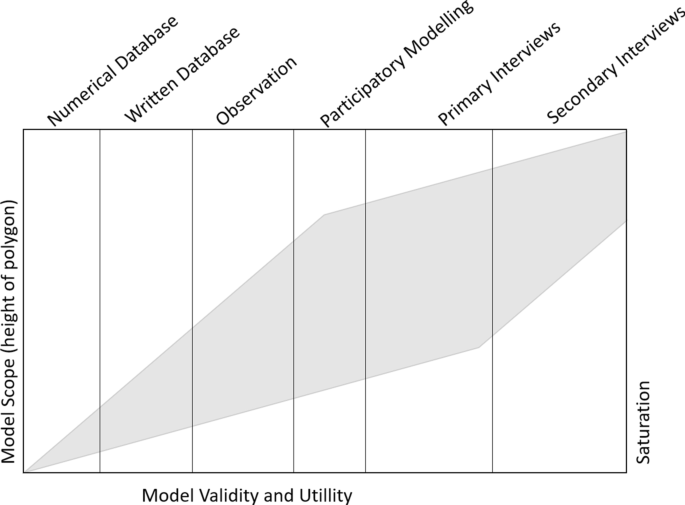
Illustration of the model development process and how it relates to model scope, saturation, as well as model validity and utility
Repenning (2002), and later, Kopainsky and Luna-Reyes (2008) assert that the system dynamics approach to developing models have many similarities with the concept of theory building. In this perspective, the methodology and modelling process applied here can be said to develop a theory about the emerging exploration and extraction industry tied to SMS deposits on the Norwegian continental shelf.
Numerical and written databases
The first step in the modelling process employed involve survey of available numerical and written data. The available ecological, geographic, and geological survey data of SMS deposits on the NCS is limited; the industry forming has yet to launch and document their commercial, operational, and technological concepts; and the regulation is yet not settled. As such, these databases are limited in their direct applicability. There is, however, an available body of academic, commercial, technical, and regulatory work on analogous marine mineral cases available from international contexts. There is furthermore a substantial body of work available from analogous industries such as offshore oil and gas, as well as onshore mining. Available numerical and written databases inform the work presented here and establish a venture point for model development, qualitative research, and data retrieval. Written and numerical data are also revisited through the process of model development. Important sources of numerical and written data includes but is not limited to the Norwegian Ministry of Petroleum and Energy (2021), the Norwegian Petroleum Directorate (2021), Pedersen et al. (2021), Rystad Energy (2020), Hein et al. (2013), Boomsma and Warnaars (2015), and Sharma (2017). Other sources worth mentioning include Jankowski et al. (2010) and Stanton and Yu (2010).
Observation
Observation is a valuable qualitative approach in the field of system dynamics (Luna-Reyes and Andersen 2003). Over a period of 3 years, the authors have observed and interacted with experts and stakeholders by participating in conferences and collaborative forums addressing marine minerals, and via direct dialogue with stakeholders engaging in the marine mineral domain. Access to these forums were encouraged and formalized as members of academia—and the forums, conferences, and other dialogue platforms were cross disciplinary and included stakeholders and experts from industry, government, academia, and various interest organizations.
The authors have participated in 8 different conferences and 16 forum meetings. In addition, the authors had a high number of informal conversations and discussions with other experts. This has allowed the authors an overarching grasp of involved parties and conceived technical, environmental, commercial, and regulatory concepts and challenges, in turn, enabling the further qualitative steps towards eliciting information from mental databases. The extensive observation has also proven important in terms of validating structural elements of the model.
Participatory systems mapping
Participatory modelling, Group Model Building, or Participatory Systems Mapping, are common knowledge elicitation methods within system dynamics (Hovmand et al. 2012; Vidal et al. 2019; Videira et al. 2010). Participatory modelling is a facilitated process wherein experts and stakeholders work in teams to describe important variables, as well as causal relationships, within a system. This form of collaboration can produce a negotiated consensus from a large group of stakeholders and experts in an effective manner.
The participatory modelling session conducted for this study was organized at an industry conference where 82 experts from the offshore industry participated. The group participating was a relatively diverse group within the offshore and subsea professional domain, spanning different nationalities, technical disciplines, levels of seniority, professional roles, and different opinions on marine minerals.
The participatory modelling workshop was designed to follow the systems mapping approach proposed by Wilkerson and Trellevik (2021), where systems mapping is proposed as a venture point for problem definition in innovation processes. The session was executed over a period of 2 h. First, the teams were presented with a seed-model as a point of departure for the mapping exercise. The seed-model presented was a graphical stock and flow model, which can be retrieved from the author’s GITHUB repository (Bang and Trellevik 2022a). Subsequently, the participants were tasked with developing several system-maps with the aim to capture variables and causal relationships within the problem- and development-space of marine minerals exploration and extraction. The explicit challenge presented to participants was to map out how exploration and extraction of marine minerals could unfold as an operational and commercial concept. Following the mapping session, all teams debriefed their results with facilitators, and the system maps were collated, and analyzed to define structural model elements and parameters of relevance for further model development.
Iterative disconfirmatory interviews
Based on the preceding quantitative and qualitative data elicitation, a detailed system dynamics simulation model was developed. As the authors gained confidence that the model adequately abstracted and represented the data and findings, a substantive and iterative series of stakeholder- and expert interviews were ensued. A total of 20 stakeholders and experts were interviewed through this phase of the modelling process. The interview subjects were representatives from industry, public policy, and academia— all with specific expert knowledge and/or vested interests in marine minerals on the NCS.Footnote 2
The interviews executed for this study were formatted as semi-structured and disconfirmatory. Disconfirmatory interviews have emerged in recent years as a rigorous methodology for research and knowledge acquisition and has informed the research methodology in this study (Andersen et al. 2012; Luna-Reyes and Andersen 2003). Iterative disconfirmatory interviews allow for continuous model improvement and validation.
The interviews used preliminary models as a starting point. In the beginning of each interview, the most recent preliminary model was presented to interview subjects, with the purpose of having the model challenged and critiqued through the remaining parts of the interviews. The various experts and stakeholders thereby disqualified existing structures and parameters, and qualified new ones, which allowed for model modification, extension, curtailment, and improvement. Via iteration, saturation was reached. The interview-guide used for the interviews can be found in Appendix 3.
There was overlap between several subjects’ competence and expertise while there was significant distance between the competence and expertise of others. All interview subjects were presented with the entire model structure and its underlying assumptions, logic, and formulations—and were encouraged to challenge the material presented. One-third of the subjects were re-interviewed to either evaluate model changes, or to provide supplementary information. Supplementary interviews were also executed when there was disagreement between interviewees, this to seek negotiated agreement on model structure or parameters and identify for which cases several scenarios should be run.
Model structure validation
The model abstracts and synthesizes the knowledge, expectations, and perceptions of an emerging industry. Therefore, there is no historical data of system behavior towards which the model behavior can be validated against. Validation is henceforth focused on the model structure, which has also been a dominating focus in system dynamics the last two–three decades (Barlas 1996; Barlas and Carpenter 1990; Ford and Sterman 1998).
System dynamics models are causal mathematical models and base their mathematical expressions on postulated causal relations within the system they model. In this, system dynamics models constitute theories about the system they abstract and as theories they can be validated following commonly accepted norms of scientific theory testing. This obviously raises a number of fundamental philosophical questions, pertaining to justification of a knowledge claims, constitution of scientific confirmation, and more, and renders model validation a complicated matter (Barlas and Carpenter 1990).
Through the modelling process, the model both improves—and is validated in terms of its structure as well as its parameterization. Iterative rounds of interviews with representatives from both similar and different niches of expertise, as well as association to the domain afford an opportunity to both reach saturation—and to triangulate between conceptions of the emerging model structure.
The authors have also rigorously tested the model functionality and for mathematical integrity along the way. This includes numerical integration error tests, behavioral tests, consistency tests, and extreme conditions tests. The model is producing behavior aligned with expectations when reviewing the causal relationships of the system components. With a validated model structure as well as mathematical integrity—the authors are confident that the model presented enables analysis and clarity on this emerging industry.
The modelling process has allowed mapping of several emerging system structures, the underlying dynamics, as well as discovery of a range of plausible future trajectories for SMS mineral exploration and extraction on the Norwegian continental shelf. However, the reader should note that the authors are careful not to make any actual predictions. Considering all the uncertainties involved and the nature of this study, that would be futile. Rather, in addition to mapping the exploration and extraction structures, we attempt to simulate the outcome of collective stakeholder and expert knowledge, expectations, and perceptions.
Geological resources
There are two types of marine mineral deposits identified on the Norwegian continental shelf: ferro-manganese crusts and SMS deposits. The two deposit types are considerably different from each other in the mode of deposition, depositional characteristics, mineral composition, and locale of deposition. However, the geological engine driving the mineral deposition of both potential resources is hydrothermal activity around the ultra-slow spreading oceanic ridge system around the island of Jan-Mayen (Lusty and Murton 2018; NPD 2021; Rolf B Pedersen et al. 2021). In deep waters (> 2500 MSW), the oceanic plate is relatively thin and adjacent to magmatic heat. As this is a tectonically active area, the ocean plate is fractured and largely consisting of porous volcanic rock-types. Due to the porosity and fracturing, as well as the considerable water pressure at these depths, seawater percolates into the seabed. Here, it is exposed to magmatic heat, expands, and rises back towards the surface. Migrating through the seabed, exposed to extreme temperatures, the seawater is enriched with minerals. As the seawater rises, and eventually is exhausted back into the ocean, it cools and precipitates minerals.
Ferro-manganese crusts are vast layers of hard material deposited on exposed rock-faces of sufficient inclination to not retain significant sedimentation. Ferro-manganese crusts typically form off-axis from the ridge system, and at under-water mountainsides with slope-angles of at least 30°. The crusts can straddle several kilometers, typically with a hardness of about 8 and with a thickness of an approximate maximum of 20 cm. Ferromanganese crusts have been proven to contain Co, Te, Mo, Bi, Pt, W, Zr, Nb, Y, and rare-earth elements (REEs) (Hein et al. 2013; NPD 2021; Pedersen et al. 2010).
SMS deposits form as piles of material. Hydrothermal-vents build up as chimney-like stalagmite-features. With time, the chimneys collapse, and the hydro-thermal vent finds an alternative route and starts building new stalagmites. The lifespan of a hydrothermal vent system forming SMS deposits appears to be around 50,000 years—after which time the magmatic heat-source either migrates or the deposition field is covered by a lava-flow. There appear to be on average one active vent-site per 100 km of ridge—leaving the Norwegian continental shelf with approximately 5 active vent-sites at any given time. The water temperature inside the hydrothermal vents is approximately 400 °C—and the active vent sites are home to a remarkable biosphere of poorly understood life-forms. Because of both the high temperature and pressure in active vent-sites, as well as the abundant life—active vent-sites are not being considered for mining operations either by licensing bodies or by the industry itself—rather, extinct or dormant fields are being explored for mining purposes. The SMS deposits on the NCS have proven resources of copper, zinc, and cobalt (Pedersen et al. 2021; Pedersen and Bjerkgård 2016).
Considering the vastly different properties of SMS deposits and ferromanganese crusts, the two categories of deposits will likely require different technology both for exploration and extraction.
Exploration
There is a growing body of literature addressing industrial concepts for exploration and extraction of marine minerals exemplified by Volkmann et al. (2018), Boomsma and Warnaars (2015) and Sharma (2017). The work presented here is informed by this literature—but it is considered more a point of reference rather than structural input to the model. Exploration and extraction sectors in the model are abstracted in accordance with findings from qualitative research and as such represent exploration and extraction as envisioned by experts and stakeholders.
Deep sea exploration for marine minerals is conceived in four consecutive steps where the geographic boundaries are reduced while the data resolution and geological certainty increase. In specific cases, there may be repetition of various steps. However, that is circumstantial operational details beyond the scope of the work presented here.
The first stage of exploration is conceived as regional exploration wherein relatively small and cost-efficient vessels with hull-mounted or towed echosounders, or other acoustic sensors, survey large areas in search of bathymetry or other geomorphological features indicative of SMS deposits.
Areas of high interest are identified based on the regional survey data. These areas are then explored further with autonomous underwater (AUV), or remotely operated vehicles (ROV) mobilized from larger, advanced multi-purpose vessels with a considerable technical crew onboard. AUVs or ROVs carry several acoustic, optical, and chemical sensors and operate relatively close to the seabed. The proximity to the seabed reduces the geographic footprint of multibeam-echosounders, synthetic aperture sonars, and other sensors—but high-resolution data on possible SMS deposits is collected. The swath and survey speed are strongly affecting the high-resolution survey efficiency. The industry leans towards utilizing several AUVs in simultaneous operation, thus increasing the geographic footprint per time of operation. To obtain the data resolution required, AUVs will fly at an altitude of about 30 m above seabed. At this flying-height, typical opening angles at dual-head Multi Beam Ecco Sounders (MBES) will allow a lateral swath of about 500 m and at a survey speed of about 1.3 knots. With several AUVs operating simultaneously, the aggregated swath is obviously increased. AUVs fitted with the relevant sensors can typically operate for about 60 h at 3000 m water depth—and with a charge, service, and data-download turnover of about 12 h. The AUVs are dependent on acoustic positioning signals from the surface vessel to maintain navigational integrity throughout the dive—and as such the number of AUVs being operated from one single surface vessel is limited, practically to three AUVs. ROVs are far less efficient—as well as less navigationally stable platforms for data retrieval and will most likely not be utilized widely for this purpose and is henceforth not represented in the aggregate model.
Based on high-resolution data, the final stage of SMS exploration involves retrieving core-samples from the prospective areas. Coring units, essentially remotely operated vehicles with drill-rigs attached, are mobilized to the same type of advanced subsea-vessels as utilized for high-resolution mapping and the seabed is sampled via 50–200-m-deep drill-cores. One single core will require about 48 h to retrieve, and several coring samples are needed to confirm the existence of commercial ore at a site and generate resource estimates.
Throughout the operation, the coring-unit will require assistance from a large work-class ROV for replacement of coring tubes, visual inspection, and general support. As such, a substantial offshore crew is required for coring operations. Geologists will then evaluate the mineral presence—or absence, in the prospect areas sampled, and potentially commence the process of obtaining licenses for extraction. Obtaining such a license will require an environmental impact assessment (EIA). EIA will require a broad-spectrum survey of the prospect area, including numerous sensors collecting a plethora of baseline data. Such environmental surveys are expected to be carried out from the same category of multi-purpose vessels as is chartered for high-resolution survey and coring operations.
Extraction
Extraction of marine minerals from SMS deposits has not yet been conducted with commercial success and the technology is not yet finalized. Nautilus pursued SMS extraction from the Solwara 1 field in the Bishmarck sea, but the company ran into financial and regulatory challenges and the plans were never realized (Childs 2020; Haugan and Levin 2019).
The SMS extraction sector in the model presented here is based on the insight retrieved from Rystad (2020), the participatory systems mapping, and the in-depth interviews—and it is conceived at an aggregate level. The model structure and parameterization are grounded in the Rystad report and calibrated based on insight from industry stakeholders and an up-to-date company budget. Jankowski et al. (2010) and Stanton and Yu (2010) also present data that is relevant for the extraction sector of the model. However, the latter two have not been used in the development of this model but are mentioned such that readers may investigate these sources if interested.
SMS extraction must necessarily include subsea units, ore-transportation equipment, surface operational, and processing platform and transport ships to retrieve ore from the seabed and bring it to shore. The subsea units in question will be relatively large units, capable of excavating ore from the seabed and loading the ore further onto some device for transporting the ore to the surface. Surfacing of ore will most likely be executed via mechanical lifting in skips or containers—or via a riser system utilizing heavy-duty pumps and piping. On the surface, the ore will be received and pre-processed, de-watered as a minimum, to some extent. This will happen onboard a large mining surface vessel, that also serves as the operating platform for subsea and water-column transportation unit—as well as loading unit for transport ships. Barges or transport-ships will bring the ore to shore for further processing and refinement.
Model
The model presented here is non-spatial and aggregates all discoveries from exploration and resources for extraction. This makes the model well-suited for aggregate studies such as this one, but inappropriate for disaggregate studies. The model is parameterized to study the processes of exploration and extraction of SMS deposits on the NCS, and its perceived resource and economic potential. However, the model can also be used to explore the processes of exploration and extraction of other marine mineral deposits elsewhere, as well as their potential, with alternative parameterization, modifications, and/or extensions.
The model has been set up in the system dynamics software STELLA Architect (Isee Systems 2022). This software can be used to build and run simulation models. It also has useful features for running Monte Carlo simulations and sensitivity analysis, both of which are used extensively in this study.
Figure 2 provides a simplified high-level overview of the model structure. This figure serves as a venture point for the following high-level presentation of the model. The full model description, which is complex but useful for gaining deep insight into the model, can be found in Appendix 1. The model has also been uploaded to a GITHUB repository, which can be accessed by anyone interested in making use of the model—that be directly or indirectly through alternative parameterization, modification, and/or extension (link will be provided upon acceptance of the paper).

Simplified high-level model overview
Overall, the model can be viewed as a collection of five sectors. The first sector, in the lower left of Fig. 2, gives a high-level overview of the exploration process. The second sector, in the upper left, outlines the exploration technology. The third sector, in the lower right, describes the mining process, while the fourth, in the middle right, outlines the mining technology. Finally, the fifth sector takes care of financial accounting.
The starting point for this model is that there exists a significant area that has yet to be explored for marine minerals (Prospect Area for Regional Survey in the lower left of Fig. 2). The initialization value of this stock represents a key initial value, and it is set to 80,000 km2 based on information from the respondents in the semi-structured interviews. There is suspicion, and even expectation, that there are several commercial mineral deposits in the initial area for regional survey, but exactly where and how much is unknown.
To find out where and how much mineral resources are available for commercially intended extraction, several steps must be taken to explore the area, starting out with regional surveys covering large areas using regional survey vessels (Committed Regional Survey Fleet in the top left of Fig. 2), before focusing on smaller areas and executing high-resolution mapping with ships that are appropriately equipped (Ships Committed to Hi-Res Survey in top left of Fig. 2), and then taking coring samples using the same ships but with other equipment (Ships committed to Coring in the top left of Fig. 2). Finally, before any area can be opened for extraction, an environmental impact assessment must be conducted using ships equipped with the same equipment used for the high-resolution mapping (Ships Committed to EIA in the top left of Fig. 2).
In each step along the chain of exploration steps, some areas are discarded as areas no longer interesting for further investigation or commercial extraction, accumulating in a stock of all areas that have been discarded (Discarded Area in the lower left of Fig. 2). In the real world, these areas could become subject to new or further investigation in some future. However, to reduce complexity, it is left outside the scope of this simulation model.
The proportions of area moving from one exploration step to the next, and thus not being discarded, are determined by lognormal distributed variables with given means (expectations) and standard deviations (perceptions of uncertainty), which then also implicitly determine how much is discarded. The means and standard deviations are based on information collected from the semi-structured interviews. The specifics and logic behind these important details can be found in Appendix 1. Whatever area going through the entire chain ends up being the area that is confirmed viable for commercial extraction (EIA Approved Area with Confirmed Ore in the lower left of Fig. 2).
To execute the exploration steps, it is necessary to acquire and commit the appropriate ships and equipment through investments and commission. All ships have constant unit build costs, build time, and lifetime, technical specifications, and day rates, which have been specified in accordance with written and numerical data, and in conference with interview subjects. The ship investments are defined as part of the capital expenditure (CAPEX) in the model. In addition, there are operational costs associated with the commission of the various ships and equipment. These costs are defined as part of the operational expenditure (OPEX). The specifics regarding ship unit build costs, build times, lifetime of ships, technical specifications, and day rates can be found in Appendix 1.
When an area with confirmed ore is approved after an environmental impact assessment, which we assume applies to all areas with confirmed ore, we move into the sector describing the mining process, in the lower right of Fig. 2. Based on the impact assessment approval rate of area with confirmed ore, and assumptions regarding the tons of ore per square kilometer, ore accumulates in what we define as the Commercial Mineral Stock.
The tons of ore per square kilometer is an important variable in this model. According to interview subjects, it is also one that bears a lot of uncertainty. In the model, the tons of ore per square kilometer is determined by a lognormal distributed variable with mean and standard deviation set in accordance with the expectations and perceptions of the interview subjects. The details on this can be found in Appendix 1. Finally, the discovered ore can be extracted using a mining fleet (Committed Mining Fleet in the middle right of Fig. 2).
To execute the mining process, it is necessary to acquire and commit mining units through investments and commission. The mining unit, which includes a surface platform, riser-system, subsea vehicles, logistical elements, and more, has constant unit build cost, build time, lifetime, technical specifications, and day rates which have been specified in accordance with written and numerical data, and in conference with interview subjects. The mining unit investments are defined as part of the capital expenditure (CAPEX) in the model. In addition, there are operational costs associated with the commission of mining units. These costs are defined as part of the operational expenditure (OPEX). The specifics regarding mining unit build costs, build times, lifetime of units, technical specifications, and day rates can be found in Appendix 1.
The revenue from the extraction process is calculated based on the employed mining fleet, production capacity per mining unit, and assumptions regarding the average ore grade, which determines the amount of pure minerals extracted per ton ore extracted and the weighted average price of its contents, the latter of which we treat as constant over time.
The average ore grade, which we here define as the percentage concentration of copper, zinc, and cobalt in the identified ore, is a key parameter in the model. The interview subjects have different opinions on what numerical value this parameter should take on. Specifically, the interview subjects from the industry report a higher expectation regarding mineral concentration than the interview subjects from the academic sphere, which perhaps one would expect. The industry players report expectations of mineral percentages of at least 5%, which is also the mineral percentage used by Rystad Energy (2020), while the academic interview subjects are more pessimistic, reporting an expectation of around 3%, given the specified number of tons of ore per square kilometer. In the concentrated mix, we assume 77.8% copper, 16.7% zinc, and 5.6% cobalt, based on intelligence from interview subjects.
While the expectations regarding mineral concentration differ between the interview subjects from industry and academia, there is consensus that the actual mineral concentration is uncertain, with the interview subjects from academia being more hesitant in specifying an expectation, which highlights the lack of information and consequential level of uncertainty at play—i.e., it would not be surprising if the mineral concentration is different from expectation given the assumption of tons of ore per square kilometer. To describe the differences in expectation, while also accounting for the uncertainty to some extent, we run simulations with different assumptions regarding the average mineral concentration in identified ore.
The net value and net discounted value can be calculated based on the CAPEX, OPEX, revenue, the discount rate, and time. Worth highlighting here is the use of a discount rate of 10%, somewhat lower than convention for lifecycle analyses in mineral economics, but somewhat higher than what is commonly used in other sectors. The mathematical descriptions of the calculations are relatively straightforward and can be found in Appendix 1.
A few more important things need mention before moving on to the simulation results. To run any simulation, a set of policies must be defined. How much should be invested in regional survey ships? How much should be invested in ships that can execute high-resolution surveys, coring, and EIAs? How much should be invested in ships that can execute the mining process? In the events of too few ships available for high-resolution survey, coring, and EIA, how should the allocation of ships be made? What activities should receive priority? These are all policy-related questions for which answers must be given to enable any simulation.
To keep things simple and practical, we define target shares of area covered per year per exploration activity and target production relative to the commercial mineral stock, which in turn play parts in the determination of the target outflows for the different stocks. These policy parameters are built into the model such that the investment behavior and commission behavior become target-seeking. Investments and commission will be made in attempt to reach the target shares and outflows. However, we also define two different ways in which this target-seeking behavior unfolds, and only one of them can be active at a time.
In what we refer to as the “Wait and See” policy setting, the industry makes investments and commit ships based only on current observations, with no concern for the anticipated future desired needs. That is, e.g., if there is no prospect area for coring at the current time, and no available ships for coring, then no investments will be made, even if there is a lot of prospect area undergoing high-resolution survey, and the future total desire for ships can be expected to be higher than the current total number of ships. That said, it also takes time from any build order is placed to that build order is completed, and it also takes some time, albeit not much, to commit a ship or mining unit to their respective activities. As such, this policy has the weakness of not being able to deliver exactly when the desire for commission arises. However, it has the strength of not taking on the risk of making any unnecessary investments, i.e., order ships that will not be needed in the immediate future after all, despite the expectations.
In what we refer to as the “Anticipatory” policy setting, the industry makes investments and commit ships and mining units based on current and anticipated future needs. That is, e.g., if there is no prospect area for coring at the current time, and no ships available for coring, but there are a lot of prospect area undergoing high-resolution survey, some of which is expected to qualify for coring after a certain amount of time, then investments will be made. As such, this policy has the advantage of being better than the wait and see policy at delivering capital as the desire for capital arises, given that the actual future need is close to the anticipation. However, consequently, it also has the weakness of risking unnecessary investment costs, which will occur when the future need is lower than the anticipated future need. Although excess ships may come of use later, the industry will still have taken costs earlier than desired under the assumption of perfect knowledge. If the excess ships were not built, or their orders were placed later in time, the present CAPEX value would have been reduced, and as such been cost saving.
In the model, there is no guarantee that the desired amount of capital committed to an activity will always be met. When it comes to the regional survey and the mining process, things are quite simple. If there is not enough available capital to satisfy the desire for capital for the respective activities, one must wait for more capital to become available through investment, and once that capital eventually is ready for commission, it will be committed to the respective activity if the desire for ships is still there. However, when it comes to the high-resolution surveys, coring, and EIAs, for which the same ships are used, albeit with different equipment and at different day rates, things get messier. If there is not enough capital to satisfy the total desired committed ships, then the activities must be prioritized. In the simulation model presented here, the activities are prioritized in reversed order of their placement in the exploration chain—as such, whatever exploration area and activity that is closer to generate a discovery, will get the highest priority, etc. This is perhaps not completely realistic in a competitive industry, yet it can be argued that it is a sensible approach for the industry as a whole—because the sooner revenue is generated, the better, since any delays will mean heavier discounted revenue.
To summarize, the model presented above describes the exploration and mining processes as well as the technologies and financial accounts associated with them. It also outlines the two sets of policies that are built in for simulation purposes. Regarding the policies, the reader should note that these policies are not the optimal policies, but rather practically oriented and simplistic policies derived from reason. Thus, it is very much possible that the economic potential of the industry could be higher with alternative policies, which is obviously something that could be interesting to consider in future studies. Altogether, the model including the policies allows simulation of the perceived and possible potential of the industry.
Baseline results
This study considers six main simulation scenarios. The scenarios differ from each other in terms of the assumptions regarding ore grade and in policy.
Ore grade or mineral concentration here refers to the average percentage of copper, zinc, and cobalt found in the prospect SMS deposits. Low concentration (3%) corresponds to the expectations or hypothesis expressed by experts and stakeholders from academia. It is expected that peer-reviewed resource estimates will be published early in 2023. The high concentration (5%) corresponds to what appears to be the consensus among experts and stakeholders from the industrial domain. This concentration is also referred to in a report by Rystad Energy (2020) which appears to have been influential among the industrial stakeholders.
There are two different sets of policies: “Wait and See” and “Anticipatory.” The “Wait and See” policy assumes a risk averse agent that will not invest in extraction capital until a certain level of mineral stock is confirmed via exploration. The “Anticipatory” policy represents a more proactive agent—choosing to invest in extraction capital at an earlier stage of exploration—and as such betting on sufficient minerals for commercially viable extraction being identified.
The results presented are the average values across 1000 Monte Carlo runs where four stochastic seed variables are assigned varying values. The seed variables relate to the percentages of area moving through the exploration chain and the tons of ore per square kilometer per discovery (see Appendix 1 for further details). The baseline results are shown in Table 1.
The simulation results reveal an interesting range for expected total extraction. With a low estimate of 1.8 million tons of copper, zinc, and cobalt, up to a high estimate of 3 million tons—there is an implicit range of net present value straddling a negative value of 970 million USD up to a positive value of 2.53 billion USD.
As mentioned above, interviewed experts from academia expect a mineral concentration of approximately 3%—this is based on informed assumptions regarding tons of ore per square kilometer. Given a discount rate of 10%, the simulation results indicate that the industry will not be profitable if these assumptions are correct. Industry experts and stakeholders, on the other hand, expect an ore grade of 5%. This condition allows for a profitable industry yielding net present values between 1.33 and 2.53 billion USD. Should the actual ore grade lies between the low and the high scenario—a profitable industry is to be expected, with a net present value ranging between 170 million USD and 780 million USD.
The non-discounted net value is positive for all scenarios, yet the net present value is not. This is an important observation as it points to a key challenge for the SMS exploration and extraction industry on the NCS, namely high exploration cost, and a significant delay between exploration and mined minerals entering the commodity market. Non-discounted revenue is high relative to non-discounted cost—yet the discounted revenue contracts considerably more than discounted cost on account of the long time passing between the early exploration phase and extracted minerals generating revenue.
In the low ore-grade scenario, the “Wait and See” and “Anticipatory” policies perform similarly in terms of net present value. However, the “Anticipatory” policy performs significantly better than the “Wait and See” policy in both medium and high ore-grade scenarios. This is a result of several factors. First, the “Anticipatory” policy commences acquisition of exploration and extraction capital sooner—and is henceforth able to bring minerals to market sooner. Revenue is thus not discounted as hard as in the alternative “Wait and See” policy. Second, the “Wait and See” policy will in its risk averse design accumulates a larger discovered mineral stock before commencing investment in extraction capital. The initially passive approach will then be aggressively compensated once mineral discoveries pass through the exploration phases and start accumulating. The latter as the delayed reaction of the “Wait and See” policy generates a much higher accumulated mineral stock, which in turn requires more production capability to meet target production relative to the mineral stock. Although this cannot be ascertained from the table above, this observation is important as it indicates that the “Wait and See” policy designed for the purpose of this study, in fact will generate an overcapacity problem once mineral stocks starts to deplete.
Figure 3 shows an overview of a random selection of Monte Carlo runs in the medium ore-grade scenario with the “Wait and See” and “Anticipatory” policies. These results indicate that even though positive discounted profits for these scenarios are expected, as shown in Table 1, it is possible that a negative net present value will be the case, on account of random chance. Considering the vast uncertainty inherent to this domain—this is an important observation.

Discounted profit trajectories over a random selection of Monte Carlo runs in the medium average ore-grade scenario with the “Wait and See” policy (left) and the “Anticipatory” policy (right)
Figure 4 shows the anticipated fleet sizes of multi-purpose offshore vessels required for exploration and for deep-sea mining vessels in the medium ore-grade and “Anticipatory” scenarios. The figure shows the trajectories in a random selection of Monte Carlo runs. The variance between these scenarios is significant—where the largest simulated fleet sizes are more than twice as large as the lowest scenarios. In terms of invested capital such difference is obviously significant—and will have considerable effects for the Norwegian shipping industry as well as associated industries.

Total ships and mining units trajectories over a random selection of Monte Carlo runs in the medium average ore-grade scenario with the “Anticipatory” policy
Sensitivity analysis
Simulation of SMS exploration and extraction on the NCS is subject to a vast number of uncertainties. This is acknowledged by stakeholders and experts across academia, industry, and public policy. The uncertainties apply to nearly all aspects of the emerging industry, which makes sensitivity analysis crucial.
There are several elements in the model that can be tested for sensitivity to enhance the understanding of these underlying uncertainties and henceforth possible development trajectories of this evolving industry. This includes, for example, changes in the discount rate; the geological resource base—because it is poorly explored; the cost of extraction—because the technology is not yet fully mature; and the future price of minerals—because the growth, electrification, and geopolitical turmoil are projected to increase demand for minerals (Boomsma and Warnaars 2015; Haugan and Levin 2019; International Energy Agency (IEA) 2021; Kaluza et al. 2018; NPD 2021; Petersen et al. 2016; Ragnarsdóttir 2008).
Although the study presented here includes sensitivity analysis of several different variables and parameters ranging between technology, resource base, commercial dimensions, and policy dimensions, it is limited to four tests, namely changes in the discount rate, expected tons of ore per square km, extraction cost, and weighted average price of pre-processed mineral content. The model in its entirety is made available in a GITHUB repository, and the interested reader is encouraged to further explore sensitivity and the model in general (Bang and Trellevik 2022a).
Tables 2, 3, 4, and 5 show the results of the four sensitivity tests included in this study. The differences from the base line results are presented in square brackets.
Rystad Energy (2020) and interviewed stakeholders and experts unanimously provide a 10% discount rate as basis for their assessment and analysis. Thus, the baseline scenario in this study applies a discount rate of 10%. However, during the qualitative research phase of this study, analogies from the offshore oil and gas sector were frequently brought up as highly relevant for the marine mineral sector. In the offshore oil and gas industry, a discount rate of 15% is commonly applied for deep water projects (Wood Mackenzie 2018). It is henceforth interesting to simulate the economic potential in terms of net present value with a higher discount rate—and perhaps particularly with a discount rate of 15%. The results in Table 2 indicate that the discount rate is important, indeed—with a discount rate of 15% and all else equal, the high ore-grade and “Anticipatory” policy scenarios are the only scenarios generating a positive net present value. In the baseline scenario, with a discount rate of 10%, all scenarios for medium and high ore grades yield positive results. This is explained by revenue being generated at a late stage while costs start accruing during the initial exploration phases—thus, net present value is heavily reduced by discounting.
The mineral resource base of SMS deposits on the NCS is highly uncertain as it is yet poorly explored. To reflect the uncertainty tied to tons of ore per square kilometers, this was included in the model as a random stochastic variable. However, considering the extent to which this uncertainty is pronounced by the interviewed stakeholder and experts—sensitivity towards the mean expectation of this stochastic variable was also tested. As clearly indicated in Table 3, a 25% reduction of this mean value significantly reduces both total extraction and net present value. Only the high ore-grade scenarios yield positive net present value under this condition.
As the actual SMS mineral extraction technology has yet to be built and tested, extraction cost is clearly uncertain. Interview subjects broadly refer to similar technologies developed within offshore oil and gas, and studies and estimates for extraction costs have been carried by stakeholders within the emerging industry. Nevertheless, sensitivity towards extraction cost is interesting all the time; there is no empirical evidence of actual extraction cost. Therefore, we test the sensitivity of the baseline results to a 10% increase of extraction costs. However, the reader should note that higher costs could also occur.
Unsurprisingly, a 10% increase of extraction cost is reflected, in the total mining CAPEX across all scenarios. The “Wait and See” policy generates relatively higher mining CAPEX than the “Anticipatory” policy. This can be accredited to the policy design in which the “Wait and See” policy is initially passive while the mineral stock accumulates—and then aggressively invests mining capital. Positive net present value is still evident for both high ore grade and the “Anticipatory” policy in the medium ore-grade scenarios.
Naturally, an increase of 10% of the weighted average price of mineral content increases the net present value across all scenarios. The weighted average price of mineral content is a variable where the price of copper, zinc, and cobalt is weighted in the bulk price according to their proportion of the ore. Interestingly, the increased price does not tip the low ore-grade scenarios into a positive net present value, yet the losses are reduced. In the low ore-grade scenarios, as in the mid and high ore-grade scenarios, the total revenue is increased—but clearly not sufficiently to yield a profit after discounting.
Discussion
This is inherently a future study and as such, there is no empirical data towards which the simulation model—or the results and analysis it affords can be tested. Rather, the model can conceptually be conceived as a theory, grounded in the perspectives, knowledge, expectations, and perceptions iteratively elicited from stakeholders and experts involved in all domains and areas of the emerging SMS exploration and extraction industry on the Norwegian continental shelf (Kopainsky and Luna-Reyes 2008; Repenning 2002).
As a theory, the model is tested and validated in terms of structure, parameterization, and in terms of mathematical integrity—and as such it enables simulation and analysis of possible future development trajectories (Barlas 1996; Barlas and Carpenter 1990). As the availability of empirical data for many parameters and structural elements is non-existent and the uncertainty is significant, also among participating experts and stakeholders—the model does not claim to produce accurate predictions. Rather, it explores possible outcomes, based on existing knowledge, expectations, perceptions, and perspectives of stakeholders engaged in the domain and in this study. Although probably inaccurate, this is valuable as it reveals something about the range of expectations and perceptions, which forms the basis of commercial decision- and public policy-making today. Henceforth, although elements of the model may have misrepresentations only evident once the future materializes, the model is still useful.
Zeckhauser (2010) argues that “..clear thinking about UU [uncertain and unknowable] situations, which includes prior diagnosis of their elements, and relevant practice with simulated situations, may vastly improve investment decisions where UU events are involved. If they do improve, such clear thinking will yield substantial benefits.” Based on the perspective that “structure generates behavior,” the authors argue that the synthesis of the elicited expert and stakeholder knowledge, expectations, and perceptions afford clear thinking on how and when the SMS exploration and extraction industry on the NCS can unfold (Forrester 1987; Lane and Oliva 1998). It does so, as current knowledge, expectations, and perceptions form the scaffolding on which this industry is mobilized.
There are two sets of policies governing behavior in the model. The “Wait and See” policy is a risk-averse policy wherein the agent postpones investment in exploration and extraction capital until the demand for such capital occurs—at which point the agent invests to meet a fixed targets for exploration and extraction. This has the effect that investment occurs later in time—and when they do occur—they will be aggressive. In several scenarios, this policy will therefore invest into over-capacity. The “Anticipatory” set of policies commences investment at an earlier stage—and is henceforth less risk averse. This infers a bet being made —as investment decisions are made with limited confidence in the actual resource base. Generally, the “Anticipatory” policy setting performs well across simulations.
The study clearly indicates that a major challenge for the emerging industry is the extensive time between initial investments and generation of revenue. Until minerals are offloaded onshore, the entire endeavor has only accrued cost. The inhospitable and nearly inaccessible working environment of ultra-deep water at arctic latitudes, as well as the required data resolution and ground truthing of a largely unexplored and geographically significant area, makes exploration a considerable cost. Moreover, the time required to acquire extraction licenses, and to develop and mobilize extraction technology means that a significant amount of time will pass from initial investment until revenue is generated. As such, the revenue from mineral extraction will be heavily discounted when compared to many of the investments. Sensitivity analysis shows that an increase from 10 to 15% discounting renders all but the high ore-grade “Anticipatory” scenario a futile investment with negative net present value. As discussed above, the high ore-grade scenario represents the most optimistic view on the geological resources available. From this, it may be argued that it is of importance to reduce the time lag between exploration and extraction if this industry at all is to materialize.
Coring operations constitute a substantial driver for the high exploration cost. Geophysical methods, tailored to identify and quantify mineralization in prospect deposits may reduce aggregated exploration cost significantly by reducing the amount of coring needed as well as the time required for coring. It may well also expediate the rate of exploration by expanding operational seasons and increasing the number of units in operation simultaneously. Both remotely operated surveys and geophysical qualification of deposits would be favorable for the extraction industry exposed to considerable discounting due to high exploration cost and long lead time between exploration and extraction.
The model is relatively explicit and detailed in the abstraction of the exploration phase and the involved exploration technology. The model does however not account for technological shifts within exploration technology or operational modus operandi. An element in this respect is the potential of remotely operated, and autonomous survey capability. This is an area reported by experts to be attracting much attention now—and it has the potential to reduce the need for large multipurpose vessels, and thereby the aggregated exploration cost. When examining the utilization of multipurpose vessels for high-resolution survey in the model, this is a miniscule portion of the aggregated exploration cost. Efforts towards reducing cost of high-resolution survey by way of autonomous or remotely operated survey platforms may henceforth not be pivotal for marine minerals exploration. It may however expediate the rate of initial exploration by expanding operational seasons and increasing the number of units in operation simultaneously and thereby offer the industry more data, sooner, which could be important for profitability. Operationally, this could provide a level of de-risking of further exploration decisions for the individual company and as such merit continued attention by the industry.
There is uncertainty regarding the tons of minerals per square kilometers. Where participating experts from academia argues ore-grades around 3%, the more optimistic industrial stakeholders suggest ore grades around 5%. In the baseline scenarios, the low ore-grade settings yield negative net present value irrespective of investment policy, while both the medium and high ore grades return positive results for both sets of policies. The results are sensitive to a 25% reduction across ore grades, and under these conditions, the “Wait and See” policy in the medium ore-grade scenario transforms from a positive to a negative net present value while the profits are reduced across all scenarios. It is self-evident that the viability of this industry is highly dependent on the actual mineral content of the SMS deposits, yet it is an important insight that the industry projections are highly sensitive to this fraction. Considering the meager knowledge available on mineral concentration in SMS deposits on the NCS, this presents a challenge—as exploration is required to provide sufficient data for sensible decisions, yet the effect of discounting strongly discourages extensive exploration before committing to extraction. A bet with uncertain or even unknown odds may be required.
The model is also sensitive towards the cost of extraction, which is another element of uncertainty as the technology has yet to be built. A 10% increase in extraction cost reduces net present value across scenarios with approximately 20% in the “Anticipatory” and 26% in the “Wait and See” policy condition. As such, these conditions will tip the medium ore-grade, “Wait and See” scenario negative in terms of net present value. Again, discounting reduces the revenue of the stock while the extraction cost occurs closer to revenue generation and is exposed to less discounting, and an increase here will henceforth have a larger effect. The higher impact on “Wait and See policies is explained by the design of this set of policies, where investment in extraction technology is postponed. This may suggest that speeding up exploration may have its merits—as does commencing with investment in extraction capital at an earlier stage.
The price of minerals will obviously influence the viability of the marine mineral industry in general. As expected, a 10% increase of the weighted average price of minerals increases the net present value across all scenarios. Notably though, this price increase does not generate positive net present values for the low ore-grade scenarios in the simulation model—and although the results are better relative to the baseline scenarios—it suggests that even higher mineral prices would be required for this industry to be profitable, all else equal. That on the other hand, may not be unfeasible considering general economic growth, electrification, and geopolitical supply side stability potentially increasing demand, (Kalantzakos 2020; Kaluza et al. 2018; NPD 2021; Ragnarsdóttir 2008).
At a less aggregated level, the model offers encouraging insights to the existing offshore service and subsea industries in Norway. Should indeed the exploration and extraction of SMS deposits on the Norwegian continental shelf commence—it will, according to all participating experts and stakeholders, require vessels, engineering, yardwork, subsea services, and more. In terms of multipurpose offshore vessels alone, a considerable proportion of vessels currently utilized within oil and gas potentially could find future charter in marine minerals exploration. Multipurpose vessels expected to be relevant for the AUV, coring, and environmental assessment operations embedded in the model, are relatively large ships, around 100 m, with large cranes, several subsea robots and other equipment, and a crew of 50–100 people onboard. The requirement for these vessels ranges between approximately 20 and 55 vessels over a 15-year time period. These vessels would have to be supported onshore by management, engineering, and logistical teams, and they would most likely have to be retrofitted with ice-class and deep-water equipment. Altogether, this constitutes significant activity in the Norwegian offshore fleet. The larger, and probably less versatile mining vessels will have a limited period in which they are in large demand. However, also the extraction phase will require considerable onshore support and constitute a significant element of the aggregated Norwegian offshore activity. These vessels are considerable investments, likely to outlive the high-demand period depreciation wise, long-term investors would probably consider opportunities beyond the Norwegian continental shelf once the peak-demand wanes. The latter is obviously a possibility for ships—able to relocate to other markets as they become available and attractive.
Conclusion
This study provides three contributions. First, it presents a structural synthesis of an emerging marine SMS exploration and extraction industry in Norway. Second, it provides a range for the expected resource potential. Third, it provides a range for the expected economic potential. The structural synthesis, as well as expected resource- and economic potential is drawn from the knowledge, expectations, and perceptions of experts and stakeholders embedded in this evolving system.
We present a system dynamics model based on a comprehensive quantitative and qualitative approach which taps into numerical, written, and mental databases. The model abstracts and synthesizes the expertise—the tacit and formally qualified knowledge, expectations, and perceptions of experts and stakeholders involved in different fields of the emerging marine minerals industry in Norway. The experts and stakeholders are representatives from academia, regulatory bodies, and different levels of private enterprise.
The model is simulated across six main scenarios wherein low, medium, and high ore grades are extracted as dictated by either a “Wait and See” or an “Anticipatory” set of policies. The study also tests the sensitivity of the results to changes in various factors.
The simulation results reveal a range of possible outcomes—in which the exploration and extraction of marine minerals from SMS deposits on the Norwegian continental shelf may present negative net present value—or a positive net present value.
The model results prove sensitive to the settings regarding mineral concentration. Where academic participants indicate ore grades around 3%, industry participants suggest concentrations around 5%. All else equal, if the academic participants are correctly assessing the mineral resource, the emerging industry is not expected to be profitable with today’s technology—while for ore grades between academia’s estimate and those of the industry, the industry is expected to be profitable with today’s technology.
The considerable cost of exploration and long period indicated between early exploration and extracted minerals brought to market, suggest that the costs associated with exploration is a central concern for the emerging industry. Technology, regulation, and incentives may alleviate this challenge—and prove pivotal if indeed the ore grade of Norwegian SMS is around 3%. Cost of extraction is also a challenge—coupled with a passive investment policy, an underestimated cost of extraction may render otherwise profitable scenarios at a loss. The weighted average price of minerals is important—it would require price increases well above 10% to render low ore-grade scenarios with a profit. This may however be a likely scenario in lieu of macroeconomic development and geopolitical environment.
We consider the fact that the expected NPV values span negative and positive values an interesting and important finding because it highlights a discrepancy between academic and industrial expectations among the participants in the study. Moreover, it highlights that it is not given that this will be a profitable adventure with today’s technology. There are at least two good reasons for highlighting and communicating these findings:
First, there is currently tendencies of a DSM frenzy in Norway. For reference: there is a 1000 billion NOK revenue estimate which has been put forward in Norwegian media without much talk about the costs of this endeavor (Sævik 2022). Although this revenue estimate is not far from that expected by the industry (considering we exclude value added from processing), our study highlights that high value in terms of revenue does not necessarily mean high net present value—this is an important reminder. Moreover, there are talks in media and the industry about DSM potentially being the “new oil” for Norway (Energi24.no 2021). At the same time, there is currently little that points towards this emerging SMS industry coming near to that—even when doing simulations based on industry knowledge, expectations, and perceptions. To put this in perspective, our best-case baseline scenario indicates a total revenue of about 570 billion NOK (excluding value added from processing) over the simulated time horizon. That is less than that of a year worth of Norwegian oil and gas exports, which totaled at 832 billion NOK in 2021, and expected significantly higher in 2022 due to increased prices for oil and gas (Norsk Petroleum 2022).
Second, we believe that our results can be constructive for the industry in the sense that they suggest where it can be worthwhile to put in innovation efforts—for example, we show that one of the main challenges for the DSM industry on the NCS is high costs associated with coring. As such, it could be clever to put in innovation efforts to reduce the amount of coring needed. For example, one could imagine that innovative geophysical methods, AUV, and sensor technology could contribute to reduce the amount of coring needed to identify resources and thereby reduce costs. We think such insight can be particularly interesting and valuable for the technology companies aiming to take part in the emerging industry.
If the industry indeed manifests, it will generate significant activity in the offshore service and subsea industry traditionally engaged in the offshore oil and gas sector. Considering the challenges, the limited knowledge about the resources, the harsh operational environment, the high cost of exploration, and considerable lag between initial exploration and minerals being landed onshore, there is an open space for innovation and technological improvement—geophysical methods, remotely operated, and autonomous technology may as such be a key to unlocking a profitable SMS mining industry on the NCS.
Notes
This estimate is a simple summary of public and private spending on marine minerals surveying expeditions, business incubation grants, technology development, and acquisitions as disclosed by experts and stakeholders participating in the study—as well as investments made in marine mineral companies recently established in Norway. All underlying information for this estimate is publicly available. The estimate is conservative as it does not account for spending not made publicly available such as R&D spending in the private sphere.
Please see Appendix 2 for anonymized stakeholder overview.
References
Andersen DL, Luna-Reyes LF, Diker VG, Black L, Rich E, Andersen DF (2012) The disconfirmatory interview as a strategy for the assessment of system dynamics models. Syst Dyn Rev 28(3):255–275. https://doi.org/10.1002/sdr.1479
Bang RN, Trellevik LKL (2022a) Bang-Trellevik-NCS-DSM-Model. Retrieved from GitHub website: https://github.com/RasmusNossBang/Bang-Trellevik-NCS-DSM-Model?fbclid=IwAR23jUqZ_sc5VxHpthXe510yDu5jM6jxDK15DvlV6oTmyBBlJGILqBy9p5s
Bang RN, Trellevik LKL (2022b) Reserve-dependent capital efficiency, cross-sector competition and mineral security considerations in mineral industry transition. Mineral Economics.
Barlas Y (1996) Formal aspects of model validity and validation in system dynamics. Syst Dynam Rev 12(3):183–210
Barlas Y, Carpenter S (1990) Philosophical roots of model validation: two paradigms. Syst Dyn Rev 6(2):148–166. https://doi.org/10.1002/sdr.4260060203
Boomsma W, Warnaars J (2015). Blue Mining. https://doi.org/10.1109/ut.2015.7108296
Childs J (2020) Extraction in four dimensions: time, space and the emerging geo(-)politics of deep-sea mining. Geopolitics 25(1):189–213. https://doi.org/10.1080/14650045.2018.1465041
Energi24.no. (2021) Er mineraler på sokkelen den nye oljen? Retrieved from https://energi24.no/nyheter/er-mineraler-pa-sokkelen-den-nye-oljen. Accessed 27 June 2022
Ford DN, Sterman JD (1998) Expert knowledge elicitation to improve formal and mental models. Syst Dyn Rev 14(4):309–340. https://doi.org/10.1002/(SICI)1099-1727(199824)14:4%3c309::AID-SDR154%3e3.0.CO;2-5
Forrester JW (1987) Lessons from system dynamics modeling. Syst Dyn Rev 3(2):136–149. https://doi.org/10.1002/sdr.4260030205
Forrester JW (2007) System dynamics — the next fifty years. Syst Dynam Rev 23(2):359–370. https://doi.org/10.1002/sdr
Forrester JW (1992) Policies, decisions and information sources for modeling. Eur J Oper Res 59(1):42–63
Haugan PM, Levin LA (2019) What role for renewable energy and deep-seabed minerals in a sustainable future? Retrieved from www.oceanpanel.org/blue-papers/ocean-energy-and-mineral-sources. Accessed 27 June 2022
Hein JR, Mizell K, Koschinsky A, Conrad TA (2013) Deep-ocean mineral deposits as a source of critical metals for high- and green-technology applications: comparison with land-based resources. Ore Geol Rev 51:1–14. https://doi.org/10.1016/j.oregeorev.2012.12.001
Hovmand PS, Andersen DF, Rouwette E, Richardson GP, Rux K, Calhoun A (2012) Group model-building “scripts” as a collaborative planning tool. Syst Res Behav Sci 29(2):179–193. https://doi.org/10.1002/sres.2105
Hyman J, Stewart RA, Sahin O, Clarke M, Clark MR (2022) Visioning a framework for effective environmental management of deep-sea polymetallic nodule mining: drivers, barriers, and enablers. Journal of Cleaner Production 337:130487. https://doi.org/10.1016/j.jclepro.2022.130487
International Energy Agency (IEA) (2021) The Role of Critical Minerals in Clean Energy Transitions. IEA Publications. Retrieved from https://www.iea.org/reports/the-role-of-critical-minerals-in-clean-energy-transitions
Isee Systems (2022) Stella Achitect. Retrieved June 15, 2022, from https://www.iseesystems.com/store/products/stella-architect.aspx
Jankowski P, Heymann E, Chwastiak P, See A, Munro P, Lipton I (2010) Offshore Production System Definition and Cost Study. Prepared for Nautilus Minerals. In: Nautilus Minerals, vol 1. Retrieved from https://actnowpng.org/sites/default/files/Solwara1ProductionSystemDefinitionandCostStudy2010.pdf
Kalantzakos S (2020) the race for critical minerals in an era of geopolitical realignments. Int Spect 55(3):1–16. https://doi.org/10.1080/03932729.2020.1786926
Kaluza A, Lindow K, Stark R (2018) Investigating challenges of a sustainable use of marine mineral resources. Proc Manuf 21(2017):321–328. https://doi.org/10.1016/j.promfg.2018.02.127
Kopainsky B, Luna-Reyes LF (2008) Closing the loop: promoting synergies with other theory building approaches to improve system dynamics practice. Syst Res Behav Sci 25(4):471–486. https://doi.org/10.1002/sres.913
Lane DC, Oliva R (1998) The greater whole : towards a synthesis of system dynamics and soft systems methodology on a resurgence of management simulations and games. Eur J Oper Res 107(97):214–235
Luna-Reyes LF, Andersen DL (2003) Collecting and analyzing qualitative data for system dynamics: methods and models. Syst Dyn Rev 19(4):271–296. https://doi.org/10.1002/sdr.280
Lusty PAJ, Murton BJ (2018) Deep-ocean mineral deposits: metal resources and windows into earth processes. Elements 14(5):301–306. https://doi.org/10.2138/gselements.14.5.301
Ministry of Petroleum and Energy (2021) Åpningsprosess for undersøkelse og utvinning av havbunnsmineraler på norsk kontinentalsokkel Forslag til program for konsekvensutredning etter havbunnsmineralloven. Retrieved from https://www.regjeringen.no/contentassets/a3dd0ce426a14e25abd8b55154f34f20/forslag-til-konsekvensutredningsprogram-l1205562.pdf
Norsk Petroleum (2022) EKSPORT AV OLJE OG GASS. Retrieved August 31, 2022, from https://www.norskpetroleum.no/produksjon-og-eksport/eksport-av-olje-og-gass/
Norwegian Petroleum Directorate (NPD) (2021) Deep Sea Minerals on the Norwegian Continental Shelf–Developments in Exploration. Retrieved from https://www.npd.no/globalassets/1-npd/fakta/havbunnsmineraler/presentation-deep-sea-minerals-developments-in-exploration-harald-brekke-with-
Pedersen, Rolf B, Olsen BR, Barreyre T, Bjerga A, Eilertsen MH, Haflidason H, …, Tandberg AHS (2021) Fagutredning mineralressurser i norskehavet - landskapstrekk, naturtyper og bentiske økosystemer. Retrieved from https://www.npd.no/globalassets/1-npd/fakta/havbunnsmineraler/fagutredning-mineralressurser-norskehavet-naturforhold-uib.pdf. Accessed 27 June 2022
Pedersen RB, Thorseth IH, Nygard TE, Lilley MD, Kelley DS (2010) Hydrothermal activity at the Arctic mid-ocean ridges. Wash DC Am Geophys Union Geophys Monogr Ser 188:67–89. https://doi.org/10.1029/2008GM000783
Pedersen RB, Bjerkgård T (2016) Seafloor massive sulphides in Arctic waters. In: Mineral Resources in The Arctic. pp 209–216. Retrieved from https://www.ngu.no/upload/Aktuelt/CircumArtic/5_SMS.pdf
Petersen S, Krätschell A, Augustin N, Jamieson J, Hein JR, Hannington MD (2016) News from the seabed – geological characteristics and resource potential of deep-sea mineral resources. Mar Policy 70:175–187. https://doi.org/10.1016/j.marpol.2016.03.012
Ragnarsdóttir KV (2008) Rare metals getting rarer. Nat Geosci 1(11):720–721. https://doi.org/10.1038/ngeo302
Regjeringen.no (2021) Retrieved April 20, 2022, from Official pages of the Norwegian Government website: https://www.regjeringen.no/no/tema/energi/havbunnsmineraler/id2664074/. Accessed 27 June 2022
Repenning NP (2002) A simulation-based approach to understanding the dynamics of innovation implementation. Organ Sci 13(2):109–127. https://doi.org/10.1287/orsc.13.2.109.535
Energy Rystad (2020) Marine minerals - Norwegian value creation potential. Mar Miner. https://doi.org/10.1515/9781501508646
Sævik R (2022) En ny næring verdt 1000 milliarder – på havbunnen. E24. Retrieved from https://e24.no/det-groenne-skiftet/i/L56jEQ/en-ny-naering-verdt-1000-milliarder-paa-havbunnen. Accessed 27 June 2022
Sharma R (2017) Deep-sea mining resource potential. In: Sha R (ed) Technical and Environmental Considerations. Retrieved from https://link.springer.com/content/pdf/10.1007/978-3-319-52557-0.pdf
Sparenberg O (2019) A historical perspective on deep-sea mining for manganese nodules, 1965–2019. Ext Ind Soc 6(3):842–854. https://doi.org/10.1016/j.exis.2019.04.001
Stanton P, Yu A (2010) Interim use of API codes for the design of dynamic riser systems for the deepsea mining industry. In: Proceedings of the 29th International Conference on Ocean, Offshore and Arctic Engineering. Shanghai, China, pp 6–11. OMAE2010-20189
Sterman JD (2002) All models are wrong: reflections on becoming a systems scientist. Syst Dyn Rev 18(4):501–531. https://doi.org/10.1002/sdr.261
Toro N, Robles P, Jeldres RI (2020) Seabed mineral resources, an alternative for the future of renewable energy: a critical review. Ore Geol Rev 126(June):103699. https://doi.org/10.1016/j.oregeorev.2020.103699
United States Geological Survey (USGS) (2020) Mineral commodity summaries 2020. In: U.S Departtment OF The Interior, U.S Geological Survey. Retrieved from https://pubs.usgs.gov/periodicals/mcs2020/mcs2020.pdf. Accessed 27 June 2022
Vidal O, Rostom FZ, François C, Giraud G (2019) Prey-predator long-term modeling of copper reserves, production, recycling, price, and cost of production. Environ Sci Technol 53(19):11323–11336. https://doi.org/10.1021/acs.est.9b03883
Videira N, Antunes P, Santos R, Lopes R (2010) A participatory modelling approach to support integrated sustainability assessment processes. Syst Res Behav Sci 27(4):446–460. https://doi.org/10.1002/sres.1041
Volkmann SE, Kuhn T, Lehnen F, Kuhn T (2018) A comprehensive approach for a techno-economic assessment of nodule mining in the deep sea. Miner Econ 31:319–336
Volkmann SE, Lehnen F (2018) Production key figures for planning the mining of manganese nodules. Mar Georesour Geotechnol 36(3):360–375. https://doi.org/10.1080/1064119X.2017.1319448
Watari T, McLellan BC, Giurco D, Dominish E, Yamasue E, Nansai K (2019) Total material requirement for the global energy transition to 2050: a focus on transport and electricity. Resour Conserv Recycl 148(May):91–103. https://doi.org/10.1016/j.resconrec.2019.05.015
Watzel R, Rühlemann C, Vink A (2020) Mining mineral resources from the seabed: opportunities and challenges. Mar Policy 114(February):103828. https://doi.org/10.1016/j.marpol.2020.103828
Wilkerson B, Trellevik LKL (2021) Sustainability-oriented innovation: improving problem definition through combined design thinking and systems mapping approaches. Thinking Skills and Creativity 42(May):100932. https://doi.org/10.1016/j.tsc.2021.100932
Wood Mackenzie (2018) Wood Mackenzie ’ s second ‘ State of the Upstream Industry ’ survey The key messages on industry performance and investment are largely unchanged since 2017 How is the 2018 survey different ? Digitalisation Energy transition Over 60 % of respondents feel
Zeckhauser RJ (2010) Investing in the unknown and unknowable. Capital Soc 1(2):304–346. https://doi.org/10.1515/9781400835287-016
Acknowledgements
The authors thank all experts and stakeholders that have contributed to this study through participation in the group model-building session and in-depth interviews. The authors also thank Professor Birgit Kopainsky, System Dynamics Group, Department of Geography, University of Bergen, Professor Stein Ivar Steinshamn, Department of Business and Management Science, Norwegian School of Economics, and Professor Rolf B. Pedersen, Department of Earth Science and Centre for Deep Sea Research, University of Bergen, for discussions and advice throughout the project.
Funding
Open access funding provided by University of Bergen (incl Haukeland University Hospital)
Author information
Authors and Affiliations
Corresponding author
Ethics declarations
Conflict of interest
The authors have contributed to the project on equal terms as 50/50 co-authors. The authors have no financial or non-financial interests that are directly related to the work submitted for publication. The author, Lars-Kristian Trellevik, who has 15 years of onshore and offshore industry experience with deep water subsea operations, works as an external technical consultant for a company that aims to take part in the potential future marine mineral industry in Norway.
Additional information
Publisher's note
Springer Nature remains neutral with regard to jurisdictional claims in published maps and institutional affiliations.
Appendices
Appendix 1
Detailed model description
Detailed stock-and-flow diagrams for the exploration process and exploration technology
Figure 5

Stock-and-flow diagram of the exploration process
Figure 6

Stock-and-flow diagram for regional survey capital structure
Figure 7

Stock-and-flow diagram for Hi-Res, coring, and EIA capital structure
Detailed SFD for the mining process and mining technology
Figure 8

Stock-and-flow diagram for the mining process and technology
Mathematical model description
NOTE REGARDING THE UNITS OF THE VARIABLES AND PARAMETERS IN THE MODEL All variables and parameters directly relating to area are measured in square kilometers. All variables and parameters directly relating to weight is measured in million tons. All variables and parameters directly relating to monetary value is measured in US dollars. All variables and parameters directly related to time are measured in years | |||
|---|---|---|---|
Regional survey | |||
Variables and parameters | Equations | Properties | Comments |
PROSPECT_AREA_FOR_REGIONAL_SURVEY(t) | PROSPECT_AREA_FOR_REGIONAL_SURVEY(t—dt) + (—REGIONAL_SURVEY_RATE) * dt | INIT PROSPECT_AREA_FOR_REGIONAL_SURVEY = 80,000 | The prospect area for regional survey is determined by the size of the stock in the previous time step subtracted whatever area is moved to regional survey through the previous time step |
The initial prospect area for regional survey is set to 80,000 square kilometers, which is an approximate estimate on the area that could be interesting for exploration. This value was agreed upon by several of the experts that have been interviewed for this study | |||
REGIONAL_SURVEY_RATE | MIN(SHIPS_COMMITTED_TO_REGIONAL_SURVEY* “REGIONAL_SURVEY_SHIP_KM2/YEAR”; PROSPECT_AREA_FOR_REGIONAL_SURVEY) | The regional survey rate is determined by the product of the number of ships committed to regional survey and the area covered by such a ship per year. If the capacity exceeds the available area, then only the available area will be surveyed | |
“REGIONAL_SURVEY_SHIP_KM2/MONTH” | REGIONAL_SURVEY_SPEED_PER_YEAR*REGIONAL_SURVEY_SWATH | The area covered by a regional survey ship per year is calculated based on the regional survey ship speed and the regional survey ship swath | |
REGIONAL_SURVEY_KTS_CONVERTER | 1,852 | ||
REGIONAL_SURVEY_SPEED_PER_YEAR | 2*REGIONAL_SURVEY_KTS_CONVERTER*18*28*6 | The average survey speed per year calculated as 2 knots during regional survey where operations are carried out for 18 h per 28 days per month per a 6 months ice-free season. Speed, operational hours, days and months is informed by multiple experts during modelling process and is referred to as industry standard | |
REGIONAL_SURVEY_SWATH | 1,2 | Survey Swath refers to lateral acoustic coverage of bathymetry and determined by opening angle of dual head hull-mounted multibeam echo sounder (DH-MBES) and water depth. Modern DH-MBES allows for online adjustment of opening angle in order to maintain constant swath. Swath is informed by multiple experts during modelling process and is referred to as industry standard | |
DESIRED_REGIONAL_SURVEY_RATE | DESIRED_SHARE_OF_TOTAL_REGIONAL_SURVEY_AREA_COVERED_BY_REGIONAL_SURVEY_PER_YEAR*PROSPECT_AREA_FOR_REGIONAL_SURVEY | The desired regional survey rate is determined by the product of the desired share of total available area covered by regional survey per year and the prospect area for regional survey | |
DESIRED_SHARE_OF_TOTAL_REGIONAL_SURVEY_AREA_COVERED_BY_REGIONAL_SURVEY_PER_YEAR | 1/3 | The desired share of total available area covered by regional survey per year is set to 1/3 | |
DESIRED_SHIPS_COMMITTED_TO_REGIONAL_SURVEY | DESIRED_REGIONAL_SURVEY_RATE/ “REGIONAL_SURVEY_SHIP_KM2/YEAR” | The desired ships committed to regional survey is determined by the desired are covered by regional survey per year and the capacity of one ship committed to regional survey per year | |
TOTAL_SURVEY_FLEET | SHIPS_COMMITTED_TO_REGIONAL_SURVEY + AVAILABLE_REGIONAL_SURVEY_SHIPS | The total survey fleet is the sum of ships committed to regional survey and available regional survey ships | |
REGIONAL_SURVEY_BUILD_ORDER_RATE | IF SURVEY_FLEET_GAP > 0 THEN SURVEY_FLEET_GAP + AVAILABLE_SURVEY_SHIPS_SCRAPPING + COMMITTED_SURVEY_SHIPS_SCRAPPING ELSE IF SURVEY_FLEET_GAP = 0 THEN AVAILABLE_SURVEY_SHIPS_SCRAPPING + COMMITTED_SURVEY_SHIPS_SCRAPPING ELSE 0 | The regional survey build order rate is determined by the survey fleet gap, which is the total desired number of committed regional survey ships subtracted the total number of existing regional survey ships, plus whatever ships that need replacement to meet/maintain the desired committed mining fleet | |
SURVEY_FLEET_GAP | DESIRED_SHIPS_COMMITTED_TO_REGIONAL_SURVEY-TOTAL_SURVEY_FLEET | The regional survey fleet gap is the difference between the desired ships committed to regional survey and the total size of the regional survey fleet | |
AVAILABLE_REGIONAL_SURVEY_SHIPS(t) | AVAILABLE_REGIONAL_SURVEY_SHIPS(t—dt) + (REGIONAL_SURVEY_BUILD_ORDER_RATE—AVAILABLE_SURVEY_SHIPS_SCRAPPING—COMISSION_RATE_REGIONAL_SURVEY) * dt | INIT AVAILABLE_REGIONAL_SURVEY_SHIPS = 2 | Available regional survey ships at time t equals the available regional survey ships at time t-dt plus earlier build orders that are completed through time t-dt subtracted what is scrapped through time t-dt and subtracted what is commissioned to the regional survey activity through time t-dt |
The initial number of regional survey ships is set to 2 | |||
AVAILABLE_SURVEY_SHIPS_SCRAPPING | AVAILABLE_REGIONAL_SURVEY_SHIPS/AVERAGE_LIFETIME_OF_REGIONAL_SURVEY_SHIPS | The available regional survey fleet scrapping is an outflow from the available regional survey fleet. The regional survey fleet depreciates based on a defined average lifetime. This process is approximately continuous | |
AVERAGE_LIFETIME_OF_REGIONAL_SURVEY_SHIPS | 20 | The average lifetime of reginal survey vessels is informed by multiple experts during modelling process and is referred to as industry standard. The lifetime of these vessels is dependent on initial quality of product, utilization, maintenance, and migrating client demands to quality, emissions, etc | |
COMISSION_RATE_REGIONAL_SURVEY | IF DESIRED_SHIPS_COMMITTED_TO_REGIONAL_SURVEY-SHIPS_COMMITTED_TO_REGIONAL_SURVEY < 0 AND SHIPS_COMMITTED_TO_REGIONAL_SURVEY > DESIRED_SHIPS_COMMITTED_TO_REGIONAL_SURVEY-SHIPS_COMMITTED_TO_REGIONAL_SURVEY THEN (DESIRED_SHIPS_COMMITTED_TO_REGIONAL_SURVEY-SHIPS_COMMITTED_TO_REGIONAL_SURVEY)/DT ELSE IF DESIRED_SHIPS_COMMITTED_TO_REGIONAL_SURVEY-SHIPS_COMMITTED_TO_REGIONAL_SURVEY < 0 AND SHIPS_COMMITTED_TO_REGIONAL_SURVEY < DESIRED_SHIPS_COMMITTED_TO_REGIONAL_SURVEY-SHIPS_COMMITTED_TO_REGIONAL_SURVEY THEN SHIPS_COMMITTED_TO_REGIONAL_SURVEY/DT ELSE IF DESIRED_SHIPS_COMMITTED_TO_REGIONAL_SURVEY-SHIPS_COMMITTED_TO_REGIONAL_SURVEY > 0 AND DESIRED_SHIPS_COMMITTED_TO_REGIONAL_SURVEY-SHIPS_COMMITTED_TO_REGIONAL_SURVEY < AVAILABLE_REGIONAL_SURVEY_SHIPS THEN (DESIRED_SHIPS_COMMITTED_TO_REGIONAL_SURVEY-SHIPS_COMMITTED_TO_REGIONAL_SURVEY)/DT ELSE IF DESIRED_SHIPS_COMMITTED_TO_REGIONAL_SURVEY-SHIPS_COMMITTED_TO_REGIONAL_SURVEY > 0 AND DESIRED_SHIPS_COMMITTED_TO_REGIONAL_SURVEY-SHIPS_COMMITTED_TO_REGIONAL_SURVEY > AVAILABLE_REGIONAL_SURVEY_SHIPS THEN AVAILABLE_REGIONAL_SURVEY_SHIPS/DT ELSE 0 | The commission rate for regional survey ships is a target seeking algorithm that commits and decommits ships based on the total available ships, the desired number of committed ships, and the committed number of ships | |
SHIPS_COMMITTED_TO_REGIONAL_SURVEY(t) | SHIPS_COMMITTED_TO_REGIONAL_SURVEY(t—dt) + (COMISSION_RATE_REGIONAL_SURVEY—SHIPS_COMMITTED_TO_REGIONAL_SURVEY_SCRAPPING) * dt | INIT SHIPS_COMMITTED_TO_REGIONAL_SURVEY = 0 | The ships committed to regional survey is determined by the number of ships committed to regional survey in the previous time step plus the commission of ships through the previous time step subtracted the number of ships committed to regional survey that are scrapped |
The initial number of ships committed to regional survey is set to 0 | |||
SHIPS_COMMITTED_TO_REGIONAL_SURVEY_SCRAPPING | SHIPS_COMMITTED_TO_REGIONAL_SURVEY/AVERAGE_LIFETIME_OF_REGIONAL_SURVEY_SHIPS | The ships committed to regional survey depreciates based on the average lifetime of such ships. This process is approximately continuous in nature | |
PROSPECT_AREA_UNDERGOING_EVALUATION_AFTER_REGIONAL_SURVEY(t) | PROSPECT_AREA_UNDERGOING_EVALUATION_AFTER_REGIONAL_SURVEY(t—dt) + (REGIONAL_SURVEY_RATE—REGIONAL_SURVEY_WITH_DESIRABLE_OUTCOME—COMMERCIAL_POTENTIAL_DISCONFIRMATION_AFTER_REGIONAL_SURVEY) * dt | INIT PROSPECT_AREA_UNDERGOING_EVALUATION_AFTER_REGIONAL_SURVEY = 0 | The prospect area undergoing evaluation after regional survey is determined by the size of the stock in the previous time step plus whatever is added from regional surveys conducted through the previous time step subtracted whatever area is confirmed or disconfirmed |
The initial prospect area undergoing evaluation after regional survey is set to 0 | |||
REGIONAL_SURVEY_WITH_DESIRABLE_OUTCOME | DELAY(REGIONAL_SURVEY_RATE*PERCENTAGE_OF_SURVEY_AREA_WITH_DESIRABLE_OUTCOME; 1) | The regional survey with desirable outcome is determined by the product of the percentage of survey area with desirable outcome and the regional survey rate one year ago. The reason for the delay is that it takes time to analyze the results from regional surveys and seasonal restrictions on when the next activity can take place | |
PERCENTAGE_OF_SURVEY_AREA_WITH_DESIRABLE_OUTCOME | LOGNORMAL(EXPECTED_PERCENTAGE_OF_SURVEY_AREA_WITH_DESIRABLE_OUTCOME; STANDARD_DEVIATION_REGIONAL_SURVEY; SEED_REGIONAL_SURVEY; 0; 1; 1) | ||
EXPECTED_PERCENTAGE_OF_SURVEY_AREA_WITH_DESIRABLE_OUTCOME | 0,15 | Set in accordance with information and statements from the interview subjects | |
STANDARD_DEVIATION_REGIONAL_SURVEY | 0,075*STD_SCALING_FACTOR*STOCHASTIC_SWITCH | Standard deviation parameter of stochasticity parameter as informed by geology experts | |
COMMERCIAL_POTENTIAL_DISCONFIRMATION_AFTER_REGIONAL_SURVEY | DELAY(REGIONAL_SURVEY_RATE*(1-PERCENTAGE_OF_SURVEY_AREA_WITH_DESIRABLE_OUTCOME); 1) | Commercial potential disconfirmation after regional survey at time t is modeled as the product of the percentage of regional survey area with desirable outcome and the regional survey rate one year ago. The reason for the delay is that it takes time to analyze the data from coring surveys and seasonal restrictions on when the next activity can take place | |
High resolution survey, coring, and environmental impact assessment | |||
|---|---|---|---|
Variables and parameters | Equations | Properties | Comments |
“PROSPECT_AREA_FOR_HI-RES_SURVEY”(t) | “PROSPECT_AREA_FOR_HI-RES_SURVEY”(t—dt) + (REGIONAL_SURVEY_WITH_DESIRABLE_OUTCOME – “HI-RES_SURVEY_RATE”) * dt | INIT “PROSPECT_AREA_FOR_HI-RES_SURVEY” = 0 | The prospect area for high-resolution survey is determined by the size of the stock in the previous time step plus whatever is added from desirable outcomes from regional surveys through the previous time step subtracted whatever area is moved on to high-resolution survey through the previous time step |
The initial prospect area for high-resolution survey is set to 0 | |||
“HI-RES_SURVEY_RATE” | MIN(“SHIPS_COMMITTED_TO_HI-RES “*”HI-RES_SURVEY_SHIP_KM2/YEAR”; “PROSPECT_AREA_FOR_HI-RES_SURVEY”) | The high-resolution survey rate is determined by the number of ships committed to said activity and the area covered by ships committed to this activity per year. If the capacity exceeds the available area, only the remaining area will be surveyed | |
“HI-RES_KTS_CONVERTER” | 1,852 | ||
“HI-RES_SURVEY_SHIP_KM2/YEAR” | “HI-RES_SURVEY_SPEED_PER_YEAR”* “HI-RES_SURVEY_SWATH” | The area covered by a high-resolution survey ship is calculated based on the high-resolution survey ship speed and the high-resolution survey ship swath | |
“HI-RES_SURVEY_SPEED_PER_YEAR” | 1*"HI-RES_KTS_CONVERTER“*18*28*6 | ||
“HI-RES_SURVEY_SWATH” | 0,5 | Survey Swath refers to lateral acoustic coverage of bathymetry and determined by opening angle of dual head hull-mounted multibeam echo sounder (DH-MBES) and flying-height above seabed. Modern DH-MBES allows for online adjustment of opening angle in order to maintain constant swath. Swath is informed by multiple experts during modelling process and is referred to as industry standard | |
“DESIRED_AREA_COVERED_BY_HI-RES” | “DESIRED_SHARE_OF_TOTAL_HI-RES_AREA_COVERED_BY_HI-RES_PER_YEAR “*”PROSPECT_AREA_FOR_HI-RES_SURVEY” | The desired area covered by high-resolution survey is determined by the product of the desired share of total available area covered by high-resolution survey per year for and the prospect area for high-resolution survey | |
“DESIRED_SHARE_OF_TOTAL_HI-RES_AREA_COVERED_BY_HI-RES_PER_YEAR” | 1/3 | The desired share of total available area covered by high-resolution survey per year is set to 1/3 | |
“TOTAL_SHIPS_FOR_HI-RES,_CORING_AND_EIA” | “SHIPS_COMMITTED_TO_HI-RES" + SHIPS_COMMITTED_TO_CORING + SHIPS_COMMITTED_TO_EIA + “AVAILABLE_SHIPS_FOR_HI-RES,_CORING_AND_EIA” | The total high-resolution survey, coring, environmental impact assessment ships equal the sum of all committed ships and the available ships of such type | |
“DESIRED_SHIPS_COMMITTED_TO_HI-RES” | “DESIRED_AREA_COVERED_BY_HI-RES”/ “HI-RES_SURVEY_SHIP_KM2/YEAR” | The desired ships committed to high-resolution survey is determined by the desired area covered by high-resolution survey per year and the capacity of one ship committed to high-resolution survey per year | |
“HI-RES_COMMISION_RATE" | IF “AVAILABLE_SHIPS_FOR_HI-RES,_CORING_AND_EIA”-(DESIRED_SHIPS_COMMITTED_TO_CORING-SHIPS_COMMITTED_TO_CORING)-(DESIRED_SHIPS_COMMITTED_TO_EIA-SHIPS_COMMITTED_TO_EIA) > 0 THEN MIN(“DESIRED_SHIPS_COMMITTED_TO_HI-RES”- “SHIPS_COMMITTED_TO_HI-RES”; “AVAILABLE_SHIPS_FOR_HI-RES,_CORING_AND_EIA”)/TIME_TO_COMMIT_OR_RECOMMIT_SHIPS ELSE IF “AVAILABLE_SHIPS_FOR_HI-RES,_CORING_AND_EIA”-(DESIRED_SHIPS_COMMITTED_TO_CORING-SHIPS_COMMITTED_TO_CORING)-(DESIRED_SHIPS_COMMITTED_TO_EIA-SHIPS_COMMITTED_TO_EIA) < 0 THEN—“SHIPS_COMMITTED_TO_HI-RES”/TIME_TO_COMMIT_OR_RECOMMIT_SHIPS ELSE 0 | The commission rates for high-resolution surveys, coring, and environmental impact assessments are determined by algorithms that consider the available number of ships, the number of desired ships committed to each activity, the number of ships committed to the various activities. If there are enough available ships to satisfy the desired number of ships committed for all activities, then the algorithm will ensure this happens. If there are not enough available ships to satisfy the desired number of ships committed for all activities, then commission will be prioritized to the activity that is closer to generate an ore discovery | |
TIME_TO_COMMIT_OR_RECOMMIT_SHIPS | 1/12 | The average time required to secure a multipurpose vessel-charter via procurement in spot-market. Time includes announcement in market, negotiations, and contractual commitment. Parameter informed by industry and academic experts/stakeholders experienced in chartering vessels | |
“TOTAL_DESIRED_SHIPS_FOR_HI-RES,_CORING_AND_EIA” | (“DESIRED_SHIPS_COMMITTED_TO_HI-RES” + DESIRED_SHIPS_COMMITTED_TO_CORING + DESIRED_SHIPS_COMMITTED_TO_EIA + DESIRED_AVAILABLE_SHIPS)*(1-AGRESSIVE_POLICY_SWITCH) + AGRESSIVE_POLICY_SWITCH* MAX((“DESIRED_SHIPS_COMMITTED_TO_HI-RES” + DESIRED_SHIPS_COMMITTED_TO_CORING + DESIRED_SHIPS_COMMITTED_TO_EIA + DESIRED_AVAILABLE_SHIPS); (DESIRED_AVAILABLE_SHIPS + "EXPECTED_DESIRED_SHIPS_FOR_HI-RES_IN_TWO_YEARS" + EXPECTED_DESIRED_SHIPS_COMMITTED_TO_CORING_IN_TWO_YEARS + EXPECTED_DESIRED_SHIPS_COMMITTED_TO_EIA_IN_TWO_YEARS)) | The total desired ships for high-resolution surveys, coring, and EIAs depend on the policy setting | |
DESIRED_AVAILABLE_SHIPS | 0 | The desired number of available ships is a parameter that defines how many ships are always wanted available. This parameter is set to 0 | |
“SHIPS_FOR_HI-RES,_CORING_AND_EIA_BUILD_ORDER_RATE” | IF “TOTAL_DESIRED_SHIPS_FOR_HI-RES,_CORING_AND_EIA"- “TOTAL_SHIPS_FOR_HI-RES,_CORING_AND_EIA"- “SHIPS_FOR_HI-RES,_CORING_AND_EIA_UNDER_CONSTRUCTION” > = 0 THEN (“TOTAL_DESIRED_SHIPS_FOR_HI-RES,_CORING_AND_EIA”- “TOTAL_SHIPS_FOR_HI-RES,_CORING_AND_EIA”- “SHIPS_FOR_HI-RES,_CORING_AND_EIA_UNDER_CONSTRUCTION”)/TIME_TO_COMPLETE_DESIRED_INVESTMENT + SHIPS_AT_REPLACEMENT_DATE/TIME_TO_COMPLETE_DESIRED_INVESTMENT ELSE IF “TOTAL_DESIRED_SHIPS_FOR_HI-RES,_CORING_AND_EIA” > = “TOTAL_SHIPS_FOR_HI-RES,_CORING_AND_EIA”-SHIPS_AT_REPLACEMENT_DATE THEN SHIPS_AT_REPLACEMENT_DATE/TIME_TO_COMPLETE_DESIRED_INVESTMENT ELSE 0 | The build order rate for high-resolution, coring, and environmental impact assessment ships is target seeking and based on the total number of desired committed ships, the ships under construction, and the ships due for replacement if capacity is to be maintained | |
SHIPS_AT_REPLACEMENT_DATE(t) | SHIPS_AT_REPLACEMENT_DATE(t—dt) + (SHIPS_DUE_FOR_REPLACEMENT—SHIPS_REPLACED_OR_OVER_DUE_DATE_FOR_REPLACEMENT) * dt | INIT SHIPS_AT_REPLACEMENT_DATE = 0 | The ships at replacement date keeps track of ships that are due for scrapping in near future and needs to be replaced if there is desire to avoid reduction in the exploration capacity |
TIME_TO_COMPLETE_DESIRED_INVESTMENT | 1 | The initial number of ships at replacement date is set to 0 | |
“SHIPS_FOR_HI-RES,_CORING_AND_EIA_BUILD_COMPLETION” | DELAY(“SHIPS_FOR_HI-RES,_CORING_AND_EIA_BUILD_ORDER_RATE”; SURVEY_SHIPS_LEAD_TIME) | The completion rate for high-resolution, coring, and environmental impact assessment ships is determined by a discrete delay of previous build order rates. The length of the delay is determined by the lead time for such a ship | |
SURVEY_SHIPS_LEAD_TIME | 2 | Time required to commission, build and mobilize a regional survey vessel. Variable informed by multiple experts during modelling process and is referred to as industry standard | |
“AVAILABLE_SHIPS_FOR_HI-RES,_CORING_AND_EIA” (t) | “AVAILABLE_SHIPS_FOR_HI-RES,_CORING_AND_EIA” (t—dt) + (“SHIPS_FOR_HI-RES,_CORING_AND_EIA_BUILD_COMPLETION”—CORING_COMMISION_RATE—"HI-RES_COMMISION_RATE”—AVAILABLE_SHIPS_SCRAPPING—EIA_COMMISSION_RATE) * dt | INIT "AVAILABLE_SHIPS_FOR_HI-RES,_CORING_AND_EIA" = INITIAL_AVAILABLE_SHIPS | Available ships for high-resolution survey, coring, and environmental impact assessment at time t is determined by the size of the stock at time t-dt plus earlier build orders that are completed through time t-dt subtracted ships that are scrapped through time t-dt and subtracted what is commissioned to exploration activities through time t-dt |
The initial number of available ships is defined by a separately specified variable (which is found further down in the model documentation). However, this variable is set to 0, so the initial number of available ships for coring is 0 | |||
AVAILABLE_SHIPS_SCRAPPING | IF NUMBERS_OF_SHIPS_TO_SCRAP > 0 AND “AVAILABLE_SHIPS_FOR_HI-RES,_CORING_AND_EIA” > NUMBERS_OF_SHIPS_TO_SCRAP THEN NUMBERS_OF_SHIPS_TO_SCRAP/DT ELSE IF NUMBERS_OF_SHIPS_TO_SCRAP > 0 AND “AVAILABLE_SHIPS_FOR_HI-RES,_CORING_AND_EIA” < = NUMBERS_OF_SHIPS_TO_SCRAP THEN “AVAILABLE_SHIPS_FOR_HI-RES,_CORING_AND_EIA”/DT ELSE 0 | If there are ships for high-resolution surveys, coring, and environmental impact assessments that are due for scrapping, then scrapping will occur based on a priority-list. If there are any ships in the available ships stock, then these will be scrapped according to the equation on the left. If there are no available ships in this stock, or more ships need to be scrapped than what is available in this stock, then the model will look to the next stock on the priority list, which is the ships committed to high-resolution survey. The same procedure is then repeated before moving on to ships committed to coring, and eventually the ships committed to environmental impact assessment. This process is discrete in nature | |
“SHIPS_FOR_HI-RES,_CORING_AND_EIA_UNDER_CONSTRUCTION” (t) | “SHIPS_FOR_HI-RES,_CORING_AND_EIA_UNDER_CONSTRUCTION”(t—dt) + (“SHIPS_FOR_HI-RES,_CORING_AND_EIA_BUILD_ORDER_RATE”—“SHIPS_FOR_HI-RES,_CORING_AND_EIA_BUILD_COMPLETION”) * dt | INIT “SHIPS_FOR_HI-RES,_CORING_AND_EIA_UNDER_CONSTRUCTION” = 0 | The ships for high-resolution surveys, coring, and environmental impact assessments under construction at time t is determined by the size of the stock in the previous time step plus the new orders in the previous time step subtracted the ships that are completed through the previous time step |
The initial number of ships for high-resolution surveys, coring, and environmental impact assessments are set to 0 | |||
SHIPS_DUE_FOR_SCRAPPING(t) | SHIPS_DUE_FOR_SCRAPPING(t—dt) + (“SHIPS_CLOSING_UP_TO_END_OF_LIFETIME—TOTAL_SHIPS_FOR_HI-RES,_CORING_AND_EIA_SCRAPPING_RATE”) * dt | INIT SHIPS_DUE_FOR_SCRAPPING = 0 | Ships due for scrapping is a stock that keeps track of the new number of high-resolution survey, coring, and environmental impact assessment ships that are due for scrapping. The size of this stock is determined by the size of the stock in the previous time step plus the number of ships closing to the end of their lifetime in the previous time step subtracted the ships that are scrapped through the previous time step |
The initial ships due for scrapping is set to 0 | |||
NUMBERS_OF_SHIPS_TO_SCRAP | SHIPS_DUE_FOR_SCRAPPING | The number of high-resolution, coring, EIA ships to scrap is determined by the ships due for scrapping | |
SHIPS_CLOSING_UP_TO_END_OF_LIFETIME | DELAY(“SHIPS_FOR_HI-RES,_CORING_AND_EIA_BUILD_COMPLETION”;“AVERAGE_LIFETIME_OF_SHIPS_FOR_HI-RES,_CORING_AND_EIA”; 0) | The number of regional survey, coring, and environmental impact assessment ships closing to their end of their lifetime is calculated based on a discrete delay of the build order rate | |
“AVERAGE_LIFETIME_OF_SHIPS_FOR_HI-RES,_CORING_AND_EIA" | 20 | The average lifetime of multipurpose vessels is informed by multiple experts during modelling process and is referred to as industry standard. The lifetime of these vessels is dependent on initial quality of product, utilization, maintenance, and migrating client demands to comfort, capability, quality, emissions, etc | |
SHIPS_DUE_FOR_REPLACEMENT | DELAY(“SHIPS_FOR_HI-RES,_CORING_AND_EIA_BUILD_COMPLETION”; “AVERAGE_LIFETIME_OF_SHIPS_FOR_HI-RES,_CORING_AND_EIA”-SURVEY_SHIPS_LEAD_TIME-TIME_TO_COMMIT_OR_RECOMMIT_SHIPS-TIME_TO_COMPLETE_DESIRED_INVESTMENT)/DT | The ships due for replacement keeps track of the regional survey, coring, and environmental impact assessment ships that must be put in order and replaced to maintain current capacity | |
SHIPS_REPLACED_OR_OVER_DUE_DATE_FOR_REPLACEMENT | DELAY(SHIPS_DUE_FOR_REPLACEMENT; DT) | This is an outflow from the stock that keeps track of the ships that are due for replacement. Ships that are past their replacement date are removed from the stock in question | |
“SHIPS_COMMITTED_TO_HI-RES” (t) | “SHIPS_COMMITTED_TO_HI-RES” (t—dt) + (“HI-RES_COMMISION_RATE”—“SHIPS_COMMITTED_TO_HI-RES_SCRAPPING”) * dt | INIT "SHIPS_COMMITTED_TO_HI-RES" = 0 | The ships committed to high-resolution survey is determined by the number of ships committed to high-resolution survey in the previous time step plus the commission of ships through the previous time step subtracted the number of ships committed to high-resolution survey that are scrapped |
The initial number of ships committed to high-resolution survey is set to 0 | |||
"SHIPS_COMMITTED_TO_HI-RES_SCRAPPING” | IF NUMBERS_OF_SHIPS_TO_SCRAP > “AVAILABLE_SHIPS_FOR_HI-RES,_CORING_AND_EIA” AND “SHIPS_COMMITTED_TO_HI-RES” > NUMBERS_OF_SHIPS_TO_SCRAP- “AVAILABLE_SHIPS_FOR_HI-RES,_CORING_AND_EIA” THEN (NUMBERS_OF_SHIPS_TO_SCRAP- “AVAILABLE_SHIPS_FOR_HI-RES,_CORING_AND_EIA”)/DT ELSE IF NUMBERS_OF_SHIPS_TO_SCRAP- “SHIPS_COMMITTED_TO_HI-RES” > 0 AND “SHIPS_COMMITTED_TO_HI-RES" < = NUMBERS_OF_SHIPS_TO_SCRAP- “AVAILABLE_SHIPS_FOR_HI-RES,_CORING_AND_EIA” THEN “SHIPS_COMMITTED_TO_HI-RES”/DT ELSE 0 | If there are ships for high-resolution surveys, coring, and environmental impact assessments that are due for scrapping, then scrapping will occur based on a priority-list. If there are any ships in the available ships stock, then these will be scrapped according to the equation on the left. If there are no available ships in this stock, or more ships need to be scrapped than what is available in this stock, then the model will look to the next stock on the priority list, which is the ships committed to high-resolution survey. The same procedure is then repeated before moving on to ships committed to coring, and eventually the ships committed to environmental impact assessment. This process is discrete in nature | |
“PROSPECT_AREA_UNDERGOING_EVALUATION_AFTER_HI-RES_SURVEY”(t) | “PROSPECT_AREA_UNDERGOING_EVALUATION_AFTER_HI-RES_SURVEY”(t—dt) + (“HI-RES_SURVEY_RATE”—“HI-RES_SURVEY_WITH_DESIRABLE_OUTCOME”—“COMMERCIAL_POTENTIAL_DISCONFIRMATION_AFTER_HI-RES_SURVEY”) * dt | INIT "PROSPECT_AREA_UNDERGOING_EVALUATION_AFTER_HI-RES_SURVEY" = 0 | The prospect area undergoing evaluation after high-resolution survey is determined by the size of the stock in the previous time step plus whatever is added from high-resolution surveys conducted through the previous time step subtracted whatever area is confirmed or disconfirmed |
The initial prospect area undergoing evaluation after high-resolution survey is set to 0 | |||
“HI-RES_SURVEY_WITH_DESIRABLE_OUTCOME” | DELAY(“HI-RES_SURVEY_RATE”* “PERCENTAGE_OF_HI-RES_SURVEY_AREA_WITH_DESIRABLE_OUTCOME”; 1) | The high-resolution survey with desirable outcome is determined by the product of the percentage of high-resolution survey area with desirable outcome and the high-resolution survey rate one year ago. The reason for the delay is that it takes time to analyze the results from high-resolution surveys and seasonal restrictions on when the next activity can take place | |
“PERCENTAGE_OF_HI-RES_SURVEY_AREA_WITH_DESIRABLE_OUTCOME” | LOGNORMAL(“EXPECTED_PERCENTAGE_OF_HI-RES_SURVEY_AREA_WITH_DESIRABLE_OUTCOME”; “STANDARD_DEVIATION_HI-RES_SURVEY”; “SEED_HI-RES_SURVEY”; 0; 1; 1) | ||
“EXPECTED_PERCENTAGE_OF_HI-RES_SURVEY_AREA_WITH_DESIRABLE_OUTCOME" | 0,01 | Set in accordance with information and statements from the interview subjects | |
“STANDARD_DEVIATION_HI-RES_SURVEY” | 0,005*STD_SCALING_FACTOR*STOCHASTIC_SWITCH | Standard deviation parameter of stochasticity parameter as informed by geology experts | |
“COMMERCIAL_POTENTIAL_DISCONFIRMATION_AFTER_HI-RES_SURVEY” | DELAY((1- “PERCENTAGE_OF_HI-RES_SURVEY_AREA_WITH_DESIRABLE_OUTCOME”)* “HI-RES_SURVEY_RATE”; 1) | Commercial potential disconfirmation after high-resolution survey at time t is modeled as the product of the percentage of high-resolution survey area with desirable outcome and the high-resolution survey rate one year ago. The reason for the delay is that it takes time to analyze the data from coring surveys and seasonal restrictions on when the next activity can take place | |
PROSPECT_AREA_FOR_CORING(t) | PROSPECT_AREA_FOR_CORING(t—dt) + (“HI-RES_SURVEY_WITH_DESIRABLE_OUTCOME”—CORING_RATE) * dt | INIT PROSPECT_AREA_FOR_CORING = 0 | The prospect area for coring is determined by the size of the stock in the previous time step plus whatever is added from desirable outcomes from high-resolution surveys through the previous time step subtracted whatever area is moved on to coring |
The initial prospect area for coring is set to 0 | |||
CORING_RATE | MIN(SHIPS_COMMITTED_TO_CORING*AREA_CONCLUDED_PER_CORING_CAMPAIGN*MAXIMUM_NUMBER_OF_CORING_CAMPAIGNS_PER_SHIP_PER_YEAR; PROSPECT_AREA_FOR_CORING) | The coring rate is determined by the number of ships committed to coring, the area concluded per coring campaign, the maximum number of coring campaigns per ship per year. If this capacity exceeds the area available for coring, then only the remaining area will be subject to coring | |
MAXIMUM_NUMBER_OF_CORING_CAMPAIGNS_PER_SHIP_PER_YEAR | 2 | The plausible maximum number of campaigns executable during exploration season. Considering long distance from shore, bunkering and supply requirements, crew-change requirements, weather, and operational capability there is a practical maximum for the number of campaigns a vessel can execute during the ice-free/operable season | |
AREA_CONCLUDED_PER_CORING_CAMPAIGN | 0,2125 | The spatial distribution of cores throughout an area defines the level of certainty geologist may assume when analyzing the core data. Given time to core, required cores per/area for geologic assessment and campaign duration the area concluded per campaign is defined, The parameter is informed by participating expert geologists | |
DESIRED_AREA_COVERED_CORING | DESIRED_SHARE_OF_TOTAL_CORING_AREA_COVERED_BY_CORING_PER_YEAR*PROSPECT_AREA_FOR_CORING | The desired area covered by coring is determined by the product of the desired share of total available area covered by coring per year and the prospect area for coring | |
DESIRED_SHARE_OF_TOTAL_CORING_AREA_COVERED_BY_CORING_PER_YEAR | 1/3 | The desired share of total available area covered by coring per year is set to 1/3 | |
DESIRED_SHIPS_COMMITTED_TO_CORING | DESIRED_AREA_COVERED_CORING/ (AREA_CONCLUDED_PER_CORING_CAMPAIGN*MAXIMUM_NUMBER_OF_CORING_CAMPAIGNS_PER_SHIP_PER_YEAR) | The desired ships committed to coring is calculated based on the desired area covered by coring per year and the capacity of one ship committed to coring per year | |
CORING_COMMISION_RATE | IF “AVAILABLE_SHIPS_FOR_HI-RES,_CORING_AND_EIA”-(DESIRED_SHIPS_COMMITTED_TO_EIA-SHIPS_COMMITTED_TO_EIA) > 0 THEN MIN(DESIRED_SHIPS_COMMITTED_TO_CORING-SHIPS_COMMITTED_TO_CORING; “AVAILABLE_SHIPS_FOR_HI-RES,_CORING_AND_EIA”)/TIME_TO_COMMIT_OR_RECOMMIT_SHIPS ELSE IF “AVAILABLE_SHIPS_FOR_HI-RES,_CORING_AND_EIA” (DESIRED_SHIPS_COMMITTED_TO_EIA-SHIPS_COMMITTED_TO_EIA) < 0 AND “SHIPS_COMMITTED_TO_HI-RES” > (DESIRED_SHIPS_COMMITTED_TO_EIA-SHIPS_COMMITTED_TO_EIA) THEN 0 ELSE IF “AVAILABLE_SHIPS_FOR_HI-RES,_CORING_AND_EIA”-(DESIRED_SHIPS_COMMITTED_TO_EIA-SHIPS_COMMITTED_TO_EIA) < 0 THEN MAX(-SHIPS_COMMITTED_TO_CORING; (- “AVAILABLE_SHIPS_FR_HI-RES,_CORING_AND_EIA”-(DESIRED_SHIPS_COMMITTED_TO_EIA-SHIPS_COMMITTED_TO_EIA)))/TIME_TO_COMMIT_OR_RECOMMIT_SHIPS ELSE 0 | The commission rates for high-resolution surveys, coring, and environmental impact assessments are determined by algorithms that consider the available number of ships, the number of desired ships committed to each activity, the number of ships committed to the various activities. If there are enough available ships to satisfy the desired number of ships committed for all activities, then the algorithm will ensure this happens. If there are not enough available ships to satisfy the desired number of ships committed for all activities, then commission will be prioritized to the activity that is closer to generate an ore discovery | |
SHIPS_COMMITTED_TO_CORING(t) | SHIPS_COMMITTED_TO_CORING(t—dt) + (CORING_COMMISION_RATE—SHIPS_COMMITTED_TO_CORING_SCRAPPING) * dt | INIT SHIPS_COMMITTED_TO_CORING = 0 | The ships committed to coring is determined by the number of ships committed to coring in the previous time step plus the commission of ships through the previous time step subtracted the number of ships committed to coring that are scrapped |
The initial number of ships committed to coring is set to 0 | |||
SHIPS_COMMITTED_TO_CORING_SCRAPPING | IF NUMBERS_OF_SHIPS_TO_SCRAP > “AVAILABLE_SHIPS_FOR_HI-RES,_CORING_AND_EIA” + “SHIPS_COMMITTED_TO_HI-RES" AND SHIPS_COMMITTED_TO_CORING > NUMBERS_OF_SHIPS_TO_SCRAP- “AVAILABLE_SHIPS_FOR_HI-RES,_CORING_AND_EIA”- “SHIPS_COMMITTED_TO_HI-RES” THEN (NUMBERS_OF_SHIPS_TO_SCRAP- “AVAILABLE_SHIPS_FOR_HI-RES,_CORING_AND_EIA”- “SHIPS_COMMITTED_TO_HI-RES”)/DT ELSE IF NUMBERS_OF_SHIPS_TO_SCRAP-SHIPS_COMMITTED_TO_CORING > 0 AND SHIPS_COMMITTED_TO_CORING < = NUMBERS_OF_SHIPS_TO_SCRAP- “AVAILABLE_SHIPS_FOR_HI-RES,_CORING_AND_EIA”- “SHIPS_COMMITTED_TO_HI-RES” THEN (SHIPS_COMMITTED_TO_CORING)/DT ELSE 0 | If there are ships for high-resolution surveys, coring, and environmental impact assessments that are due for scrapping, then scrapping will occur based on a priority-list. If there are any ships in the available ships stock, then these will be scrapped according to the equation on the left. If there are no available ships in this stock, or more ships need to be scrapped than what is available in this stock, then the model will look to the next stock on the priority list, which is the ships committed to high-resolution survey. The same procedure is then repeated before moving on to ships committed to coring, and eventually the ships committed to environmental impact assessment. This process is discrete in nature | |
PROSPECT_AREA_UNDERGOING_EVALUATION_AFTER_CORING(t) | PROSPECT_AREA_UNDERGOING_EVALUATION_AFTER_CORING(t—dt) + (CORING_RATE—CORING_WITH_DESIRABLE_OUTCOME—COMMERCIAL_POTENTIAL_DISCONFIRMATION_AFTER_CORING) * dt | INIT PROSPECT_AREA_UNDERGOING_EVALUATION_AFTER_CORING = 0 | The prospect area undergoing evaluation after coring is determined by the size of the stock in the previous time step plus whatever is added on from coring through the previous time step subtracted whatever area is confirmed or disconfirmed as commercially interesting through the previous time step |
The initial prospect area undergoing evaluation after coring is set to 0 | |||
CORING_WITH_DESIRABLE_OUTCOME | DELAY(PERCENTAGE_OF_CORING_AREA_WITH_DESIRABLE_OUTCOME*CORING_RATE; 1) | The coring with desirable outcome is determined by the product of the percentage of coring area with desirable outcome and the coring rate one year ago. The reason for the delay is that it takes time to analyze the data from coring activity and seasonal restrictions on when the next activity can take place | |
PERCENTAGE_OF_CORING_AREA_WITH_DESIRABLE_OUTCOME | LOGNORMAL(EXPECTED_PERCENTAGE_OF_CORING_AREA_WITH_DESIRABLE_OUTCOME; STANDARD_DEVIATION_CORING; SEED_CORING; 0; 1; 1) | ||
EXPECTED_PERCENTAGE_OF_CORING_AREA_WITH_DESIRABLE_OUTCOME | 0,25 | Set in accordance with information and statements from the interview subjects | |
STANDARD_DEVIATION_CORING | 0,125*STD_SCALING_FACTOR*STOCHASTIC_SWITCH | Standard deviation parameter of stochasticity parameter as informed by geology experts interviewed | |
COMMERCIAL_POTENTIAL_DISCONFIRMATION_AFTER_CORING | DELAY((1-PERCENTAGE_OF_CORING_AREA_WITH_DESIRABLE_OUTCOME)*CORING_RATE; 1) | Commercial potential disconfirmation after coring at time t is modeled as the product of the percentage of coring area with desirable outcome and the coring rate one year ago. The reason for the delay is that it takes time to analyze the data from coring activity and seasonal restrictions on when the next activity can take place | |
AREA_WITH_CONFIRMED_ORE(t) | AREA_WITH_CONFIRMED_ORE(t—dt) + (CORING_WITH_DESIRABLE_OUTCOME—EIA_RATE) * dt | INIT AREA_WITH_CONFIRMED_ORE = 0 | Area with confirmed ore at time t equals the area with confirmed ore at time t-dt plus the inflow from successful coring through time t-dt subtracted the area that moves to environmental impact assessment through time t-dt |
The initial area with confirmed ore is set to 0 | |||
EIA_RATE | MIN(SHIPS_COMMITTED_TO_EIA* “HI-RES_SURVEY_SHIP_KM2/YEAR”/EIA_AREA_AMPLIFIER; AREA_WITH_CONFIRMED_ORE) | The environmental impact assessment rate is determined by the product of the number of ships committed to the activity and the area covered per such ship for said activity divided by an environmental impact assessment area amplified (since environmental impact assessments must cover a larger area than that one is interested in extracting from). If the capacity for environmental impact assessment exceeds the available area for such activity, then only the remaining area will be covered | |
EIA_AREA_AMPLIFIER | 314 | The environmental impact assessment area amplifier is set to 314 | |
DESIRED_AREA_COVERED_EIA | DESIRED_SHARE_OF_TOTAL_EIA_AREA_COVERED_BY_EIA_PER_YEAR*AREA_WITH_CONFIRMED_ORE | The desired area covered by EIA is determined by the product of the desired share of total available area covered by EIA per year and the prospect area for EIA | |
DESIRED_SHARE_OF_TOTAL_EIA_AREA_COVERED_BY_EIA_PER_YEAR | 1 | The desired share of total available area covered by EIA per year is set to 1 | |
DESIRED_SHIPS_COMMITTED_TO_EIA | DESIRED_AREA_COVERED_EIA/ “HI-RES_SURVEY_SHIP_KM2/YEAR”*EIA_AREA_AMPLIFIER | The desired ships committed to EIA is calculated based on the desired area covered by EIA per year and the capacity of one ship committed to EIA per year | |
EIA_COMMISSION_RATE | MIN(DESIRED_SHIPS_COMMITTED_TO_EIA-SHIPS_COMMITTED_TO_EIA;“AVAILABLE_SHIPS_FOR_HI-RES,_CORING_AND_EIA”)/TIME_TO_COMMIT_OR_RECOMMIT_SHIPS | The commission rates for high-resolution surveys, coring, and environmental impact assessments are determined by algorithms that consider the available number of ships, the number of desired ships committed to each activity, the number of ships committed to the various activities. If there are enough available ships to satisfy the desired number of ships committed for all activities, then the algorithm will ensure this happens. If there are not enough available ships to satisfy the desired number of ships committed for all activities, then commission will be prioritized to the activity that is closer to generate an ore discovery | |
SHIPS_COMMITTED_TO_EIA(t) | SHIPS_COMMITTED_TO_EIA(t—dt) + (EIA_COMMISSION_RATE—SHIPS_COMMITTED_TO_EIA_SCRAPPING) * dt | INIT SHIPS_COMMITTED_TO_EIA = 0 | The ships committed to EIA is determined by the number of ships committed to EIA in the previous time step plus the commission of ships through the previous time step subtracted the number of ships committed to EIA that are scrapped |
The initial number of ships committed to EIA is set to 0 | |||
SHIPS_COMMITTED_TO_EIA_SCRAPPING | IF NUMBERS_OF_SHIPS_TO_SCRAP > “AVAILABLE_SHIPS_FOR_HI-RES,_CORING_AND_EIA” + “SHIPS_COMMITTED_TO_HI-RES” + SHIPS_COMMITTED_TO_CORING AND SHIPS_COMMITTED_TO_EIA > NUMBERS_OF_SHIPS_TO_SCRAP- “AVAILABLE_SHIPS_FOR_HI-RES,_CORING_AND_EIA”- “SHIPS_COMMITTED_TO_HI-RES”-SHIPS_COMMITTED_TO_CORING THEN (NUMBERS_OF_SHIPS_TO_SCRAP- “AVAILABLE_SHIPS_FOR_HI-RES,_CORING_AND_EIA”- “SHIPS_COMMITTED_TO_HI-RES"-SHIPS_COMMITTED_TO_CORING)/DT ELSE IF NUMBERS_OF_SHIPS_TO_SCRAP-SHIPS_COMMITTED_TO_EIA > 0 AND SHIPS_COMMITTED_TO_EIA < = NUMBERS_OF_SHIPS_TO_SCRAP- “AVAILABLE_SHIPS_FOR_HI-RES,_CORING_AND_EIA”- “SHIPS_COMMITTED_TO_HI-RES”-SHIPS_COMMITTED_TO_CORING THEN SHIPS_COMMITTED_TO_EIA/DT ELSE 0 | If there are ships for high-resolution surveys, coring, and environmental impact assessments that are due for scrapping, then scrapping will occur based on a priority-list. If there are any ships in the available ships stock, then these will be scrapped according to the equation on the left. If there are no available ships in this stock, or more ships need to be scrapped than what is available in this stock, then the model will look to the next stock on the priority list, which is the ships committed to high-resolution survey. The same procedure is then repeated before moving on to ships committed to coring, and eventually the ships committed to environmental impact assessment. This process is discrete in nature | |
AREA_WITH_CONFIRMED_ORE_UNDERGOING_EVALUATION_AFTER_EIA(t) | AREA_WITH_CONFIRMED_ORE_UNDERGOING_EVALUATION_AFTER_EIA(t—dt) + (EIA_RATE—EIA_APPROVAL_RATE—EIA_DISAPPROVAL_RATE) * dt | INIT AREA_WITH_CONFIRMED_ORE_UNDERGOING_EVALUATION_AFTER_EIA = 0 | Area with confirmed ore undergoing evaluation after environmental impact assessment at time t equals the area with confirmed ore undergoing evaluation after environmental impact assessment at time t-dt plus the inflow from environmental impact assessment through time t-dt subtracted the environmental impact assessment approval and disapproval rates through time t-dt |
The initial area with confirmed ore undergoing evaluation after environmental impact assessment is set to 0 | |||
EIA_APPROVED_AREA_WITH_CONFIRMED_ORE(t) | EIA_APPROVED_AREA_WITH_CONFIRMED_ORE(t—dt) + (EIA_APPROVAL_RATE) * dt | INIT EIA_APPROVED_AREA_WITH_CONFIRMED_ORE = 0 | Environmental assessment approved area with confirmed ore at time t is determined by the size of the stock in the previous time step plus whatever is approved through the previous timestep |
The initial environmental assessment approved area with confirmed ore is set to 0 | |||
EIA_APPROVAL_RATE | DELAY(PERCENTAGE_OF_AREA_WITH_CONFIRMED_ORE_RECEIVING_EIA_APPROVAL*EIA_RATE; 1) | The environmental impact assessment approval rate is determined by the product of the percentage of area with confirmed ore receiving such approval and the environmental impact assessment rate one year ago. The reason for the delay is that it takes time to analyze the results from an environmental impact assessment survey and decide regarding approval | |
PERCENTAGE_OF_AREA_WITH_CONFIRMED_ORE_RECEIVING_EIA_APPROVAL | 1 | We assume all area of interest gets an environmental impact assessment approval. This need not be the case for the actual industry | |
EIA_DISAPPROVAL_RATE | DELAY((1-PERCENTAGE_OF_AREA_WITH_CONFIRMED_ORE_RECEIVING_EIA_APPROVAL)*EIA_RATE; 12) | The environmental impact assessment disapproval rate is determined by the product of the percentage of area with confirmed ore receiving such approval and the environmental impact assessment rate one year ago. The reason for the delay is that it takes time to analyze the results from an environmental impact assessment survey and decide regarding approval | |
DISCARDED_AREA(t) | DISCARDED_AREA(t—dt) + (“COMMERCIAL_POTENTIAL_DISCONFIRMATION_AFTER_HI-RES_SURVEY” + COMMERCIAL_POTENTIAL_DISCONFIRMATION_AFTER_CORING + COMMERCIAL_POTENTIAL_DISCONFIRMATION_AFTER_REGIONAL_SURVEY + EIA_DISAPPROVAL_RATE) * dt | INIT DISCARDED_AREA = 0 | Discarded area at time t is determined by the size of the stock in the previous time step plus whatever area is disconfirmed after the various exploration activities through the previous time step |
The initial discarded area is set to 0 | |||
“TOTAL_SHIPS_FOR_HI-RES,_CORING_AND_EIA_SCRAPPING_RATE” | AVAILABLE_SHIPS_SCRAPPING + “SHIPS_COMMITTED_TO_HI-RES_SCRAPPING” + SHIPS_COMMITTED_TO_CORING_SCRAPPING + SHIPS_COMMITTED_TO_EIA_SCRAPPING | The total ships for scrapping keeps track of the high-resolution survey, coring, and environmental impact assessment ships that have been scrapped, and removes these ships from the stock tracking the ships that are due for scrapping | |
SCRAPPED_NUMBER_OF_SHIPS(t) | SCRAPPED_NUMBER_OF_SHIPS(t—dt) + (“TOTAL_SHIPS_FOR_HI-RES,_CORING_AND_EIA_SCRAPPING_RATE”) * dt | INIT SCRAPPED_NUMBER_OF_SHIPS = 0 | The scrapped number of ships is a stock that keeps track of how many ships have been scrapped at any point in time. It serves no other purpose in the model |
Commercial ore discovery and extraction | |||
|---|---|---|---|
Variables and parameters | Equations | Properties | Comments |
COMMERCIAL_ORE_DISCOVERY | EIA_APPROVAL_RATE*AVERAGE_MILLION_TONS_ORE_PER_KM2_PER_DISCOVERY | The commercial ore discovery rate is determined by the environmental impact assessment approval rate multiplied by the average million tons ore per square kilometer | |
AVERAGE_MILLION_TONS_ORE_PER_KM2_PER_DISCOVERY | LOGNORMAL(EXPECTED_AVERAGE_MILLION_TONS_ORE_PER_KM2_PER_DISCOVERY; STANDARD_DEVIATION_OCCURENCE; SEED_OCCURENCE; 0; 100; 1) | The average million tons of ore per km2 per discovery as assessed by interviewed geologists indicates the tonnage of material carrying commercial minerals expected to be retrieved per area within a deposit discovery. The parameter is based on the knowledge, expectations, and perceptions by participating geologists and is informed by geologic analogues from similar deposits | |
EXPECTED_AVERAGE_MILLION_TONS_ORE_PER_KM2_PER_DISCOVERY | 2 | The expected average million tons of ore per square kilometer is set to 2. This is done in accordance with input from several interview subjects | |
STANDARD_DEVIATION_OCCURENCE | 1*STD_SCALING_FACTOR*STOCHASTIC_SWITCH | Standard deviation parameter of stochasticity parameter as informed by geology experts | |
COMMERCIAL_MINERAL_STOCK(t) | COMMERCIAL_MINERAL_STOCK(t—dt) + (COMMERCIAL_ORE_DISCOVERY—EXTRACTION_FROM_COMMERCIAL_MINERAL_STOCK) * dt | INIT COMMERCIAL_MINERAL_STOCK = 0 | Commercial mineral stock at time t is determined by the stock size at time t-dt plus whatever is discovered through time t-dt subtracted whatever is extracted through time t-dt |
The initial commercial mineral stock is set to 0 | |||
EXTRACTION_FROM_COMMERCIAL_MINERAL_STOCK | IF COMMERCIAL_MINERAL_STOCK > COMMITTED_MINING_FLEET*EXTRACTION_PER_MINING_FLEET_UNIT_PER_YEAR THEN COMMITTED_MINING_FLEET*EXTRACTION_PER_MINING_FLEET_UNIT_PER_YEAR ELSE IF COMMERCIAL_MINERAL_STOCK < COMMITTED_MINING_FLEET*EXTRACTION_PER_MINING_FLEET_UNIT_PER_YEAR THEN COMMERCIAL_MINERAL_STOCK ELSE 0 | The extraction of ore from the commercial mineral stock is determined by the number of committed mining units and the extraction per mining unit per year. If the capacity exceeds the remaining reserves, then only the remaining reserves will be extracted | |
EXTRACTION_PER_MINING_FLEET_UNIT_PER_YEAR | 2*OPERATIONAL_EFFICIENCY | The obtainable tonnage of ore per mining unit as this is expected and perceived by participating stakeholders. The parameter corresponds to assessments suggested by Rystad Energy (Rystad 2020) | |
OPERATIONAL_EFFICIENCY | 0,72 | The expected operational up-time of mining units at sea as this is expected and perceived by participating stakeholders. The parameter corresponds to assessments suggested by Rystad Energy (Rystad 2020) | |
“COPPER,_ZINC,_COBALT_MIX_EXTRACTION” | “ORE_GRADE_(MINERAL_CONCENTRATION)”*EXTRACTION_FROM_COMMERCIAL_MINERAL_STOCK | The extraction of copper, zinc, and cobalt is determined by the product of the ore-grade and extraction of ore from the commercial mineral stock | |
EXTRACTION_RATE | “COPPER,_ZINC,_COBALT_MIX_EXTRACTION” | The extraction rate here is not to be confused with the extraction rate of ore. Extraction rate here means the extraction of valuable mineral content. This model considers copper, zinc and cobalt, which makes out defined percentages of the ore extracted | |
TOTAL_EXTRACTION(t) | TOTAL_EXTRACTION(t—dt) + (EXTRACTION_RATE) * dt | INIT TOTAL_EXTRACTION = 0 | The total extraction is determined by the size of the stock in the previous time step plus whatever is extracted through the previous time step |
“ORE_GRADE_(MINERAL_CONCENTRATION)” | 0,04 | 0,05 | 0,06 | The initial total extraction is set to 0 | |
DESIRED_PRODUCTION | COMMERCIAL_MINERAL_STOCK* “DESIRED_PRODUCTION/COMMERCIAL_MINERAL_STOCK” | The desired production is determined by the product of the commercial mineral stock and the desired production relative to the size of the commercial mineral stock | |
“DESIRED_PRODUCTION/COMMERCIAL_MINERAL_STOCK” | 0,5 | The desired production relative to the size of the commercial mineral stock is set to 0.5 | |
DESIRED_TOTAL_COMMITTED_MINING_FLEET | DESIRED_PRODUCTION/EXTRACTION_PER_MINING_FLEET_UNIT_PER_YEAR | The desired fleet committed to mining is determined by the desired production per year and the capacity of one mining unit committed to mining per year | |
TOTAL_MINING_FLEET | AVAILABLE_MINING_FLEET + COMMITTED_MINING_FLEET | The total mining fleet is the sum of mining units committed to mining and available mining units | |
MINING_FLEET_UNDER_CONSTRUCTION(t) | MINING_FLEET_UNDER_CONSTRUCTION(t—dt) + (MINING_UNIT_BUILD_ORDER_RATE—BUILD_COMPLETION_RATE_OF_MINING_UNIT) * dt | INIT MINING_FLEET_UNDER_CONSTRUCTION = 0 | The mining fleet under construction is determined by the size of the stock in the previous time step plus new build orders occurring through the previous time step subtracted the ships that are completed through the previous time step |
MINING_FLEET_COMMISSION_RATE | IF DESIRED_TOTAL_COMMITTED_MINING_FLEET-COMMITTED_MINING_FLEET < 0 THEN (DESIRED_TOTAL_COMMITTED_MINING_FLEET-COMMITTED_MINING_FLEET)/TIME_TO_COMMIT_MINING_FLEET ELSE IF DESIRED_TOTAL_COMMITTED_MINING_FLEET-COMMITTED_MINING_FLEET > 0 AND DESIRED_TOTAL_COMMITTED_MINING_FLEET-COMMITTED_MINING_FLEET < AVAILABLE_MINING_FLEET THEN (DESIRED_TOTAL_COMMITTED_MINING_FLEET-COMMITTED_MINING_FLEET)/TIME_TO_COMMIT_MINING_FLEET ELSE IF DESIRED_TOTAL_COMMITTED_MINING_FLEET-COMMITTED_MINING_FLEET > 0 AND DESIRED_TOTAL_COMMITTED_MINING_FLEET-COMMITTED_MINING_FLEET > AVAILABLE_MINING_FLEET THEN AVAILABLE_MINING_FLEET/TIME_TO_COMMIT_MINING_FLEET ELSE 0 | The initial mining fleet under construction is set to 0 | |
TIME_TO_COMMIT_MINING_FLEET | 1 | The required time to source, negotiate, contractually commit, and mobilize a mining unit for long-term extraction contract. The parameter as this is expected and perceived by participating stakeholders. Participating stakeholders reference commitment of analogues from offshore oil and gas i.e., commitment of FPSOs and drill rigs | |
AVAILABLE_MINING_FLEET(t) | AVAILABLE_MINING_FLEET(t—dt) + (BUILD_COMPLETION_RATE_OF_MINING_UNIT—AVAILABLE_MINING_FLEET_SCRAPPING—MINING_FLEET_COMMISSION_RATE) * dt | INIT AVAILABLE_MINING_FLEET = 0 | Available mining fleet at time t is determined by the available mining fleet at time t-dt plus earlier build orders that are completed through time t-dt subtracted what is scrapped through time t-dt and subtracted what is commissioned to extraction activities through time t-dt |
The initial available mining fleet is set to 0 | |||
MINING_FLEET_GAP | (DESIRED_TOTAL_COMMITTED_MINING_FLEET-TOTAL_MINING_FLEET-MINING_FLEET_UNDER_CONSTRUCTION)* (1-AGRESSIVE_POLICY_SWITCH) + (EXPECTED_DESIRED_FUTURE_MINING_FLEET-TOTAL_MINING_FLEET-MINING_FLEET_UNDER_CONSTRUCTION)*AGRESSIVE_POLICY_SWITCH | ||
MINING_UNIT_BUILD_ORDER_RATE | MAX(MINING_FLEET_GAP + AVAILABLE_MINING_FLEET_SCRAPPING + COMMITTED_MINING_FLEET_SCRAPPING; 0) | The mining fleet unit build order rate is determined by the mining fleet gap, which is the total desired number of committed mining units subtracted the total number of existing mining units, plus whatever units that need replacement to meet/maintain the desired committed mining fleet | |
BUILD_COMPLETION_RATE_OF_MINING_UNIT | DELAY(MINING_UNIT_BUILD_ORDER_RATE; MINING_UNIT_LEAD_TIME) | The build completion rate of mining units is determined by previous order rates and the mining unit lead time, i.e., the time it takes to build a mining unit | |
MINING_UNIT_LEAD_TIME | 2 | The time required to commission, build and deliver a mining unit as this is expected and perceived by participating stakeholders | |
AVAILABLE_MINING_FLEET_SCRAPPING | AVAILABLE_MINING_FLEET/AVERAGE_LIFETIME_OF_MINING_FLEET | The available mining fleet scrapping is an outflow from the available mining fleet. The mining fleet depreciates based on a defined average lifetime. This process is approximately continuous | |
COMMITTED_MINING_FLEET(t) | COMMITTED_MINING_FLEET(t—dt) + (MINING_FLEET_COMMISSION_RATE—COMMITTED_MINING_FLEET_SCRAPPING) * dt | INIT COMMITTED_MINING_FLEET = 0 | Committed mining fleet at time t is determined by the size of the stock at time t-dt plus whatever is commissioned through time t-dt subtracted whatever is scrapped through time t-dt |
The initial committed mining fleet is 0 | |||
COMMITTED_MINING_FLEET_SCRAPPING | COMMITTED_MINING_FLEET/AVERAGE_LIFETIME_OF_MINING_FLEET | The committed mining fleet scrapping is an outflow from the committed mining fleet. The mining fleet depreciates based on a defined average lifetime. This process is approximately continuous | |
AVERAGE_LIFETIME_OF_MINING_FLEET | 15 | The expected average lifespan of deep-sea mining units. Dependent on utilization, maintenance, initial quality, operating environment and more. The parameter is informed by Rystad Energy (2020) and corroborated by participating experts/stakeholders | |
Economics | |||
|---|---|---|---|
Variablesand parameters | Equations | Properties | Comments |
DISCOUNTED_PROFITS(t) | DISCOUNTED_PROFITS(t—dt) + (DISCOUNTED_PROFIT_RATE) * dt | INIT DISCOUNTED_PROFITS = 0 | Total discounted profits at time t are determined by the discounted profits at the previous time step plus the discounted profit rate occurring through the previous time step |
The initial total discounted profits are set to 0 | |||
DISCOUNTED_PROFIT_RATE | DISCOUNT_FACTOR*(REVENUE_RATE-MINING_CAPEX_RATE-MINING_OPEX_RATE-EXPLORATION_CAPEX_RATE-EXPLORATION_OPEX_RATE-REGIONAL_SURVEY_CAPEX_RATE-REGIONAL_SURVEY_OPEX_RATE) | The discounted profit rate is determined by a product of the discount rate and the net profits, which is calculated based on the revenue and cost rates, including both operational and capital expenditure | |
DISCOUNT_FACTOR | 1/(1 + DISCOUNT_RATE)^TIME | The discount factor is calculated according to the equation on the left | |
DISCOUNT_RATE | 0,1 | The discount rate is set to 10% | |
REVENUE_RATE | “PRE-PROCESSED_PRICE”*EXTRACTION_FROM_COMMERCIAL_MINERAL_STOCK | The revenue rate is determined by the product of the pre-processed price of ore and the extraction of ore from the mineral stock | |
“PRE-PROCESSED_PRICE” | “PRICE_OF_PROCESSED_MINERALS_IN_END-MARKET”* “PRE-PROCESSED_FACTOR_FOR_PRICE_CALCULATION” | The pre-processed price of minerals is calculated as the product of the price of processed minerals in the end market and an adjusting factor | |
“PRICE_OF_PROCESSED_MINERALS_IN_END-MARKET” (t) | “PRICE_OF_PROCESSED_MINERALS_IN_END-MARKET” (t—dt) + (NET_CHANGE_IN_PRICE) * dt | INIT”PRICE_OF_PROCESSED_MINERALS_IN_END-MARKET" = PRICE_BASIS*1,000,000 | The price of processed minerals in the end market is used as part of the calculation of the price that miners get for their product in the model. In other words, this is not the final price that miners receive for their production in the model. The price of processed minerals in the end market is determined by the size of the stock in the previous period plus the net change in price occurring through the previous time step. This structure allows for changes in price, for example growth in price over time. However, the net change in price in the model is zero in all simulations presented here |
PRICE_BASIS | 38,808 | The price basis is derived by calculation of the weighted deflated average monthly future price of copper, zinc, and cobalt in the period April 2010 to March 2022. The copper, zinc, and cobalt weights used are 0.778, 0.167, and 0.056, respectively. The future prices are retrieved from https://www.investing.com/commodities/copper-historical-data, https://www.investing.com/commodities/zinc-futures-historical-data, and https://www.investing.com/commodities/cobalt. Monthly inflation data from https://fred.stlouisfed.org/series/CPIAUCSL have been used to deflate the future prices | |
“PRE-PROCESSED_FACTOR_FOR_PRICE_CALCULATION” | (1- “PROCESSING'S_PERCENTAGE_OF_END-MARKET_PRICE”)* “ORE_GRADE_(MINERAL_CONCENTRATION)” | The pre-processed factor for price calculation is an adjusting factor used in the price calculation. This is calculated as 1 subtracted the processing sector’s percentage of the end-market price. The resulting share of the end-market price is then multiplied by the mineral percentage | |
“PROCESSING’S_PERCENTAGE_OF_END-MARKET_PRICE” | 0,5 | The fraction of end-market value of mineral bulk retained by offshore exploration/extraction sector of industry. The parameter is suggested by participating experts/stakeholders | |
MINING_CAPEX_RATE | BUILD_COST_PER_PRODUCTION_SUPPORT_VESSEL*MINING_UNIT_BUILD_ORDER_RATE | The mining capital expenditure rate is determined by the product of the build cost per production support vessels and the order rate of such vessels | |
BUILD_COST_PER_PRODUCTION_SUPPORT_VESSEL | 1,000,000,000 | The cost of procuring and commissioning deep-sea mining unit. The parameter is suggested by Rystad Energy (2020) and calibrated upwards based on input from participating experts/stakeholders | |
MINING_OPEX_RATE | YEARLY_RATE_FOR_PRODUCTION_SUPPORT_VESSELS*COMMITTED_MINING_FLEET | The operational expenditure tied to mining is determined by the product of the number of committed mining units and the yearly rate for production units | |
YEARLY_RATE_FOR_PRODUCTION_SUPPORT_VESSELS | 150,000,000 | The annual cost of deep-sea mining units. The parameter is suggested by Rystad Energy (2020) and corroborated by participating experts/stakeholders | |
EXPLORATION_CAPEX_RATE | IF “SHIPS_FOR_HI-RES,_CORING_AND_EIA_BUILD_ORDER_RATE” > 0 THEN “AVERAGE_COST_OF_NEW_HI-RES,_CORING,_EIA_SHIP”* “SHIPS_FOR_HI-RES,_CORING_AND_EIA_BUILD_ORDER_RATE” ELSE 0 | The capital expenditure for high-resolution survey, coring, and environmental impact assessment ships are calculated based on the corresponding build order rate and the average cost of a new build | |
“AVERAGE_COST_OF_NEW_HI-RES,_CORING,_EIA_SHIP” | 100,000,000 | The cost of procuring and commissioning multi-purpose vessel new builds. The parameter is based on input from participating experts/stakeholders | |
EXPLORATION_OPEX_RATE | “HI-RES_OPEX_RATE” + CORING_OPEX_RATE + EIA_OPEX_RATE | The operational expenditures tied to high-resolution surveys, coring, and environmental impact assessment rates are calculated as the sum of the operational expenditure tied to each activity | |
“HI-RES_OPEX_RATE” | “YEARLY_RATE_FOR_HI-RES_SHIP”* “SHIPS_COMMITTED_TO_HI-RES” | The operational expenditure tied to high-resolution surveys is determined by the number of committed ships to this activity and the yearly rate for ships committed to the activity | |
“YEARLY_RATE_FOR_HI-RES_SHIP” | 140,000*28*6 | The average annual cost of operating multi-purpose vessels. The parameter is based on input from participating experts/stakeholders | |
CORING_OPEX_RATE | YEARLY_RATE_FOR_CORING_SHIP*SHIPS_COMMITTED_TO_CORING | The operational expenditures tied to coring is determined by the yearly rate for a coring ship multiplied by the number of ships committed to coring | |
YEARLY_RATE_FOR_CORING_SHIP | 140,000*28*6 | The average annual cost of operating multi-purpose vessels. The parameter is based on input from participating experts/stakeholders | |
EIA_OPEX_RATE | YEARLY_RATE_FOR_EIA_SHIP*SHIPS_COMMITTED_TO_EIA | The operational expenditures tied to environmental impact assessment surveys are determined by the yearly rate for such a ship committed to such an activity multiplied by the number of ships committed to the activity | |
YEARLY_RATE_FOR_EIA_SHIP | 140,000*28*6 | The average annual cost of operating multi-purpose vessels. The parameter is based on input from participating experts/stakeholders | |
REGIONAL_SURVEY_CAPEX_RATE | AVERAGE_COST_OF_REGIONAL_SURVEY_SHIP*REGIONAL_SURVEY_BUILD_ORDER_RATE | The capital expenditure tied to the regional survey activity is determined by the product of the average cost of a regional survey ship and the regional survey ship build order rate | |
AVERAGE_COST_OF_REGIONAL_SURVEY_SHIP | 35,000,000 | The cost of procuring and commissioning survey-vessel new-builds. The parameter is based on input from participating experts/stakeholders | |
REGIONAL_SURVEY_OPEX_RATE | YEARLY_RATE_OF_REGIONAL_SURVEY_SHIP*SHIPS_COMMITTED_TO_REGIONAL_SURVEY | The operational expenditure tied to the regional survey activity is determined by the product of the yearly rate of ships committed to such activity and the number of ships committed to the activity | |
YEARLY_RATE_OF_REGIONAL_SURVEY_SHIP | 82,500*365*0,5 | The average annual cost of operating regional survey vessels. The parameter is based on input from participating experts/stakeholders | |
Policy-assisting variables | |||
|---|---|---|---|
Variables and parameters | EquationS | Properties | Comments |
STOCHASTIC_SWITCH | 0 | 1 | This is a switch to turn on/off stochastic features in the model. It can take the value of 0 or 1. 0 activates the “Wait and See” policy setting, while 1 activates the “Anticipatory” policy setting | |
EXPECTED_COMMERCIAL_MINERAL_STOCK_IN_THREE_YEARS | EXPECTED_COMMERCIAL_MINERAL_STOCK_IN_TWO_YEARS + CORING_WITH_DESIRABLE_OUTCOME*EXPECTED_AVERAGE_MILLION_TONS_ORE_PER_KM2_PER_DISCOVERY-EXPECTED_DESIRED_PRODUCTION_IN_TWO_YEARS | Input variable for the “Anticipatory” policy setting | |
EXPECTED_COMMERCIAL_MINERAL_STOCK_IN_TWO_YEARS | EXPECTED_COMMERCIAL_MINERAL_STOCK_IN_ONE_YEAR + EIA_RATE*EXPECTED_AVERAGE_MILLION_TONS_ORE_PER_KM2_PER_DISCOVERY-EXPECTED_DESIRED_PRODUCTION_IN_ONE_YEAR | Input variable for the “Anticipatory” policy setting | |
EXPECTED_DESIRED_AREA_COVERED_BY_CORING_IN_TWO_YEARS | ((PROSPECT_AREA_FOR_CORING + “HI-RES_SURVEY_WITH_DESIRABLE_OUTCOME”-CORING_RATE)-(PROSPECT_AREA_FOR_CORING + “HI-RES_SURVEY_WITH_DESIRABLE_OUTCOME”-CORING_RATE)*DESIRED_SHARE_OF_TOTAL_CORING_AREA_COVERED_BY_CORING_PER_YEAR + “HI-RES_SURVEY_RATE”* “EXPECTED_PERCENTAGE_OF_HI-RES_SURVEY_AREA_WITH_DESIRABLE_OUTCOME “)*DESIRED_SHARE_OF_TOTAL_CORING_AREA_COVERED_BY_CORING_PER_YEAR | Input variable for the “Anticipatory” policy setting | |
EXPECTED_DESIRED_AREA_COVERED_BY_EIA_IN_TWO_YEARS | ((AREA_WITH_CONFIRMED_ORE + CORING_WITH_DESIRABLE_OUTCOME-EIA_RATE)-(AREA_WITH_CONFIRMED_ORE + CORING_WITH_DESIRABLE_OUTCOME-EIA_RATE)*DESIRED_SHARE_OF_TOTAL_EIA_AREA_COVERED_BY_EIA_PER_YEAR + CORING_RATE*EXPECTED_PERCENTAGE_OF_CORING_AREA_WITH_DESIRABLE_OUTCOME)*DESIRED_SHARE_OF_TOTAL_EIA_AREA_COVERED_BY_EIA_PER_YEAR | Input variable for the “Anticipatory” policy setting | |
“EXPECTED_DESIRED_AREA_COVERED_BY_HI-RES_IN_TWO_YEARS” | (((“PROSPECT_AREA_FOR_HI-RES_SURVEY” + REGIONAL_SURVEY_WITH_DESIRABLE_OUTCOME- “HI-RES_SURVEY_RATE”) -(“PROSPECT_AREA_FOR_HI-RES_SURVEY” + REGIONAL_SURVEY_WITH_DESIRABLE_OUTCOME- “HI-RES_SURVEY_RATE")* “DESIRED_SHARE_OF_TOTAL_HI-RES_AREA_COVERED_BY_HI-RES_PER_YEAR” + REGIONAL_SURVEY_RATE*EXPECTED_PERCENTAGE_OF_SURVEY_AREA_WITH_DESIRABLE_OUTCOME)* “DESIRED_SHARE_OF_TOTAL_HI-RES_AREA_COVERED_BY_HI-RES_PER_YEAR”) | Input variable for the “Anticipatory” policy setting | |
EXPECTED_DESIRED_FUTURE_MINING_FLEET | EXPECTED_DESIRED_FUTURE_PRODUCTION/EXTRACTION_PER_MINING_FLEET_UNIT_PER_YEAR | Input variable for the “Anticipatory” policy setting | |
EXPECTED_DESIRED_FUTURE_PRODUCTION | EXPECTED_DESIRED_PRODUCTION_IN_THREE_YEARS | Input variable for the “Anticipatory” policy setting | |
EXPECTED_DESIRED_PRODUCTION_IN_ONE_YEAR | “DESIRED_PRODUCTION/COMMERCIAL_MINERAL_STOCK”*EXPECTED_COMMERCIAL_MINERAL_STOCK_IN_ONE_YEAR | Input variable for the “Anticipatory” policy setting | |
EXPECTED_DESIRED_PRODUCTION_IN_THREE_YEARS | “DESIRED_PRODUCTION/COMMERCIAL_MINERAL_STOCK”*EXPECTED_COMMERCIAL_MINERAL_STOCK_IN_THREE_YEARS | Input variable for the “Anticipatory” policy setting | |
EXPECTED_DESIRED_PRODUCTION_IN_TWO_YEARS | “DESIRED_PRODUCTION/COMMERCIAL_MINERAL_STOCK”*EXPECTED_COMMERCIAL_MINERAL_STOCK_IN_TWO_YEARS | Input variable for the “Anticipatory” policy setting | |
EXPECTED_DESIRED_SHIPS_COMMITTED_TO_CORING_IN_TWO_YEARS | EXPECTED_DESIRED_AREA_COVERED_BY_CORING_IN_TWO_YEARS/ (MAXIMUM_NUMBER_OF_CORING_CAMPAIGNS_PER_SHIP_PER_YEAR*AREA_CONCLUDED_PER_CORING_CAMPAIGN) | Input variable for the “Anticipatory” policy setting | |
EXPECTED_DESIRED_SHIPS_COMMITTED_TO_EIA_IN_TWO_YEARS | EXPECTED_DESIRED_AREA_COVERED_BY_EIA_IN_TWO_YEARS/ “HI-RES_SURVEY_SHIP_KM2/MONTH”*EIA_AREA_AMPLIFIER | Input variable for the “Anticipatory” policy setting | |
“EXPECTED_DESIRED_SHIPS_FOR_HI-RES_IN_TWO_YEARS” | “EXPECTED_DESIRED_AREA_COVERED_BY_HI-RES_IN_TWO_YEARS”/ “HI-RES_SURVEY_SHIP_KM2/MONTH” | Input variable for the “Anticipatory” policy setting | |
Seed variables used in Monte Carlo runs | |||
|---|---|---|---|
Variables and parameters | Equations | Properties | Comments |
SEED_CORING | RANDOM GENERATED VALUE | Seed variable | |
“SEED_HI-RES_SURVEY” | RANDOM GENERATED VALUE | Seed variable | |
SEED_OCCURENCE | RANDOM GENERATED VALUE | Seed variable | |
SEED_REGIONAL_SURVEY | RANDOM GENERATED VALUE | Seed variable | |
Simulation run specs
Total | Count | Including array elements |
|---|---|---|
Variables | 191 | 191 |
Stocks | 37 | 37 |
Flows | 49 | 49 |
Converters | 105 | 105 |
Constants | 50 | 50 |
Equations | 104 | 104 |
Graphicals | 0 | 0 |
Run specs | |
|---|---|
Start time | 0 |
Stop time | 60 |
DT | 1/1000 |
Fractional DT | True |
Save interval | 0,001 |
Sim duration | 0 |
Time Units | Years |
Pause interval | 0 |
Integration method | Euler |
Keep all variable results | True |
Run by | Run |
Calculate loop dominance information | False |
Appendix 2
EXPERT INTERVIEWS
(name and affiliation anonymized)
Name | Category | Expert Field | Affiliation | |
|---|---|---|---|---|
1 | N/A | Industry | Geoscience + technology | N/A |
2 | N/A | Science | Geoscience | N/A |
3 | N/A | Industry | Incubator | N/A |
4 | N/A | Science | Geoscience + incubator | N/A |
5 | N/A | Industry | Technology | N/A |
6 | N/A | Industry | Technology + geoscience + policy | N/A |
7 | N/A | Industry | Risk management | N/A |
8 | N/A | Industry | Geoscience + technology | N/A |
9 | N/A | Government | Policy | N/A |
10 | N/A | Government | Policy | N/A |
11 | N/A | Science | Geoscience | N/A |
13 | N/A | Science | Geoscience | N/A |
14 | N/A | Industrial-media | Geoscience | N/A |
15 | N/A | Industry | Technology | N/A |
16 | N/A | Industry | Business development | N/A |
17 | N/A | Industry | Technology | N/A |
18 | N/A | Industry | Business development | N/A |
19 | N/A | Industry | Geoscience | N/A |
20 | N/A | Industry | Geoscience | N/A |
Appendix 3
INTERVIEW GUIDE
Participant: < INSERT >
Time/Place: < INSERT >
# | Interview step | Respondent | Comment/observation |
|---|---|---|---|
1 | Introduce authors | ||
2 | Declaration of intent - This is a research project. Respondents will be anonymous. Potentially identified in general terms: i.e., “Representative from an E&P company,” “Academic Researcher,” “Cluster representative” etc | ||
3 | Purpose of the research project - Map and understand the emerging structure regarding exploration and extraction in deep-sea mining - Stakeholder expectation to resource potential and economic potential - Explore policy space | ||
4 | Purpose of interview - Elicit information from stakeholders - Identify model structure shortcomings or errors - Identify missing structures/relationships - Identify unnecessary structure and detail - Elicit parameter values - Elicit information about uncertainty/distributions | ||
5 | Describe work up until this point -Observation of industry -GMB sessions: with students, with NOSP -Seed model development -First round of interviews completed | ||
6 | Short Intro to SD/SFD - Build simple model to introduce the building blocks in system dynamics modeling (simple example from population dynamics) | ||
7 | Introduce model by sectors -Exploration main motor -Exploration fleet -Extraction fleet -Show model run | ||
8 | Introduce exploration sector - Is the structure sound? - Any missing elements? - Any missing feedback - Is something superfluous? - Parameter values? - Uncertainty? | ||
9 | Introduce exploration fleet sector - Is the structure sound? - Any missing elements? - Any missing feedback - Is something superfluous? - Parameter values? - Uncertainty? | ||
10 | Introduce extraction fleet sector - Aggregated representation - Is the structure sound? - Any missing elements? - Any missing feedback - Is something superfluous? - Parameter values? - Uncertainty? | ||
11 | Ask about… - Thoughts on permitting policies | ||
12 | Any other comments? |
Rights and permissions
Open Access This article is licensed under a Creative Commons Attribution 4.0 International License, which permits use, sharing, adaptation, distribution and reproduction in any medium or format, as long as you give appropriate credit to the original author(s) and the source, provide a link to the Creative Commons licence, and indicate if changes were made. The images or other third party material in this article are included in the article's Creative Commons licence, unless indicated otherwise in a credit line to the material. If material is not included in the article's Creative Commons licence and your intended use is not permitted by statutory regulation or exceeds the permitted use, you will need to obtain permission directly from the copyright holder. To view a copy of this licence, visit http://creativecommons.org/licenses/by/4.0/.
About this article

Cite this article
Bang, R.N., Trellevik, LK.L. Perspectives on exploration and extraction of seafloor massive sulfide deposits in Norwegian waters. Miner Econ (2022). https://doi.org/10.1007/s13563-022-00346-y
Received:
Accepted:
Published:
DOI: https://doi.org/10.1007/s13563-022-00346-y