
Abstract
Advances in our knowledge of cardiovascular disorders coupled with technological innovations have enabled the increased use of minimally invasive cardiovascular surgeries and transcatheter interventions, with resultant reduced morbidity and hospital stay. Three-dimensional imaging, particularly computed tomography (CT) is increasingly used for patient selection, providing a roadmap of the anatomy and identifying factors that may complicate these procedures. Advantages of CT are the rapid turnaround time, good spatial and temporal resolutions, wide field of view and three-dimensional multi-planar reconstruction capabilities. This pictorial review describes the role of CT in the pre-operative evaluation of patients undergoing cardiovascular surgeries and intervention.
Main Messages
• CT scan is valuable in pre-operative evaluation for cardiac surgeries
• Cardiovascular structures, including bypass grafts should be located >10 mm from the sternum in patients for reoperative cardiothoracic surgeries
• Knowledge of variations in pulmonary venous anatomy are essential for planning radiofrequency ablation
Introduction
Advances in our knowledge of cardiovascular diseases coupled with technological innovations have enabled the increased use of minimally invasive cardiovascular surgical approaches and trans-catheter interventions, with resultant reduced morbidity and hospital stay. During minimally invasive and trans-catheter procedures, unlike surgical procedures, pre-operative findings cannot be confirmed by direct visualisation of the structures. Therefore imaging plays an increasingly important role in the pre-procedural evaluation of patients and for peri-procedural imaging guidance [1].
Echocardiography is often the first imaging modality used in the evaluation of these patients, particularly for valvular surgery or vascular intervention. It has high temporal resolution (50 ms) and good spatial resolution [2]. However, it has a limited field-of-view to evaluate the entire cardiovascular anatomy, particularly extra-cardiac structures. Conventional angiography has excellent spatial resolution in the evaluation of aorta and coronary arteries, but does not have three-dimensional (3D) capabilities to determine the relationship of vascular structures to each other and with adjacent structures, such as the sternum, lung and mediastinum.
Magnetic resonance imaging (MRI) has good spatial resolution and a wide field-of-view, but limited by long scan times and is not suitable in patients with claustrophobia, anxiety and other contraindications. Computed tomography (CT) is increasingly used in the evaluation of these patients. CT routinely acquires 3D datasets with a wide field of view that enable comprehensive assessment of the extra-cardiac anatomy with good spatiotemporal resolutions and multi-planar reconstruction capabilities (Table 1). Limitations of CT include use of potentially nephrotoxic iodinated contrast media and radiation exposure.
Although imaging is extensively used for pre-operative and procedural planning, it should be emphasised that there are inadequate data to demonstrate improved clinical outcome due to use of pre-operative imaging. Large clinical trials are necessary to establish the benefit of pre operative imaging. This task is further made difficult by the fact that there is no clear data establishing improvement in outcomes for most of the emerging percutaneous procedures [1].
In this pictorial review, the role of CT in the evaluation of patients undergoing cardiovascular surgeries and interventions is described and illustrated. Critical parameters required by the surgeons or interventionalists are highlighted.
CT techniques
A detailed discussion of CT scanner and acquisition technique is beyond the purpose of this review. However, it is worthwhile to mention that the more recent concern about radiation exposure has stimulated a focus on dose saving techniques. The use of retrospective electrocardiography (ECG)-gated acquisition (with dose modulation) is mostly limited to situations when information from all the phases of cardiac cycle is required, particularly for 4D imaging. Another indication is a patient with high and irregular heart rate. In most other instances, prospective ECG triggering is used, which is associated with significant reduction in radiation dose. Non-ECG-gated scanning is used to reduce radiation dose if motion artefact is not a major concern, e.g. for left atrial assessment in patients with atrial fibrillation. Imaging with reduced tube voltage (100 kV) and iterative reconstruction techniques also allow reducing radiation dose. In patients with significant renal dysfunction, non-contrast ECG-gated CT of the chest can be performed to assess the relationship of cardiovascular structures to sternum.
Post-processing techniques
Various post-processing techniques are used in the assessment of complex cardiovascular anatomy.
2D
Evaluation of cardiovascular structures begins by analysis of 2D axial source images. Further reconstruction and post processing can be performed once an abnormality or area of interest is detected in these images.
Multiplanar reconstruction (MPR)
Data obtained from axial CT scans can be reconstructed in any desired plane, orthogonal or oblique relative to body axis, including standard planes used in echocardiography and conventional angiography. Data acquired with sub-millimetre slice thickness (isotropic datasets) allow oblique reconstruction without decrease in spatial resolution. Curved MPR is used to reconstruct curved planes of tortuous structures by placing seed points on the structure. The course and shape of plane is defined by the centreline of vascular structures and the images can be rotated around the centre-line.
Maximum intensity projection (MIP)
In MIP, the algorithm selects the maximum voxel value along any plane, which is then determined as the value of the display pixel. Information on a stack of MPR images is displayed in a single plane to create an image similar to conventional angiography. The thickness of the slab can be altered depending on the structure evaluated. However, depth is not appreciated, making assessing of 3D relationships difficult. Since it displays only the maximum signal intensity, calcification will dominate the image appearance. Volume averaging artefacts are seen, since the background mean is increased making visualisation of small vessels difficult.
Surface shaded display
Surface-shaded display is a 3D representation of the surface of a structure. Based on a defined threshold volume, each voxel within the dataset is determined to be either part or not part of the object of interest, thus defining the surface. All the other data are discarded and the surface contour is modelled as a collection of polygons with surface shading.
Endoluminal view/Virtual endoscopy
This is a variation of the surface shaded display. Once the high attenuation voxels of the contrast media are removed, contrast filled chambers and vessels will appear as hollow structures, which enables visualisation of endoscopic view of various organs and vessels.
Volume rendering
In volume rendering, the entire volume of the dataset is used for creating the final 3D image. Depending on the object of interest, images can be displayed with variable levels of opacity, surface shading and perspective. Specific structures can be highlighted and displayed, depending on the clinical need. Although volume rendering is superior to surface shading, it should not be used for quantification since the appearance of image can be easily altered by modifying the settings.
4D rendering
Images acquired in multiple cardiac phases using a restrospectively ECG-gated acquisition are displayed as a cine loop. Any object of interest can be visualised in any desired projection. This enables functional assessment of cardiac valves and chambers, albeit with lower temporal resolution than echocardiography. Four-dimensional imaging is very useful in providing realistic stimulation of the entire valvular apparatus prior to surgery.
Image fusion/co-registration
Fusion of images acquired using two different modalities can be useful in selective applications. During radiofrequency (RF) ablation of pulmonary veins for atrial fibrillation, volume rendered 3D images of the left atrium and pulmonary vein obtained using pre-procedural CT are fused with electrical activity maps obtained by catheterisation to provide an electro-anatomical map, that enables real time guidance for the electrophysiology (EP) catheter and may reduces fluoroscopy time. Three-dimensional CT data can also be fused with 3D data acquired from a C-arm-based X-ray angiography system, with subsequent automatic registration to 2D fluoroscopy images during the procedure. This is helpful in various interventional procedures since lesion detection and quantification are better in the 3D volume images, particularly at bifurcations, and complex views not possible in angiography without the problems of foreshortening [1, 3].
Re-operative cardiothoracic surgery
Re-operative cardiothoracic surgery is associated with higher morbidity and mortality than the primary surgery because of the typically more advanced nature of the underlying disease and the frequent presence of high risk anatomical features secondary to the previous surgery. Pre-operative identification of these features enables the surgeon to modify the surgical approach to avoid complications. MDCT is performed from the thoracic inlet to the diaphragmatic dome to include the origin of internal mammary grafts from subclavian artery. Three-millimetre images are typically acquired using prospective ECG triggering, but non-contrast ECG-gated images can be used if the renal function is very low to allow use of iodinated contrast media.
-
1.
Relationship of cardiovascular structures to sternum
The relationship of brachiocephalic vessels, aorta, right ventricle and pericardium to the midline sternum is assessed in axial or reconstructed sagittal or volume rendered images. Chamber enlargement, aneurysm, pectus excavatum deformity and adhesions from previous surgery or radiation bring these structures close to sternum. Ten millimetres is considered a safe distance from the sternal midline (Fig. 1). Close proximity or adhesion of these structures to the sternum (Fig. 2) increases the risk of injury during midline sternotomy. The point of proximity to midline sternum is often described in relation to the closest sternal wire. Knowledge of the anatomy helps the surgeon in planning the surgery, including altered approach, or a more superior extensive dissection prior to sternotomy or initiation of cardiopulmonary bypass before sternotomy.
Fig. 1 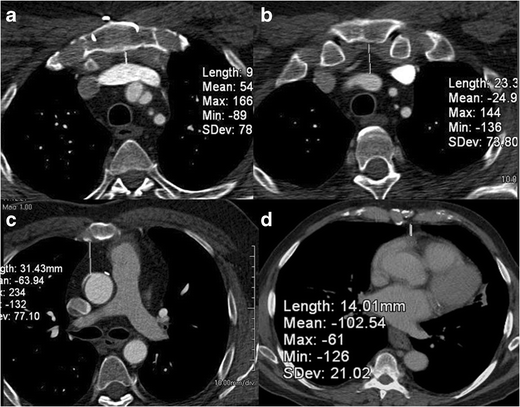
Relationship of cardiovascular structure to sternum. Axial CT scans in a 67-year-old man, who was being evaluated for re-operative cardiothoracic surgery. The distance between the midline sternum and the brachiocephalic vein (a), brachocephalic artery (b), ascending aorta (c) and the right ventricle (d) have been measured in these images
Fig. 2 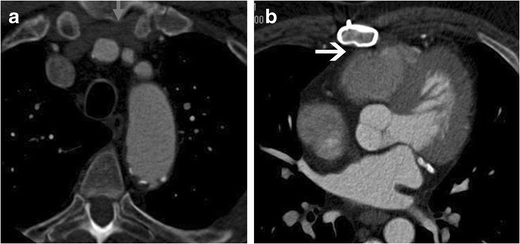
Close proximity of cardiovascular structures to the sternum. a Axial CT scan in a 72-year-old man for re-operative cardiothoracic surgery shows close proximity of the left brachiocephalic vein (arrow) to the midline sternum, lying directly under the sternal midline. b Axial CT scan at a lower level in the same patient shows the right ventricle and pericardium, lying adherent to the midline sternum (arrow)
-
2.
Relationship of coronary bypass grafts to sternum
Since patients with coronary bypass grafts, particularly those with LIMA (left internal mammary) grafts are highly dependent on the graft for cardiac function, injury to the graft can be potentially fatal [4]. Of re-operative surgeries, 5.3 % are complicated by internal mammary artery injury, which has mortality of 9–50 % [5]. The internal mammary grafts usually run anteriorly and inferiorly from subclavian origin, typically anastomosing to the LAD (Fig. 3). In an attempt to prevent sternal adhesion, the LIMA graft is frequently routed through the left pericardial slit, but may be medially displaced by adhesions. RIMA (right internal mammary) grafts and aorto-coronary grafts to the left coronary system typically cross the midline behind sternum to reach the distal anastomosis, making them prone to injury (Fig. 4). Saphenous venous grafts are usually anastomosed in an end to side fashion with the ascending aorta. Although they are typically at a safe distance from the sternum, RV enlargement, large aortic aneurysm or altered anatomy by mediastinal adhesions can bring them close to the sternum. In addition to injury, manipulation of saphenous grafts, which are prone to atherosclerosis, can result in embolic shower into the distal circulation, causing myocardial infarction. A bypass graft that crosses the midline and located <1 cm from the sternum or adherent to the sternum is at high risk of injury when the sternum is opened and the surgeon should be alerted about this finding. To avoid injury to grafts, alternative approaches may have to be used, such as lateral thoractomy.
Fig. 3 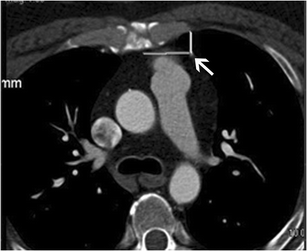
Relationship of coronary bypass graft to the sternum. Axial CT scan in a 68-year-old man shows the LIMA (left internal mammary artery) to LAD (left anterior descending artery) coronary bypass graft coursing under the left chest wall at a safe distance from the left chest wall (arrows)
Fig. 4 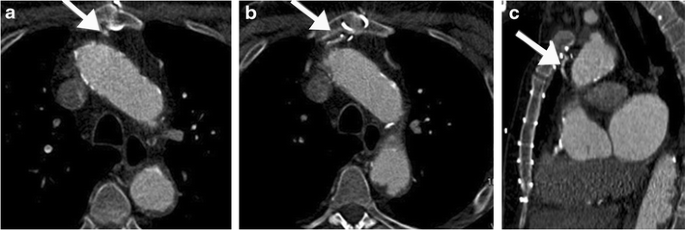
Close proximity of coronary bypass graft to the sternal midline. Axial (a, b) and sagittal CT reformats (c) of a 74-year-old man being evaluated for re-operative cardiothoracic surgery show a RIMA (right internal mammary artery) graft crossing the midline, lying directly under the sternum at the level of the 3rd sternal wire, making it at high risk of injury if median sternotomy is performed
-
3.
Atherosclerotic calcification in the ascending aorta
During cardiopulmonary bypass, continuous antegrade cerebral perfusion is maintained through direct cannulation of the ascending aorta. However, extensive atherosclerotic calcification of the ascending aorta (porcelain aorta) precludes cannulation due to associated high risk of plaque dislodgement that may result in cerebrovascular accidents. There is an 8.7 % risk of peri-operative stroke in patients with calcification compared with those without [6], which is the major cause of post-operative morbidity and mortality in cardiac surgery [7]. The risk is lower in complete than partial cross clamping during surgery [6]. Calcification can be evaluated in axial images or sagittal reformatted images or volume rendered images (Fig. 5)
Fig. 5 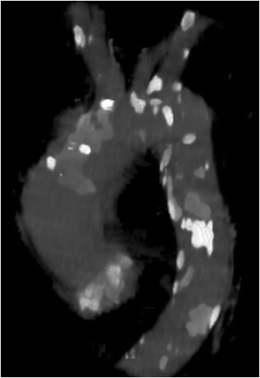
Volume rendered CT image of the aorta shows extensive calcification in the aorta and its branch vessels. The extensive calcification in the ascending aorta may preclude cannulation due to the associated risk of embolus
-
4.
Anatomy of subclavian & axillary arteries and the arch
In the presence of extensive atherosclerotic disease of the ascending aorta, alternative sites are used for cannulation or surgical side grafts. Axillary or subclavian arteries are used [4] due to lower incidence of athero-emboli and lower risk of micro-emboli during bypass [8]. Assessment of the anatomy of these vessels, including variations, atherosclerosis and stenosis is essential prior to surgery. Axillary artery cannulation is performed by clamping the base of the innominate artery with antegrade cerebral perfusion through the right common carotid artery and perfusion of contralateral cerebral hemisphere through an intact Circle of Willis. Presence of a bovine variant (common origin of brachiocephalic artery and left common carotid artery) enables bilateral antegrade common carotid antegrade perfusion with a single cannulation, regardless of the integrity of Circle of Willis. A left-sided arch with aberrant right subclavian artery or a right-sided arch are not ideal for right axillary cannulation, due to perfusion of descending aorta in the first scenario and separate origin of right subclavian and right common carotid arteries in the second scenario [4].


Various studies have evaluated the impact of the above-mentioned findings in the management of re-operative cardiothoracic surgery patients. Roselli et al. [9] reported reduced injury to internal mammary artery during reoperation (3 %) following pre-operative imaging. Kamdar et al. [10] observed a high risk finding in 49 % of pre-surgical patients, with 38 % having a coronary bypass graft passing the midline/adherent to sternum, and 24 % having the RV or aorta close or adherent to sternum. The surgical approach was altered in 55 % of these patients, including non-midline incision, peripheral cardiopulmonary bypass, deep hypothermic circulatory arrest, extrathoracic vascular exposure prior to surgery or in rare cases avoidance of surgery. The clinical outcome of the impact of imaging and altered surgical approach has not been evaluated yet. Maluenda et al. [11], in a non-randomised trial of 364 surgical patients showed a reduced incidence of peri-operative death, myocardial infarction, stroke, haemorrhage and also shorter perfusion, cross clamp time, total time in ICU and lower post operative RBC transfusion in patients who had pre-surgical CT.
Percutaneous aortic valve implantation (TAVI)
While standard open-heart aortic valve replacement is a well-established and effective treatment for symptomatic patients with severe stenosis, a large percentage of older patients with multiple co-morbidities are excluded because of high surgical risk. For these inoperable/high risk patients, percutaneous transcatheter valve implantation has developed into a viable alternative with improved outcome relative to medical management [12, 13]. The valve can be implanted through a choice of transfemoral, subclavian, transaortic or transapical (through LV apex) approach. Due to its high temporal and spatial resolution, echocardiography provides most of the information required for selecting the appropriate device [2]. Contrast-enhanced CT scans have high spatial resolution (0.4–0.6 mm) and good temporal resolution (75–250 ms) to assess valve morphology, including subvalvular structures [2]. Typically, contrast-enhanced ECG-gated images of the aortic root to evaluate leaflet excursion and coaptation are performed [1], and non-ECG-gated images of the chest, abdomen and pelvis to assess the entire aorta. In patients with renal dysfunction, non-contrast studies or low-dose intra-arterial contrast injection are preferred. CT is useful in patient selection, determining factors vital for planning the procedure and determining the optimal access.
-
1.
Dimensions of aortic root
There is wide variability in the size of the aortic root, which may be affected by aortic root remodelling in aortic stenosis [14]. Accurate measurement of the annulus, sinus and sinotubular junction is essential to select the appropriate sized device (Fig. 6a). The aortic annulus has an ellipsoid configuration, with larger coronal than sagittal diameters (Fig. 6b). Accurate measurement of the annulus is necessary to avoid mismatch between annulus and prosthesis. Placement of a large valve in a small annulus might result in rupture or AV block [15]. In contrast, placement of a small valve in a large aortic annulus has been shown to be associated with increased risk of post-procedural aortic regurgitation [16] and device dislocation [17]. For Edwards-Sapien valves, the annulus should be between 18 and 27 mm and for CoreValve device, it should be between 18 and 29 mm [12]. Measurement of the annulus is performed meticulously at the plane of virtual basal ring, which is exactly aligned with the three most caudal insertion points of the aortic cusp [18, 19]. Annulus is measured from double oblique multiplanar reconstructions with two orthogonal planes, which represent the short and long axis of the virtual basal ring [19]. The diameter can be derived as a mean of the minimal and maximal diameters or derived from circumference or area of the annulus. There are also specific measurements for the width and length of the sinotubular junction and the diameter of the ascending aorta (4 cm from the annulus) for a CoreValve device (SCCT 19).
Fig. 6 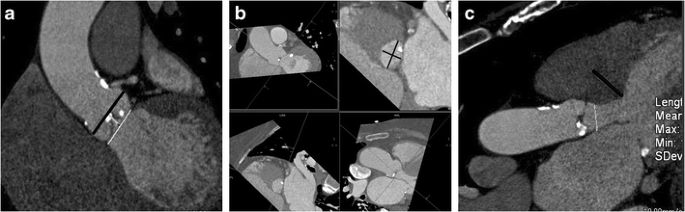
a Coronal oblique CT image shows the maximal diameters of the sinus (black line) and annulus (white line). The distance from annulus to sinus is also measured. These measurements are essential for determining prosthesis size. Annulus prosthesis mismatch is a common cause of paravalvular leak. b Double-oblique reconstruction at the level of aortic annulus and measurement of minimal and maximal aortic diameters (black lines). These measurements, along with echocardiographic measurements are used in device sizing. c Three-chamber view shows measurement of the LVOT diameter and septal thickness. If the LVOT diameter is small or if the septum is thick, placement of device might be difficult
-
2.
Size of left ventricular outflow tract (LVOT) and septal thickness
LVOT diameter and septal thickness are also measured with CT (Fig. 6c). Device placement is difficult if the LVOT is small or the septum is thick. Position of the LV apex relative to the chest wall is required for apical approach. Presence of thrombus in the LV increases the risk of embolic complications, both in apical and femoral routes.
-
3.
Leaflet morphology and calcification
Leaflet morphology is assessed in short-axis projection of the aortic root. Aortic valve morphologies other than a normal trileaflet valve (e.g. bicuspid or rarely unicuspid or quadricuspid [Fig. 7]) are currently considered contraindications for TAVI. In contrast to the normal thin, uniform leaflets that open widely, the typically severely calcified and thickened leaflets in patients with severe aortic stenosis (AS) open in a restricted, star-shaped configuration with an aortic valve area of less than 0.8 cm2. Calcification of the aortic valve can be classified as: grade 1—no calcification; grade 2—mild calcification (small isolated spots); grade 3—moderate calcification (multiple larger spots); grade 4—severe calcification (extensive calcification of all cusps) (Fig. 7). CT has high accuracy and reproducibility in detection and quantification of aortic calcification [20]. Higher calcification has been correlated with increased pressure gradients in echo, but it cannot be used to diagnose or rule out aortic stenosis [21, 22] Calcification is an independent risk predictor for disease progression and adverse clinical outcome [23, 24]. Heavy calcification may hamper the ability of the prosthesis to cross a native valve during percutaneous procedure. Higher calcification, especially in the intertrigonal area limits the expansion of prosthesis. This has been correlated with higher incidence of post-procedural aortic regurgitation due to decreased apposition of prosthesis with the aortic wall [25] and higher incidence of need for pacemaker implantation following procedure [15]. There is a strong correlation between valve calcification and coronary plaque [26]. Long leaflet with calcification increases risk of coronary occlusion during procedure. Calcific embolism from valve may cause stroke.
Fig. 7 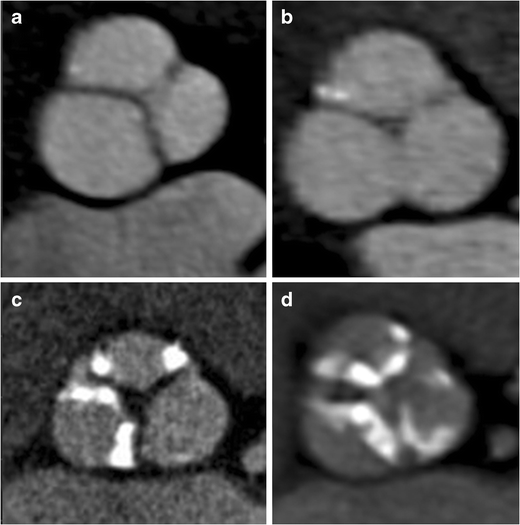
Morphology and calcification of aortic valve. a Bicuspid morphology with fused leaflets with no Calcification (grade 1). b Trileaflet morphology with small isolated spots of mild calcification (grade 2). c Trileaflet valve with multiple, large spots of moderate calcification (grade 3). d Trileaflet valve with extensive calcification of all cusps (grade 4)
-
4.
Valve area
Valve opening area can be measured directly in CT by planimetry and shows good correlation with echocardiographic assessment both using planimetry and calculations using the continuity equation. A valve area of <1.0 cm2 is considered severe. The area measured by CT is higher than that of echocardiography since the LVOT is ellipsoid and the echocardiography parasternal long axis projection measures the shortest diameter, resulting in underestimation of valve area and overestimation of stenosis. Contrast-enhanced CT acquired between 10 % and 30 % of R-R interval is used for measuring the valve area [26, 27, 28] (Fig. 8).
Fig. 8 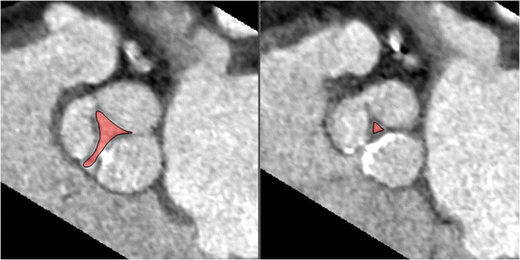
Short axis images of the aortic valve in systole show measurement of the aortic valve area using planimetry (segmented area)
-
5.
Leaflet opening
Leaflet opening pattern is assessed using 4D CT (Movie 1). In aortic stenosis, the leaflets are thickened and calcified with decreased valvular excursion. Incomplete diastolic leaflet coaptation is seen in aortic regurgitation. LV hypertrophy and post stenotic dilation are also seen.
-
6.
Distance between annulus and coronary ostia and leaflet length
The distance between the aortic annulus and inferior aspects of the coronary ostia (Fig. 9a) should be measured carefully, since there is wide variation between patients. This ranges from 7.1 to 22.7 mm for left and 9.2–26.3 mm for the right [18]. In addition, the length of the leaflets is also measured from the tip to the base (Fig. 9b). An annulus-coronary ostial distance of >10 mm is considered safe to avoid interference of the ostia with the calcified leaflet tips and the prosthesis stent struts after deployment. There is a higher risk of coronary occlusion if: the distance between the annulus and ostium is <10 mm; long leaflet; heavily calcified leaflet; shallow sinus; narrow sinotubular junction; a balloon expandable valve [19].
Fig. 9 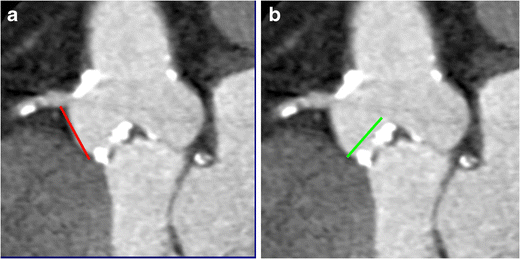
a Coronal oblique CT image is used to measure the distance between the annulus and inferior aspect of the right coronary ostium (black line). b Coronal oblique CT image showing length of the right leaflet
-
7.
Relationship of aortic root to body axis
Three-dimensional analysis of the relationship of the aortic root with the body axis is essential for planning of interventional access planes [29]. Optimal angiographic views perpendicular to the aortic valve plane is vital for exact placement of the device in the catheter lab. Using CT, 2D angiographic projections that are orthogonal to the aortic valve area can be predicted, which simplifies the percutaneous implantation procedure, with lower angiographic runs, and thus radiation and contrast doses. Various cranial and caudal reconstructions are performed in various left anterior oblique (LAO) angulations to determine the best projection orthogonal to the axis of the aortic root [29] (Fig. 10). If this plane is used during catheterisation, a view exactly orthogonal onto the annulus is obtained.
Fig. 10 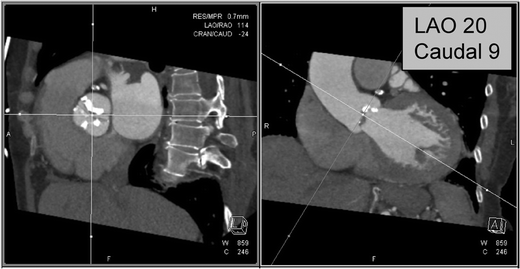
Prediction of angiographic planes. Use of CT to determine optimal cranio/caudal angulation for angiography. The image on the right represents a plane in the LAO 20/caudal 9 projection, which is orthogonal to the aortic plane and is used as a starting point for the angiographic assessment
-
8.
Calibre and contour of access vessels
The course, tortuosity, calibre and calcification of the femoral, iliac and lower abdominal aorta are assessed using CT.
-
(a)
Since sheaths larger than 18 F are required for percutaneous valve procedures, it is essential to have good-sized peripheral vessels for adequate device access. This measurement is made orthogonal to the vessel course. The sheath-to-femoral artery ratio (SFR) should ideally be <1.05. The minimal luminal diameter of the access vessels depends on the calibre of the device used [19]. Generally, a minimal luminal diameter of the common iliac, external iliac or common femoral artery of <7 mm is considered unfavourable.
-
(b)
Excess atherosclerosis and kinking in iliac vessels hinders advancement of sheath for percutaneous procedures. In addition, extensive calcification may be dislodged peripherally to produce peripheral emboli. Circumferential calcification >60 % at external-internal iliac bifurcation and severe angulation between common and external iliac arteries (<90°) are considered unfavourable anatomy (Fig. 11) [30]. However, the most recent catheter sizes are smaller and angulation of the iliac arteries is less problematic as the technique and equipment continues to improve. It is, however, important for the radiologist to alert the clinician to these findings.
-
(c)
Abnormal angulation of the aorta at the diaphragm or arch precludes transfemoral placement of the device; other routes, i.e. via the subclavian artery, transapical and direct aortic approach, can still be used.
Fig. 11 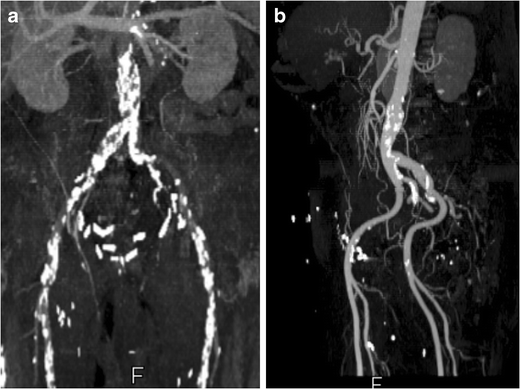
Peripheral arterial calcifications. a Extensive calcification of the abdominal aorta and common iliac arteries, with narrow lumen making this patient unsuitable for percutaneous procedure. b A 74-year-old man with steep and shallow angle between common and external iliac arteries, making him unsuitable for percutaneous interventions
-
(a)


Robotic mitral valve repair
Minimally invasive approaches for mitral valve repair have been developed to reduce complication and recovery time and improve cosmetic results. A robotic surgical system is inserted through a right lateral thoracotomy and the mitral valve is directly reached through division of the left atrium. Cardiopulmonary bypass is achieved through a catheter-based transfemoral approach and endo-aortic balloon occlusion, which achieves antegrade cardioplegia and venting without direct instrumentation of the ascending aorta [31]. CT is used in the evaluation of various factors prior to robotic mitral valve repair.
-
1.
Mitral valve annulus and leaflet morphology
Although echocardiography is the modality of choice in comprehensive assessment of mitral valve morphology and function, contrast enhanced CT can provide information on morphology. From a short axis image at the level of mitral commissures, three anteroposterior planes perpendicular to the mitral valve are used to assess geometry of anterolateral (A1-P1), central (A2-P2) and posteromedial (A3-P3) parts of mitral leaflets. The leaflet angles and mitral valve tenting height are measured in all the three planes. Leaflet/annulus thickening (Fig. 12a, b) and calcification (Fig. 12c) can be assessed [32].
Fig. 12 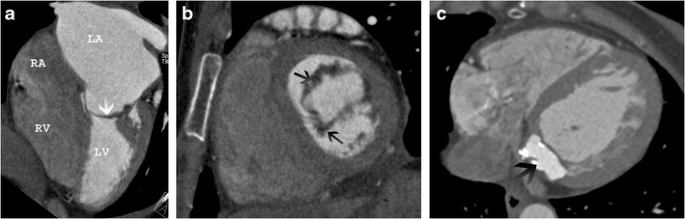
Mitral valve morphology. a Four-chamber view shows severe thickening of the mitral leaflets(arrow) and severe left atrial enlargement in a patient with mitral stenosis. b Short-axis view of the mitral valve shows thickened mitral leaflets (arrows). c Axial CT scan shows high attenuation with rim of calcification at the base of mitral annulus (arrow), consistent with caseous mitral annular calcification
-
2.
Mitral annular calcification
Robotic mitral valve repair is not performed in patients with extensive mitral annular calcification((Fig. 12c).
-
3.
Mitral valve annulus dimensions
Mitral annulus dimensions are helpful in determining the optimal size of annuloplasty ring. Using two-chamber and four-chamber views, a short-axis image at the level of the mitral annulus is reconstructed. The anteroposterior and intercommissural diameters are then measured (Fig. 13). Planimetry is used to measure the mitral annulus area [32].
Fig. 13 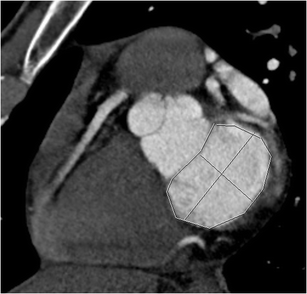
Measurements of mitral annulus. Short-axis view of the mitral annulus shows measurement of the anteroposterior diameter, septolateral diameter (black line) and circumference
-
4.
Calibre of femoral vessels
In robotic repair, cardiopulmonary bypass is established by retrograde perfusion through femoral vessels. The femoral and iliac vessels should be of sufficient calibre to allow the deployment device.
-
5.
Atherosclerosis of aorto-iliac and femoral vessels
Absence of significant atherosclerotic disease is essential for reducing risk of cerebral embolism or retrograde dissection [1].
-
6.
Distance from sinotubular junction to the aortic arch
The distance from the sinotubular junction to the origin of the aortic arch branch vessels is measured by coronal reformatted CT images to determine the ideal size of endo-aortic balloon for establishing cardiopulmonary bypass (Fig. 14).
Fig. 14 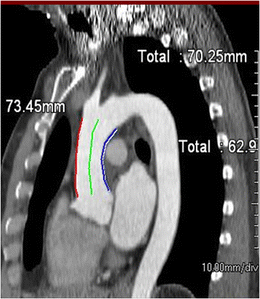
Sinotubular-arch distance for robotic mitral valve repair. Distance from the sinotubular junction to the arch is measured along the greater curvature (red line), centre-line (green line) and along the inner curvature (blue line)


Percutaneous mitral annuloplasty
Several different approaches for trans-catheter mitral valve repair have been described, including ‘e-clip’ [33] and percutaneous mitral annuloplasty.
Percutaneous mitral annuloplasty is an alternative to surgical annuloplasty in patients with ischaemic mitral regurgitation, especially in patients with comorbidities and advanced age or impaired systolic function. Transcatheter mitral annuloplasty is performed by reshaping and restraining the mitral valvular orifice through the coronary sinus [34]
-
1.
Distance between coronary sinus/great cardiac vein and mitral valve annulus
The distance between coronary sinus (CS)/great cardiac vein (GCV) and mitral valve annulus (MVA) is variable along the length of the CS (Fig. 15). In the majority (90 %), the CS is located more superiorly to the mitral valve annulus and runs posterior to the left atrium than the MVA [35]. This distance may be further increased in patients with severe chronic mitral regurgitation. If there is a large distance between the CS and MVA and the CS is located posterior to the left atrium, percutaneous annuloplasty is not useful. This distance may also vary with the phases of the cardiac cycle [35].
Fig. 15 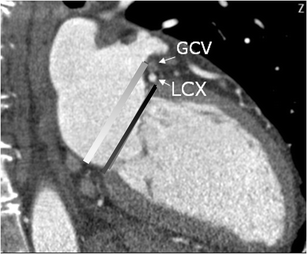
Two-chamber cardiac view show the distance between the mitral valve annulus plane (MVA) (black line) and coronary sinus-great cardiac vein (CS-GCV). The white line represents a parallel line through the centre of the CS-GCV
-
2.
Left circumflex coronary artery between GS-GCV and MVA
The distance, crossing point, length of crossing of the left circumflex artery (LCX) between coronary sinus- great cardiac vein and mitral valve annulus is measured using CT. If the LCX runs close and crosses between the CS-GCV and mitral annulus, there is high risk of compression of LCX due to the percutaneous mitral annuloplasty. In 68 % of patients, the LCX may run inferior to the CS, as a result of which it is located between the CS and mitral valve annulus, with an overlapping segment >30 mm in 17.58 % of these patients. If the LCX is coursing between the CS and MVA for a long distance, a percutaneous procedure is not possible since it might cause LCX compression [35].
-
3.
Calcification of the mitral valve annulus
In patients with severe calcification of the mitral annulus, surgical approach is preferred over percutaneous approach [35].

Percutaneous closure of atrial septal defects
Due to expected lower morbidity and hospital stay, there has been increasing use of percutaneous closure of selective types of atrial septal defects (ASDs) and patent foramen ovale (PFO) with catheter-based occluder devices [36]. These devices have a central waist to close the defect and two umbrella-like discs for fixation. CT plays an important role in patient selection.
-
1.
Type of defect
Percutaneous closure is performed for ostium secundum type of ASD and patent foramen ovale, but is not appropriate for sinus venosus or coronary sinus defects.
-
2.
Size of defect
Successful percutaneous closure requires accurate delineation and measurement of the septal defect. The size of the defect and rim determine the size of the occluder device. The maximum size of the defect and length of the interatrial septum in long and short axes are measured on ventricular end systolic images. The area of the defect is measured on en face views of defect on coronal oblique images, which can be obtained by multiplanar reconstruction of four-chamber and short-axis views of the interatrial septum. Percutaneous closure is contraindicated with ASDs larger than 36 mm
-
3.
Rim
The length of rims from the edge of ASD to the tricuspid valve (anteroinferior rim), aortic valve (anterosuperior rim), SVC (posterosuperior rim) and IVC (posteroinferior rim) are measured using CT (Fig. 16) [36]. Rim deficiency of <3 mm is a contraindication for percutaneous closure (Fig. 17) [37]. Anterosuperior rim deficiency is seen in 28–54 % of patients [36]. With a large ASD, a posteroinferior rim of at least 10 mm is an important predictive factor for successful percutaneous closure. For PFOs, the minimum distance between the device and SVC or aorta should be 9 mm, and ideally the device should not extend across more than 90 % of atrial septum [38]
Fig. 16 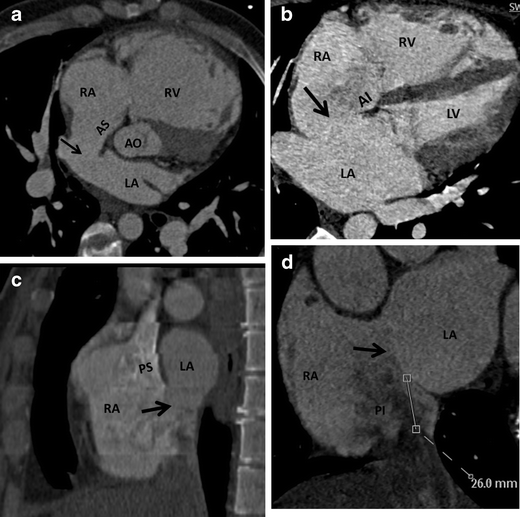
CT scan prior to percutaneous closure of ASD. a Axial oblique CT image shows as small ASD (arrow) with normal anterosuperior (AS) rim. b Four-chamber CT image demonstrates an ASD (arrow) with normal anteroinferior (AI) rim. c Short-axis CT image shows a large ASD (arrow) with normal posterosuperior rim (PS). d Short-axis CT image demonstrates a large ASD (arrow) with normal posteroinferior (PI) rim
Fig. 17 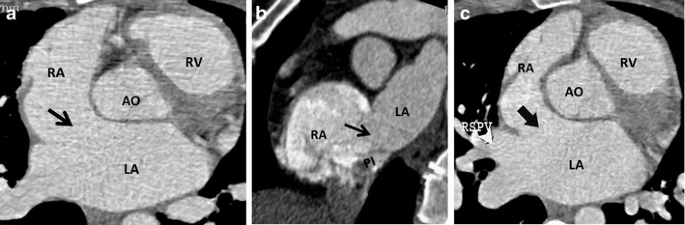
CT scans showing patients not suitable for percutaneous device placement. a Large ASD (arrow) with no anterosuperior rim. b Large ASD (arrow) with intact posterosuperior rim (PS), but absent posteroinferior (PI) rim. c ASD (arrow) with absent anterosuperior rim and rim with right superior pulmonary vein (RSPV)
-
4.
Miscellaneous factors
Small atria, floppy septum and thin septum are relative contraindications for percutaneous closure.
-
5.
Other congenital anomalies and thrombus
Presence of associated cardiovascular anomalies and thrombi in the atria or ventricle are contraindications for percutaneous closure.


In spite of widespread use, there are inadequate data on the efficacy of percutaneously placed devices for the treatment of patients with PFO and cryptogenic stroke/transient ischaemic attack (TIA). An ongoing trial (CLOSURE 1) is comparing the use of a percutaneously placed PFO occlusive device and best medical therapy versus best medical therapy alone for prevention of recurrent ischaemic neurological symptoms among persons with TIA or ischaemic stroke [39].
Percutaneous closure of ventricular septal defects
Ventricular septal defects can also be percutaneously closed using devices such as coils, umbrella device, buttoned device or Amplatzer device. Features that determine suitability for percutaneous devices are:
-
1.
Type of defect
Muscular and certain type of perimembranous defects are suitable for percutaneous closure. Inlet and outlet defects are difficult to be closed with catheter devices.
-
2.
Size and shape of defect
The size and shape of the defect are measured in the short and long axes in end diastolic images. En face views may be used to measure the area. There is a 20 % change in defect size between systole and diastole. Most of the defects are oval on the right and left ventricular aspects with variable size.
-
3.
Proximity to vital structures
Proximity to the aortic, pulmonary and tricuspid valves and the atrioventricular conduction bundle determines the suitability of a defect for percutaneous closure. Muscular defects are usually at a safe distance from these structures making them ideally suited for catheter device closure. Doubly committed and juxta-arterial defects are bordered by aortic and pulmonary valves, making them unsuitable for catheter closure. Perimembranous outlet defect is closest to the aortic valve and a confluent defect that extends to both inlet and outlet portions is close to both the atrioventricular and aortic valves [40]. However, device closure can be done in some perimembranous defects that are not complicated by septal malalignment or valvular prolapse with careful evaluation of defect size, shape, and distance from vital structures and optimal device selection. The area of fibrous continuity between tricuspid, mitral and aortic valve is crucial to avoid atrioventricular dissociation [41].
Radiofrequency ablation of pulmonary veins
For patients with atrial fibrillation refractory to conventional pharmacological therapy, an alternative treatment option is radiofrequency ablation of arrhythmogenic muscle bundles located in the venoatrial junction and myocardium of the left atrium and also the proximal segments of the pulmonary veins. Ablation is performed at the venoatrial junction of all pulmonary veins to prevent stenosis and eliminate ostial remnants. CT scan is commonly used in the evaluation of various factors prior to ablation procedure.
-
1.
Pulmonary venous anatomy
The most commonly seen pattern (seen in 57–80 %) of pulmonary venous drainage is four veins (right superior, right inferior, left superior, left inferior) draining into the left atrium, with the right middle vein opening into the right superior vein. Various variations have been described in pulmonary venous drainage, which are related to the embryologic development. In the conjoined pattern (2.4–25 %), which is more common on the left, the superior and inferior pulmonary veins unite before the left atrium to result in a single ostium that is larger than normal [42]. Due to ostial size larger than that of normal catheters, segmental isolation may not be possible [30]. Accessory veins may be seen (1.6–19 % of patients) and have smaller ostia than normal [43]. The right middle lobe (4–27 %) and superior segment of right lower lobe are the most common accessory veins (Fig. 18a) [42]. Recognition of these accessory veins is essential to avoid injury that results in pulmonary vein stenosis and to ensure that all veins are ablated. In the presence of an accessory right middle lobe vein, the figure of eight ablation might not be feasible due to inadequate tissue between the veins to support an ablation catheter. Accessory top veins draining in the roof of the left atrium are also at risk of injury. Veins crossing midline posterior of left atrium are at risk both from ablation of ostia and ablation of the posterior wall of the left atrium. Anomalous pulmonary venous drainage refers to pulmonary veins opening into the systemic veins or into the right atrium and may be associated with sinus venosus defect [43].
Fig. 18 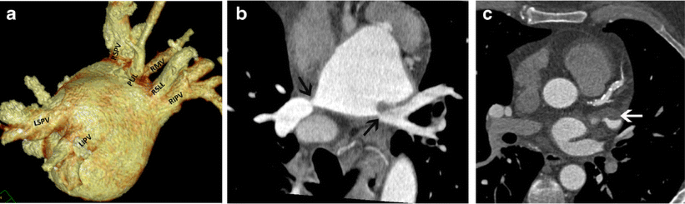
a Two normal pulmonary veins on the left, left superior pulmonary vein (LSPV) and left inferior pulmonary vein (LIPV). On the right, in addition to the right superior pulmonary vein (RSPV) and right inferior pulmonary vein (RIPV), there are accessory ostia for the right middle vein (RM), superior segment of the right lower lobe (RSLL) and the posterior segment of the upper lobe (PUL). b Coronal oblique view of left atrium show severe stenosis of the left and right inferior pulmonary veins (arrows). c Axial CT scan shows a hypodense thrombus in the left atrial appendage (arrow)
-
2.
Branching pattern
Early branching is defined as branching within 1 cm of the pulmonary vein bifurcation or 5 mm from the ostium of the main pulmonary vein. Early branching is seen in up 41 % of patients and is more common on the right side. Early branching veins are more prone to pulmonary venous stenosis [44].
-
3.
Orientation
The superior pulmonary veins enter the left atrium at a typical angle of 45–60 ° and inferior pulmonary veins enter at an angle of 30–45° to the horizontal plane [44]. Knowledge of this orientation helps in determining the proper orientation of catheters during the procedure, which shortens procedure time. In addition, since the ridge of atrial tissue separating the right superior and inferior veins is narrow, an unstable position of a catheter in this area potentially can result in application of energy within one of the veins [45].
-
4.
Ostial size and pulmonary venous stenosis
The diameter and area of the individual pulmonary veins are measured in orthogonal short-axis or endocardial views. The ostial size varies with the phase of the cardiac cycle and should ideally be measured in the same phase each time. Patients with atrial fibrillation typically have larger ostia. Knowledge of size helps in selecting the optimal catheter. Small ostia (<10 mm) are prone to stenosis (Fig. 18b) and some operators avoid ablation in these small veins.
-
5.
Left atrial thrombus
Presence of thrombus, either in the left atrium or left atrial appendage is a contraindication to pulmonary ablation. Thrombus is seen as a filling defect in contrast-enhanced CT scans (Fig. 18c). A filling defect can also be secondary to slow flow with admixture of contrast. Thrombus, however, has lower density than slow flow and is persistent on delayed phase imaging [46]. In indeterminate cases, a trans-oesophageal echocardiogram is performed.
-
6.
Left atrial dimensions
Assessment of the left atrial (LA) size is an important factor in patients with atrial fibrillation [47]. Left atrial size is an important predictor of cardiovascular outcomes such as atrial fibrillation, congestive cardiac failure, stroke and cardiovascular death [48]. LA enlargement is an indicator of the duration and severity of diastolic dysfunction [49]. It is a risk factor for stroke, and atrial fibrillation before and after therapy. Increased LA volume is an independent strong predictor of atrial fibrillation, and atrial fibrillation is an independent predictor of LA size. The LA can be measured by diameter, area or volume. Diameter and area are measured in four-chamber reconstructed image. Volume can be estimated by area-length biplane method, prolate ellipsoid method or modified Simpson’s method [49]
-
7.
Relationship to oesophagus
A thin layer of fat is present between the thin posterior wall of the left atrium and anterior oesophagus, which insulates the oesophagus from thermal injury of ablation. The fat layer is occasionally absent, particularly at the level of the mid posterior wall. While in 62 %, oesophagus is immediately posterior to the left pulmonary veins, in 15 % it is behind the right pulmonary veins [50]. Knowledge of the relationship between posterior wall of the left atrium/pulmonary veins and the oesophagus is essential, since there is a potential risk of atrio-esophageal fistula if the oesophagus is close to the pulmonary venous ostium. However, it should be noted that the anatomical relationship between the oesophagus and left atrium may vary from the time of CT scan to the procedure [50].

Cardiac resynchronisation therapy
In cardiac resynchronisation therapy, the lateral wall of the left ventricle is stimulated by an electrical lead that is placed through the coronary sinus, so that it contracts synchronously with the septum, which improves the contractile efficiency. CT is useful in patient selection for cardiac resynchronisation therapy.
-
1.
Coronary venous anatomy
A patent coronary vein is essential for transcatheter placement of an electrical lead in the lateral wall of LV. Coronary sinus and tributaries can be absent as normal variation. While the great and middle cardiac veins are present in all patients (Fig. 19a), lateral and posterior cardiac veins (which are targets of cardiac resynchronisation therapy [CRT]) are congenitally absent in 1–3 % [51]. Coronary sinus tributaries can also be absent due to thrombosis following myocardial infarction. A CT study showed that the left marginal vein and posterolateral vein was absent in 75 % of patients with ischaemic cardiomyopathy and impaired ejection fraction, compared with normal controls and those with coronary artery disease (Fig. 19b). There was correlation between extent and geography of myocardial infarction (MI) and absence of coronary sinus [51]. CT venography is helpful in mapping the venous anatomy prior to the procedure. The acquisition parameters are the same as CT coronary angiography except for acquisition in the venous phase. If coronary sinus and tributaries are absent, epicardial lead placement through surgical approach is required [52].
Fig. 19 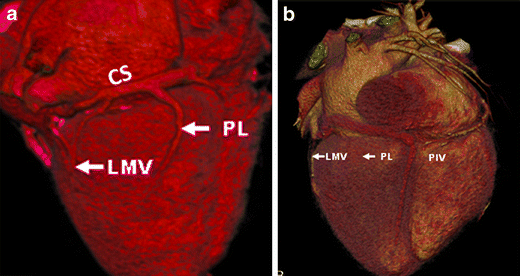
Coronary venous anatomy. a Volume-rendered reconstruction of the heart. Great cardiac vein (GCV) and coronary sinus (CS) run along the atrioventricular groove. The first tributary, posterior interventricular vein (PIV) passes in the posterior interventricular groove, along with PDA of right coronary artery. The other tributaries of the CS are the posterolateral vein (PLV) and left marginal vein (LMV). b Volume rendered CT image in a 72-year-old man with myocardial infarction shows absence of both the posterolateral and left marginal veins
-
2.
Scar in the lateral wall
Another cause for failure of CRT is the presence of extensive scar in the LV, which causes electrical capture and mechanical contraction. MRI is the ideal method for detecting scar, but it can also be detected in delayed phase CT scan (Fig. 20). A previous infarct can also be detected as wall thinning, hypodensity, and calcification of the LV wall in CT. It has also been shown that there is more absence of coronary sinus tributaries in patients with extensive scar in inferolateral wall [53].
Fig. 20 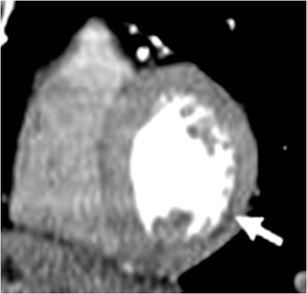
Scar in the lateral wall. Wall thinning with hypodensity in the basal and mid inferolateral walls (white arrows) secondary to sub-endocardial myocardial infarction in a patient with CABG and impaired left ventricular function


The coronary sinus approach is also used for retrograde cardioplegia and other electrophysiology interventional procedures. CT is also useful in patient selection for these procedures.
Endovascular stent-grafts
Endovascular stent grafts are used as an alternative to open surgical repair for thoraco-abdominal aneurismal disease and also other pathological conditions of the aorta, including dissection, penetrating ulcer, rupture and congenital abnormalities. Although the exact indications are not yet clearly established due to lack of long-term outcome data, it is typically used when the risk of this procedure is lower than open surgical or conservative medical management [54–56]. The endovascular graft is deployed in the thoracic aorta at the site of the primary pathology through a trans-femoral approach to provide sealing from native aortic blood flow. In addition to being useful in the evaluation of the primary aortic pathology, CT is also used for assessment of various other factors that determine the suitability of a patient for endovascular stent procedures [57]. Non-ECG gated scans are acquired from the thoracic inlet to femoral heads.
-
1.
Measurement of the primary pathology
Accurate measurement (length, diameter) of the primary pathology such as aneurysm, dissection, rupture and congenital abnormality is required for selecting the appropriate sized device. In patients with an aneurysm, 10–15 % over sizing of stent grafts is ideally preferred to prevent stent migration and optimal seal [57]. It is important to consider measurements of the lumen and overall vessel size. In patient with aneurysm and adherent wall thrombus, the vessels size is significantly larger than the lumen size. The risk of rupture correlates with overall vessel size, which therefore determines surgical or interventional indication. Luminal size determines the need for intervention in patients with obstructive disease [57].
-
2.
Maximal aortic diameter in the landing zone
Landing zone refers to the segment of aorta proximal and distal to the primary pathology where the limbs of the stent are positioned. Suitable proximal and distal sealing zones are critical for optimal close fitting of the stent within the aorta and exclusion of flow outside the stented lumen (Fig. 21). For optimal graft attachment, the maximum diameter of the aorta in the landing zone should be 40–42 mm, both proximally and distally [57].
Fig. 21 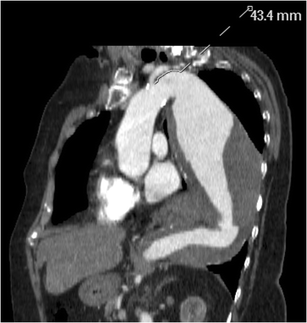
Sagittal oblique reconstructed image in a 72-year-old man with a large descending thoracic aortic aneurysm shows the distance between left subclavian artery origin and the aneurysm
-
3.
Thrombus/atheroma in the landing zone
Presence of circumferential thrombus or atheroma in the landing zone increases the risk of its dislodgment upon deployment of the stent graft, which increases the risk of cerebrovascular accidents [58].
-
4.
Involvement of major branch vessels
Ideally, there should be at least 15-mm distance between the primary pathology and the origin of major branch vessel, such as the left subclavian artery. Involvement of the major branch vessel may preclude the use of endovascular stent or require pre-procedural “de-branching”, e.g. with a left carotid to subclavian bypass graft and coil occlusion of the native left subclavian artery ostium (Fig. 21). If the stent has to be placed through branch vessels, fenestrated grafts with openings in the graft fabric to accommodate the ostia of branch vessels may be used. These orifices can then be fixed by implanting bare or covered stents across the graft/ostial interfaces. Side or bypass grafts can also be used. Covered grafts can be used over the origin of the left subclavian arteries if patency of both the vertebral arteries is demonstrated. Hence precise analysis of the branches and angle of the branches with respect to each other is critical.
-
5.
Calibre of femoral/iliac arteries
The femoral and iliac arteries should be >9 mm to enable access to the deployment device. Severe aorto-iliac tortuosity hinders endovascular device placement [3]
-
6.
Angulation at diaphragm
Acute angulation of the aorta at the level of the diaphragm might potentially hinder stent placement. Sagittal or coronal reformatted images are the most useful in the assessment of angulation

Percutaneous pulmonary valve implantation
Percutaneous pulmonary valve implantation (PPVI) is performed in patients with right ventricle (RV) outflow tract/pulmonary trunk dysfunction (stenosis or regurgitation) following the repair of congenital heart diseases. While surgical options such as RV to pulmonary artery (PA) conduit have limited life span, balloon angioplasty and bare-metal stenting is complicated by development of free pulmonary regurgitation [59]. PPVI has been shown to be associated with improved haemodynamics and avoids surgical RVOT revision with freedom from operation of 93 % and 73 % at 10 and 70 months respectively, and survival at 83 months of 96.9 % [60]. PPVI is performed in patients with severe pulmonary regurgitation, severe RV dilation (EXV >150 ml/m2, RV/LV EDV ratio >1.7), severe RV dysfunction, arrhythmia, or impaired exercise capacity [60] .
-
1)
Calibre of the RV-PA conduit- The Melody valve (Medtronic) is a trileaflet bovine jugular venous valve sutured inside a platinum-iridium balloon expandable stent. The delivery system is a balloon-in-balloon catheter that has diameter of 18–22 mm. CT is useful in the measurement of dimensions of the RV-PA conduit, which has to be at least 14 mm and not more than 22 mm [60]. Placement of the valve in smaller conduits will result in residual gradients, while placement in larger conduits are associated with failure of leaflet coaptation.
-
2)
Length of the conduit available away from pulmonary artery bifurcation- The stent system has a length of 34 mm, which will shorten by 26 %, i.e. 24.6 mm with 22 mm balloon inflation and shortens by 13.5 %, i.e. 28.8 mm at 18-mm balloon inflation [59]. CT can estimate this measurement and help in selecting the appropriate patients.
-
3)
RVOT/pulmonary morphology- CT with MPR and 3D reconstructions is used in determining the RVOT morphology, which is another factor in determining suitability for PPVI. Type I, the aneurysmal (Pyramidal) shape is the most common shape, where the RVOT funnels towards pulmonary bifurcation. This is seen in patients with trans-annular patch and is not suitable for PPI due to high risk for device dislodgment. Type 2 (14 %) has a cylindrical shape with a constant diameter and is suitable for PPVI. Type 3 (3 %) has an inverted pyramidal shape. Type 4 (17 %) is fusiform, while type 6 (13 %) is narrow and tubular. [61]. The best site for anchorage can also be determined by CT.
-
4)
Position of proximal coronary arteries- The location of proximal coronary arteries to the RVOT/pulmonary trunk and the site of implantation is assessed to avoid coronary artery compression following implantation. This is especially relevant in RV-PA conduits, some of which may have been originally performed due to anomalous coronary artery anatomy which precluded definitive surgery.
Conclusion
Computed tomography provides critical information to cardiovascular surgeons and interventionalists that helps in optimal patient selection for minimally invasive procedures and to avoid associated complications. Although imaging is extensively used for pre-operative and procedural planning, it should be emphasised that data demonstrating improved clinical outcome secondary to the use of imaging are still limited. The collection of such data in clinical trials will be critical.
References
Schoenhagen P, Numburi U, Halliburton SS, Aulbach P, von Roden M, Desai MY, Rodriguez LL, Kapadia SR, Tuzcu ME, Lytle BW (2010) Three-dimensional imaging in the context of minimally invasive and transcatheter cardiovascular interventions using multi-detector computed tomography; from pre operative oplanning to intra-operative guidance. Eur Heart J 31:2727-2740
Vogel-Claussen J, Pannu H, Spevak PJ, Fishman EK, Bluemke DA (2006) Cardiac valve assessment with MR imaging and 64 section multi-detector row CT. Radiographics 26:1769–84
Neubauer AM, Garcia JA, Messenger JC, Hansis E, Kim MS, Klein AJ, Schonenberg GA, Grass M, Carroll JD (2010) Clinical feasibility of a fully automated 3D reconstruction of rotational coronary X-ray angiograms. Circ Cardiovasc Interv 3:71–79
Gilkeson RC, Markowitz AH, Ciancibello L (2003) Multisection CT evaluation of the Reoperative cardiac surgery patient. Radiographics 23:S3–S17
Gilinov AM, Casselman FP, Lytle BW, Blackstone EH, Parsons EM, Loop FD, Cosgrove DM (1999) 3rd.Injury to a patent left internal thoracic artery graft at coronary reoperation. Ann Thorac Surg 67:382–6
Morino Y, Hara K, Tanabe K, Kuroda Y, Ayabe S, Kozuma K, Kigawa I, Fukuda S, Wanibuchi Y, Tamura T (2000) Retrospective analysis of cerebral complications after coronary artery grafting in elderly patients. Jpn Circ J 64:46–50
Roach GW, Kanchuger M, Mangano M, Newman M, Nussmeier N, Wolman R, Aggarwal A, Marschall K, Graham SH, Ley C (1996) Adverse cerebral outcomes after coronary bypass surgery. N Engl J Med 335:1857–63
Hedayati N, Sherwood JT, Schomisch SJ, Carino JL, Markowitz AH (2004) Axillary artery cannulation for cardiopulmonary bypass reduces cerebral microemboli. J Thorac Cardiovasc Surg 128:389–90
Roselli EE, Pettersson GB, Blackstone EH, Brizzio ME, Houghtaling PL, Hauck R, Burke JM, Lytle BW (2008) Adverse events during re operative cardiac surgery: frequency, characterization, and rescued. J Thorac Cardiovasc Surg 135:316–23
Kamdar AR, Meadows TA, Roselli EE, Gorodeski EZ, Curin RJ, Sabik JF, Schoenhagen P, White RD, Lytle BW, Flamm SD, Desai MY (2008) Multidetector computed tomographic angiography in planning of reoperative cardiothoracic surgery. Ann Thorac Surg 85:1239–45
Maluenda G, Goldstein MA, Lemesle G, Weissman G, Weigold G, Landsman MJ, Hill PC, Pita F, Corso PJ, Boyce SW, Pichard AD, Walsman R, Taylor AJ (2010) Perioperative outcomes in reopreative cardiac surgery guided by cardiac multidetector computed tomographic angiography. Am Heart J 159:301–306
Pflederer T, Achenbach S (2010) Aortic valve stenosis: CT contributions to diagnosis and therapy. J Cardiovasc Comput Tomogr 146:469-470
Leon MB, Smith CR, Mack M, Miller DC, Moses JW, Svensson LG, Tuzcu EM, Webb JG, Fontana GP, Makkar RR, Brown DL, Block PC, Guyton RA, Pichard AD, Bavaria JE, Herrmann HC, Douglas PS, Petersen JL, Akin JJ, Anderson WN, Wang D, Pocock S, PARTNER Trial Investigators (2010) Transcatheter aortic-valve implantation for aortic stenosis in patients who cannot undergo surgery. N Engl J Med 363(17):1597–607
Stolzmann P, Knigh J, Desboilles L, Maier W, Scheffel H, Plass A, Kurtcuoglu V, Leschka S, Poulikakos D, Marincek B, Alkhadhi H (2009) Remodelling of aortic root in severe tricuspid aortic stensois; implicatiosn for transcatheter aortic valve implantation. Eur Radiol 19:1316–23
Bleiziffer S, Ruge H, Horer J, Hutter A, Geisbusch S, Brockmann G, Mazzitelli D, Bauernschmitt R R, Lange R (2010) Predictors for new onset complete heart block after transcatheter aortic valve implantation. JACC Cardiovasc Interv 3:524–30
Detaint D, Lepage L, Himbert D, Brochet E, Messika-Zeitoun D, Iung B, Vahanian A (2009) Determinants of significant paravalvular regurgitation after transcatheter aortic valve; implantation impact of device and annulus decongruence. JACC Cardiovasc Interv 2:821–7
Geisbüsch S, Bleiziffer S, Mazzitelli D, Ruge H, Bauernschmitt R, Lange R (2010) Incidence and management of CoreValve dislocation during transcatheter aortic valve implantation. Circ Cardiovasc Interv 3:531–536
Tops LF, Wood DA, Delgado V (2008) Non invasive evaluation of the aortic root with multislice computed tomography; implications for transcatheter aortic valve replacement. JACC Cardiovasc Imaging 1:321–330
Achenbach S, Delgado V, Hausleiter J, Schoenhagen P, Min JK, Leipsic JA (2012) SCCT Expert consensus document on computed tomographic imaging before transcutaneous aortic valve implantation/transcatheter aortic valve replacement. J Cardiovasc Comput Tomogr 6:366–380
Willman JK, Weishaupt D, Lachat M, Kobza R, Roos JE, Seifert B, Lüscher TF, Marincek B, Hilfiker PR (2002) Electrocardiographically gated multi-detector row CT for assessment of valvular morphology and calcification in aortic stenosis. Radiology 225:120–8
Liu F, Coursey CA, Grahame-Clarke C, Sciacca RR, Rozenshtein A, Homma S, Austin JH (2006) Aortic valve calcification as an incidental finding at CT of the elderly. Severity and location as predictors of aortic stenosis. AJR Am J Roentgenol 186:342–9
Cueff C, Serfaty JM, Cimadevilla C, Laissy JP, Himbert D, Tubach F, Duval X, Iung B, Enriquez-Sarano M, Vahanian A, Messika-Zeitoun D (2010) Measurement of aortic valve calcification using multislice computed tomography: correlation with haemodynamic severity of aortic stenosis and clinical implication for patients with low ejection fraction. Heart 97:721-726
Otto CM, Lind BK, Kitzman DW, Gersh BJ, Siscovick DS (1999) Association of aortic sclerosis with cardiovascular mortality and morbidity in the elderly. N Engl J Med 341:142–7
Rosenhek R, Binder T, Porenta G, Lang I, Christ G, Schemper M, Maurer G, Baumgartner H (2000) Predictors of outcome in severe, asymptomatic aortic stenosis. N Engl J Med 343:611–7
Delgado V, Ng AC, van de Veire NR, van der Kley F, Schuijf JD, Tops LF, de Weger A, Tavilla G, de Roos A, Kroft LJ, Schalij MJ, Baxx JJ (2010) Transcatheter aortic valve implantation; role of multidetector row computed tomography to evaluate prosthesis position and deployment in relation to valve function. Eur Heart J 31:1114–23
Mahabadi AA, Bamberg F, Toepker K, Schlett CL, Rogers IS, Nagurney JT, Brady TJ, Hoffmann U, Truong QA (2009) Association of aortic valve calcification to the presence, extent, and composition of coronary artery plaque burden; From the rule out myocardial infarction using computed associated tomography (ROMICAT) trial. Am Heart J 158:562–8
Abbara S, Pena AJ, Maurovich-Horvat P, Butler J, Sosnovik DE, Lembcke A, Cury RC, Hoffmann U, Ferencik M, Brady TJ (2007) Feasibitliy and optimization of aortic valve planimetry with MDCT. AJR Am J Roentgenol 188:356–60
Feuchtner GM, Muller S, Bonatti J, Schachner T, Velik-Salchner C, Pachinger O, Dichtl W (2007) Sixty-four slice CT evaluation of aortic stenosis using planimetry of the aortic valve area. AJR Am J Roentgenol 189:197–203
Kurra V, Kapadia SR, Tuzcu EM, Halliburton SS, Svensson L, Roselli EE, Schoenhagen P (2010) Pre-procedural imaging of aortic root orientation and dimsensions; comparison between X-Ray angiographic planar imaging and 3-dimensional multidetector row computed tomography. JACC Cardiovasc Interv 3:105–113
Kurra V, Schoenhagen P, Roselli EE, Kapadia SR, Tuzcu EM, Greenberg R, Akhtar M, Desai MY, Flamm SD, Halliburton SS, Svensson LG, Sola S (2008) Prevalence of significant peripheray artery disease in patients evaluated for aortic valve insertion; preprocedural assessment with multidetector computed tomography. J Thorac Cardiovasc Surg 137:1258–1264
Murphy DA, Miller JF, Langford DA, Snyder AB (2006) Endoscopic robotic mitral valve repair. Endoscopic robotic mitral valve surgery. J Thorac Cardiovasc Surg 132:776–81
Delgado V, Tops LF, Schuijf JD, de Roos A, Brugada J, Schalij MJ, Thomas JD, Bax JJ (2009) Assessment of mitral valve anatomy and geometry with multislice computed tomography. JACC Cardiovasc Imaging 2:556–565
Feldman T, Kar S, Rinaldi M, Fail P, Hermiller J, Smalling R, Whitlow PL, Gray W, Low R, Herrmann HC, Lim S, Foster E, Glower D (2009) EVEREST Investigators. Percutaneous mitral repair with the MitraClip systm. Safety and midterm durability in the initial EVEREST (Endovascular valve edge-to-edge Repair study) cohort. J Am Coll Cardiol 54(8):666–94
Van Mieghem NM, Piazza N, Anderson RH, Tzikas A, Nieman K, De Laat LE, McGhie JS, Geleijnse ML, Feldman T, Serruys PW, de Jaegere PP (2010) Anatomy of the mitral valvular complex and its implications for transcatheter interventions for mitral regurgitation. J Am Coll Cardiol 56:617–26
Tops LF, van de Veire NR, Schuijf JD, de Ross A, van der Wall EE, Schalij MJ, Bax JJ (2007) Non invasive evaluation of coronary sinus anatomy and its relation to the mtiral valve annulus. Implications for percutaneous mitral annuloplasty. Circulation 115:1426–1432
Ko SF, Liang CD, Yip HK, Huang CC, Ng SG, Huang CF, Chen MC (2009) Amplatzer septal occluder closure of atrial septal defect: evaluation of transthoracic echocardiography, cardiac CT, and transesophageal echocardiography. AJR Am J Roentgenol 193:1522–1529
Webb G, Gazouilis MA (2008) Atrial septal defects in the adult; recent progress and overview. Circulation 119:e518–520
Ivens E, Hamilton-Craig C, Aroney C, Clarke A, Jalali H, Burstow DJ (2009) Early and late cardiac perforation by Amplatzer atrial septal defect and patent foramen ovale devices. J Am Soc Echocardiogr 22:1067–70
Furlan AJ, Reisman M, Massaro J, Mauri L, Adams H, Albers GW, Felberg R, Herrmann H, Kar S, Landzberg M, Raizner A, Wechsler L (2010) CLOSURE I. Investigators. Study design of the CLOSURE I Trial: a prospective, multicenter, randomized, controlled trial to evaluate the safety and efficacy of the STARFlex septal closure system versus best medical therapy in patients with stroke or transient ischemic attack due to presumed paradoxical embolism through a patent foramen ovale. Stroke 41(12):2872–83
Ho SY, McCarthy KP, Rigby ML (2004) Morphology of Perimembranous ventricular septal defects: implications for transcatheter device closure. J Interv Cardiol 17:99–108
Rajiah P, Kanne JP (2010) Computed tomography of septal defects. J Cardiovasc Comput Tomogr 4:231–245
Cronin P, Sneider MB, Kazerooni EA, Kelly AM, Scharr C, Oral H, Morady F (2004) MDCT of the left atrium and pulmonary veins in planning radiofrequency ablation in planning radiofrequency ablation for atrial fibrillation: a how-to-guide. AJR Am J Roentgenol 183(3):767–768
Joshi SB, Blum AR, Mansour M, Abbara S (2009) CT applications in electrophysiology. Cardiol Clin 27:619–631
Maksimovic R, Dill T, Ristic AD, Seferovic PM (2006) Imaging in percutaneous ablation for atrial fibrillation. Eur Radiol 16:2491–1504
Martinek M, Nesser HJ, Aichinger J, Boehm G, Purerfellner H (2007) Impact of integration of multislice computed tomography imaging into three dimensional electroanatomic mapping in clinical outcomes, safely and efficacy using radiofrequency ablation for atrial fibrillation. Pacing Clic Electrophysiol 30:1215–1223
Kim YY, Klein AL, Halliburton SS, Popovic ZB, Kuzmiak SA, Sola S, Garcia MJ, Schoenhagen P, Natale A, Desai MY (2007) Left atrial appendage filling defects identified by multidetector computed tomography in patients undergoing radiofrequency pulmonary vein antral isolation; a comparison with transesophageal echocardiography. Am Heart J 154(6):1199–205
Mahabadi AA, Samy B, Seneviratne SK, Toepker MH, Bamberg F, Hoffman U, Truong QA (2009) Quantitative assessment of left atrial volume by echocardiographic-gated contrast-enhanced multidetector computed tomography. J Cardiovasc Comput Tomogr 3:80–87
Tsang TS, Barnes ME, Bailey KR, Leibson CL, Montgomery SC, Takemoto Y, Diamond PM, Marra MA, Gersh BJ, Wiebers DO, Petty GW, Seward JB (2001) Left atrial volume; important risk marker for incident atrial fibrillation in 1655 older men and women. Mayo Clin Proc 76:467–75
Lin FY, Devereux RB, Roman MJ, Meng J, Jow VM, Jacobs A, Weinsaft JW, Shaw LI, Berman DS, Callister TQ, Min JK (2008) Cardiac chamber volumes, function and mass as determined by 64 multidetector row computed tomography; mean values among healthy adults free or hypertension and obesity. JACC Cardiovasc Imaging 1:782–6
Daoud EG, Hummel JD, Houmsse M, Hart DT, Weiss R, Liu Z, Augostini R, Kalbfleisch S, Smith MC, Mehta R, Gangasani A, Raman SV (2008) Comparison of computed tomographic imaging with intraprocedural contrast esophagogram. Implications for catheter ablation of atrial fibrillation. Hear Rhythm 5(7):975–80
Van de Veire NR, Schuijf JD, De Sutter J, Schuijf JD, Bleeker GB, Wijffels MC, van Erven L, Holman ER, De Sutter J, van der Wall EE, Schalij MJ, Bax JJ (2006) Non invasive visualization of the cardiac venous system in coronary artery disease patients using 64 slice computed tomography. J Am Coll Cardiol 48:1832–8
Abbara S, Cury RC, Nieman K, Reddy V, Moselewski F, Schmidt S, Ferencik M, Hoffmann U, Brady TJ, Achenbach S (2005) Non invasive evaluation of cardiac veins with 16-MDCT angiography. AJR Am J Roentgenol 185(4):1001–6
Boonyasrinant T, Rajiah P, Schoenhagen P, Halliburton SS, Flamm SD (2009) Relationship of coronay sinus tributaries with myocardial infarction in ischemic versus non ischemic cardiomyopathy; A comprehensive MDCT assessment with implications for cardiac resynchronization therapy. J Cardiovasc Comput Tomogr 3(4):S23–24
Svensson LG, Kouchoukos NT, Miller DC et al (2008) Expert consensus document on the treatment of descending thoracic aortic disease using endovascular stent-grafts. Ann Thorac Surg 85(1 Suppl):S1–S41
United Kingdom EVAR Trial Investigators, Greenhalgh RM, Brown LC, Powell JT, Thompson SG, Epstein D, Sculpher MJ (2010) Endovascular versus open repair of abdominal aortic aneurysm. N Engl J Med 362(20):1863–71
United Kingdom EVAR Trial Investigators, Greenhalgh RM, Brown LC, Powell JT, Thompson SG, Epstein D (2010) Endovascular repair of aortic aneurysm in patients ineligible for open repair. N Engl J Med 362:1872–80
Bean MJ, Johnson PT, Roseborough GS, Black JH, Fishman EK (2008) Thoracic aortic stent-grafts; Utility of multidetector CT for pre and post procedure evaluation. Radiographics 28:1835–1851
Latsios G, Gerckens U, Buellesfield L, Mueller R, John D, Yuecel S, Syring J, Sauren B, Grude B (2010) “Device landing zone” calcification, assessed by MSCT, as a predictive factor for pacemaker implantation after TAVI. Catheter Cardiovasc Interv 76:431–9
Khambadkone S (2012) Percutaneous pulmonary valve implantation. Ann Pediatr Cardiol 5(1):53–60
Lurz P, Coats L, Khambadkone S, Nordmeyer J et al (2008) Percutaneous pulmonary valve implantation: Impact of evolving technology and learning curve on clinical outcome. Circulation 117:1964–72
Shievano S, Coats L, Migliavacca F et al (2007) Variations in right ventricular outflow morphology following repair of congenital heart disease: implications for percutaneous pulmonary valve implantation. J Cardiovasc Magn Reson 9:687–695
Conflicts of interest
None.
Author information
Authors and Affiliations
Corresponding author
Movies
Below is the link to the electronic supplementary material.
Movie 1
Four-dimensional short-axis movie at the level of aortic valve, show restricted leaflet opening in a patient with severe calcific aortic stenosis. (AVI 1467 kb)
Rights and permissions
Open Access This article is distributed under the terms of the Creative Commons Attribution License which permits any use, distribution, and reproduction in any medium, provided the original author(s) and the source are credited.
About this article
Cite this article
Rajiah, P., Schoenhagen, P. The role of computed tomography in pre-procedural planning of cardiovascular surgery and intervention. Insights Imaging 4, 671–689 (2013). https://doi.org/10.1007/s13244-013-0270-8
Received:
Revised:
Accepted:
Published:
Issue Date:
DOI: https://doi.org/10.1007/s13244-013-0270-8