
Abstract
Subsurface hydrocarbon traps are not correctly sealed, and hydrocarbons move vertically from the reservoir as invisible traces in the form of microseepages. Long-term hydrocarbon microseepages cause surface or near-surface alterations such as bleaching of red beds, enrichment of ferrous iron minerals and higher concentrations of clay and carbonate minerals in soils/rocks. Multi- and hyperspectral remote sensing data have successfully been used to detect such alterations in many parts of the world. In India, such studies have not been carried out till now. In this study, Landsat 7 ETM+ images have been used to find out hydrocarbon microseepage-bearing areas in part of Assam–Arakan Fold Belt in the northeastern part of India. Based on the spectral characteristics of the hydrocarbon microseepage-induced altered minerals, two spectral enhancement techniques, viz. principal component analysis (PCA) and band ratio analysis, have been carried out on the Landsat 7 ETM+ images. PCA reveals that three principal component images—1457PC3, 1345PC2 and 3457PC4—show relatively better enhancement for the hydrocarbon-bearing alteration areas. Again, band ratio analysis of the images indicates that ratio images—3/1, (2 + 5)/(3 + 4) and 7/5—show excellent spectral enhancement for the hydrocarbon-induced mineral alterations. The three PC images have been combined with the three band ratio images to find out probable hydrocarbon microseepage areas. The remote sensing-derived prospect areas have been validated with surface geochemical, seismic/geologic and gravity data available in the area.
Introduction
Hydrocarbon accumulations in the subsurface reservoirs are sealed by some impermeable cap rocks such as shale and evaporite. However, these caps as well as the overlying rock successions are not purely impervious in nature and the trapped hydrocarbons move vertically or near-vertically to the surface in the form of microseepages which are slow and invisible but widespread in nature (Etiope 2015; Price 1986; Schumacher 1999). The presence of microseepages is confirmed by the geochemical analyses of adsorbed or headspace gases extracted from surface soil/rock samples (Horvitz 1985; Tedesco 1995). The importance of occurrence of microseepages lies in the fact that they indicate the presence of hydrocarbons beneath the surface. Schumacher (2017) concluded that hydrocarbon microseepage study in combination with other conventional techniques can contribute substantially in fixing potential targets for exploration and thereby increases the chances of discovering new pools in unexplored areas with drastic reduction of exploration costs. In fact, many of the world’s great hydrocarbon reservoirs have been discovered by tracking the occurrence of microseepages on the surface.
It has long been observed that hydrocarbon microseepages create a reducing environment which induces several chemical and mineralogical changes in the rock or soil cover overlying the petroleum reservoirs (Price 1986, Tedesco 1995, Schumacher 1996, Saunders et al. 1999, Etiope and Martinelli 2002, Warren 2012). Satellite-based remote sensing holds a greater promise as a rapid and cost-effective means of detecting these anomalous diagenetic changes on the surface cover. Spectral remote sensing data have been successfully used in many parts of the world to detect the following three main types of hydrocarbon-induced mineralogical alterations: (1) bleaching of red beds: discoloration of red soils/rocks due to the chemically removal of ferric iron (Fe3+) and an increase in ferrous iron (Fe2+) content. Common ferric iron minerals in rocks and soils include hematite, goethite and limonite; (2) formation of clay minerals: development of clay minerals by the alteration of feldspars or micas; and (3) precipitation of carbonate minerals: formation of diagenetic carbonate minerals such as calcite or siderite as a byproduct of petroleum oxidation (Schumacher 1996; Asadzadeh and de Souza Filho 2017).
In the present study, Landsat 7 Enhanced Thematic Mapper Plus (ETM+) data have been used to detect the hydrocarbon microseepage-induced geochemical alterations of minerals present on the surface rocks/soils in part of Assam–Arakan Fold Belt (AAFB), northeast India. Two strong spectral enhancement techniques, viz. principal component analysis (PCA) and band indices on the six bands of Landsat 7 ETM+ (bands 1, 2, 3, 4, 5 and 7) in the visible, near-infrared and shortwave-infrared (VNIR and SWIR) wavelength region of the electromagnetic spectrum, have been used to figure out the potential areas of hydrocarbon-induced mineral alterations. The principal component (PC) and the band index images showing relatively better spectral enhancements for the said mineral alterations have been superimposed, and the most probable areas for hydrocarbon microseepages have been delineated. These delineated prospective areas for hydrocarbon occurrence have been validated with the surface geochemical, seismic, geologic and gravity studies.
Study area
The study area comprises a part of Assam–Arakan Fold Belt (AAFB) in the northeastern part of India covering in the district of Cachar (Silchar), Assam, India (Fig. 1a). Geographically, the study area is bounded by latitude 24°31′N/24°57′N and longitude 92°37′E/93°07′E with an area of about 2400 km2. A true color composite map of the study area consisting of Landsat 7 ETM+ bands 3, 2 and 1 in RGB space is shown in Fig. 1b. AAFB is one of the oldest proven hydrocarbon basins of India and is endowed with huge petroleum resources, though only a small fraction of the resource has been exploited due to the poor understanding of the subsurface structures (Chatterjee et al. 2006).

a Geographical location of the study area, b true color composite map of the study area formed by Landsat 7 ETM+ bands 3, 2 and 1 in RGB space
Geologically, AAFB represents the frontal fold belt of Assam and Assam–Arakan Basin and is believed to be formed as a result of collision between Indian and Burmese plate. The fold belt comprises a series of sub-parallel, elongated, en echelon, linear and tight north–south trending plunging anticlines separated by broad synclinal troughs (Fig. 2). The folds are dissected by a number of cross-faults of multiple alignments. The intensity of deformation and structural complexity gradually increases toward the east (Ram and Venkatraman 1984). The basin is characterized by thick clastic sediments consisting of sandstone and mudstone facies ranging in age from Paleocene to Recent. Several oil and gas fields have been discovered in the basin, which are still under production (Chatterjee et al. 2006; Mazumder et al. 2016).

The climate of the study area is tropical in nature. Summer is hot and humid, while winter is dry. The area is characterized by heavy rainfall from May to September with average annual precipitation of about 3100 mm. Topographically, the study area is mostly covered by flat land with intermittent small hillocks. The highland areas are covered with thick vegetation, while the rest are agricultural or fallow lands. Figure 3a–d shows the terrain characteristics and surface soil/sediment covers of the study area during dry season.

Terrain characteristics and surface soil/sediment covers of the study area during dry season
Landsat data collection and preparation
Landsat 7 ETM+ image data for the study area were thoroughly searched, and a low cloud cover scene with path/row 136/043 acquired on 19-12-1999 was downloaded from www.earthexplorer.usgs.gov.in. The image acquisition time was so selected because during this time the weather of the region becomes dry and cold and also the growth of vegetation becomes minimum. The scene was in UTM projection (Zone + 46) and in 30-m spatial resolution.
The Landsat 7 ETM+ images were processed in Erdas Imagine and ArcGIS software. As the images were already geometrically corrected, no further correction was required. The study area was subset from the images with the co-ordinates 24°31′22.21″N/24°57′5.12″N and 92°37′37.89″E/93°07′23.59″E. Considering the difficulties in identifying mineral alterations in areas of dense vegetation and water bodies, these areas were converted into zero-pixel values using supervised classification.
Spectral image enhancements The following two powerful spectral enhancements have been carried out on the Landsat 7 ETM+ band images:
-
I.
Principal component analysis (PCA)
Principal component analysis (PCA) is a statistical tool to identify patterns of similarities and differences from a dataset of high dimensions. The technique extracts information of variance by reducing the number of dimensions without much loss of information in the original dataset. In the field of remote sensing, PCA is widely used as an image enhancement tool to find out the amount of variance related to a particular feature from among two or more spectral band images. As the numbers of dimensions are significantly reduced in PCA, the resultant images become more informative and clear to visualize features which are difficult to identify in the original images. The first principal component (PC1) image represents the greatest amount of variability among the input images followed by the remaining amount of variability as second, third and so on (PC2, PC3….). Eigenvectors in PCA define the linear combinations of weighted input of images in the principal components, and the eigenvalues represent the measures of variance for a particular factor. Low eigenvalues indicate insignificant variance, and too low values are therefore sometimes ignored for analysis. The loadings in PCA are the correlation coefficients between the PC image and the input images. It is a measure of the importance (weight) of each input spectral band to the particular PC image (Sabins 1999; Gupta Ravi et al. 2013). Crosta technique of PCA has been used in the present study. This is a selective PCA which takes only those bands as input which are spectrally relevant to a specific target. It is, therefore, the target objects are mapped more elegantly and unequivocally in the resultant PC images. The Crosta PCA takes into account both the magnitude and sign of the eigenvector loadings to select only the relevant PC images (Loughlin 1991; Tangestani and Moore 2002).
Out of the six Landsat 7 ETM+ bands (bands 1, 2, 3, 4, 5 and 7), based on the characteristics spectral absorption features of the minerals associated with hydrocarbon microseepages, four bands were taken at a time for PCA composition. Thus, there were a total of 6C4, i.e., 15 different compositions. Among these, the PC images showing relatively better spectral enhancements have been selected for finding out the prospective areas of hydrocarbon microseepages.
-
a.
PC image indicating bleaching of red beds: Ferric iron (Fe3+) minerals show characteristics deep charge-transfer absorption in Landsat 7 ETM+ band 1, crystal field absorption in band 4 (near infrared) and reflectance in bands 3, 5 and 7 (Hunt 1977, Clark 1999; Rockwell 2013). These spectral properties have been used to find out areas of reduced concentration of ferric iron-bearing minerals by PCA. The principal component analysis reveals that the third PC image on bands 1, 4, 5 and 7 (1457PC3) displays the best spectral enhancement for ferric iron minerals (Fig. 4). As evident from Table 1, in PC image 1457PC3, the eigenvector loadings for bands 1 and 4 are negative (− 0.872 and − 0.053), while for band 5 and band 7 are positive (0.485 and 0.046). Therefore, ferric iron-rich areas in the PC image 1457PC3 appear as bright and ferric iron-poor, i.e., the bleached areas appear as dark pixels.
Fig. 4 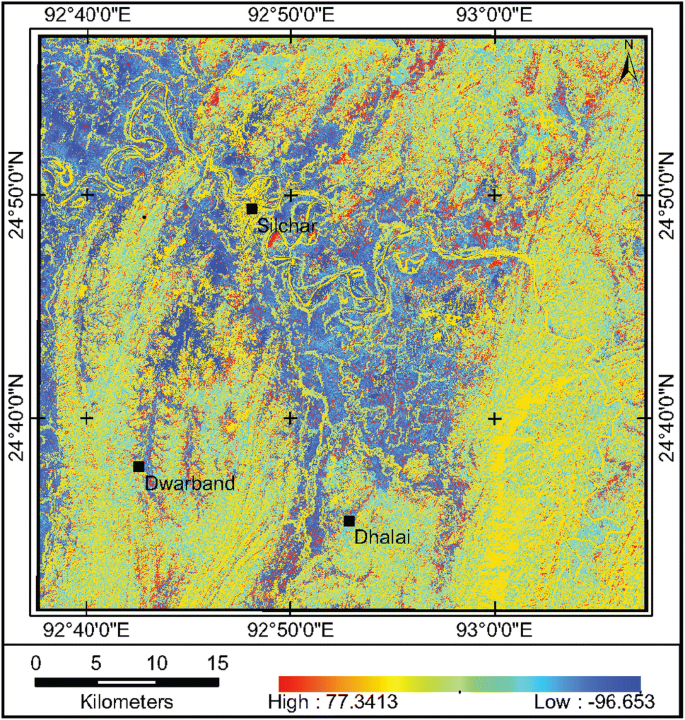
PC image 1457PC3 showing ferric iron (Fe3+) mineral-rich areas as high pixel and ferric iron mineral-poor (bleaching of red beds) areas as low pixel values
Table 1 Eigenvector and eigenvalues of PCA on bands 1, 4, 5 and 7 -
b.
PC image showing the presence of ferrous iron (Fe2+) minerals: The presence of acidic or reducing agents in hydrocarbon microseepage-bearing areas favors the formation of ferrous iron (Fe2+) minerals such as pyrite, siderite, pyrrhotite and ferrihydrate by the reduction of ferric iron minerals (Schumacher 1996, Meer et al. 2002). Ferrous iron increases total reflected radiance in Landsat 7 ETM+ bands 1 and 3 and shows a broad absorption in band 4 (Meer et al. 2002, Zhang et al. 2011) and a falloff in reflectance from band 7 to band 5 (Liu 2000). These spectral characteristics have been used to detect ferrous iron-bearing areas in the principal component images. Principal component analysis indicates that the second PC image on bands 1, 3, 4 and 5 (1345PC2) produces relatively better enhancement for ferrous iron minerals (Fig. 5). In this image, the eigenvector loading for band 4 is positive (+ 0.947) and eigenvector loadings for bands 1, 3 and 5 are − 0.196, − 0.190 and − 0.168, respectively (Table 2). Therefore, ferrous iron-bearing areas will be represented as dark or low pixel values in this PC image. It is also to be noted that the brighter areas in this PC image are dominated by vegetation as revealed by the highly positive eigenvector loading for band 4.
Fig. 5 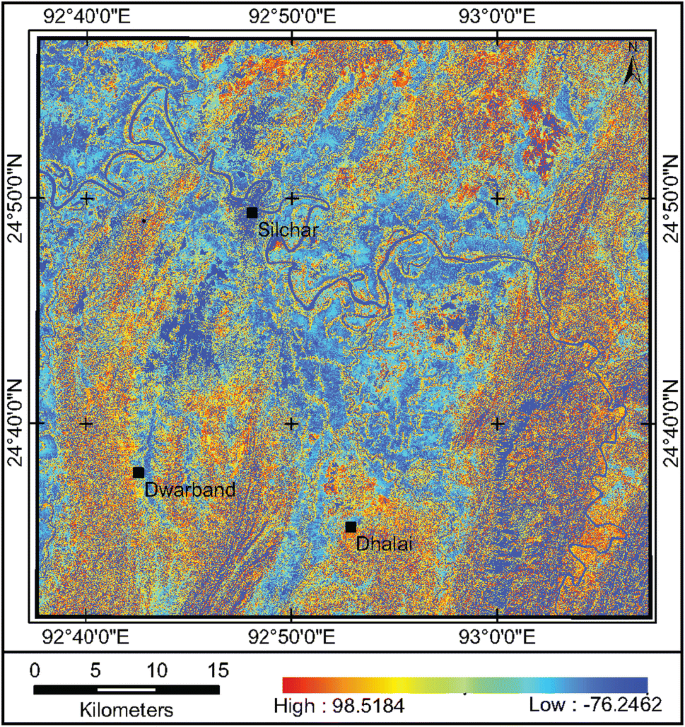
PC image 1345PC2 indicating areas of ferrous iron (Fe2+) mineral abundance as low pixel values
Table 2 Eigenvector and eigenvalues of PCA on bands 1, 3, 4 and 5 -
c.
PC image indicating clay and carbonate mineral abundances: Clay and carbonate minerals exhibit diagnostic absorption features in Landsat 7 ETM+ band 7 and high reflectance in band 5 (Hunt 1977; Goetz and Rowan 1983). Principal component analysis containing bands 5 and 7 shows that the fourth PC image on bands 3, 4, 5 and 7 (3457PC4) has good spectral enhancement for clay and carbonate minerals (Fig. 6). In this PC image, the eigenvector loadings for band 7 and band 5 are 0.878 and − 0.372, respectively (Table 3). As the eigenvector loadings for band 7 and band 5 are positive and negative, respectively, clay and carbonate mineral abundance in this PC image will appear as dark or low pixel values.
Fig. 6 
PC image 3457PC4 representing clay and carbonate mineral-rich areas as low pixel values
Table 3 Eigenvector and eigenvalues of PCA on band 3, 4, 5 and 7


-
II.
Band ratio analysis
Band arithmetic is one of the robust tools in enhancing remote sensing images. Band ratio analysis is very effective to highlight some selective features and has been used widely in geology as well as hydrocarbon microseepage detection (Abrams et al. 1983; Abrams 1984; Sabins 1997; Almeida-Filho et al. 1999, 2002; Tangestani and Moore 2000; Meer et al. 2002; Kariuki et al. 2004; Zhang et al. 2007, 2009, 2011). Based on the spectral characteristics (especially the absorption features) of hydrocarbon microseepage-induced mineralogical alterations, three band ratios have been calculated:
-
a.
Ferric iron (Fe3+) index: Landsat 7 ETM+ band 3/band 1 ratio is the standard index for ferric iron minerals. Higher values (brighter areas) in the index image represent ferric iron-bearing areas, while ferric iron-poor areas are represented by darker pixels. It is therefore, areas characterized by bleaching of red beds are represented by relatively darker or lower pixels values in this band ratio image. The ferric iron index band ratio image for the study area is shown in Fig. 7.
Fig. 7 
Band ratio image 3/1 showing ferric iron (Fe3+)-poor areas as low pixel values (shades of lighter gray regions are areas of thick vegetation/water bodies)
-
b.
Ferrous iron (Fe2+) index: Landsat 7 ETM+ compound band ratio (2 + 5)/(3 + 4) described by Rockwell (2013) has been used to indicate ferrous iron-bearing areas. Higher pixel values in the image represent areas of ferrous iron-bearing minerals. The ferrous iron index image of the study area is shown in Fig. 8.
Fig. 8 
Band ratio image (2 + 5)/(3 + 4) representing ferrous iron (Fe2+) mineral-bearing areas as higher pixel values (lighter gray regions are areas of thick vegetation/water bodies)
-
c.
Clay and carbonate minerals index: The ratio index of band 7/band 5 has been used to find out clay and carbonate-bearing areas in the area under study. Clay and carbonate-bearing areas in the index image are represented by low pixel values. The band ratio image displaying distribution of clay and carbonate minerals for the area is shown in Fig. 9.
Fig. 9 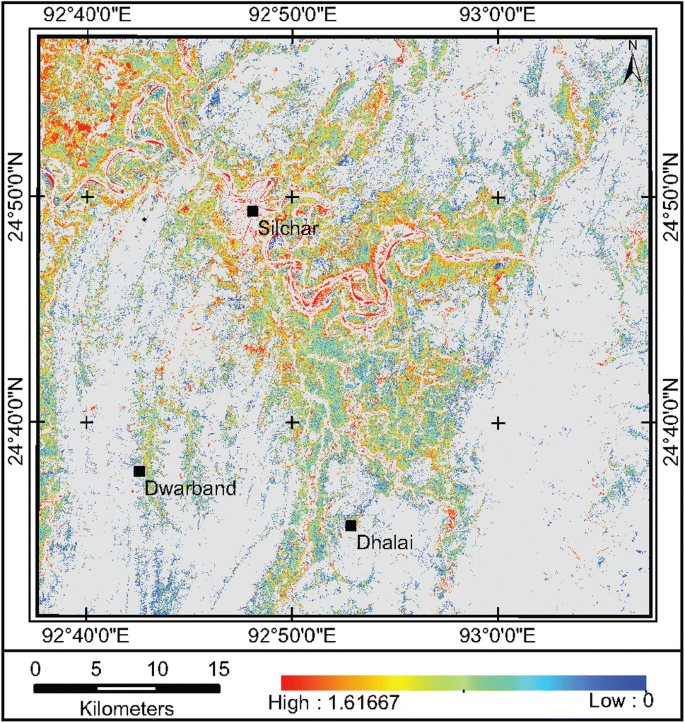
Band ratio image 7/5 indicating clay and carbonate mineral abundance areas as low values (shades of lighter gray regions represent areas of thick vegetation/water bodies)


Hydrocarbon prospect identification
The areas bearing the tonal signatures of the hydrocarbon microseepage-induced altered minerals are carved out in each of the enhanced principal component and band ratio images. These maps are then superimposed one another, and the common areas to all of them are figured out. Therefore, these common areas represent most probable prospect zones for the occurrence hydrocarbon microseepages. The remote sensing-derived hydrocarbon microseepage prospect map for the study area is shown in Fig. 10. The prospect areas have been divided into five distinct zones (prospects I to V) for further evaluation and validation.

Hydrocarbon microseepage map (probable prospect areas) as deduced from principal component and band ratio studies (H11 is a key seismic line)
Validation of the remote sensing analysis through surface geochemical, seismic/geologic and gravity data
Surface geochemical studies
In order to verify the remote sensing-derived hydrocarbon microseepage prospect areas, surface geochemical studies were carried out in the study area. Soil/sediment samples from a depth of 1.2–1.5 m were collected from both the prospect and non-prospect areas. Samples from 45 localities (37 from prospect and 8 from non-prospect areas) were collected in the field. The samples were air-dried and pulverized to micron level, and the adsorbed gases were extracted by decomposing in orthophosphoric acid using a specially designed glass desorber assembly. The derived gas samples were analyzed for lighter hydrocarbon (C1–C5) concentrations by a gas chromatograph fitted with flame ionization detector (FID). Considering the fact that methane (C1) may have the dual origin of thermogenic as well as biogenic, the sum of ethane to pentane (C2–C5) concentration has been considered for confirmation of the hydrocarbon microseepage occurrence. The result of the geochemical analyses of the adsorbed gases is shown in Table 4.
Table 4 clearly shows that 21 out of 37 (57%) prospect areas and 2 out of 8 (25%) non-prospect areas contain C2–C5 components of hydrocarbon. Therefore, it is evident that majority of the remote sensing-derived prospect areas are hydrocarbon microseepage-bearing.
Seismic/geologic studies
The seismic reflection profile (along line H11 extending north–south as shown in Fig. 10) after Chatterjee et al. (2006) for part of the study area shows the presence of two anticlinal structures (to the north and south) on the upthrust blocks (Fig. 11). Both the structures are concealed but proven gas fields in the basin. It is to be observed that prospect zone III and majority of the hydrocarbon microseepage anomalous areas of prospect zone I fall on these two proven gas field structures in the upthrust blocks. Few microseepage anomalous areas of prospect I also lie on the anticlinal structures of the sub-thrust part. Though the sub-thrust part of the profile is not explored, Chatterjee et al. (2006) by studying the analogy with the triangle-zone geometry of other parts of the world have indicated that the sub-thrust part may also be a prospective area for hydrocarbon accumulation. Thus, prospects I and III are well validated with available seismic data. Prospect zone II also lies on part of the same proven gas field as of prospect I. Prospect zones IV and V are not explored seismically, but they fall on or near to the anticlinal structures which may be hydrocarbon-bearing and need further studies.

Interpreted seismic profile along line H11(Chatterjee et al. 2006). The yellow line represents top of a producing horizon
Gravity studies
Satellite gravity data for the study area were downloaded from NOAA website http://topex.ucsd.edu/cgi-bin/get_data.cgi. A gravity contour map at 2-mGal interval has been prepared (Fig. 12). The map shows a prominent low gravity anomaly near the west–central part where the sedimentary thickness appears to be maximum, and this area is conceived as the probable source or kitchen for hydrocarbons in the area. It is to be observed that all the remote sensing-derived hydrocarbon microseepage prospect zones are situated on the flanks of the gravity low, where the chance of charging by hydrocarbon is very high due to proximity to the source.

Satellite gravity map of the study area. Contours are at 2-mGal interval. Remote sensing-derived hydrocarbon microseepage prospect areas are shown as pink
Conclusions
In the present study, remote sensing-based spectral enhancements of Landsat 7 ETM+ images have been used to identify hydrocarbon microseepage-induced mineral alterations, viz. bleaching of red beds, enrichment of ferrous iron, clay and carbonate minerals in surface soils/rocks in part of a petroleum-producing basin. Principal component and band ratio analyses reveal that PC images—1457PC3, 1345PC2, 3457PC4—and band index images—3/1, (2 + 5)/(3 + 4) and 7/5—exhibit good spectral enhancements for the hydrocarbon microseepage-induced alterations. Adsorbed gas analysis for lighter hydrocarbons (C2–C5) confirms that majority of the prospect areas derived by remote sensing studies contain hydrocarbon microseepages. Seismic, geologic and gravity data also support the presence of hydrocarbon-bearing structures on the remote sensing-based prospect areas. This study, therefore, reinforces the concept of remote sensing-based detection of hydrocarbon microseepage-induced alterations in surface soils/rocks in a petroliferous basin characterized by heavy rainfall and substantiates the potential use of remote sensing in minimizing exploration risks. Therefore, it can be concluded that remote sensing mineral alteration mapping can be used effectively to narrow down the search areas for hydrocarbons at the initial stage of exploration. Nevertheless, it is important to remember that remote sensing is only an aid in hydrocarbon exploration and the success of exploration becomes high when remote sensing study is integrated with conventional geophysical techniques like seismics, gravity, magnetics, etc.
References
Abrams M (1984) Recent developments in lithologic mapping using remote sensing data. Bureau de Recherches Geologiques et Minieres 82:177–189
Abrams M, Brown JD, Lepley L, Sadowski R (1983) Remote sensing for porphyry copper deposits in southern Arizona. Econ Geol 78:591–604
Almeida-Filho R, Miranda FP, Yamakawa T (1999) Remote detection of a tonal anomaly in an area of hydrocarbon microseepage, Tucano basin, north-eastern Brazil. Int J Remote Sens 20:2683–2688
Almeida-Filho R, Miranda FP, Galvao LS, Freitas CC (2002) Terrain characteristics of a tonal anomaly remotely detected in an area of hydrocarbon microseepage Tucano basin north-eastern Brazil. Int J Remote Sens 23:3893–3898
Asadzadeh S, de Souza Filho CR (2017) Spectral remote sensing for onshore seepage characterization: a critical overview. Earth Sci Rev 168:48–72
Chatterjee SM, Deb A, Rao CV, Reddy PK, Sanyal A, Yadagiri K (2006) Triangle zone geometry in Cachar thrust-fold belt, India. SEG. New Orleans Annu Meet 76:1118–1122
Clark RN (1999) Spectroscopy of rocks and minerals, and principles of spectroscopy. In: Rencz AN (ed) Manual of remote sensing, vol 3. Remote sensing for the earth sciences. Wiley, New York, pp 3–58
Etiope G (2015) Natural gas seepage: the earth’s hydrocarbon degassing. Springer, Cham
Etiope G, Martinelli G (2002) Migration of carrier and trace gases in the geosphere: an overview. Phys Earth Planet Inter 129(3–4):185–204
Goetz AFH, Rowan BN (1983) Remote sensing for exploration: an overview. Econ Geol 78:573–590
Gupta Ravi P, Tiwari RK, Saini Varinder, Srivastava Neeraj (2013) A simplified approach for interpreting principal component images. Adv Remote Sens 2:111–119
Horvitz L (1985) Geochemical exploration for petroleum. Science 229(4716):821–827
Hunt GR (1977) Spectral signatures of particulate minerals in the visible and near-infrared. Geophysics 42:501–513
Kamaraju AVVS (2010) Modeling concealed structures of Cachar fold belt integrating seismic, geologic and landsat imageries with special reference to Bhubandar field-Assam and Assam Arakan Fold belt, India. In: 8th biennial international conference & exposition on petroleum geophysics, Hyderabad
Kariuki PC, Woldai T, Meer F (2004) The role of remote sensing in mapping swelling soils. Asian J Geoinform 5:1–11
Liu JJ (2000) Remote sensing information acquisition of paleochannel sandstone type uranium deposit in Nuheting area. Uranium Geol 16:52–57
Loughlin WP (1991) Principal component analysis for alteration mapping. Photogramm Eng Remote Sens 57:1163–1169
Mazumder S, Adhikari K, Mitra DS, Mahapatra S, Pangtey KKS (2016) A neotectonic based geomorphic analysis using remote sensing data to delineate potential areas of hydrocarbon exploration: Cachar area, Assam. J Geol Soc India 88:1–11
Meer F, Dijk P, Werff H, Yang H (2002) Remote sensing and petroleum seepage: a review and case study. Terra Nova 14:1–17
NOAA website: http://topex.ucsd.edu/cgi-bin/get_data.cgi. Accessed Apr 2017
Price LC (1986) A critical overview and proposed working model of surface geochemical exploration. In: Davidson MJ (ed) Unconventional methods in exploration for petroleum and natural gas. Southern Methodist University Press, Dallas, pp 245–304
Ram J, Venkatraman B (1984) Tectonic framework and hydrocarbon prospects of Mizoram. Petrol Asia J 2:60–65
Rockwell BW (2013) Automated mapping of mineral groups and green vegetation from landsat thematic mapper imagery with an example from the San Juan Mountains, Colorado: U.S. Geological Survey Scientific Investigations Map 3252, 25p, pamphlet. http://pubs.usgs.gov/sim/3252/
Sabins FF (1997) Remote sensing - principles and interpretation. W H Freeman, New York
Sabins FF (1999) Remote sensing for mineral exploration. Ore Geol Rev 14:157–183
Saunders DF, Burson KR, Thompson CK (1999) Model for hydrocarbon microseepage and related near-surface alterations. Bull. AAPG 83:170–185
Schumacher D (1996) Hydrocarbon-induced alteration of soils and sediments. In: Schumacher D, Abrams MA (eds) Hydrocarbon migration and its near-surface expression, Mem. In: AAPG 66, pp 71–89
Schumacher D (1999) Surface geochemical exploration for petroleum: In: Beaumont EA, Foster NH (eds) Treatise of petroleum geology/Handbook of petroleum geology: exploring for oil and gas traps. In: AAPG, pp 18-1-18-27
Schumacher D (2017) Surface geochemical exploration after 100 years: lessons learned and what more must be done. In: AAPG. Search and discovery article no. 42072
Tangestani MH, Moore F (2000) Iron oxide and hydroxyl enhancement using the Crosta Method: a case study from the Zagros Belt, Fars Province, Iran. Int J Appl Earth Obs Geoinform 2:140–146
Tangestani MH, Moore F (2002) Porphyry copper alteration mapping at the Meiduk area,Iran. Int J Remote Sens 23(22):4815–4826
Tedesco SA (1995) Surface geochemistry in petroleum exploration. Chapman and Hall Inc, New York
Warren RK (2012) Near-surface resistivity for hydrocarbon detection. Lead Edge 31(10):1182–1191
Zhang GF, Shen XH, Zou LJ, Li CJ, Wang YL, Lu SL (2007) Detection of hydrocarbon bearing sand through remote sensing technique in Western slope zone of Songliao basin, China. Int J Remote Sens 28:1819–1833
Zhang GF, Lejun Z, Xiaohua S, Shanlong L, Changjiang L, Chen H (2009) Remote sensing detection of heavy oil through spectral enhancement techniques in the western slope zone of Songliao Basin, China. Bull AAPG 93(1):31–49
Zhang GF, Zheng Z, Shen X, Zou L, Huang K (2011) Remote sensing interpretation of areas with hydrocarbon microseepage in northeast China using Landsat-7/ETM+ data processing techniques. Int J Remote Sens 32(21):6695–6711
Acknowledgements
The authors are grateful to the Department of Applied Geology, Indian Institute of Technology (Indian School of Mines), Dhanbad, for providing necessary infrastructural facilities to carry out the laboratory studies. The authors also express their deep gratitude to the anonymous reviewers for their critical comments and reviews. The views expressed in this article are of the authors own and do not represent the organizations they belong.
Author information
Authors and Affiliations
Corresponding author
Ethics declarations
Conflict of interest
The authors declare that they have no conflict of interest.
Additional information
Publisher’s Note
Springer Nature remains neutral with regard to jurisdictional claims in published maps and institutional affiliations.
Rights and permissions
Open Access This article is distributed under the terms of the Creative Commons Attribution 4.0 International License (http://creativecommons.org/licenses/by/4.0/), which permits unrestricted use, distribution, and reproduction in any medium, provided you give appropriate credit to the original author(s) and the source, provide a link to the Creative Commons license, and indicate if changes were made.
About this article

Cite this article
Garain, S., Mitra, D. & Das, P. Detection of hydrocarbon microseepage-induced anomalies by spectral enhancements of Landsat 7 ETM+ images in part of Assam–Arakan Fold Belt, India. J Petrol Explor Prod Technol 9, 2573–2582 (2019). https://doi.org/10.1007/s13202-019-00747-w
Received:
Accepted:
Published:
Issue Date:
DOI: https://doi.org/10.1007/s13202-019-00747-w