
Abstract
Spontaneous imbibition of water-based fracturing fluids into the shale matrix is considered to be the main mechanism responsible for the high volume of water loss during the flowback period. Understanding the matrix imbibition capacity and rate helps to determine the fracturing fluid volume, optimize the flowback design, and to analyze the influences on the production of shale gas. Imbibition experiments were conducted on shale samples from the Sichuan Basin, and some tight sandstone samples from the Ordos Basin. Tight volcanic samples from the Songliao Basin were also investigated for comparison. The effects of porosity, clay minerals, surfactants, and KCl solutions on the matrix imbibition capacity and rate were systematically investigated. The results show that the imbibition characteristic of tight rocks can be characterized by the imbibition curve shape, the imbibition capacity, the imbibition rate, and the diffusion rate. The driving forces of water imbibition are the capillary pressure and the clay absorption force. For the tight rocks with low clay contents, the imbibition capacity and rate are positively correlated with the porosity. For tight rocks with high clay content, the type and content of clay minerals are the most important factors affecting the imbibition capacity. The imbibed water volume normalized by the porosity increases with an increasing total clay content. Smectite and illite/smectite tend to greatly enhance the water imbibition capacity. Furthermore, clay-rich tight rocks can imbibe a volume of water greater than their measured pore volume. The average ratio of the imbibed water volume to the pore volume is approximately 1.1 in the Niutitang shale, 1.9 in the Lujiaping shale, 2.8 in the Longmaxi shale, and 4.0 in the Yingcheng volcanic rock, and this ratio can be regarded as a parameter that indicates the influence of clay. In addition, surfactants can change the imbibition capacity due to alteration of the capillary pressure and wettability. A 10 wt% KCl solution can inhibit clay absorption to reduce the imbibition capacity.
1 Introduction
Multistage hydraulic fracturing is a critical technology for economic production from shale reservoirs. Large amounts of water-based fracturing fluids are pumped into formations, generating extensive fracture networks and stimulating low-permeability formations. Field operations have demonstrated that large volumes of injected fluids are retained in shale formations, with a flowback efficiency of lower than 30 % (Makhanov et al. 2014). In the U.S. Haynesville shale formation, the flowback rate is even lower than 5 % after fracturing operations (Penny et al. 2006). Besides possibly causing a series of environmental problems, the retention of fracturing fluids in shale formations can greatly enhance the water saturation near fracture surfaces and influence two-phase fluid flow, thus further inhibiting the production of shale gas (Sharma and Agrawal 2013). Furthermore, intense interaction between fluid and shale can dramatically change rock properties and impact on the generation of fracture networks during fracturing (Yuan et al. 2014). Therefore, studying the imbibition capacity and its main controlling factors is essential to understanding reservoir performance and optimizing fracturing operations.
It is generally believed that spontaneous imbibition of fracturing fluids into the shale matrix plays an important role in water loss. Many researchers have focused on the mechanism of fracturing fluid imbibition. Makhanov et al. (2012) found that imbibition rates perpendicular and parallel to the bedding plane are different, and the latter is higher. Hu et al. (2012) considered that the Barnett shale has a poor connectivity, which greatly influences the flow and diffusion of fluid. Roychaudhuri et al. (2013) determined that a surfactant can effectively reduce the imbibition rate of fracturing fluids, and the driving force of imbibition is the capillary pressure. Dehghanpour et al. (2013) mentioned that the amount of imbibition in shale is positively related to mineral composition and physical properties. Fakcharoenphol et al. (2014) investigated the effects of salinity on water imbibition and found that the osmotic pressure can act as the driving force for water intake. Currently, it is well known that the imbibition of fracturing fluids is mainly controlled by the capillary pressure, while the effects of clay absorption have not been studied thoroughly. The imbibition capacity, imbibition rate, and other influencing factors in shale reservoirs have not been investigated systematically.
This paper focuses on the imbibition capacity and the influence of the mineral composition and physical properties of tight rocks. Samples include gas shales from the Sichuan Basin, tight sandstones from the Ordos Basin, and tight volcanic rocks from the Songliao Basin. Experiments can be divided into three groups. In group 1, the imbibition capacity and rate of deionized water uptake are investigated systematically. In group 2, each sample is immersed repeatedly in deionized water several times to address the water sensitivity of different rocks. In group 3, comparative experiments are conducted to explore the effects of different fluids on the imbibition capacity.
2 Experimental
2.1 Rock samples and fluids
Sixty-six shale and tight gas rock samples from the Ordos Basin, Songliao Basin, and the Sichuan Basin were used to conduct comparative imbibition experiments, and reservoir rock properties are presented in Table 1. The mineral composition (in wt%) of the shale and tight gas rock samples and the relative abundance of clay minerals are listed in Table 2. The samples were neither cleaned nor exposed to air beforehand. According to the observed brittleness of rocks, the samples were machined into cylindrical or prismatic core plugs, as shown in Tables 3, 4, and 5. The effects of the sample size and shape can be normalized by the scaling method.
Deionized water, 10 wt% KCl solution, and an aqueous solution of cationic surfactant were used as the imbibing fluids. Properties of the test fluids are listed in Table 6. The most commonly used boundary conditions for imbibition are one-end-open (OEO), all-faces-open (AFO), and two-ends-open (TEO). Considering the effect of lamination on the imbibition rate, for 1-D imbibition (OEO and TEO), the open face is parallel to the bedding plane to maintain the same experimental conditions.
2.2 Experimental apparatus and procedure
In group 1 experiments, the experimental results are sensitive to test environments and the instrumental error due to the relatively low imbibition rate in shale and tight rock samples. Therefore, a series of measurements are required to improve the measurement accuracy:
-
(1)
All of the samples were weighted by an analytical balance (Mettler XPE205) with an accuracy of 0.00001 g.
-
(2)
Impermeable and nonelastic strings used to suspend core slugs had a diameter of approximately 0.13 mm, which could avoid the error caused by the reduction in the liquid volume.
-
(3)
The experimental device was placed in a chamber with constant temperature and humidity to lower the effect of variable external temperature and humidity. The experimental device is shown in Fig. 1.
Fig. 1 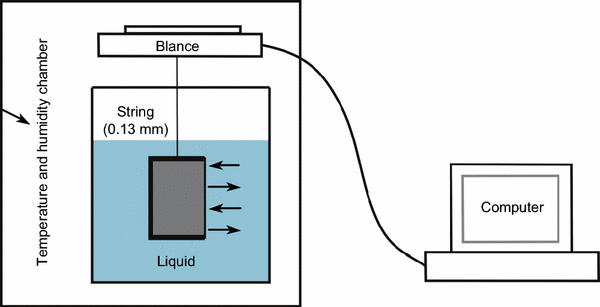
Schematic for imbibition experiments in the OEO condition
-
(4)
The whole apparatus was placed in the basement of a building to minimize the vibration from the ground surface.

The experimental procedure is as follows:
-
(1)
The initial dimensions and mass of the core slug were measured before experiment.
-
(2)
Impermeable epoxy was used to satisfy TEO and OEO, imbibition boundary conditions.
-
(3)
The core slug was dried in an oven at 105 °C until there was no further change in weight.
-
(4)
After the core slug cooled down, the sample was suspended on the analytical balance. The sample was totally submerged into water by adjusting the liquid level.
-
(5)
The variation of the sample mass with time was measured and then recorded on a computer as water was spontaneously imbibed into the sample.
-
(6)
The mass of the imbibed water was calculated by subtracting the initial mass from the mass recorded after the imbibition experiments. The experimental data were normalized by the scaling method, which is described in the other sections.
The experimental procedure of the group 2 experiments is the same as that of the group 1 experiments. Each sample was immersed in deionized water and dried repeatedly several times. The basic sample data are presented in Table 4.
In group 3, samples of the same formation were acquired from the same core to reduce the influences of heterogeneity. A total of 18 samples were dried for 24 h and submerged into different fluids until there was no further change in weight. This process lasted approximately 7 days. The basic information about the samples is shown in Table 5.
3 Experimental data and analysis
3.1 Scaling method for experimental data normalization
The samples used had different sizes and shapes. Characterization methods need to be developed to normalize the effects of size and shape and represent the imbibition capacity and rate.
-
(1)
The imbibition capacity can be determined based on the curve of water volume gain per pore volume versus time.
-
(2)
Handy (1960) established a famous gas–water imbibition model, which is given by the following equation:
$${{V_{\text{imb}} } \mathord{\left/ {\vphantom {{V_{\text{imb}} } {A_{\text{c}} }}} \right. \kern-0pt} {A_{\text{c}} }} = \sqrt {\frac{{2P_{\text{c}} \phi KS_{\text{wf}} }}{{\mu_{\text{w}} }}} \sqrt t,$$(1)where V imb is the volume of imbibed water, cm3; P c is the capillary pressure, MPa; ϕ is the porosity, %; K is the permeability, mD; S wf is the water saturation, %; A c is the imbibition cross-sectional area, cm2; μ w is the fluid viscosity, mPa s; and t is the imbibition time, s.
The slope of the volume of imbibed fluid per sectional area versus the square of time, A i, can be used to represent the imbibition rate, which can be obtained from experimental data (Makhanov et al. 2014).
According to Eq. (1), the imbibition rate can be given as follows:
The log–log relationship can be given by the following equation:
The effective imbibition driving force can be given as follows:
where \(\alpha\) is the driving force coefficient, 1/s. \(\alpha\) reflects the effect of difference between imbibition driving force and friction resistance, which can be obtained by experiments.
Equations (2)–(4) can be used to analyze contributing factors to the imbibition rate, which is discussed in the following sections.
3.2 Imbibition curve characteristics
The imbibition characteristics of tight rocks can be characterized by the imbibition capacity, the imbibition rate, and the diffusion rate.
Figure 2 shows plots of the volume normalized by the pore volume versus time. The cumulative imbibed volume increases with time. However, the rate of water intake obviously slows down with increasing time, and the rate approximately reaches zero, which represents the equilibrium condition (Sun et al. 2015). However, some curves may have “upward tails,” which demonstrate an obvious diffusion effect and may be related to the complex pore structure in these rock samples, as shown in Fig. 2f. Though the size and shape of core samples vary significantly, the water volume normalized by the pore volume can represent the imbibition capacity well. It is worth noting that the highest points in the curves may not always remain at the same value, which may be explained by the heterogeneity of core samples as shown in Fig. 2c, d, e, f. In addition, the volume gain fluctuates in some samples, which may be due to the large amount of water-sensitive I/S mixed-layer in this tight rock, as shown in Fig. 2c, e, f. This effect will be discussed in detail later.

Normalized cumulative imbibed volume versus time in group 1. a S formation; b H formation; c UY/LY formations; d L formation; e LM formation; f N formation
Figure 3 shows plots of the imbibed volume normalized by the sectional area versus the square root of time. The effect of the sectional area is normalized well. The measurements tend to sit close to a smooth curve that represents the imbibition rate as shown in Fig. 3a, b, d, e. In Fig. 3c, e, the departure from a smooth curve can be explained by the strong heterogeneity in these tight rocks.

Imbibed volume per sectional area versus the square of time in group 1. a S formation; b H formation; c UY/LY formations; d L formation; e LM formation; f N formation
The imbibition curves generally behave similarly. Each profile is divided into three regions: the initial linear imbibition region (Region 1), the transition region (Region 2), and the diffusion region (Region 3), as shown in Fig. 4 (Lan et al. 2014). However, the curve characteristics of different tight rocks vary significantly, which may be attributed to the pore size distribution and pore connectivity. The slope in Region 1 represents the imbibition rate (A i), where the capillary pressure may be the primary driving force. As the water saturation increases, the capillary pressure decreases, and the water intake process begins to enter Region 2. In Region 3, diffusion is the primary flow driving force compared with capillary imbibition in Region 1. In tight reservoir rocks, the diffusion effect is more obvious than that in conventional reservoir rocks. It can be represented by the diffusion rate (A d). However, a study of the diffusion rate is not included in this paper.

Schematic of imbibition curve behavior
3.3 Imbibition capacity and rate
The ratios of the maximum imbibed volume to the pore volume, R exceed 1 in the UY, LY, L, LM, and N formations, as shown in Fig. 5a. In particular, for the UY formation, R is 6–8. In other words, the imbibed volume of the rock in the tight reservoir can exceed the pore volume of the rock by a factor of 6–8. This result is consistent with the results of Zhou et al. (2014). There is a significant difference between these results and the conventional opinion that the water saturation should be 0–1. Therefore, the capacity for fracturing fluid intake in tight reservoirs may greatly exceed the conventional estimation. The relative relationship of R is UY tight volcanic > LM shale > LY tight volcanic > L shale > N shale > H tight volcanic > S tight sandstone.

Distribution of the imbibition capacity normalized by porosity and imbibition rate. a Imbibition capacity by porosity; b Imbibition rate
Figure 5b presents the distribution of the imbibition rate. The imbibition rates in the S and H formations are approximately 0.05–0.1 cm/h0.5, which is obviously higher than the rates for the LY, LM, N, and L formations. The relative relationship of the imbibition rate is S tight sandstone > H tight volcanic > UY tight volcanic > LY tight volcanic > LM shale > L shale > N shale.
It is worth noting that the imbibed volume exceeds the pore volume in rocks, so the water presumably entered into a space where the gas used to measure the porosity could not enter. Another explanation is that absorption of water by the clay can induce cracks and increase the pore volume. The high water imbibition capacity in tight rocks may be related to clay minerals. This is consistent with the well-known phenomenon of wellbore instability in well drilling. The experiments in group 2 were conducted to explore the effects of clay minerals on the imbibition process. A single sample was tested several times repeatedly.
The samples in the S, H, L, and N formations have good reproducibility, which illustrates that the inner pore volume of the rock does not obviously change after water imbibition, as shown in Fig. 6a, b, d, f. However, the imbibed water volume of the sample from the UY and LM formations obviously increased after the first immersion, as shown in Fig. 6c, e. The rock from the UY formation disintegrates during the third imbibition, as shown in Fig. 6a. The rock from the LM formation generates micro-fractures, as shown in Fig. 6b. The expansion of clay minerals with water imbibition and the generation of micro-fractures could increase the pore volume, achieving an additional imbibition capacity beyond the initial pore volume. In addition, the R values of shales in the L and N formations are higher than 1, though these formations have good imbibition reproducibilities. This suggests that the water could enter a space that gas could not enter. Therefore, the water imbibed into the tight rocks exits in the space that can be divided into two parts: the pore space and the clay crystal lattice space. In addition, the imbibed water volume per unit pore volume, R can be used as a parameter to indicate the clay content and type.

Repeated immersion tests in group 2. a S formation; b H formation; c UY formation; d L formation; e LM formation; f N formation
3.4 Influencing factors
In this section, the authors try to address the factors influencing the imbibition capacity and rate, including the porosity, permeability, clay minerals, and the fluid component.
3.4.1 Porosity
For a ratio of imbibition volume to pore volume of more than 1, the conventional definition of water location is not applicable for tight formations. The imbibition capacity can be defined as the imbibition volume per unit dry sample volume. The parameter is broadly applicable and can be used to determine the fracturing fluid volume intake. A plot of the imbibition capacity versus the porosity is shown in Fig. 7a. The general trend is that the imbibition capacity increases with increasing porosity. The green line in Fig. 7a shows when the imbibition capacity is equal to the porosity. In other words, the imbibed volume is equal to the pore volume. Obviously, when the rocks have high porosities, the points tend to be below the line. One explanation is that the rocks with high porosities have low water saturation. When the rocks have low porosities, the points tend to be above the line. Therefore, the plot can be divided into three regions. In Region I, the low-porosity region, the points are above the line, and R tends to exceed 1. The imbibition capacity is mainly controlled by the clay mineral content. In Region II, the moderate-porosity region, the points are on the line, and R tends to be 1. The imbibition capacity is mainly controlled by the clay mineral content and porosity. In Region III, the high-porosity region, the points are below the line, and R tends to be lower than 1. In this region, the rocks with high porosities tend to have low clay contents. Therefore, the imbibition capacity is mainly controlled by the porosity.

Imbibition capacity and rate versus porosity. a Imbibition capacity; b Imbibition rate
In Fig. 7b, the imbibition rate is positively correlated with the porosity, which is consistent with the prediction of Eq. (2). This result means that porosity is the main controlling factor for the imbibition rate.
3.4.2 Permeability
In Fig. 8, the imbibition capacity and rate are positively correlated with permeability. However, the correlation is not strong. In addition, there is an obvious departure from the prediction of Eq. (3). This result means that permeability is not the main controlling factor for the imbibition rate.

Imbibition capacity and rate versus permeability. a Imbibition capacity; b Imbibition rate
3.4.3 Clay minerals
In order to explore the effect of the clay content and type on the imbibition capacity and rate, the effect of the porosity is normalized. Then the water saturation and the driving force coefficient are used to represent the imbibition capacity and rate, respectively.
The imbibition capacity is positively related to the total clay content, the I/S, and illite concentrations, as shown in Figs. 9a, 10a, and 11a. The imbibition rate is also positively related to the total clay content and the I/S concentration, as shown in Figs. 9b and 10b. However, the correlation between the imbibition rate and the illite concentration is not strong.

Imbibition capacity normalized by porosity and driving force coefficient versus total clay concentration. a Imbibition capacity normalized by porosity; b Driving force coefficient

Imbibition capacity normalized by porosity and driving force coefficient versus I/S concentration. a Imbibition capacity normalized by porosity; b Driving force coefficient

Imbibition capacity normalized by porosity and rate versus illite concentration. a Imbibition capacity normalized by porosity; b Driving force coefficient
In Fig. 9a, the imbibition capacity is closely related to the total clay concentration. However, the H and LY formations deviate from the rule. The H and LY formations have relatively high clay contents, but their imbibition capacities are lower than those of the L and LM formations. The clay type in the H formation is mainly chlorite, while the clay of the L formation is mainly I/S. I/S has a relatively high specific surface area that can absorb larger amounts of water. Unlike the LM formation, the LY formation does not contain smectite. The specific surface area of smectite is much higher than that of I/S, which is probably the main reason for the deviation from the rule in the LY formation. This proves that the imbibition capacity is related to not only the clay content but also the clay type.
3.4.4 Fluids
In group 3 experiments, a surfactant solution and a KCl solution changed the two driving forces and were used to explore the effect of the fracturing fluid component on the imbibition capacity.
The contact angle on the surface of LM-8 rock was measured with an imaging method, as shown in Fig. 12. The contact angle is 14° before cationic surfactant treatment and 51° after treatment. The surface wettability is altered and tends to be intermediately wet, which may lead to a lower imbibition capacity.

Contact angle on sample LM-8 with a water drop. a Before surfactant treatment (14°); b After surfactant treatment (51°)
The capillary suction time (CST) tests are quick and easy and can provide information about inhibition characteristics of an additive (Berry et al. 2008). The authors tried to understand the inhibitive ability of a 10 wt% KCl solution on clay expansion and explored its effect on the imbibition capacity. The CST apparatus measures the time required for the fluid to travel a given distance, as shown in Fig. 13. A short CST time interval reflects a poor clay dispersibility. The results of CST tests are shown in Fig. 14. The relative relationship of the CST time in tight formations is UY > LM > N > L > H > S, which is positively related to the I/S concentration. The 10 wt% KCl solution inhibits the clay expansion in tight formations, especially for the UY and LM formations. This effect may lead to a lower imbibition capacity.

CST apparatus

CST time in different formations with two solutions
The results from group 3 experiments are presented in Fig. 15. The surfactant and 10 wt% KCl solutions reduce the imbibition capacity. For the UY and LM formations, the reduced imbibition capacity is more obvious. Figure 16 shows pictures of the UY and LM formation samples after exposure to the surfactant and 10 wt% KCl solutions. When exposed to deionized water, the sample from the UY formation disintegrates completely, and the sample from the LM formation generates some micro-fractures along the bedding plane. The 10 wt% KCl solution has a good inhibitive effect on disintegration and micro-fractures, which is consistent with the results of CST tests, as shown in Fig. 16.

The effect of imbibed fluids on the imbibition capacity in group 3

Pictures of tight rock samples after exposure to different fluids. a UY formation; b LM formation
4 Conclusions
A series of spontaneous imbibition experiments were carried out, and the following conclusions were reached:
-
(1)
Tight rock imbibition can be characterized by the imbibition capacity, the imbibition rate, and the diffusion rate. The imbibition capacity and rate are positively correlated with porosity. The imbibition curves can typically be divided into three regions: the initial linear imbibition region, the transition region, and the diffusion region.
-
(2)
The water-holding space in tight rocks consists of two parts: the pore space and the clay crystal lattice space. The driving forces of spontaneous imbibition in tight rocks are the capillary force and the clay absorption force. A new parameter, the effective driving force of imbibition, is defined to describe the effect of clay absorption.
-
(3)
The clay mineral content significantly influences the imbibition capacity for clay-rich tight rocks. The imbibition capacity normalized by the porosity increases with increasing total clay, I/S, and illite concentrations. Smectite and I/S with a high specific area tend to lead to strong water imbibition.
-
(4)
The water volume imbibed into the clay-rich tight rocks is much greater than the pore volume measured by helium. The imbibed volume per unit pore volume is a parameter that can evaluate the effect of the clay content and type.
-
(5)
Surfactants can change the imbibition capacity of tight rocks by altering the interfacial tension and wettability. A 10 wt% KCl solution can inhibit the clay expansion, which also reduces the imbibition capacity.
References
Berry SL, Boles JL, Brannon HD, et al. Performance evaluation of ionic liquids as a clay stabilizer and shale inhibitor. In: SPE international symposium and exhibition on formation damage control, 13–15 February, Lafayette, Louisiana, USA. 2008. doi:10.2118/112540-MS.
Dehghanpour H, Lan Q, Saeed Y, et al. Spontaneous imbibition of brine and oil in gas shales: effect of water adsorption and resulting microfractures. Energy Fuels. 2013;27(6):3039–49. doi:10.1021/ef4002814.
Fakcharoenphol P, Kurtoglu B, Kazemi H, et al. The effect of osmotic pressure on improve oil recovery from fractured shale formations. In: SPE unconventional resources conference, 1–3 April, The Woodlands, Texas, USA. 2014. doi:10.2118/168998-MS.
Handy LL. Determination of effective capillary pressures for porous media from imbibition data. Trans AIME. 1960;219:75–80.
Hu Q, Ewing RP, Dultz S. Low pore connectivity in natural rock. J Contam Hydrol. 2012;133:76–83. doi:10.1016/j.jconhyd.2012.03.006.
Lan Q, Dehghanpour H, Wood J, et al. Wettability of the Montney tight gas formation. In: SPE/CSUR unconventional resources conference—Canada, 30 September–2 October, Calgary, Alberta, Canada. 2014. doi:10.2118/171620-MS.
Makhanov K, Dehghanpour H, Kuru E. An experimental study of spontaneous imbibition in Horn River shales. In: SPE Canadian unconventional resources conference, 30 October–1 November, Calgary, Alberta, Canada. 2012. doi:10.2118/162650-MS.
Makhanov K, Habibi A, Dehghanpour H, et al. Liquid uptake of gas shales: a workflow to estimate water loss during shut-in periods after fracturing operations. J Unconv Oil Gas Resour. 2014;7:22–32. doi:10.1016/j.juogr.2014.04.001.
Penny GS, Dobkins TA, Pursley JT. Field study of completion fluids to enhance gas production in the Barnett Shale. In: SPE gas technology symposium, 15–17 May, Calgary, Alberta, Canada. 2006. doi:10.2118/100434-MS.
Roychaudhuri B, Tsotsis TT, Jessen K. An experimental investigation of spontaneous imbibition in gas shales. J Pet Sci Eng. 2013;111:87–97. doi:10.1016/j.petrol.2013.10.002.
Sharma M, Agrawal S. Impact of liquid loading in hydraulic fractures on well productivity. In: SPE hydraulic fracturing technology conference, 4–6 February, The Woodlands, Texas, USA. 2013. doi:10.2118/163837-MS.
Sun Y, Bai B, Wei M. Microfracture and surfactant impact on linear cocurrent brine imbibition in gas-saturated shale. Energy Fuels. 2015;29(3):1438–46. doi:10.1021/ef5025559.
Yuan W, Li X, Pan Z, et al. Experimental investigation of interactions between water and a lower Silurian Chinese shale. Energy Fuels. 2014;28(8):4925–33. doi:10.1021/ef500915k.
Zhou Z, Hoffman BT, Bearinger D, et al. Experimental and numerical study on spontaneous imbibition of fracturing fluids in shale gas formation. In: SPE/CSUR unconventional resources conference—Canada, 30 September–2 October, Calgary, Alberta, Canada. 2014. doi:10.2118/171600-MS.
Acknowledgments
This research program was financially supported by the National Basic Research Program of China (973 Program) Granted No. 2015CB250903 and the National Natural Science Foundation of China Granted No. 51490652. The Chongqing Institute of Geology and Mineral Resources supported this field work.
Author information
Authors and Affiliations
Corresponding author
Additional information
Edited by Yan-Hua Sun
Rights and permissions
Open Access This article is distributed under the terms of the Creative Commons Attribution 4.0 International License (http://creativecommons.org/licenses/by/4.0/), which permits unrestricted use, distribution, and reproduction in any medium, provided you give appropriate credit to the original author(s) and the source, provide a link to the Creative Commons license, and indicate if changes were made.
About this article

Cite this article
Ge, HK., Yang, L., Shen, YH. et al. Experimental investigation of shale imbibition capacity and the factors influencing loss of hydraulic fracturing fluids. Pet. Sci. 12, 636–650 (2015). https://doi.org/10.1007/s12182-015-0049-2
Received:
Published:
Issue Date:
DOI: https://doi.org/10.1007/s12182-015-0049-2