
Abstract
A primary mode of human social behavior is face-to-face interaction. In this study, we investigated the characteristics of gaze and its relation to speech behavior during video-mediated face-to-face interactions between parents and their preadolescent children. 81 parent–child dyads engaged in conversations about cooperative and conflictive family topics. We used a dual-eye tracking setup that is capable of concurrently recording eye movements, frontal video, and audio from two conversational partners. Our results show that children spoke more in the cooperation-scenario whereas parents spoke more in the conflict-scenario. Parents gazed slightly more at the eyes of their children in the conflict-scenario compared to the cooperation-scenario. Both parents and children looked more at the other's mouth region while listening compared to while speaking. Results are discussed in terms of the role that parents and children take during cooperative and conflictive interactions and how gaze behavior may support and coordinate such interactions.
Introduction
A primary mode of human social behavior is face-to-face interaction. This is the “central ecological niche” where languages are learned and most language use occurs (Holler & Levinson, 2019, p. 639). Face-to-face interactions are characterized by a variety of verbal and nonverbal behaviors, such as speech, gazing, facial displays, and gestures. Since the 1960s, researchers have extensively investigated the coordination and regulation of these behaviors (Duncan & Fiske, 2015; Kelly et al., 2010; Kendon, 1967). A paramount discovery is that gaze and speech behavior are closely coupled during face-to-face interactions. Although some patterns of speech behavior during face-to-face interactions, such as in turn-taking, are common across different languages and cultures (Stivers et al., 2009), the role of gaze behavior in interaction seems to be culturally- as well as contextually-dependent (Foddy, 1978; Haensel et al., 2017, 2020; Hessels, 2020; Kleinke, 1986; Patterson, 1982; Rossano et al., 2009; Schofield et al., 2008). Observational studies on gaze behavior during interaction have been conducted in many different interpersonal contexts, such as interactions between adults, parents and infants, parents and children, as well as clinical interviews and conversations with typically and atypically developing children (Argyle & Cook, 1976; Arnold et al., 2000; Ashear & Snortum, 1971; Berger & Cunningham, 1981; Cipolli et al., 1989; Kendon, 1967; Levine & Sutton-Smith, 1973; Mirenda et al., 1983). More recently, new eye-tracking techniques have been developed to measure gaze behavior of individuals during face-to-face interactions with higher spatial and temporal resolution (Hessels et al., 2019; Ho et al., 2015; Rogers et al., 2018). However, these techniques have not been used to study the relation between speech and gaze in parent–child conversations.
Parent–child interactions provide a rich social context to investigate various aspects of social interaction, such as patterns of verbal and nonverbal behavior during face-to-face communication. Parent–child interactions are crucial for children’s social, emotional, and cognitive development (Branje, 2018; Carpendale & Lewis, 2004; Gauvain, 2001). Also, the ways in which parents and children interact changes significantly from childhood to adolescence. In infancy and childhood, parent–child interactions play an important role in children’s socialization, which involves the acquisition of language and social skills, as well as the internalization of social norms and values (Dunn & Slomkowski, 1992; Gauvain, 2001). In adolescence, parent–child interactions are often centered around relational changes in the hierarchical nature of the parent–child relationship, which typically consist of frequent conflicts about parental authority, child autonomy, responsibilities, and appropriate behavior (Laursen & Collins, 2009; Smetana, 2011). According to Branje (2018, p. 171), “parent-adolescent conflicts are adaptive for relational development when parents and adolescents can switch flexibly between a range of positive and negative emotions.” As children move through adolescence, they become more independent from their parents and start to challenge parents’ authority and decisions. In turn, parents need to react to these changes and renegotiate their role as a parent. How parents adapt to these changes (e.g. permissive, supporting, or authoritarian parenting styles) may have a significant impact on the social and emotional well-being of the child (Smokowski et al., 2015; Tucker et al., 2003). Children in this period become progressively aware of the perspectives and opinions of other people in their social environment (e.g. peers, classmates, teachers) and relationships with peers become more important to one’s social identity. In turn, parents’ authority and control over the decisions and actions of the child changes as the child moves from childhood to adolescence (Steinberg, 2001).
In this study, we investigated gaze behavior and its relation to speech in the context of parent–child interactions. We focus on the role of conflict and cooperation between parents and their preadolescent children (age range: 8 – 11 years) and how these interpersonal dynamics may be reflected in patterns of gaze and speech behavior. We chose this period because it marks the beginning of the transition from middle childhood to early adolescence. In this period, parents still hold sway over their children’s decisions and actions, however, the relational changes between children and parents start to become increasingly more prominent (e.g. striving for autonomy, disengagement from parental control), which is highly relevant to the study of conflict and cooperation in parent–child relationships (Branje, 2018; De Goede et al., 2009; Dunn & Slomkowski, 1992; Steinberg, 2001). Specifically, we are interested in patterns of gaze and speech behavior as a function of cooperative and conflicting conversation topics, to which parent–child interactions are ideally suited. We focus primarily on gaze behavior because of its importance for perception – does one need to look at another person’s face in order to perceive certain aspects of it? – and its relation to speech in face-to-face interactions (Hessels, 2020; Holler & Levinson, 2019; Kendon, 1967). Furthermore, the role of gaze in face-to-face interactions has previously been linked with various interpersonal dynamics, such as intimacy and affiliation, but also with social control, dominance, and authority (for a review, see Kleinke, 1986), which is relevant to the social context of the parent–child relationship. Although no eye-tracking studies to our knowledge have investigated the role of gaze behavior and its relation to speech in parent–child conversations, several studies have addressed the role of gaze behavior in face and speech perception and functions of gaze during conversational exchanges. Because these lines of research are directly relevant to our current study, we will briefly review important findings from this literature.
Where Do People Look at Each Other’s Faces?
Faces carry information that is crucial for social interaction. By looking at other people’s faces one may explore and detect certain aspects of those faces such as facial identity, emotional expression, gaze direction, and cognitive state (Hessels, 2020; Jack & Schyns, 2017). A well-established finding, ever since the classic eye-tracking studies by Buswell (1935) and Yarbus (1967), is that humans have a bias for looking at human faces and especially the eyes (see e.g. Birmingham et al., 2009; Hessels, 2020; Itier et al., 2007). This bias already seems to be present in early infancy (Farroni et al., 2002; Frank et al., 2009; Gliga et al., 2009). In a recent review, Hessels (2020) describes that where humans look at faces differs between, for example, when the face is moving, talking, expressing emotion, or when particular tasks or viewing conditions are imposed by researchers (e.g. face or emotion recognition, speech perception, restricted viewing). Moreover, recent eye-tracking research has shown that individuals exhibit large but stable differences in gaze behavior to faces (Arizpe et al., 2017; Kanan et al., 2015; Mehoudar et al., 2014; Peterson & Eckstein, 2013; Peterson et al., 2016). That is, some people tend to fixate mainly on the eye or brow region while others tend to fixate the nose or mouth area. Thus, what region of the face is looked at by an observer will likely depend on the conditions of the experimental context and on particular characteristics of the individual observer.
Previous eye-tracking research on gaze behavior to faces has mostly been conducted using static images or videos of faces presented to participants on a computer screen. However, some researchers have questioned whether gaze behavior under such conditions adequately reflects how people look at others in social situations, e.g. when there is a potential for interaction (Laidlaw et al., 2011; Risko et al., 2012, 2016). For example, Laidlaw et al. (2011) showed that when participants were seated in a waiting room, they looked less at a confederate who was physically present compared to when that person was displayed on a video monitor. While this discovery has led researchers to question the presumed ‘automaticity’ of humans to look at faces and eyes, this situation may primarily pertain to potential interactions. That is, situations where social interaction is possible but can be avoided, for example, in some public spaces and on the street (see also Foulsham et al., 2011; Hessels, et al., 2020a, 2020b; Rubo et al., 2020). Other studies have shown that, once engaged in actual interaction, such as in conversation, people tend to look at other people’s faces and its features (Freeth et al., 2013; Hessels et al., 2019; Rogers et al., 2018). One may thus expect that parents and children will also primarily look at each other’s faces during conversational interactions, but where on the face they will mostly look likely differs between individuals and may be closely related to what the face is doing (e.g. speaking, moving, expressing emotion) and to the social context of the interaction.
Where Do People Look at Each Other’s Faces During Conversations?
In (early) observational work (e.g., Argyle & Cook, 1976; Beattie & Bogle, 1982; Foddy, 1978; Kendon, 1967), researchers have often studied gaze behavior in face-to-face conversations by manually coding interactants’ gaze behavior from video recordings. These observational studies (i.e. not using an eye tracker) of two-person conversations have shown that speakers tend to equally gaze at or away from listeners, whereas listeners gaze longer at speakers with only occasional glances away from the speaker in between (Duncan & Fiske, 2015; Kendon, 1967; Rossano et al., 2009). Yet, the observational techniques used in these studies have limited reliability and validity to distinguish gaze direction at different regions of the face (Beattie & Bogle, 1982), which is of crucial importance for research on face-scanning behavior (see also Hessels, 2020, p. 869). Conversely, eye-tracking studies on gaze behavior to faces have used videos of talking faces, instead of actual interactions (e.g. Foulsham & Sanderson, 2013; Vatikiotis-Bateson et al., 1998; Võ et al., 2012). Most eye-tracking studies have therefore only been concerned with where people look at faces while listening to another person speak. Võ et al. (2012), for example, presented observers with close-up video clips of people being interviewed. They found that overall, participants gazed at the eyes, nose, and mouth equally often. However, more fixations to the mouth and fewer to the eyes occurred when the face was talking than when the face was not talking. This finding converges with the well-established finding that visual information from the human face may influence, or enhance how speech is perceived (Sumby & Pollack, 1954). A well-known example is the McGurk effect (McGurk & MacDonald, 1976), where one’s perception of auditory speech syllables can be modulated by the mouth and lip movements from a talking face.
Only recently have researchers begun to use eye-tracking technology to measure where people look at each other’s faces when engaged in interactive conversational exchanges (Hessels et al., 2019; Ho et al., 2015; Rogers et al., 2018). Rogers et al. (2018), for example, used wearable eye trackers to measure where two people looked at each other while engaged in short “getting acquainted” conversations. They found that participants gazed away from the face of one’s partner for about 10% of the total conversation duration when listening, and about 29% when speaking (cf. Kendon, 1967). When participants gazed at their partner’s face, they looked primarily at the eyes and mouth region. Specifically, Rogers et al. (2018) reported that, on average, participants looked slightly more at the mouth area while listening compared to when they were speaking; a difference of approximately 5 percentage points of the time that they were looking at the other person’s face. In a different eye-tracking study, Hessels et al. (2019) investigated gaze behavior of participants engaged in a face-to-face interaction with a confederate. They observed that when participants listened to a confederate’s story, their gaze was directed at the facial features (e.g. eyes, nose, and mouth regions) for a longer total duration, as well as more often per second, compared to when speaking themselves. However, they did not find that participants looked proportionally longer at the mouth while listening compared to speaking, as in Rogers et al. (2018). One reason for this difference could be that participants in the Hessels et al. (2019) study did not need to exchange speaking turns as they were specifically tasked to wait for the confederate to end his story. The small differences in these two studies may then be explained if turn-transitions are associated with looking at the mouth.
In sum, it has been well established that gaze to faces during conversations is dependent on speaker-state: who is speaking or who is being addressed. Based on eye-tracking studies with videos of talking faces, it has often been suggested that gaze will be directed more at the mouth while listening to someone speak, as looking at the mouth area may be beneficial (but not necessary) for speech perception (see e.g. Buchan et al., 2007; Vatikiotis-Bateson et al., 1998; Võ et al., 2012). Recent dual eye-tracking studies on the role of gaze behavior in two-person conversations (Hessels et al., 2019; Rogers et al., 2018) have found no, or only small, differences in gaze to specific facial features (e.g. eyes, mouth) during episodes of speaking and listening. We expect to observe a similar pattern for parents and children as well.
Present study
In this study, we investigated speech and gaze behavior during conversational interactions between a parent and their child. Parent–child dyads engaged in two conversations about potential disagreements (conflict) and agreements (cooperation) on common family topics, given their importance and frequent occurrence within the social context of the parent–child relationship (Branje, 2018; Dixon et al., 2008; Laursen & Collins, 2004; Steinberg, 2001). We investigated (1) the similarities and differences between parents and children’s speech and gaze behavior during face-to-face interaction, (2) whether patterns of speech and gaze behavior in parent–child conversations are related to the nature of the conversation (conflictive versus cooperative topics), and (3) whether gaze behavior to faces is related to whether someone is speaking or listening. To engage parents and children in conflictive and cooperative conversations, we used two age-appropriate semi-structured conversation-scenarios. This method, which is considered a ‘gold standard’ in the field, has extensively been used by researchers to assess various aspects of the parent–child relationship, e.g. attachment, interpersonal affect, relational quality, parental style, and child compliance (Aspland & Gardner, 2003; Ehrlich et al., 2016; Scott et al., 2011). To investigate the relation between speech and gaze in parent–child conversations, we needed a setup capable of concurrently recording eye movements and audio from two conversational partners with enough spatial accuracy to distinguish gaze to regions of the face. To this end, we used a video-based dual eye-tracking setup by Hessels et al. (2017) that fulfills these criteria. Based on previous literature, we expected that parents and children on average looked predominantly at each other's faces, but that participants would exhibit substantial individual differences in what region of the face they looked at most (eyes, nose, mouth). Moreover, we expected that gaze behavior was related to whether subjects were speaking or listening. We may expect that when listening gaze is directed more at the mouth region, given its potential benefits for speech perception and turn-taking. Regarding the conflict and cooperative scenarios, we had no prior expectations.
Method
Participants
81 parent–child dyads (total n = 162) participated in this study. All participants were also part of the YOUth study, a prospective cohort study about social and cognitive development with two entry points: Baby & Child and Child & Adolescent (Onland-Moret et al., 2020). The YOUth study recruits participants who live in Utrecht and its neighboring communities. The YOUth study commenced in 2015 and is still ongoing. To be eligible for participation in our study, children needed to be aged between 8 and 11 years at the moment of the first visit (which was the same as the general inclusion criteria of the Child & Adolescent cohort). Participants also had to have a good understanding of the Dutch language. Parents needed to sign the informed consent form for the general cohort study, and for this additional eye-tracking study. Participants of the YOUth study received an additional information letter and informed consent form for this study prior to the first visit to the lab. Participants were not eligible to participate if the child was mentally or physically unable to perform the tasks, if parents didn’t sign the informed consent forms, or if a sibling was already participating in the same cohort. A complete overview of the in-and-exclusion criteria for the YOUth study are described in Onland-Moret et al. (2020).
For this study, a subset of participants from the first wave of the Child & Adolescent cohort were recruited. Children’s mean age was 9.34 (age range: 8–10 years) and 55 children were female (67%). Parents’ mean age was 42.11 (age range: 33–56) and 64 were female (79%). A complete overview with descriptive statistics of the participants’ age and gender is given in the results section (Table 1). We also acquired additional information about the families’ households, which is based on demographic data from seventy-six families. For five families, household demographics were not (yet) available (e.g., parents did not complete the demographics survey of the YOUth study). The average family/household size in our sample was 4.27 residents (sd = 0.71). Seventy children from our sample lived with two parents or caregivers (92.1%). Seven children had no siblings (9.2%), forty-two children had one sibling (55.3%), twenty-three children had two siblings (30.2%), and four children had three siblings (5.3%). Two parents/caregivers lived together with the children of their partner and one family/household lived together with an au pair.
We also checked how our sample compared to the rest of the YOUth study’s sample in terms of parents’ educational level, used here as a simplified proxy of social-economic status (SES). In our subset of participants, we found that most parents achieved at least middle-to-higher educational levels, which is representative of the general YOUth study population. For a detailed discussion of SES in the YOUth study population, see Fakkel et al. (2020). All participants received an information brochure at home in which this study was explained. Participants could then decide whether they wanted to participate in this additional study aside from the general testing program. All participants were included at their first visit to the lab and parents provided written informed consent for themselves as well as on behalf of their children. This study was approved by the Medical Research Ethics Committee of the University Medical Center Utrecht and is registered under protocol number 19–051/M.
Apparatus
A dual eye-tracking setup (see Fig. 1a) was used to record gaze of two interactors simultaneously. Each person was displayed to the other by means of a monitor and a half-silvered mirror (see Fig. 1b). The cameras behind the half-silvered mirrors were Logitech webcams (recording at 30 Hz at a resolution of 800 by 600 pixels). The live video-feeds were presented at a resolution of 1024 by 768 pixels in the center of a 1680 by 1050 pixels computer screen and concurrently recorded to disk. Two SMI RED eye trackers running at 120 Hz recorded participants’ eye movements (see Fig. 1b). A stimulus computer running Ubuntu 12.04 LTS handled the live video-connection and signaled to the eye-tracker computers to start and stop recording eye movements (for a more detailed explanation of this setup, see Hessels et al., 2017).

Overview of the dual eye-tracking setup. a Staged photographs of two interactors in the dual eye-tracking setup. b A schematic overview of the setup, reproduced from Hessels et al. (2018b).
Audio was recorded using a set of AKG C417-PP Lavalier-microphones which were connected to a Behringer Xenyx 1204-USB audio panel. Each microphone was attached to the front of each setup (see the dashed orange circles on the left panels in Fig. 1a). We used Audacity v. 2.3.3 running on a separate computer (Ubuntu 18.04.2 LTS) to record audio. In a stereo recording the signal of the parent was panned to the left channel and the signal of the child was panned to the right channel. Upon recording start, a 100 ms pulse was sent from the parallel port of the stimulus computer to the audio panel to be recorded. This resulted in a two-peak signal we used to synchronize the audio recordings to the beginning and end of the video and eye-tracking recordings. Audio recordings were saved to disk as 44,100 Hz 32-bit stereo WAVE files. We describe in detail how the data were processed for the final analyses in the Signal processing section below.
Procedure
Upon entering the laboratory, a general instruction was read out by the experimenter (author GAH). This instruction consisted of a brief explanation of the two conversation-scenarios and the general experimental procedure. Participants were asked not to touch any equipment during the experiment (e.g. the screen, microphones, eye trackers). Because the experimenter needed to start and stop the video-feed after approximately five minutes for each conversation, he explained that he would remain present during the measurements to operate the computers. After the general instruction, participants were positioned in the dual eye-tracking setup. Participants were seated in front of one of the metal boxes at either end of the setup (containing the screens and eye trackers) such that their eyes were at the same height as the webcams behind the half-silvered mirrors using height-adjustable chairs. The distance of participants’ eyes to the eye tracker was approximately 70 cm and the distance from eyes to the screen was approximately 81 cm. After positioning, the experimenter briefly explained the calibration procedure. The eye tracker of the parent was calibrated first using a 5-point calibration sequence followed by a 4-point calibration validation. We aimed for a systematic error (validation-accuracy) below 1° in both the horizontal and vertical direction (they are returned separately by iViewX). However, if for some reason, a sufficiently low systematic error could not be obtained, the experimenter continued anyway (see Section 11 how these recordings were handled). After calibrating the parent’s eye tracker, we continued with the child’s eye tracker. After the calibration procedure, the experimenter briefly repeated the task-instructions and explained that he would initiate the video-feed after a countdown. The experimenter repeated that he would stop recording the conversation after approximately five minutes. The experimenter did not speak or intervene during the conversation, only if participants questioned him directly, or when participants had changed their position too much. In the latter case, this was readily visible from the iViewX software which graphically and numerically displays the online gaze position signals of the eye trackers. If participants slouched too much, the incoming gaze position signals would disappear or show abnormal values. In such instances, the experimenter would ask the participants to sit more upright until the gaze position signals were being recorded properly again.
Conflict-Scenario
For the first conversation, children and their parents were instructed to discuss a family issue about which they have had a recent disagreement. The goal of the conflict-scenario was to discuss the topic of disagreement and to try to agree on possible solutions for the future. To assist the participants in finding a suitable topic, the experimenter provided a list with common topics of disagreements between parents and children. The list included topics such as screen time, bedtime, homework, and household chores (see Appendix 1 for a complete overview). The main criteria for the conflict-scenario were that the topic should be about a recent disagreement, preferably in the last month. If no suitable topic could be found on the list or could be agreed upon, the parent and child were asked to come up with a topic of their own. Some parent–child dyads could not decide at all or requested to skip the conflict-task altogether. Note that for the final analyses, we only included dyads that completed both scenarios (see Fig. 1 and Table 1). After participants had agreed on a topic, the experimenter explained that they should try to talk solely about the chosen topic for approximately 5 min and not digress.
Cooperation-Scenario
For the second conversation, participants were instructed to plan a party together (e.g. birthday or family gathering). The goal of the cooperation-scenario was to encourage a cooperative interaction between the parent and child. Participants were instructed to discuss for what occasion they want to organize a party and what kinds of activities they want to do. Importantly, participants had to negotiate the details and thus needed to collaborate to come up with a suitable party plan. Participants were instructed to discuss the party plan for approximately 5 min. Prior to the second conversation, the experimenter checked the participants’ positioning in front of the eye trackers and whether the eye trackers and microphones were still recording properly. In some cases, the experimenter re-calibrated the eye trackers if participants had changed position, or if the eye tracker did not work for whatever reason. Note that we always started with the conflict-scenario and ended with the cooperation-scenario because we reasoned this would be more pleasant for the children.
Debriefing
After the cooperation-scenario, the experimenter thanked the parents and children for their participation and the child received a small gift. The experimenter also asked how the participants had experienced the experiment, and if they were left with any questions about the goal of the experiment.
Signal Processing
To prepare the eye-tracking, audio, and video signals for the main analyses, we conducted several signal processing steps (e.g. synchronization, classification). In the following sections, we describe these separate steps. Readers who do not wish to consider all the technical and methodological details of the present study may wish to proceed to the Results, Section 12.
-
1.
Synchronization of eye-tracking signals and video recordings. By using timestamps produced by the stimulus computer, the eye-tracking signal was automatically trimmed to the start and end of the experimental trial. Next, the eye-tracking signal was downsampled from 120 to 30 Hz to correspond to the frame rate of the video. In the downsampling procedure, we averaged the position signals of four samples to produce a new sample. This caused the signal-to-noise ratio to increase by a factor of 2 (√4) due to the square root law.
-
2.
Construction of Areas of Interest (AOI) and AOI assignment of gaze position. To determine where and when participants looked at each other’s faces, we mapped gaze coordinates unto the frontal video-recordings. Because participants moved and rotated their faces and bodies during the conversations, we used an AOI construction method that can efficiently and effectively deal with an enormous number of images, namely the thousands of video frames produced in this experiment. This method consists of the fully automated Limited Radius Voronoi Tessellation procedure to construct Areas-of-Interest (AOIs) for facial features in dynamic videos (Hessels et al., 2016). Briefly, this procedure assigns each gaze position to one of the four facial features (left eye, right eye, nose, or mouth) based on the closest distance to the facial feature. If this minimal distance exceeds the limited radius, gaze position was assigned to the background AOI (see Fig. 2). This background area consists of the background and small parts of the upper body of the participant visible in the video. In our study, the LRVT-radius was set to 4°Footnote 1 (200 pixels). The LRVT method is partly data-driven, resulting in smaller AOIs on the children’s faces compared to AOIs on the parents’ faces. We quantified the AOI size by the AOI span. The AOI span is defined as the mean distance from each AOI cell center to the cell center of its closest neighbor (see Hessels et al., 2016, p. 1701). The average AOI-span for parents’ faces was 1.76° and an average AOI span for children’s faces was 1.6°.

An example for computer-generated AOIs (Hessels, et al., 2018a) for the left eye (L), right eye (R), nose (N), and mouth (M). The AOI for the left eye, for example, is the area closest to the left eye center but not further away from the center than the bounded radius of 4° (denoted with a red arrow). The background AOI (B) encompasses the background, the upper body of the participant and a small part of the top of the head
-
3.
From gaze data to dwells. After individual gaze samples were mapped unto AOIs (see previous section), we computed ‘dwells’, defined here as the time spent looking at a particular face AOI (e.g., eyes, mouth). We operationalized a single dwell as the period between when the participants’ gaze position entered the AOI radius until gaze position exited the AOI, providing that the duration was at least 120 ms (i.e., four consecutive video frames). For further details, see Hessels et al. (2018b, p. 7).
-
4.
From raw audio recordings to speaker categories.
-
4a.
Trimming to prepare audio for synchronization with video and eye-tracking. In a self-written audio visualization script in MATLAB, we manually marked the timepoints of the characteristic two-peak synchronization pulse sent by the stimulus computer (see Section 7), which indicated the start and stop of the two conversations at high temporal resolution (timing accuracy < 1 ms). Then we trimmed the audio files based on these start-and-stop timepoints. Next, the trimmed stereo files (left channel – the parent, right channel—the child) were split into two mono signals, and the first conversation (conflict) and the second conversation (cooperation) were separated. Finally, the audio signal was downsampled to 1000 Hz and converted into an absolute signal. As a result, we produced four audio files per parent–child dyad.
-
4b.
Determination of speech samples. Speech episodes (as an estimator for who was speaking) were operationalized as follows. First, the absolute audio signal was smoothed with a Savitsky-Golay filter (order 4; window 500 ms). Then, samples were labelled silent when the amplitude was smaller than 1.2 times the median amplitude of the whole filtered signal. Then, we computed the standard deviation of the amplitude of the silent samples. Subsequently, a sample was labelled as a speech sample if the amplitude exceeded the mean plus 2 times the standard deviation of the amplitude of the silent samples.
-
4c.
Removing crosstalk. Because the microphones were in the same room, we observed crosstalk in the audio channels. That is, we sometimes heard that parent speech was present in the audio recording channel of the child and vice versa. The child’s channel suffered more from crosstalk than the parent’s channel. To deal with this, we first equalized the speech signals of the parent and child by making them on average equally loud (by using the average speech amplitudes of the single episodes) Then, we identified episodes of potential crosstalk by selecting the episodes that contained a signal in the channel of both speakers. We removed crosstalk with the following rule: We assigned a crosstalk episode to X if the amplitude of the signal in the X’s channel was 3.33 times larger than in the Y’s channel. The value 3.33 was derived empirically. If a crosstalk episode was assigned to the child, it was removed from the parent’s channel and vice versa.
-
4d.
Determination of speech episodes. From the labelled samples, we determined speech episodes. Each speech episode is characterized by an onset and offset time, mean amplitude and duration.
-
4e.
Removing short speech and short silence episodes. We removed speech episodes shorter than 400 ms followed by the removal of silence episodes shorter than 100 ms.
-
4f.
Assigning speech labels to single samples. To link the speech signal to the eye-tracking signal in a later stage, we assigned speech labels to each sample of the speech signal of the parent–child dyad. For each timestamp, we produced a label for one of the following categories: parent speech, child speech, speech overlap and silence (no one speaks).
-
4a.
-
5.
Combining speech and gaze behavior. The speech signal was combined with the gaze signal as follows. First, we upsampled the gaze signal (with AOI labels) from 30 to 1000 Hz by interpolation to match the sampling frequency of the audio signal. Each sample in the combined signal contained a classification of speaker categories (child speaks, parent speaks, both are speaking, no one speaks) and gaze location on the face for both child and parent (eyes, nose, mouth, background). Not all recordings produced valid eye-tracking data (eye-tracking data loss), valid AOIs for all video frames (e.g. due to extreme head rotations construction of AOIs is impossible), or valid dwells (i.e. dwells longer than 120 ms). These invalid cases were marked in our combined audio/gaze database. This is not necessarily problematic for data analysis, because we also conducted analyses on parts or combinations of parts of the data (e.g. speech analysis only).
-
6.
Measures of speech and gaze. In this study, we mainly report relative measures of speech and gaze behavior because the total recording durations differed across dyads and conversations. We computed relative total speech durations as a descriptor of speech behavior and relative total dwell times as a descriptor of gaze behavior. To obtain relative measures, we determined the total duration for each speaker category (i.e. parent speech, child speech, overlap, no one speaks) and the total duration of dwells (with AOI labels eyes, nose, mouth, background) and then divided these durations by the total duration of the recording.
Results
Eye-Tracking Data Quality and Exclusion
We first assessed the quality of the eye-tracking data, which is crucial for the validity of an eye-tracking study (Holmqvist et al., 2012). High-quality eye-tracking data is typically obtained when subjects are restrained with a chinrest/headrest to maintain equal viewing distance and minimize head movements. However, in the context of our face-to-face conversations, subjects could talk, gesture, move their face, head, and upper body. Although the dual eye-tracking setup used was specifically designed to allow for these behaviors, other eye-tracking studies have also demonstrated that such behaviors may negatively affect eye-tracking data quality (Hessels et al., 2015; Holleman et al., 2019; Niehorster et al., 2018). Moreover, young children may pose additional problems, such as excessive movement or noncompliance (Hessels & Hooge, 2019). We computed several commonly used eye-tracking data quality estimates, namely: accuracy (or systematic error), precision (or variable error), and data loss (or missing data).
First, we assessed accuracy. The average validation accuracy of parents’ recordings was 0.98°. For the children’s recordings it was 1.48°. We set an exclusion criterion of 1° for the 2d-validation accuracy. Second, we determined precision by computing the sample-to-sample root mean square deviation (s2s-RMS) of the gaze-position signal. We then divided the s2s-RMS values for every participant by the AOI span (see Section Signal Processing). This measure can range from 0 to infinity. A precision/AOI-span value of 1 means that precision is equal to the AOI span. In other words, a value of 1 means that the sample-to-sample variation of the gaze-position signal is equal to the average distance between AOIs. If the precision/AOI-span is larger than 1 this means that one cannot reliably map gaze position to an AOI. Therefore, we decided to exclude measurements in which the average precision/AOI span exceeded 1. Also, this measure accounts for differences between the recordings in the magnitude of the AOI spans in relation to the recorded gaze position. We also calculated periods of data loss – i.e. when the eye tracker did not report gaze position coordinates. Data loss is a slightly more complicated measure in the context of our study, given that data loss may coincide with talking and movement (Holleman et al., 2019). For example, it is well-known that some people gaze away more when speaking compared to when listening (Hessels et al., 2019; Kendon, 1967). Therefore, any exclusion based on data loss may selectively remove participants that spoke relatively more. For that reason, we did not exclude participants based on data loss but conducted separate sensitivity analyses for all our main findings as a function of a data loss exclusion criterion (see Appendix 3).
Based on the criteria for accuracy and precision, we determined how many measurements were suitable for further analyses. Figure 2 and Table 1 depict an overview of the eye-tracking data quality assessment and how many participants were excluded for further analyses based on exclusion criteria described above. Out of 81 parent–child dyads who participated, 73 dyads completed the experiment (i.e. participated in both conversation-scenarios). Out of this set, we had eye-tracking data of sufficient quality for 40 parents and 13 children. Descriptive statistics of the participants are given in Table 1. Note that although the quality of the eye-tracking data is known to be worse for children, it was particularly problematic in our study as we needed data of sufficient quality for both conversations to answer our research questions. Although many more participants had at least one good measurement, applying our data quality criteria to both conversations for every parent–child dyad resulted in these substantial exclusion rates (Fig. 3)
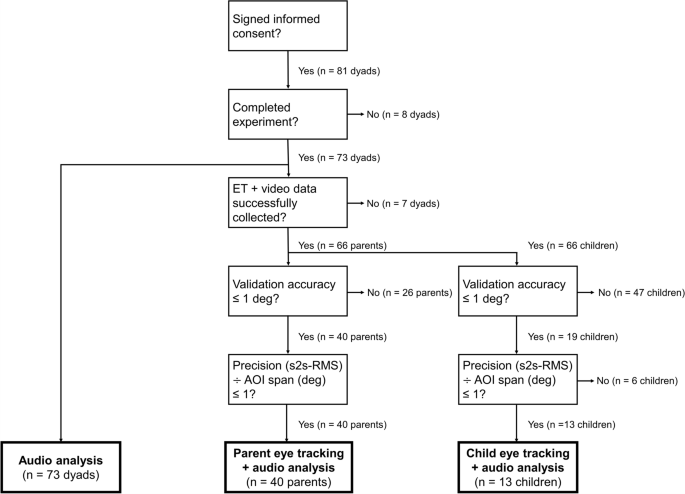
Flowchart of eye-tracking data quality assessment and exclusion criteria
Main Analyses
We present three main analyses in which we address (1) the similarities and differences between parents and children’s speech and gaze behavior during face-to-face interaction, (2) whether patterns of speech and gaze behavior in parent–child conversations are related to the topics of conversation (conflictive versus cooperative), and (3) whether gaze behavior to faces is related to whether someone is speaking or listening. For all our figures and statistical descriptions, we used detailed visualizations and bootstrapping techniques provided by Rousselet et al. (2017). Specifically, we used the Harrell-Davis estimator to compute 95% confidence intervals around the medians of each distribution with the MATLAB function decilespbci. The number of bootstrap samples was set to 2,000. If these 95% CIs do not overlap with the zero-difference line, we concluded that, statistically, the numerical difference is meaningful (or 'significant') as the 0 is not included in 95% CI around the median. We based this analysis strategy on Rousselet et al. (2017), who showed that non-parametric bootstrapping methods combined with clear visualisations may be more informative than a frequentist t-test only. Moreover, the bootstrapping technique is less susceptible to e.g. deviations from normality than regular t-tests.
Speech Behavior
In this section, we report parents’ and children’s speech behavior over the course of the two conversation-scenarios: conflict and cooperation. We wanted to know whether parents and children differed in how much they spoke when discussing potential (dis)agreements. For the analyses of speech behavior, we used the Audio-only dataset (see Table 1), which consisted of 73 parent–child dyads who completed both conversations. The average duration of the conflict-scenario was 281.25 s (sd = 27.78 s) and the average duration of the cooperation-scenario was 297.37 s (sd = 28.69 s).
Similarities and Differences Between Parents and Children
Figure 4 depicts parents’ and children’s relative total speech durations (i.e. how much they spoke as a percentage of the total conversation) across the two conversation-scenarios. We estimated relative speech durations of four speaker-categories: child speaks, parent speaks, both speak (‘overlap’), and no one speaks (‘none’). As is visible from Fig. 4 (left panels) both parents and children varied substantially in how much they spoke in total over the course of the two conversations. For example, the range of relative speaking durations ranged from less than 5% for some individuals to nearly 50% of the total conversation duration. Overall, parents spoke for a longer total time compared to children, regardless of the conversation scenario. The median relative speaking duration for parents was 39.19%, 95% CI [37.69% – 40.53%] in the conflict-scenario and 34.64%, 95% CI [32.11% – 37.14%] in the cooperation-scenario, whereas the median relative speaking duration for children in the conflict-scenario was 18.51%, 95% CI [16.65% – 20.34%] and 23.59%, 95% CI [21.91% – 26.23%] in the cooperation-scenario.

Left panel. Speech behavior of 73 parent–child dyads for the two conversation-scenarios (conflict and cooperation). Dark grey markers represent the relative total speech duration (as a percentage) of each participant during the conflict-scenario and light grey markers represent the relative total speech duration of each participant during the cooperation-scenario. The vertical orange stripes represent the median relative speech durations per speaker-category. Right panel. Difference-scores of speech behavior (conflict minus cooperation). Difference-scores were computed by subtracting participants’ relative speech durations in the cooperation-scenario from the conflict-scenario for every speaker-category. Light grey markers represent individual difference scores (as percentage point difference in relative total duration). The orange markers represent the median difference-score of the relative speech durations and the error bars (barely visible) represent 95% confidence intervals of the median, both of which were obtained through bootstrapping using the MATLAB-function decilespcbi provided by Rousselet et al. (2017). The vertical dashed line represents a zero-difference line. Negative difference scores indicate that the participant spoke less in the conflict-scenario than in the cooperation-scenario (and vice versa for positive difference scores)
Speech Behavior as a Function of Conversation Scenario
To compare how individual parents’ and children’s total speech durations differed between the two conversation-scenarios, we computed a difference-score for each participant by subtracting their relative total speech duration in the cooperation-scenario from their relative total speech duration in the conflict-scenario, see Fig. 4 (right panel). A negative difference-score (i.e. value on the left side of the zero-difference line) means that the participant spoke less in the conflict-scenario compared than in the cooperation-scenario and a positive difference-score (i.e. value on the right side of the zero-difference line) means that the participant spoke more in the conflict-scenario compared to how much they spoke in the cooperation-scenario. As is visible from Fig. 4 (right panel), parents spoke more during the conflict-scenario than during the cooperation-scenario, as indicated by a positive median difference in relative total speaking duration of 2.91 percentage points (pp), 95% CI [1.42 pp – 4.27 pp]. Conversely, children spoke more in the cooperation-scenario compared to the conflict-scenario, as indicated by a negative median difference in relative total speaking duration of -5.32 pp, 95% CI [-7.15 pp – -3.60 pp]. Finally, there was slightly more silence (i.e. neither parent or child was speaking) during the conflict-conversation compared with the cooperation-scenario, as shown by the positive median difference-score of 2.50 pp, 95% CI [0.86 pp – 4.10 pp] for the ‘none’ speaker-category.
Gaze Behavior
In this section, we report parents’ and children’s gaze behavior to facial features in relation to the conversation-scenarios. We analyzed whether and how parents and children differed in where they looked at the other’s faces when discussing (dis)agreements. Based on previous eye-tracking studies on face scanning behavior (e.g. Mehoudar et al., 2014; Peterson et al., 2016; Rogers et al., 2018), we expected that parents and children will look predominantly at each other's faces, but that participants may exhibit large individual differences in where at the face is looked at most (eyes, nose, or mouth). We had no expectations regarding gaze behavior as a function of conversation-scenario. For the analyses of gaze behavior, eye-tracking data of 40 parents and 13 children were used (see Table 1).
Similarities and Differences Between Parents and Children
First, we analyzed the individual differences in parents’ and children’s gaze behavior to facial features. Figure 5 (upper panels) depicts relative total dwell times to face AOIs (e.g. eyes, nose, mouth) and the background AOI as a function of conversation-scenario (conflict and cooperation). As is visible from Fig. 5, both parents (top left panel) and children (top right panel) varied greatly in the total duration that they looked at each other’s faces, as indicated by the large range in relative total dwell times to different face AOIs (0 to approximately 50–75% of total looking time for the eyes and mouth AOI). This was regardless of the conversation scenario. Large individual differences in gaze behavior to facial features matches our expectation based on previous research. A smaller range in relative total dwell time to the background AOI was observed, ranging from 0 to approximately 15% of total available looking time. To investigate the consistency of participants’ gaze behavior to facial features across the two conversations, we computed Spearman rank correlations for both parents’ and children’s relative total dwell time on face AOIs and the background AOI. For the parents, we found a high level of consistency in relative total dwell time across conversation scenarios for all AOIs (eyes AOI p = 0.73, p < 0.00001; nose AOI ρ = 0.73, p < 0.00001; mouth AOI ρ = 0.81, p < 0.00001; background AOI ρ = 0.72, p < 0.00001). For the children, we also found a high level of consistency in relative total dwell time across conversation scenarios for most AOIs (eyes AOI ρ = 0.80, p = 0.001; mouth AOI ρ = 0.78, p = 0.002; background AOI ρ = 0.78, p = 0.002), but slightly less so for the nose AOI (ρ = 0.43, p = 0.140). These Spearman correlations show that individuals were consistent in where they looked at on average on the other person’s face across the two conversations. One difference that stands out from Fig. 5 is that parents had higher median relative dwell times for all face AOIs compared with those of the children. However, we cannot conclude that this is a meaningful difference as data loss was generally much higher for the children than for the parents (see Appendix 2).

Gaze behavior as a function of conversation-scenario. Distributions of gaze behavior to the facial feature (eyes, nose, mouth) and background AOIs for parents (left panels) and children (right panels). Upper panels. Relative total dwell times (as a percentage) as a function of conversation-scenario (conflict and cooperation). Dark grey markers represent the relative total dwell time of each participant during the conflict-scenario and light grey markers represent the relative total dwell time of each participant during the cooperation-scenario. The vertical orange stripes represent the median relative total dwell time per AOI-category. Lower panels. Distributions of difference-scores of relative total dwell time to the AOIs (conflict minus cooperation). Difference-scores were computed by subtracting participants’ relative total dwell time to the AOIs in the cooperation-scenario from the conflict-scenario. Light grey markers represent individual difference scores (as percentage point difference in relative total dwell time). The orange markers represent the median difference-score of the relative total dwell times and the error bars represent 95% confidence intervals of the median, both of which were obtained through bootstrapping using the MATLAB-function decilespcbi provided by Rousselet et al. (2017). The vertical dashed line represents a zero-difference line. Negative difference scores indicate that the participant gazed more at a particular AOI in the cooperation-scenario than in the conflict-scenario (and vice versa for positive difference scores)
Gaze Behavior as a Function of Conversation Scenario
Next, we analyzed whether parents and children differed in what regions of each other’s face they looked at as a function of the conversation-scenario (conflict and cooperation). To investigate this, we compared the within-subject differences in gaze behavior to facial features of parents and children across the two scenarios. We computed the individual and median difference-scores in relative total dwell time per AOI, by subtracting participants’ relative total dwell time to face AOIs in the cooperation-scenario from the conflict-scenario. As is visible from Fig. 5, parents (lower left panel) gazed slightly more at the child’s eyes AOI during the conflict-scenario, as indicated by a positive median difference-score of 4.15 percentage points (pp), 95% CI [1.28 pp – 7.78 pp] and a non-overlapping error bar with the zero-difference line. Also, it seemed that parents looked slightly more at the mouth AOI during the cooperation-scenario, as indicated by a negative median difference-score of -2.54 pp, 95% CI [-7.99 pp – 0.55 pp]. However, notice that the confidence interval overlaps slightly with the zero-difference line. For the children, no differences were observed between their relative total dwell times to face AOIs as a function of the conflict and cooperation scenario.
Gaze Behavior to Faces and its Relation to Speech
In this section, we report parents’ and children’s gaze behavior to facial features in relation to speech behavior. We wanted to know where participants looked at the other’s face during episodes of speaking and listening. Based on previous literature, we may expect that participants will gaze slightly more at the mouth when listening, and more at the eyes when speaking (Rogers et al., 2018). For these analyses, we computed relative total dwell times to AOIs as a function of speaker-state, by summing all dwells per AOI (eyes, nose, mouth, background) for all the classified episodes of self-speech (participant is speaking) and other-speech (other person is speaking) per conversation scenario (conflict, cooperation). Note that this excludes episodes of overlap or silence. Then we computed a relative measure of total dwell time per AOI category during self-speech and other-speech by dividing the total duration of dwells by the total duration of the conversation. Finally, we averaged relative total dwell times across the two scenarios.
Figure 6 (upper panels) depicts participants’ relative total dwell times to the AOIs as a function of self-speech and other-speech. As is visible from Fig. 6 (upper panels), individual parents and children varied substantially in where they looked at the different face AOIs (eyes, nose, mouth, background), regardless of speaker-state. For most parents and children, relative total dwell times to face AOIs ranged somewhere between 0 and 50%, regardless of speaker-state, and some individuals gazed at a particular face AOI for more than 50–75% of the time. Furthermore, total dwell times to the background-AOI were substantially lower on average, ranging between 0 and 18% of the total duration of available looking time during self-speech and other-speech. Again, parents had higher median relative dwell times for all face AOIs, but as stated previously, we cannot conclude that this is a meaningful difference as data loss was generally higher for the children than for the parents (see Appendix 2).

Gaze behavior as a function of speaker-state. Distributions of gaze behavior to the facial feature and background AOIs for parents (left panels) and children (right panels). Upper panels. Relative total dwell times (as a percentage) as a function of self-speech and other-speech. Dark grey markers represent the relative total dwell time to face AOIs (eyes, nose, mouth) and the background AOI of each participant when speaking and light grey markers represent the relative total dwell time to facial features of one participant when the other person was speaking). The vertical orange stripes represent the median relative total dwell time per AOI. Lower panels. Distributions of difference-scores of relative total dwell time to the AOIs (self-speech minus other-speech). Difference-scores were computed by subtracting participants’ relative total dwell time to face AOIs during other-speech from their relative total dwell time during speaking. Light grey markers represent individual difference scores. The orange markers represent the median difference-score of the relative total dwell times and the error bars represent 95% confidence intervals of the median, both of which were obtained through bootstrapping using the MATLAB-function decilespcbi provided by Rousselet et al. (2017). The vertical dashed line represents a zero-difference line. Positive difference scores indicate that the participant gazed more at particular AOI during episodes of self-speech. Negative difference scores indicate that the participant gazed more at a particular AOI during episodes of other-speech
Next, to compare how parents and children looked at the other’s face during episodes of self-speech and other-speech we computed individual within-subject difference-scores by subtracting the relative total dwell times during other-speech from relative total dwell times during self-speech (see Fig. 6, lower panels). Note that a negative difference-score indicates that the participant gazed more at a particular AOI during other-speech compared to self-speech, and a positive difference-score means the participant gazed more at a certain facial feature during episodes of self-speech. For both the single parent (n = 40) and single child (n = 13) data sets, a negative median difference-score was observed for gazing at the mouth AOI. We found a median difference-score in total dwell time on the mouth AOI for the parents of -7.64 percentage points (pp), 95% CI [-11.27 pp – -4.58 pp], and for the children the median difference-score of total dwell time on the mouth AOI was -6.28 pp, 95% CI -14.12 pp – -2.39 pp]. Thus, overall, participants slightly gazed more at the mouth of the other when listening compared to when they were speaking themselves.
Discussion
In this study, we investigated the role of gaze behavior to faces during conversations between parents and their preadolescent children about conflictive and cooperative topics. The following research questions were formulated: 1) What are the similarities and differences between parents’ and children’s speech and gaze behavior during face-to-face interaction? For example, we were interested in how much parents and children spoke over the course of the interaction, and what regions of the face they looked at during the conversations. 2) Are patterns of speech and gaze behavior in parent–child conversations related to the topics of conversation (conflictive versus cooperative)? 3) Is gaze behavior to faces during parent–child interaction related to who is speaking or listening? To estimate gaze behavior to facial features during parent–child interactions, we used a dual eye-tracking setup to obtain audio recordings, frontal videos, and gaze position of parents and their children engaged in conflict and cooperation conversations. We first briefly recap the results regarding the similarities and differences in speech and gaze behavior as a function of the two conversational scenarios, and then we recap the results regarding the relation between gaze and speech behavior. As this study represents a first attempt to study gaze behavior to facial features during parent–child interactions using a dual eye-tracking setup, we will also consider several limitations and possibilities of this technology for the study of parent–child interactions.
Summary and Interpretation of Results
Regarding our research questions on the similarities and differences in speech behavior between parents and children, and whether patterns of speech behavior were related to the conversation topic, we found clear differences in how much parents and children spoke across the two conversations. Overall, parents spoke more than children regardless of the conversation-scenario. Parents spoke more in the conflict-scenario compared with how much they spoke in the cooperation-scenario, while children spoke more in the cooperation-scenario compared to how much they spoke in the conflict-scenario. Finally, there was more silence during the conflict-scenario (neither the parent nor child was speaking).
The results on speech behavior clearly show that the two conversation-scenarios (conflict and cooperation) substantially influenced the dynamics of the interaction. This is likely due to how the two conversation-scenarios differ with regards to the role that the parent and the child take. When planning the party together (cooperation scenario), the parent and the child are more egalitarian partners, as they both recognize that their wishes and ideas carry the same weight. In the conflict situation, however, the topics that were chosen to discuss mostly concerned the child’s behaviors that the parent considered undesirable (e.g. not cleaning one's own room, not listening to the parents, fighting with a brother or sister). In such situations, the parent tends to take a lead, assert their authority, and consequently speaks more (Moed et al., 2015). The child, on the other hand, recognizes the parent’s authority in such matters and mostly such conflicts are resolved by the child giving in to the parent’s demands (see Laursen & Collins, 2009 for a review). This submissive role is reflected in children speaking less in the conflict discussion. Moreover, the conflict discussion likely elicits more tension and uncomfortable feelings in children than in the cooperation scenario (Thomas et al., 2017), which might be an additional explanation for their smaller contribution to the conflict discussion with parents. As the nature of parent–child conflicts changes significantly across various stages of development (Dunn & Slomkowski, 1992; Laursen & Collins, 2009; Steinberg, 2001), one may expect that patterns of gaze and speech behavior are different for parent–child conflicts in early or late childhood, or in early adolescence and late adolescence. Our participant sample consisted of preadolescent children (8–10 years) which somewhat precedes the relational changes in parental authority and child autonomy in adolescence. As such, we would expect that the contribution of children in the conversation would increase as they move through adolescence and the parent–child relationship becomes more egalitarian.
Regarding our research question on the similarities and differences in gaze behavior to faces of parents and children, we found substantial individual differences for both parents and children in what region of the other’s face was looked at most. In line with previous research with adults (Arizpe et al., 2017; Peterson et al., 2016; Rogers et al., 2018), we found that some parents and children looked most at the eyes while others looked at different regions of the face more equally (eyes, nose, and mouth). This was the case regardless of the conversation-scenario. While parents seemed to look more at the faces of their children than vice versa, this could be due to differences in data loss between parents and children (see Appendix 2).
Furthermore, we investigated whether gaze behavior to faces was related to the topic of the conversation. We did not find any differences in where children gazed at the parent’s face as a function of the conversation topic. Interestingly, we did find that on average parents gazed more at the child’s eyes during the conflict-scenario than in the cooperation-scenario. One reason may be that increased eye gaze asserts dominance and social status (Kleinke, 1986; Patterson, 1982). In this sense, increased gaze at the other person’s eyes may serve as a nonverbal emphasis on a particular verbal message to persuade another person, or to press a particular response from that person (Timney & London, 1973). Thus, increased eye gaze from the parent may signal authority while negotiating a family disagreement and persuade the child towards some goal or solution, at least in our conflict-scenario. However, increased gaze to the eyes has also been associated with the expression of affiliation and intimacy (Kleinke, 1986; Patterson, 1982). Thus, it could also be that parents looked more at the child’s eyes in the conflict-scenario because they wanted to express more intimacy while negotiating a potentially conflicting topic of discussion. Our findings do not distinguish between these two potential explanations. If increased gaze to the eyes of the child during the conflict conversation would indeed be the result of social control exercised by the parent, one may expect that the difference scores in gaze to eyes between the two conversations are correlated with some index of parental authority. If, on the other hand, increased gaze to the eyes would be an expression of intimacy, one may expect that the difference scores correlate with some measure of intimacy or interpersonal reactivity. Moreover, it would be interesting to investigate whether parents purposively exert authority or intimacy by means of increased gaze to the eyes when discussing a conflicting topic with their children.
It is important to emphasize that, although the semi-structured conversation paradigm used in this study is designed to elicit ‘conflict’ and ‘cooperation’ dynamics in parent–child interactions, both conversation scenarios could contain elements of collaboration, disagreement, and compromise. This was especially clear from listening to the content of the conversations. The ‘conflict’ conversations could contain both disagreement and collaboration, as parents and children often needed to collaborate to come up with a solution to their disagreement, for example, by settling for a compromise between the wishes of both parent and child. Also, we did not observe any ‘extreme’ conversations, e.g., in which participants raised their voices or yelled. Furthermore, the ‘cooperation’ conversation also could contain disagreements. Often, the parents did not agree with the ideas of their child, nor did children always comply with the demands of their parent. For example, the goal to organize a party in the ‘cooperation’ conversation occasionally led to disagreement, as some ideas of the child for the party plan (e.g., how many friends to invite, what activities to do) were not accepted by the parents. In other words, the distinction between ‘conflict’ and ‘cooperation’ as general labels to describe the content of interaction is not always clear cut. Nevertheless, the different scenarios did result in differences in patterns of speech and gaze behavior.
Finally, we also investigated whether gaze to facial features in parent–child interactions is dependent on speaker-state, because previous eye-tracking studies suggest that the region of the face people look at during conversations depends on whether they are speaking or listening (Rogers et al., 2018). Both parents and children looked more at the mouth region while listening than while speaking. This is in accordance with several non-interactive eye-tracking studies, which have shown that observers presented with videos of talking faces tend to gaze more at the mouth area, especially under noisy conditions or when tasked to report what is being said (Buchan et al., 2007; Vatikiotis-Bateson et al., 1998; Võ et al., 2012). Similar to Rogers et al. (2018)’s interactive eye tracking study, we found that both parents and children gazed slightly more at the mouth when the other person spoke compared to when they were speaking themselves, although these differences were small on average (i.e. approximately 5–10% of total looking time), but see also Hessels et al. (2019). In our study, we found that differences in mouth-looking between speaking and listening were always (or almost always) in the same direction, although the magnitude of this difference varied between individuals. Increased gaze at the mouth when listening to speech may be explained by the fact that people look at the visual cues from mouth and lip movements to support speech perception (Sumby & Pollack, 1954; Vatikiotis-Bateson et al., 1998).
Possibilities, Problems, and Future Directions of Eye-Tracking to Study Gaze Behavior in Parent–Child Interactions
Our study is one of the first to use eye-tracking to study gaze to facial features and its relation to speech behavior in parent–child interactions. Previous research has often been conducted using observational techniques (i.e. which lack in reliability and validity to distinguish gaze to specific facial features), or has been limited to non-interactive eye-tracking procedures with photographs and videos of faces (Risko et al., 2016). As such, the main contribution of our study is empirical, by describing patterns of gaze and speech behavior during different types of conversations (conflict or cooperation). Moreover, the specific interpersonal context (parent–child interaction) is relevant for child development and has not been studied in this manner before. We focused on how aggregate speech and gaze behavior (e.g. total speech durations and dwell times) differed between parents and children and as a function of conversation topic and speaker-state. In future research, it will be useful to investigate the moment-to-moment characteristics of speech and gaze during parent–child interactions, for example, by looking at transitions between face AOIs as a function of speaker-state and conversation-scenarios. Also, it may be interesting to investigate to what extent patterns of verbal and nonverbal behavior are indicative of parents’ conversational style and conflict resolution strategy (Beaumont & Wagner, 2004; Moed et al., 2015), and how this is related to children’s adjustment, emotional reactivity, and social competence (Junge et al., 2020; Moed et al., 2017). For example, functional conflict resolution is typically characterized by validation, support, listening, and expressing positive or neutral affect, whereas dysfunctional conflict styles consist of negative affect, criticism, and hostility (Laursen & Hafen, 2010; Moed et al., 2017). We showed that parents look longer at the eyes during the conflict-scenario, but to discern whether this could also be exemplary of either functional or dysfunctional conflict resolution strategies would require in depth sequential analyses of speech content, voice affect, gaze, and facial expressions. Although this may seem like a daunting task, it may be a worthwhile approach to provide new and crucial insights into distinguishing different types of conflict styles in parent–child interactions.
This study exemplifies how dual eye-tracking technology can be used to objectively measure gaze behavior to faces during full-fledged interactions. However, there are also many challenges and limitations of eye-tracking when applied to the context of human interaction (for a recent review, see Valtakari et al., 2021). In this study, a lot of eye tracking data was lost during the measurements and many recordings were lacking in precision and accuracy. Therefore, we had to exclude many participants based on data quality criteria (see Fig. 3). Due to the limited sample size for some analyses in this study, we are hesitant to claim that these results would generalize to all parent–child dyads. Given the behaviors of interest in this study, we wanted participants to be relatively unrestrained during face-to-face conversations. This came at the cost of lower data quality, especially for the children. Perhaps, if participants would have had more time to practice and get experienced with the dual eye-tracking setup this may have improved data quality. However, this would consequently require more time-investment by both parents, children, and researchers. Researchers who aim to conduct interactive eye-tracking studies with children should be aware of these additional difficulties.
Another point to emphasize is that face-to-face interactions are clearly not the ideal setting for the technical performance of most eye-tracking systems. In the dual eye-tracking setup used in this study, gazing away from the other person’s face could potentially be recorded as gaze directed at the background area (i.e., not looking at the face), but if participants turned their heads away too much from the screen the eye tracker could no longer track participants’ gaze position. Also, a gaze shift back towards the screen after the eye tracker loses track of the gaze position signal does not always coincide with a smooth and instantaneous recovery of the gaze position signal (Hessels et al., 2015; Niehorster et al., 2018). Such problems occur specifically for remote eye trackers (i.e., eye trackers positioned at a distance from the participant). Other researchers have used wearable eye-tracker systems to study gaze behavior during face-to-face interactions. While wearable eye-trackers do not necessarily suffer from the same problem of losing track of someone’s gaze due to looking at and away from the other person, wearable eye-trackers have different limitations, such as a lack of accuracy to distinguish gaze position on different regions of the face. Also, slippage of the head-worn eye tracker may occur when people are speaking or smiling for example, which can result in a loss of accuracy (Niehorster et al., 2020). Such technical limitations thereby constrain what kind of research questions can feasibly be investigated by researchers interested in gaze behavior in interactive situations (for a recent review, see Valtakari et al., 2021).
Assuming that some of the technological and methodological limitations of measuring gaze in full-fledged interactions can be overcome (e.g., issues with data quality), how could the use of dual eye-tracking technology benefit future studies on the role of gaze behavior during parent–child interactions? Firstly, a more fine-grained analysis of parents’ and children’s gaze behavior could shed new light on some of the interpersonal dynamics of parent–child relationships. Observational techniques (i.e., manual coding from video-recordings) used to estimate gaze position may lack the reliability and precision to distinguish specific aspects of gaze in interaction, e.g., what regions of the face are looked at and how these are related with other behaviors, such as speaking, listening, and turn-taking. Secondly, many studies have relied heavily on self-reports to assess the parent–child relationship, e.g., parents’ and children’s perceptions about their relationship quality, the intensity and frequency of parent–child conflicts across different ages and stages of development, etc. While studies using self-reports have provided valuable insights into the general structure and relational changes of parent–child interactions (Branje, 2018; Mastrotheodoros et al., 2020; Smetana, 2011), such methods do not directly investigate the behavioral and interpersonal dynamics of parent–child interactions in the ‘heat of the moment’. We think that dual eye-tracking technology, in combination with algorithms to classify face and pose, speech content, and voice affect, could be the key to further understanding parent–child interactions in terms of, for example, parents’ and children’s conversational style and conflict resolution strategies (Beaumont & Wagner, 2004; Dixon et al., 2008; Thomas et al., 2017), as well as individual and interpersonal differences in emotion regulation and social competence (Hutchinson et al., 2019; Junge et al., 2020; Moed et al., 2015, 2017; Speer et al., 2007; Woody et al., 2020).
Conclusion
In this study we investigated the role of conflict and cooperation in parent–child interactions. We showed how patterns of speech and gaze behavior (i.e. how much talking was going on, where parents and children looked at each other’s face during interaction) were modulated by topic of conversation (conflict, cooperation) and participant role (speaker, listener). Interpersonal dynamics of the social context were reflected in patterns of speech and gaze behavior, but varied substantially across individuals. Some individuals looked primarily at the eyes or mouth region, while others gazed at different facial features more equally over the course of the conversations. These individual differences were largely consistent across the two conversations, suggesting that individuals also exhibit stable, idiosyncratic face scanning patterns in face-to-face interactions (Arizpe et al., 2017; Peterson et al., 2016; Rogers et al., 2018).
Notes
All visual angles in our study are reported under the assumption that participants were seated at approximately 81 cm distance from the screen and in the center of the camera image.
References
Argyle, M., & Cook, M. (1976). Gaze and mutual gaze. Cambridge University Press.
Arizpe, J., Walsh, V., Yovel, G., & Baker, C. I. (2017). The categories, frequencies, and stability of idiosyncratic eye-movement patterns to faces. Vision Research, 141, 191–203. https://doi.org/10.1016/j.visres.2016.10.013
Arnold, A., Semple, R. J., Beale, I., & Fletcher-Flinn, C. M. (2000). Eye contact in children’s social interactions: What is normal behaviour? Journal of Intellectual and Developmental Disability, 25(3), 207–216. https://doi.org/10.1080/13269780050144271
Ashear, V., & Snortum, J. R. (1971). Eye contact in children as a function of age, sex, social and intellective variables. Developmental Psychology, 4(3), 479. https://doi.org/10.1037/h0030974
Aspland, H., & Gardner, F. (2003). Observational measures of parent-child interaction: An introductory review. Child and Adolescent Mental Health, 8(3), 136–143. https://doi.org/10.1111/1475-3588.00061
Beattie, G. W., & Bogle, G. (1982). The reliability and validity of different video-recording techniques used for analysing gaze in dyadic interaction. British Journal of Social Psychology, 21(1), 34–35. https://doi.org/10.1111/j.2044-8309.1982.tb00509.x
Beaumont, S. L., & Wagner, S. L. (2004). Adolescent-parent verbal conflict: The roles of conversational styles and disgust emotions. Journal of Language and Social Psychology, 23(3), 338–368. https://doi.org/10.1177/0261927X04266813
Berger, J., & Cunningham, C. C. (1981). The development of eye contact between mothers and normal versus Down’s syndrome infants. Developmental Psychology, 17(5), 678. https://doi.org/10.1037/0012-1649.17.5.678
Birmingham, E., Bischof, W. F., & Kingstone, A. (2009). Saliency does not account for fixations to eyes within social scenes. Vision Research, 49(24), 2992–3000. https://doi.org/10.1016/j.visres.2009.09.014
Branje, S. (2018). Development of parent–adolescent relationships: Conflict interactions as a mechanism of change. Child Development Perspectives, 12(3), 171–176. https://doi.org/10.1111/cdep.12278
Buchan, J. N., Paré, M., & Munhall, K. G. (2007). Spatial statistics of gaze fixations during dynamic face processing. Social Neuroscience, 2(1), 1–13. https://doi.org/10.1080/17470910601043644
Buswell, G. T. (1935). How people look at pictures: A study of the psychology and perception in art. Chicago University Press.
Carpendale, J. I., & Lewis, C. (2004). Constructing an understanding of mind: The development of children’s social understanding within social interaction. Behavioral and Brain Sciences, 27(1), 79–96. https://doi.org/10.1017/S0140525X04000032
Cipolli, C., Sancini, M., Tuozzi, G., Bolzani, R., Mutinelli, P., Flamigni, C., & Porcu, E. (1989). Gaze and eye-contact with anorexic adolescents. British Journal of Medical Psychology, 62(4), 365–369. https://doi.org/10.1111/j.2044-8341.1989.tb02846.x
De Goede, I. H., Branje, S. J., & Meeus, W. H. (2009). Developmental changes in adolescents’ perceptions of relationships with their parents. Journal of Youth and Adolescence, 38(1), 75–88. https://doi.org/10.1007/s10964-008-9286-7
Dixon, S. V., Graber, J. A., & Brooks-Gunn, J. (2008). The roles of respect for parental authority and parenting practices in parent-child conflict among African American, Latino, and European American families. Journal of Family Psychology, 22(1), 1. https://doi.org/10.1037/0893-3200.22.1.1
Duncan, S., & Fiske, D. W. (2015). Face-to-face interaction: Research, methods, and theory. Routledge. (1977)
Dunn, J., & Slomkowski, C. (1992). Conflict and the development of social understanding. In C. U. Schantz & W. W. Hartup (Eds), Conflict in Child and Adolescent Development (1992). Cambridge University Press.
Ehrlich, K. B., Richards, J. M., Lejuez, C., & Cassidy, J. (2016). When parents and adolescents disagree about disagreeing: Observed parent–adolescent communication predicts informant discrepancies about conflict. Journal of Research on Adolescence, 26(3), 380–389. https://doi.org/10.1111/jora.12197
Fakkel, M., Peeters, M., Lugtig, P., Zondervan-Zwijnenburg, M. A. J., Blok, E., White, T., & Vollebergh, W. A. M. (2020). Testing sampling bias in estimates of adolescent social competence and behavioral control. Developmental Cognitive Neuroscience, 46,.
Farroni, T., Csibra, G., Simion, F., & Johnson, M. H. (2002). Eye contact detection in humans from birth. Proceedings of the National Academy of Sciences, 99(14), 9602–9605. https://doi.org/10.1073/pnas.152159999
Foddy, M. (1978). Patterns of gaze in cooperative and competitive negotiation. Human Relations, 31(11), 925–938. https://doi.org/10.1177/001872677803101101
Foulsham, T., & Sanderson, L. A. (2013). Look who’s talking? Sound changes gaze behaviour in a dynamic social scene. Visual Cognition, 21(7), 922–944.
Foulsham, T., Walker, E., & Kingstone, A. (2011). The where, what and when of gaze allocation in the lab and the natural environment. Vision Research, 51(17), 1920–1931. https://doi.org/10.1016/j.visres.2011.07.002
Frank, M. C., Vul, E., & Johnson, S. P. (2009). Development of infants’ attention to faces during the first year. Cognition, 110(2), 160–170. https://doi.org/10.1016/j.cognition.2008.11.010
Freeth, M., Foulsham, T., & Kingstone, A. (2013). What affects social attention? Social presence, eye contact and autistic traits. PLoS ONE, 8(1), e53286. https://doi.org/10.1371/journal.pone.0053286
Gauvain, M. (2001). The social context of cognitive development. Guilford Press.
Gliga, T., Elsabbagh, M., Andravizou, A., & Johnson, M. (2009). Faces attract infants’ attention in complex displays. Infancy, 14(5), 550–562. https://doi.org/10.1080/15250000903144199
Haensel, J. X., Danvers, M., Ishikawa, M., Itakura, S., Tucciarelli, R., Smith, T. J., & Senju, A. (2020). Culture modulates face scanning during dyadic social interactions. Scientific Reports, 10(1), 1–11. https://doi.org/10.1038/s41598-020-58802-0
Haensel, J. X., Smith, T. J., & Senju, A. (2017). Cultural differences in face scanning during live face-to-face interactions using head-mounted eye-tracking. Journal of Vision, 17(10), 835–835. https://doi.org/10.1038/s41598-020-58802-0
Hessels, R. S. (2020). How does gaze to faces support face-to-face interaction? A review and perspective. Psychonomic Bulletin & Review, 1-26. https://doi.org/10.3758/s13423-020-01715-w
Hessels, R. S., Benjamins, J. S., Cornelissen, T. H. W., & Hooge, I. T. C. (2018a). A validation of automatically-generated Areas-of-Interest in videos of a face for eye-tracking research. Frontiers in Psychology, 9, 1367. https://doi.org/10.3389/fpsyg.2018.01367
Hessels, R. S., Benjamins, J. S., van Doorn, A. J., Koenderink, J. J., Holleman, G. A., & Hooge, I. T. C. (2020a). Looking behavior and potential human interactions during locomotion. Journal of Vision, 20(10), 5–5. https://doi.org/10.1167/jov.20.10.5
Hessels, R. S., Cornelissen, T. H., Hooge, I. T. C., & Kemner, C. (2017). Gaze behavior to faces during dyadic interaction. Canadian Journal of Experimental Psychology/revue Canadienne De Psychologie Expérimentale, 71(3), 226–242. https://doi.org/10.1037/cep0000113
Hessels, R. S., Cornelissen, T. H. W., Kemner, C., & Hooge, I. T. C. (2015). Qualitative tests of remote eyetracker recovery and performance during head rotation. Behavior Research Methods, 47(3), 848–859. https://doi.org/10.3758/s13428-014-0507-6
Hessels, R. S., Holleman, G. A., Cornelissen, T. H. W., Hooge, I. T. C., & Kemner, C. (2018b). Eye contact takes two–autistic and social anxiety traits predict gaze behavior in dyadic interaction. Journal of Experimental Psychopathology, 9(2), jep. 062917. https://doi.org/10.5127/jep.062917
Hessels, R. S., Holleman, G. A., Kingstone, A., Hooge, I. T. C., & Kemner, C. (2019). Gaze allocation in face-to-face communication is affected primarily by task structure and social context, not stimulus-driven factors. Cognition, 184, 28–43. https://doi.org/10.1016/j.cognition.2018.12.005
Hessels, R. S., & Hooge, I. T. C. (2019). Eye tracking in developmental cognitive neuroscience–The good, the bad and the ugly. Developmental Cognitive Neuroscience, 40, 100710. https://doi.org/10.1016/j.dcn.2019.100710
Hessels, R. S., Kemner, C., van den Boomen, C., & Hooge, I. T. C. (2016). The area-of-interest problem in eyetracking research: A noise-robust solution for face and sparse stimuli. Behavior Research Methods, 48(4), 1694–1712. https://doi.org/10.3758/s13428-015-0676-y
Hessels, R. S., van Doorn, A. J., Benjamins, J. S., Holleman, G. A., & Hooge, I. T. C. (2020b). Task-related gaze control in human crowd navigation. Attention, Perception, & Psychophysics, 1-20. https://doi.org/10.3758/s13414-019-01952-9
Ho, S., Foulsham, T., & Kingstone, A. (2015). Speaking and listening with the eyes: Gaze signaling during dyadic interactions. PLoS ONE, 10(8), e0136905. https://doi.org/10.1371/journal.pone.0136905
Holleman, G. A., Hessels, R. S., Kemner, C., & Hooge, I. T. C. (2019). Eye Tracking During Interactive Face Perception: Does Speech Affect Eye-Tracking Data Quality? European Conference on Visual Perception [ECVP], Leuven, Belgium.
Holler, J., & Levinson, S. C. (2019). Multimodal language processing in human communication. Trends in Cognitive Sciences, 23(8), 639–652. https://doi.org/10.1016/j.tics.2019.05.006
Holmqvist, K., Nyström, M., & Mulvey, F. (2012). Eye tracker data quality: What it is and how to measure it. Proceedings of the Symposium on Eye Tracking Research and Applications. https://doi.org/10.1145/2168556.2168563
Hutchinson, E. A., Rosen, D., Allen, K., Price, R. B., Amole, M., & Silk, J. S. (2019). Adolescent gaze-directed attention during parent–child conflict: The effects of depressive symptoms and parent–child relationship quality. Child Psychiatry & Human Development, 50(3), 483–493. https://doi.org/10.1007/s10578-018-0856-y
Itier, R. J., Villate, C., & Ryan, J. D. (2007). Eyes always attract attention but gaze orienting is task-dependent: Evidence from eye movement monitoring. Neuropsychologia, 45(5), 1019–1028. https://doi.org/10.1016/j.neuropsychologia.2006.09.004
Jack, R. E., & Schyns, P. G. (2017). Toward a social psychophysics of face communication. Annual Review of Psychology, 68, 269–297. https://doi.org/10.1146/annurev-psych-010416-044242
Junge, C., Valkenburg, P. M., Deković, M., & Branje, S. (2020). The building blocks of social competence: Contributions of the Consortium of Individual Development. Developmental Cognitive Neuroscience, 45, 100861. https://doi.org/10.1016/j.dcn.2020.100861
Kanan, C., Bseiso, D. N., Ray, N. A., Hsiao, J. H., & Cottrell, G. W. (2015). Humans have idiosyncratic and task-specific scanpaths for judging faces. Vision Research, 108, 67–76. https://doi.org/10.1016/j.visres.2015.01.013
Kelly, S. D., Özyürek, A., & Maris, E. (2010). Two sides of the same coin: Speech and gesture mutually interact to enhance comprehension. Psychological Science, 21(2), 260–267. https://doi.org/10.1177/0956797609357327
Kendon, A. (1967). Some functions of gaze-direction in social interaction. Acta Psychologica, 26, 22–63. https://doi.org/10.1016/0001-6918(67)90005-4
Kleinke, C. L. (1986). Gaze and eye contact: A research review. Psychological Bulletin, 100(1), 78. https://doi.org/10.1037/0033-2909.100.1.78
Laidlaw, K. E., Foulsham, T., Kuhn, G., & Kingstone, A. (2011). Potential social interactions are important to social attention. Proceedings of the National Academy of Sciences, 108(14), 5548–5553. https://doi.org/10.1073/pnas.1017022108
Laursen, B., & Collins, W. A. (2004). Parent-child communication during adolescence. The Routledge Handbook of Family Communication, 2, 333–348.
Laursen, B., & Collins, W. A. (2009). Parent-child relationships during adolescence. In R. M. Lerner & L. Steinberg (Eds.), Handbook of Adolescent Psychology: Contextual Influences on Adolescent Development (pp. 3–42). John Wiley & Sons, Inc. https://doi.org/10.1002/9780470479193.adlpsy002002
Laursen, B., & Hafen, C. A. (2010). Future directions in the study of close relationships: Conflict is bad (except when it’s not). Social Development, 19(4), 858–872. https://doi.org/10.1111/j.1467-9507.2009.00546.x
Levine, M. H., & Sutton-Smith, B. (1973). Effects of age, sex, and task on visual behavior during dyadic interaction. Developmental Psychology, 9(3), 400. https://doi.org/10.1037/h0034929
Mastrotheodoros, S., Van der Graaff, J., Deković, M., Meeus, W. H., & Branje, S. (2020). Parent–adolescent conflict across adolescence: Trajectories of informant discrepancies and associations with personality types. Journal of Youth and Adolescence, 49(1), 119–135. https://doi.org/10.1007/s10964-019-01054-7
McGurk, H., & MacDonald, J. (1976). Hearing lips and seeing voices. Nature, 264(5588), 746–748. https://doi.org/10.1038/264746a0
Mehoudar, E., Arizpe, J., Baker, C. I., & Yovel, G. (2014). Faces in the eye of the beholder: Unique and stable eye scanning patterns of individual observers. Journal of Vision, 14(7), 6–6. https://doi.org/10.1167/14.7.6
Mirenda, P. L., Donnellan, A. M., & Yoder, D. E. (1983). Gaze behavior: A new look at an old problem. Journal of Autism and Developmental Disorders, 13(4), 397–409. https://doi.org/10.1007/BF01531588
Moed, A., Dix, T., Anderson, E. R., & Greene, S. M. (2017). Expressing negative emotions to children: Mothers’ aversion sensitivity and children’s adjustment. Journal of Family Psychology, 31(2), 224. https://doi.org/10.1037/fam0000239
Moed, A., Gershoff, E. T., Eisenberg, N., Hofer, C., Losoya, S., Spinrad, T. L., & Liew, J. (2015). Parent–adolescent conflict as sequences of reciprocal negative emotion: Links with conflict resolution and adolescents’ behavior problems. Journal of Youth and Adolescence, 44(8), 1607–1622. https://doi.org/10.1007/s10964-014-0209-5
Niehorster, D. C., Cornelissen, T. H. W., Holmqvist, K., Hooge, I. T. C., & Hessels, R. S. (2018). What to expect from your remote eye-tracker when participants are unrestrained. Behavior Research Methods, 50(1), 213–227. https://doi.org/10.3758/s13428-017-0863-0
Niehorster, D. C., Santini, T., Hessels, R. S., Hooge, I. T., Kasneci, E., & Nyström, M. (2020). The impact of slippage on the data quality of head-worn eye trackers. Behavior Research Methods, 1-21. https://doi.org/10.3758/s13428-019-01307-0
Onland-Moret, N. C., Buizer-Voskamp, J. E., Albers, M. E., Brouwer, R. M., Buimer, E. E., Hessels, R. S., . . . Mandl, R. C. (2020). The YOUth study: rationale, Design, and study procedures. Developmental Cognitive Neuroscience, 100868. https://doi.org/10.1016/j.dcn.2020.100868
Patterson, M. L. (1982). A sequential functional model of nonverbal exchange. Psychological Review, 89(3), 231. https://doi.org/10.1037/0033-295X.89.3.231
Peterson, M. F., & Eckstein, M. P. (2013). Individual differences in eye movements during face identification reflect observer-specific optimal points of fixation. Psychological Science, 24(7), 1216–1225. https://doi.org/10.1177/0956797612471684
Peterson, M. F., Lin, J., Zaun, I., & Kanwisher, N. (2016). Individual differences in face-looking behavior generalize from the lab to the world. Journal of Vision, 16(7), 12–12. https://doi.org/10.1167/16.7.12
Risko, E. F., Laidlaw, K., Freeth, M., Foulsham, T., & Kingstone, A. (2012). Social attention with real versus reel stimuli: Toward an empirical approach to concerns about ecological validity. Frontiers in Human Neuroscience, 6, 143. https://doi.org/10.3389/fnhum.2012.00143
Risko, E. F., Richardson, D. C., & Kingstone, A. (2016). Breaking the fourth wall of cognitive science: Real-world social attention and the dual function of gaze. Current Directions in Psychological Science, 25(1), 70–74. https://doi.org/10.1177/0963721415617806
Rogers, S. L., Speelman, C. P., Guidetti, O., & Longmuir, M. (2018). Using dual eye tracking to uncover personal gaze patterns during social interaction. Scientific Reports, 8(1), 1–9. https://doi.org/10.1038/s41598-018-22726-7
Rossano, F., Brown, P., & Levinson, S. C. (2009). Gaze, questioning and culture. In J. Sidnell (Ed.), Conversation Analysis: Comparative Perspectives, 27 (pp. 187–249). Cambridge University Press.
Rousselet, G. A., Pernet, C. R., & Wilcox, R. R. (2017). Beyond differences in means: Robust graphical methods to compare two groups in neuroscience. European Journal of Neuroscience, 46(2), 1738–1748. https://doi.org/10.1111/ejn.13610
Rubo, M., Huestegge, L., & Gamer, M. (2020). Social anxiety modulates visual exploration in real life–but not in the laboratory. British Journal of Psychology, 111(2), 233–245. https://doi.org/10.1111/bjop.12396
Schofield, T. J., Parke, R. D., Castaneda, E. K., & Coltrane, S. (2008). Patterns of gaze between parents and children in European American and Mexican American families. Journal of Nonverbal Behavior, 32(3), 171–186. https://doi.org/10.1007/s10919-008-0049-7
Scott, S., Briskman, J., Woolgar, M., Humayun, S., & O’Connor, T. G. (2011). Attachment in adolescence: Overlap with parenting and unique prediction of behavioural adjustment. Journal of Child Psychology and Psychiatry, 52(10), 1052–1062. https://doi.org/10.1111/j.1469-7610.2011.02453.x
Smetana, J. G. (2011). Adolescents’ social reasoning and relationships with parents: Conflicts and coordinations within and across domains. In E. Amsel & J. Smetana (Eds.), Adolescent Vulnerabilities and Opportunities: Constructivist and Developmental Perspectives (pp. 139–158). Cambridge University Press.
Smokowski, P. R., Bacallao, M. L., Cotter, K. L., & Evans, C. B. (2015). The effects of positive and negative parenting practices on adolescent mental health outcomes in a multicultural sample of rural youth. Child Psychiatry & Human Development, 46(3), 333–345. https://doi.org/10.1007/s10578-014-0474-2
Speer, L. L., Cook, A. E., McMahon, W. M., & Clark, E. (2007). Face processing in children with autism: Effects of stimulus contents and type. Autism, 11(3), 265–277. https://doi.org/10.1177/1362361307076925
Steinberg, L. (2001). We know some things: Parent–adolescent relationships in retrospect and prospect. Journal of Research on Adolescence, 11(1), 1–19. https://doi.org/10.1111/1532-7795.00001
Stivers, T., Enfield, N. J., Brown, P., Englert, C., Hayashi, M., Heinemann, T., . . . Yoon, K.-E. (2009). Universals and cultural variation in turn-taking in conversation. Proceedings of the National Academy of Sciences, 106(26), 10587-10592. https://doi.org/10.1073/pnas.0903616106
Sumby, W. H., & Pollack, I. (1954). Visual contribution to speech intelligibility in noise. The Journal of the Acoustical Society of America, 26(2), 212–215. https://doi.org/10.1121/1.1907309
Thomas, S. A., Wilson, T., Jain, A., Deros, D. E., Um, M., Hurwitz, J., . . . Dunn, E. J. (2017). Toward developing laboratory-based parent–adolescent conflict discussion tasks that consistently elicit adolescent conflict-related stress responses: Support from physiology and observed behavior. Journal of Child and Family Studies, 26(12), 3288-3302. https://doi.org/10.1007/s10826-017-0844-z
Timney, B., & London, H. (1973). Body language concomitants of persuasiveness and persuasibility in dyadic interaction. International Journal of Group Tensions, 3(3–4), 48–67.
Tucker, C. J., McHale, S. M., & Crouter, A. C. (2003). Conflict resolution: Links with adolescents’ family relationships and individual well-being. Journal of Family Issues, 24(6), 715–736. https://doi.org/10.1177/0192513X03251181
Valtakari, N. V., Hooge, I. T., Viktorsson, C., Nyström, P., Falck-Ytter, T., & Hessels, R. S. (2021). Eye tracking in human interaction: Possibilities and limitations. Behavior Research Methods, 1-17. https://doi.org/10.3758/s13428-020-01517-x
Vatikiotis-Bateson, E., Eigsti, I.-M., Yano, S., & Munhall, K. G. (1998). Eye movement of perceivers during audiovisualspeech perception. Perception & Psychophysics, 60(6), 926–940. https://doi.org/10.3758/BF03211929
Võ, M.L.-H., Smith, T. J., Mital, P. K., & Henderson, J. M. (2012). Do the eyes really have it? Dynamic allocation of attention when viewing moving faces. Journal of Vision, 12(13), 3–3. https://doi.org/10.1167/12.13.3
Woody, M. L., Price, R. B., Amole, M., Hutchinson, E., Benoit Allen, K., & Silk, J. S. (2020). Using mobile eye-tracking technology to examine adolescent daughters’ attention to maternal affect during a conflict discussion. Developmental Psychobiology. https://doi.org/10.1002/dev.22024
Yarbus, A. L. (1967). Eye movements during perception of complex objects. In Eye Movements and Vision (pp. 171–211). Springer.
Author information
Authors and Affiliations
Corresponding author
Ethics declarations
All the authors declare that they have no conflict of interest. All the procedures performed in this study were in accordance with the ethical standards of the institutional and/or national research committee and with the 1964 Helsinki Declaration and its later amendments or comparable ethical standards. This study was approved by the Medical Research Ethics Committee of the University Medical Center Utrecht and is registered under protocol number 19–051/M. Informed consent was obtained from all participants included in the study (parents provided written informed consent for themselves as well as on behalf of their children).
Data Availability
The data that support the findings of this study are available on reasonable request from the corresponding author GH. The data are not publicly available due to restrictions on their containing information that could compromise the privacy of research participants.
Additional information
Publisher’s Note
Springer Nature remains neutral with regard to jurisdictional claims in published maps and institutional affiliations.
Appendices
Appendix 1: Conversation Topics
Transportation, using bicycle or car
Money or valuable things
Not being at home, or being too much at home
Table manners, being rude
Bed time
Screen time, TV, computer, phone
Bullying
Behavior in class or at school
Privacy
School performance
Different opinions
Future plans
Gossip, secrets
Being annoying
Associating with others
Being on time, cancelling appointments
Leisure time
(Not) doing something when asked
Cleaning room
Appearance, clothing
School grades
Being honest
Homework
Household chores
(Not) sharing problems
Other…
Appendix 2: Three Types of Data Loss
Data loss is a problem in eye-tracking research and in our study it was expected due to relatively unrestrained behavior of the participants. Here we are interested in what were the most important sources of data loss, and how they were related to our main analyses. We identified at least three types of data loss in our study, namely: 1) samples with no eye-tracking data (i.e. no gaze position recorded), 2) samples with no AOI labels assigned to all video frames (i.e. no AOI data), and 3) samples that did not count as a dwell (i.e. shorter than 120 ms). As is visible from Fig. 7, we found that missing eye-tracking data (i.e. no gaze position recorded) was the most prominent source of data loss in our study. Moreover, we found that total amount of time without eye-tracking data was much higher for children than parents. This may explain why relative total dwell times to the facial and background AOIs were generally higher for parents than for children (see 10, Section 14).

Three types of data loss: no ET data, no AOI data, and short dwells. Left panels depict data loss measures for the parents and right panels for the children. Relative total duration (as a percentage) without eye-tracking data (i.e. no gaze position recorded), without AOI data, or with dwells shorter than 120 ms (i.e. invalid dwells) are depicted on the x-axis. Upper panels depict data loss measures as a function of conversation-scenario (conflict and cooperation). Lower panels depict data loss measures as a function of speaker-state (self-speech and other-speech). Each marker represents data from one participant. The vertical orange stripes represent the median relative total dwell time per data loss type
Appendix 3: Data Loss Exclusion Criteria Does Not Affect Main Findings
As stated, we expected that eye-tracking data loss was especially likely to occur while speaking. Therefore, we did not exclude participants based on a general data loss criterion, as this may selectively exclude participants that spoke relatively more. Therefore, we needed to validate that not excluding participants based on a data loss criterion did not affect our main findings. In this section, we present two separate sensitivity analyses for two of our main findings.
The first sensitivity analysis pertains to our finding that parents looked more at the eyes AOI during the conflict-scenario. We validated whether this finding was not affected by exclusion of participants based on a data loss criterion. Figure 8 depicts an outcome measure as a function of the data loss criterion. The data loss criterion used here was the percentage of time during listening without eye-tracking data, as this does not include data loss due to excessive looking away (as in speaking). On the y-axis the percentage point difference in total dwell time at the eyes AOI is depicted. On the x-axis a data loss criterion is depicted (i.e. as a % of missing ET data). As is visible from this figure, the positive median percentage point difference in looking at the eyes AOI between conflict and cooperation (see 10, Section 14) was not affected by a data loss criterion, as its median and 95% confidence intervals were consistently above zero. In other words, the direction of the percentage point difference is not related to the data loss exclusion criterion. Thus, the finding that parents looked more at their children’s eyes in the conflict conversation does not depend on whether we exclude participants based on data loss.
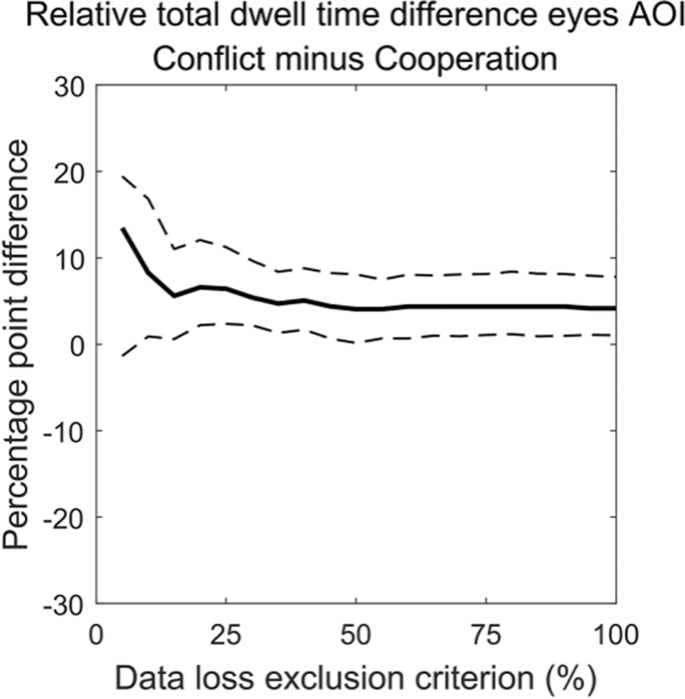
Relative total dwell time difference to the eyes AOI between conflict and cooperation scenario. In this case, we validated whether the positive median percentage point difference in parents’ total dwell time to the eyes AOI was affected by data loss. Eye-tracking data loss was operationalized as the relative total duration during which no eye-tracking data was recorded. Participants were excluded if data loss exceeded the value on the x-axis for both conflict and cooperation conversations. Lower values of the data loss exclusion criterion represent a stricter exclusion policy (at 0% all participants are excluded and at 100% no participants are excluded). The solid black line represents the median percentage point difference, and the dashed black lines represent the 95% confidence intervals of the median, both of which were obtained through bootstrapping using the MATLAB-function decilespcbi provided by Rousselet et al. (2017)
The second sensitivity analysis pertains to our finding that both parents and children looked more at the mouth AOI during episodes of other-speech. We validated whether this finding was not affected by exclusion based on a data loss criterion. Figure 9 depicts the percentage point difference in total dwell time to the mouth AOI between self-speech and other-speech episodes for the parents (left panel) and children (right panel) as a function of the same data loss exclusion criterion. On the y-axis the percentage point difference in total dwell time at the mouth AOI is depicted. On the x-axis a data loss criterion is depicted (i.e. as a percentage of missing ET data). As is visible from this figure, the negative median percentage point difference in looking at the mouth AOI between self-speech and other-speech (see 10, Section 14) was not affected by a data loss criterion, as its median and 95% confidence intervals were consistently below zero. Thus, the direction of the percentage point difference is not related to the data loss exclusion criterion. Thus, the finding that participants looked more at the other’s mouth during other-speech does not depend on whether we exclude participants based on data loss.
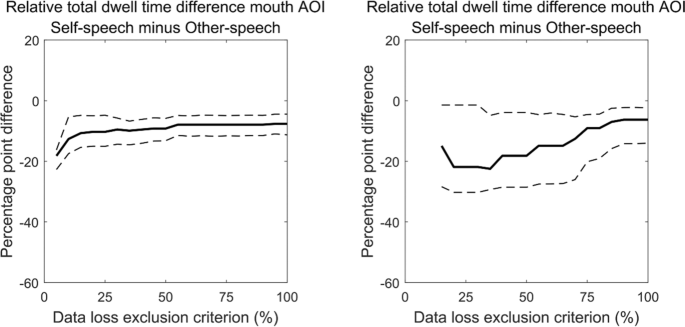
Relative total dwell time difference to the mouth AOI between self-speech and other-speech. In this case, we validated whether the negative median percentage point difference in parents’ (left panel) and children’s (right panel) relative total dwell time to the mouth was affected by data loss. Eye-tracking data loss was operationalized as the relative total duration during which no eye-tracking data was recorded during periods of other-speech. Participants were excluded if the eye-tracking data loss during periods of other-speech exceeded the value on the x-axis (eye-tracking data loss was averaged over the two conversations). Lower values of the data loss exclusion criterion represent a stricter exclusion policy (at 0% all participants are excluded and at 100% no participants are excluded). The solid black line represents the median percentage point difference, and the dashed black lines represent the 95% confidence intervals of the median, both of which were obtained through bootstrapping using the MATLAB-function decilespcbi provided by Rousselet et al. (2017)
Rights and permissions
Open Access This article is licensed under a Creative Commons Attribution 4.0 International License, which permits use, sharing, adaptation, distribution and reproduction in any medium or format, as long as you give appropriate credit to the original author(s) and the source, provide a link to the Creative Commons licence, and indicate if changes were made. The images or other third party material in this article are included in the article's Creative Commons licence, unless indicated otherwise in a credit line to the material. If material is not included in the article's Creative Commons licence and your intended use is not permitted by statutory regulation or exceeds the permitted use, you will need to obtain permission directly from the copyright holder. To view a copy of this licence, visit http://creativecommons.org/licenses/by/4.0/.
About this article

Cite this article
Holleman, G.A., Hooge, I.T.C., Huijding, J. et al. Gaze and speech behavior in parent–child interactions: The role of conflict and cooperation. Curr Psychol 42, 12129–12150 (2023). https://doi.org/10.1007/s12144-021-02532-7
Accepted:
Published:
Issue Date:
DOI: https://doi.org/10.1007/s12144-021-02532-7