
Abstract
Among patients with Coronavirus disease (COVID-19), the ability to identify patients at risk for deterioration during their hospital stay is essential for effective patient allocation and management. To predict patient risk for critical COVID-19 based on status at admission using machine-learning models. Retrospective study based on a database of tertiary medical center with designated departments for patients with COVID-19. Patients with severe COVID-19 at admission, based on low oxygen saturation, low partial arterial oxygen pressure, were excluded. The primary outcome was risk for critical disease, defined as mechanical ventilation, multi-organ failure, admission to the ICU, and/or death. Three different machine-learning models were used to predict patient deterioration and compared to currently suggested predictors and to the APACHEII risk-prediction score. Among 6995 patients evaluated, 162 were hospitalized with non-severe COVID-19, of them, 25 (15.4%) patients deteriorated to critical COVID-19. Machine-learning models outperformed the all other parameters, including the APACHE II score (ROC AUC of 0.92 vs. 0.79, respectively), reaching 88.0% sensitivity, 92.7% specificity and 92.0% accuracy in predicting critical COVID-19. The most contributory variables to the models were APACHE II score, white blood cell count, time from symptoms to admission, oxygen saturation and blood lymphocytes count. Machine-learning models demonstrated high efficacy in predicting critical COVID-19 compared to the most efficacious tools available. Hence, artificial intelligence may be applied for accurate risk prediction of patients with COVID-19, to optimize patients triage and in-hospital allocation, better prioritization of medical resources and improved overall management of the COVID-19 pandemic.
Introduction
In December 2019, a novel pathogen emerged in China, spreading rapidly around the globe, to the point, where by March 2020, the World Health Organization (WHO) has declared the novel coronavirus (COVID-19) outbreak a global pandemic [1]. The clinical presentation of infection by severe acute respiratory syndrome coronavirus 2 (SARS-CoV-2) ranged between asymptomatic infection, mild symptoms and critical disease, defined by respiratory and/or multi-organ failure and death [2,3,4,5].
The pandemic challenged healthcare systems worldwide, which confronted overwhelming burden of patients with COVID-19, emphasizing the critical role of effective patient’s triage, to allow adequate clinical care for those deteriorating to critical COVID-19 [6,7,8]. In the absence of effective triage, medical system insufficiency required national reinforcement actions in several instances [9], emphasizing the need for effective risk-prediction tools that are essential for viable healthcare system [10].
While identifying severe patients at their acute phase is clinically trivial, early identification of those at risk to deteriorate, and those with very low risk for critical disease, are the measures required for efficient triage. Only few baseline parameters were associated with poor COVID-19 outcome [11], including older age [12] and the presence of comorbidities [13, 14]. Other factors suggested had peak/nadir value at the severe disease phase, and not at baseline, and included hypoxia, thrombocytopenia [15], coagulation abnormalities (prolonged prothrombin time, high d-dimer levels [16, 17]), liver injury [18, 19], cellular (neutrophilia, lymphopenia) and cytokine-based immune-related parameters (increased interleukins six, eight and ten levels) [20] that led to assessment of interleukin-6 as a target for molecular inhibition [21], and high disease-severity scores [22].
Machine-learning (ML) algorithms enable assessment of the relations between input and output of complex processes. In the context of risk stratification, ML models generate better performance than traditional prediction models [23, 24], owing to their ability to reveal nonlinear associations, superior optimization of multi-factorial algorithms and built-in methodologies for model validation [25, 26]. The application of different ML models in feature selection and classification of multidimensional heterogeneous data, can provide promising tools for inference in medical practice [27] and was suggested for trend prediction [28] and risk stratification of patients with COVID-19 [29].
The need for efficient triage facing the COVID-19 pandemic, forces us to seek in our toolbox for the optimal prediction tool in our possession. Therefore, the aim of this study is to test the capabilities of ML models for the triage of patients with COVID-19, by predicting their risk for critical COVID-19 based on baseline clinical parameters.
Methods
Population, patient selection, inclusion, and exclusion criteria
This was a retrospective study, including all patients admitted to COVID-19 designated departments in a single tertiary medical center between March 8 and April 5, 2020. Patients included had confirmed COVID-19 infection based on reverse-transcriptase polymerase chain reaction (RT-PCR) for the SARS-CoV-2 ribonucleic acid (RNA). All patients were evaluated at the Sheba MC Department for Emergency Medicine, and underwent routine baseline evaluation, including recording of medical history, current complaints, measurement of vital signs, baseline testing for blood count, kidney and liver function tests, and inflammatory markers.
Severe disease was defined by meeting one or more of the following criteria [30]: Respiratory rate ≥ 30 breaths/min, arterial oxygen saturation ≤ 93% at room air, and PaO2/FiO2 ≤ 300. Critical patients were defined according to the following criteria: respiratory failure necessitating mechanical ventilation, hospitalization in ICU multi-organ failure and/or death [31]. Patients with severe disease at presentation were excluded to allow unbiased analysis, for predicting deterioration in patients during their hospitalization.
Machine learning models
In order to predict deterioration, we used three different machine-learning algorithms [32]: Neural Network, Random Forest [33], and Classification and Regression Decision Tree (CRT). Performances of the testing samples from each model are reported by mean, sensitivity, specificity, positive predictive value and accuracy. Receiver operator characteristic (ROC) curves were plotted, and mean area under the curve (AUC) calculated for each ROC plot.
Artificial neural network
Artificial neural network (ANN) was built using SPSS 25 interface, using hyperbolic tangent activation function for the hidden layer and Softmax activation function with cross-entropy error function for the output layer. The network comprised an input layer including 16 normalized variables (14 covariate and two factors), one hidden layer and an output layer. The network batch-trained over approximately 70% of the samples using scaled conjugate gradient as the optimization algorithm and tested on the remaining 30%. The model was validated using tenfold cross-validation method (training/test sample ratio: 70/30% × 10). In other words, 70% of all cases were randomly assigned to the training phase, and the remaining 30% to the test phase, the diagnostic ability was measured, and this procedure recurred for ten times.
Random forest classification
Random forest classification (RF) model was built using Java-based statistical processor (JASP) platform [34], and was composed of an ensemble 42 randomized decision trees. RF uses two powerful tools: The first is bagging, in which each decision tree in the forest is trained on a bootstrap sample of the training data (50% bootstrap samples in our analysis). The second tool is random feature selection, in which RF randomly selects subset of features for decision rules at each node (20% holdout test data in the current analysis). The cases not used for training [out-of-bag (OOB) samples] were used for cross-validation and optimization, with mean probability score per tree used for computing the model predictive ability.
Classification and regression tree
Classification and regression (CRT) decision tree model was built on SPSS 25 interface, using the CRT iterative classification method for automatic feature selection and predicting the target variable by splitting rules to classify the population into homogenous classes. The model used Gini impurity measure to test the gain of each split and automatically selection of continuous variable optimal cutoffs. Tenfold cross-validation was used for model testing and validation.
Statistical analysis
Data analysis was performed using SPSS version 25 (Armonk, NY) software [35] with two-sided significance level of α = 0.05. Descriptive statistics are presented using prevalence and percentage values for categorical variables, while continuous variables are presented with means and standard deviation, skewed distributed variables are presented by median and range. Group comparisons were tested using Student’s t test for continuous normally distributed variables, and the Mann–Whitney U test for non-parametric comparisons. Categorical comparisons were tested using the χ2 test or the Fisher’s exact test, as appropriate.
ROC analysis was used to evaluate the associations of different variables with critical COVID-19 infections by calculating the ROC AUC. Cutoffs for optimal prediction were selected using Youden index and variables performance parameters were computed, including sensitivity, specificity, positive predictive value (PPV), negative predictive value (NPV) and accuracy. Comparison of the prediction ability was performed based on the above measures and the balance accuracy measures, such as F1 score \(\left( {\frac{{2}}{{{\text{recall}}^{{^{{ - 1}} }} {\text{ } + \text{ precision}}^{{^{{ - 1}} }} }}} \right)\) and Matthews correlation coefficient (MCC) \(\left( {\sqrt {\frac{{\chi^{2} }}{n}} } \right)\).
Results
A total of 6995 patients were evaluated at Sheba Medical Center during the study period. Of those, 175 confirmed COVID-19 patients were hospitalized to COVID-19 designated departments, 13 patients were excluded due to tracheal intubation in the emergency ward or direct hospitalization in the ICU. Thus, 162 patients were included in the current analysis (Fig. 1), with a mean age at admission of 60.4 ± 16.3 years (range 21–95) and male gender predominance (n = 107, 66.0%) and with 84.0% comorbidities prevalence. The median length of stay was six days, after the exclusion of patients mechanically ventilated, who were still hospitalized at the end of the study period. Patient’s characteristics are depicted in (Table 1).
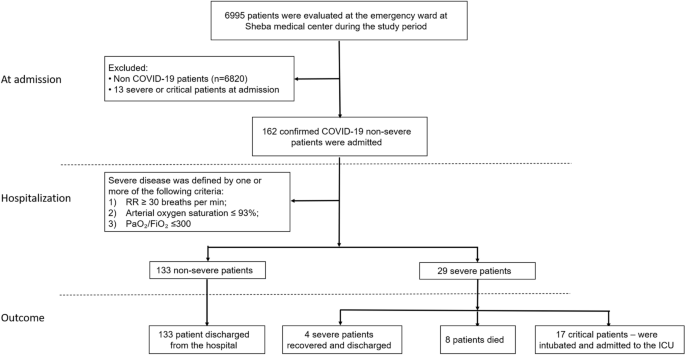
Patients flow chart for inclusion and outcome. RR, respiratory rate; PaO2 arterial oxygen partial pressure; FiO2 fraction of inspiration oxygen; ICU intensive care unit
Twenty-nine patients (17.9%) developed severe disease, including 25 (15.4%) patients that were classified as critical, 22 of them (13.6%) required mechanical ventilation during their hospital stay. Of the eight (4.9%) patients that died of COVID-19, five were mechanically ventilated due to respiratory failure. The median time for intubation or death among the critical COVID-19 group was six days (range 2–14).
Comparison between patients with critical vs. non-critical COVID-19
This comparison was conducted to examine the difference of risk factors that were tested at the time of severe diseases, whereas here, they are tested by their status at admission. In terms of demographic and baseline medical background, patients with critical vs. non-critical COVID-19 were more often diagnosed with chronic obstructive pulmonary disease (COPD, 12.0% vs. 1.5%, p = 0.027), had trend towards older age at diagnosis (65.5 ± 16.9 vs. 59.4 ± 16.0, p = 0.077), had more comorbidities (96.0% vs. 81.8%, p = 0.08) and comparable gender distribution (p = 0.25) and body mass index (p = 0.85).
Analysis of the initial evaluation in the emergency ward revealed several differences between patients that eventually developed vs. not-developed critical COVID-19: higher respiratory rate (23.6 ± 7.8 vs. 19.1 ± 4.9 per min, p = 0.003), lower room-air oxygen saturation (90.4 ± 4.8 vs. 94.9 ± 4.8 percent, p < 0.0001), higher white blood cells count (9.4 vs. 6.2 K/mcL, p = 0.025), absolute neutrophil counts (6.6 vs. 4.6 K/mcL, p = 0.024), C-reactive protein levels (CRP, 121.9 vs. 75.5 mg/L, p = 0.013), aspartate transferase levels (AST, 60.6 vs. 41.4 units/L, p = 0.002), lactate dehydrogenase levels (LDH levels, 436.6 vs. 327.3 units/L, p < 0.0001) and lower albumin levels (3.6 vs. 3.9, g/dL, p = 0.002), respectively (Table 2).
Single variables prediction ability for critical infections
When analyzing the diagnostic ability of each single parameter using ROC analysis, the best single predictor was oxygen saturation at ambient air, with AUC of 0.787 (p < 0.001), 93.5% cutoff was identified (Youden index) for classifying critical infection group with 80.0% sensitivity, 75.0% specificity, 37.0% positive predictive value (PPV), 95.3% negative predictive value (NPV) and 75.8% accuracy with F1 score of 0.51. Performance indices for all single variants are depicted in (Table 3).
Combining variables into the APACHE II weighted score yielded better performance indices than either of the other variables separately, with an AUC of 0.789, 68.0% sensitivity, 81.0% specificity, 39.5% PPV, 93.3% NPV and 79.0% accuracy, improving accuracy only by 3.2%. Other risk scores, such as the Sequential Organ Failure Assessment (SOFA) score and the National Early Warning Score 2 (NEWS2), that fell behind with AUC of 0.544 and 0.511, respectively.
ML models
To increase the prediction ability, we evaluated the predictive ability of various ML models. Artificial Neural Network model (ANN) had the advantage of tenfold cross-validation to increase its external validity, with limited sensitivity on the other hand, and indeed demonstrated accuracy improvement of 11.0% from the APACHE II score with sensitivity, specificity, PPV, NPV and accuracy of 59.0%, 96.3%, 74.6%, 92.8% and 90.5%, respectively, reaching ROC AUC of 0.92.
Random Forest (RF) classification achieved accuracy improvement of 12.0% from the APACHE II score with sensitivity, specificity, PPV, NPV and accuracy of 75.0%, 95.8%, 75.0%, 95.8% and 92.9%, respectively, with a ROC AUC of 0.93.
Finally, Classification and Regression Tree (CRT) model reached sensitivity, specificity, PPV, NPV and accuracy of 88.0%, 92.7%, 68.8%, 97.7% and 92.0%, respectively, with ROC AUC of 0.90. Model comparison is presented in Fig. 2a.

Prediction abilities and features of the different models. Radar plot of predication abilities for critical patients (a) and feature selection output—importance to the model in percentage (b), ANN artificial neural network; AUC area under the curve; PPV positive predictive value; NPV negative predictive value, WBC white blood cell; LDH lactate dehydrogenase; AST aspartate transaminase; CRP C-reactive protein; HCT hematocrit
Since the various models used automatic feature selection, delving into the models enabled assessment of variables importance. Based on the RFC model, the contributory variables were APACHE II score, white blood cell count, the time from symptoms to admission and oxygen saturation, while in the ANN model, blood lymphocyte count was more contributory than oxygen saturation (Fig. 2b).
Discussion
In the current analysis, we aimed to assess the utility of machine-learning algorithms for predicting outcome of patients with non-critical COVID-19 based on clinical parameters on admission. We found clear difference between patients who developed later critical vs. non-critical COVID-19, mainly in vital signs (respiratory rate and room-air oxygen saturation) and inflammation markers (blood WBC, neutrophil counts and CRP) and in the APACHE II score that combines these makers. However, our analysis demonstrates that machine-learning algorithms amplify the diagnostic accuracy and the discriminative efficacy of these markers, maximizing their use for predicting the risk of patients with COVID-19 to develop severe disease during the disease course.
The novelty of our study lies in the fact that these different trends were already available at admission, 6 days (median) before the patients developed severe COVID-19, enabling early-on identification of patients at risk, and adjusting their management and in-hospital allocation. To accurately identify predictors for disease outcome in patients with COVID-19, we assessed clinical, hematological and biochemical parameters at admission and not at the advanced/severe phase of the disease and excluded patients with severe disease at presentation. Hence, if validated, these factors could be utilized for predicting the risk for patients’ clinical deterioration during their hospital stay and may assist in the decision-making of the triaging physicians.
Our methodology differs our analysis from previous studies [36,37,38] and may explain the absence of platelet count [15] or d-dimer levels [16] as predictors, as these may only develop in a latter disease stage. In addition, our results differ from previous reports in the association of age and hypertension with severe COVID-19. This gap may stem from the selection of patients that were admitted rather than population-based analysis or by more accurate delineation of predictors for COVID-19 using machine-learning analysis.
Machine-learning models provide the advantage of learning non-linear relations between the input and the output, allowing inclusion of heterogeneous variable types in one model, which is not feasible in univariate or multivariable analysis or risk-score prediction models. The poor-outcome predictors suggested for COVID-19 patients include age, comorbidity and different laboratory abnormalities, when testing a recent death prediction ML model [39], based on LDH, CRP and lymphocytes, that model fall behind with death prediction accuracy of 73.8% and critical prediction accuracy of only 67.9%. Our study demonstrates the superiority of ML models that provided improved prediction, high NPV and high accuracy, compared to those currently available.
In its peak, the COVID emergency department inquiries go beyond the ICU capacity, forcing us to seek for the best tool identifying the high-risk patients. ML models outperformed the previously presented methods and enable us with a “state-of-the-art” tool to utilize during emergency department triage to anticipate disease progression for the best placement on the one hand, and perhaps a more aggressive treatment regimen on the other hand.
A learning model is only going to be as good as the input data inserted in the model. Hence, other reliable factors need to be tested to maximize the prediction ability of the models. Although the models were built using different validation processes, such as nested data split and tenfold cross-validation, to increase its validity, the model needs to undergo prospective validation process to verify the results before application of the model.
This study has some limitations. First, its retrospective single-center methodology decreases its external validity, especially considering the high COVID-19 variability between different countries and populations. Second, this study has small number of patients with severe disease, challenging the statistical power. Third, the AI models’ diagnostic performance was tested vs. best univariate/risk-score predictors, as no other baseline prediction tools were previously reported. Hence, prospective validation is required for enabling the clinical implementation of our results.
In conclusion, artificial intelligence decision-supporting tools may serve as the “silver bullet” in the triage of confirmed COVID-19 patients, to optimize patients' allocation and personalize the surveillance and care based on the different disease course predicted for each patient. Further validation is required to enable clinical implementation of our findings.
References
Cucinotta D, Vanelli M (2020) WHO declares COVID-19 a pandemic. Acta Biomed 91:157–160. https://doi.org/10.23750/abm.v91i1.9397
Huang C, Wang Y, Li X et al (2020) Clinical features of patients infected with 2019 novel coronavirus in Wuhan, China. Lancet 395:497–506
Wang D, Hu B, Hu C et al (2020) Clinical characteristics of 138 hospitalized patients with 2019 novel coronavirus–infected pneumonia in Wuhan, China. JAMA 323:1061–1069
Chen N, Zhou M, Dong X et al (2020) Epidemiological and clinical characteristics of 99 cases of 2019 novel coronavirus pneumonia in Wuhan, China: a descriptive study. Lancet 395:507–513
Lapostolle F, Schneider E, Vianu I et al (2020) Clinical features of 1487 COVID-19 patients with outpatient management in the Greater Paris: the COVID-call study. Intern Emerg Med. https://doi.org/10.1007/s11739-020-02379-z
Armocida B, Formenti B, Ussai S et al (2020) The Italian health system and the COVID-19 challenge. Lancet Public Heal 5:e253
Ji Y, Ma Z, Peppelenbosch MP, Pan Q (2020) Potential association between COVID-19 mortality and health-care resource availability. Lancet Glob Heal 8:e480
Ranney ML, Griffeth V, Jha AK (2020) Critical supply shortages - The need for ventilators and personal protective equipment during the Covid-19 pandemic. N Engl J Med 382:E41
Erika P, Andrea V, Grazia Cillis M et al (2020) Triage decision-making at the time of COVID-19 infection: the Piacenza strategy. Intern Emerg Med. https://doi.org/10.1007/s11739-020-02350-y
Truog RD, Mitchell C, Daley GQ (2020) The toughest triage — allocating ventilators in a pandemic. N Engl J Med 382:1973–1975. https://doi.org/10.1056/NEJMp2005689
Wang X, Wang M-J, Jiang X-B et al (2020) Letter: strategies for prevention and control of 2019 novel coronavirus infection among medical staff. Neurosurgery 87:E57–E62. https://doi.org/10.1093/neuros/nyaa117
Verity R, Okell LC, Dorigatti I et al (2020) Estimates of the severity of coronavirus disease 2019: a model-based analysis. Lancet Infect Dis 20:669–677. https://doi.org/10.1016/S1473-3099(20)30243-7
Chow N, Fleming-Dutra K, Gierke R et al (2020) Preliminary estimates of the prevalence of selected underlying health conditions among patients with coronavirus disease 2019 - United States, February 12-March 28, 2020. Morb Mortal Wkly Rep 69:382–386
Jordan RE, Adab P, Cheng KK (2020) Covid-19: Risk factors for severe disease and death. BMJ 1:368
Lippi G, Plebani M, Henry BM (2020) Thrombocytopenia is associated with severe coronavirus disease 2019 (COVID-19) infections: a meta-analysis. Clin Chim Acta 506:145–148. https://doi.org/10.1016/j.cca.2020.03.022
Tang N, Li D, Wang X, Sun Z (2020) Abnormal coagulation parameters are associated with poor prognosis in patients with novel coronavirus pneumonia. J Thromb Haemost 18:844–847. https://doi.org/10.1111/jth.14768
Landi A, De Servi S (2020) The burden of thrombotic complications in critically ill patients with COVID-19: charting the uncharted. Intern Emerg Med 1:20–87. https://doi.org/10.1007/s11739-020-02393-1
Zhang C, Shi L, Wang FS (2020) Liver injury in COVID-19: management and challenges. Lancet Gastroenterol Hepatol 5:428–430
Lenti MV, Borrelli de Andreis F, Pellegrino I et al (2020) Impact of COVID-19 on liver function: results from an internal medicine unit in Northern Italy. Intern Emerg Med 1:9. https://doi.org/10.1007/s11739-020-02425-w
Qin C, Zhou L, Hu Z et al (2020) Dysregulation of immune response in patients with coronavirus 2019 (COVID-19) in Wuhan China. Clin Infect Dis. https://doi.org/10.1093/cid/ciaa248
McGonagle D, Sharif K, O’Regan A, Bridgewood C (2020) Interleukin-6 use in COVID-19 pneumonia related macrophage activation syndrome. Autoimmun Rev 10:2537
Zhou F, Yu T, Du R et al (2020) Clinical course and risk factors for mortality of adult inpatients with COVID-19 in Wuhan, China: a retrospective cohort study. Lancet 395:1054–1062. https://doi.org/10.1016/S0140-6736(20)30566-3
Kourou K, Exarchos TP, Exarchos KP et al (2015) Machine learning applications in cancer prognosis and prediction. Comput Struct Biotechnol J 13:8–17. https://doi.org/10.1016/j.csbj.2014.11.005
Pan L, Liu G, Lin F et al (2017) Machine learning applications for prediction of relapse in childhood acute lymphoblastic leukemia. Sci Rep 7:45. https://doi.org/10.1038/s41598-017-07408-0
Vabalas A, Gowen E, Poliakoff E, Casson AJ (2019) Machine learning algorithm validation with a limited sample size. PLoS ONE 14:45–94. https://doi.org/10.1371/journal.pone.0224365
Passos IC, Mwangi B, Kapczinski F (2016) Big data analytics and machine learning: 2015 and beyond. Lancet Psyc 3:13–15. https://doi.org/10.1016/S2215-0366(15)00549-0
Lee H-C, Yoon S, Yang S-M et al (2018) Prediction of acute kidney injury after liver transplantation: machine learning approaches vs. logistic regression model. J Clin Med 7:428. https://doi.org/10.3390/jcm7110428
Yang Z, Zeng Z, Wang K et al (2020) Modified SEIR and AI prediction of the epidemics trend of COVID-19 in China under public health interventions. J Thorac Dis 12:165–174. https://doi.org/10.21037/jtd.2020.02.64
Chassagnon G, Vakalopoulou M, Battistella E et al (2020) AI-Driven CT-based quantification, staging and short-term outcome prediction of COVID-19 pneumonia. arXiv Prepr 20:412–852
Tang N, Bai H, Chen X et al (2020) Anticoagulant treatment is associated with decreased mortality in severe coronavirus disease 2019 patients with coagulopathy. J Thromb Haemost. https://doi.org/10.1111/jth.14817
World Health Organization (2019) Mission China Joint (2020) Report of the WHO-China Joint Mission on Coronavirus Disease 2019 (COVID-19). WHO-China Jt Mission Coronavirus Dis 2019:16–24
Hagan M, Demuth H (2014) Neural Network Design. Neural Networks Softcomput Framew 1:1012
Breiman L (2001) Random forests. Mach Learn 45:5–32. https://doi.org/10.1023/A:1010933404324
Nakano J, Fujiwara T, Yamamoto Y, Kobayashi I (2000) A statistical package based on Pnuts BT - COMPSTAT. In: van der Heijden PGM (ed) Bethlehem JG. Physica-Verlag HD, Heidelberg, pp 361–366
SPSS (2017) IBM SPSS Stat Wind Version 250 Armonk. IBM Corp, NY
Chen T, Wu D, Chen H et al (2020) Clinical characteristics of 113 deceased patients with coronavirus disease 2019: retrospective study. BMJ 4:368. https://doi.org/10.1136/bmj.m1091
Shi Y, Yu X, Zhao H et al (2020) Host susceptibility to severe COVID-19 and establishment of a host risk score: findings of 487 cases outside Wuhan. Crit Care 24:10. https://doi.org/10.1186/s13054-020-2833-7
Li X, Xu S, Yu M et al (2020) Risk factors for severity and mortality in adult COVID-19 inpatients in Wuhan. J Allergy Clin Immunol. https://doi.org/10.1016/j.jaci.2020.04.006
Yan L, Zhang H-T, Goncalves J et al (2020) An interpretable mortality prediction model for COVID-19 patients. Nat Mach Intell 2:283–288. https://doi.org/10.1038/s42256-020-0180-7
Funding
This research was funded in part by a grant received by Dr Amit Tirosh from the Ministry of Science and Technology, The State of Israel.
Author information
Authors and Affiliations
Corresponding author
Ethics declarations
Conflict of interest
The authors have no conflicts of interest to declare.
Ethics approval
This study was approved by the Institutional review board.
Informed consent
No informed consent is required for this type of study.
Additional information
Publisher's Note
Springer Nature remains neutral with regard to jurisdictional claims in published maps and institutional affiliations.
Rights and permissions
About this article

Cite this article
Assaf, D., Gutman, Y., Neuman, Y. et al. Utilization of machine-learning models to accurately predict the risk for critical COVID-19. Intern Emerg Med 15, 1435–1443 (2020). https://doi.org/10.1007/s11739-020-02475-0
Received:
Accepted:
Published:
Issue Date:
DOI: https://doi.org/10.1007/s11739-020-02475-0