
Abstract
The ability to perform well in the presence of noise is an important consideration when evaluating the effectiveness of a collective decision-making framework. Any system deployed for real-world applications will have to perform well in complex and uncertain environments, and a component of this is the limited reliability and accuracy of evidence sources. In particular, in swarm robotics there is an emphasis on small and inexpensive robots which are often equipped with low-cost sensors more prone to suffer from noisy readings. This paper presents an exploratory investigation into the robustness of a negative updating approach to the best-of-n problem which utilises negative feedback from direct pairwise comparison of options and opinion pooling. A site selection task is conducted with a small-scale swarm of five e-puck robots choosing between \(n=7\) options in a semi-virtual environment with varying levels of sensor noise. Simulation experiments are then used to investigate the scalability of the approach. We now vary the swarm size and observe the behaviour as the number of options n increases for different error levels with different pooling regimes. Preliminary results suggest that the approach is robust to noise in the form of noisy sensor readings for even small populations by supporting self-correction within the population.
1 Introduction
The ability to make collective decisions in a decentralised manner is an essential requirement for an autonomous robot swarm (Hamann 2018; Valentini 2017). This paper will focus on the discrete consensus achievement problem as opposed to other collective decision problems such as task allocation, collective motion or aggregation. Discrete consensus achievement is when the swarm needs to make a choice between options which are finite and countable and the category includes applications such as site selection (Winfield 2009; Cardona and Calderon 2019; Peleg 2005; Kakalis and Ventikos 2008) or shortest path selection (Szymanski et al. 2006). The underlying structures of these problems can be abstracted to the class of best-of-n decision problems where the swarm has to choose between n options each with an associated quality which is received as feedback by the members of the swarm. Valentini et al. (2017) provide an excellent survey on the best-of-n, and more details on discrete consensus achievement are given in Valentini (2017).
Valentini et al. (2017) note that little research has addressed the best-of-n problem for \(n>2\), despite there being a clear practical need for effective distributed decision making beyond the binary options case. In recent years, there has been a noticeable effort to remedy this and Reina et al. (2017) present a generalised model of site selection in honeybees extended to n nests. However, they observe that increasing the number of inferior options results in an increased probability of making the wrong decisions. In particular, they find that this effect is most noticeable when the ratio between the quality of inferior options and the best option is high. Crosscombe and Lawry (2019) further support this finding, noting that increasing similarity between quality values resulted in decreasing performance. Both of these studies used positive feedback in the form of recruitment rates which were proportional to the raw quality values as the main force driving consensus. With this in mind, we take an approach where agents directly compare option qualities to avoid any proportionality effects. This direct comparison allows the agents to update their opinions negatively, i.e. if an option is not the local best, then it cannot be the global best. Talamali et al. (2019) use direct comparison and cross-inhibition to tackle up to \(n=12\). Negative updating with epistemic sets is also used by Lawry et al. (2019) to solve best-of-n for much larger values of n and varying population sizes. Font Llenas et al. (2018) conduct a quality-sensitive foraging experiment where 50 kilobot robots forage between four sites. To the best of the authors’ knowledge, our experiments are the first to be conducted for such a large number of options comparative to population size in hardware.
An important consideration when evaluating the effectiveness of a collective decision-making framework is its ability to perform well in the presence of noise. Any system deployed for real-world applications will have to perform well in complex and uncertain environments. A component of this will be the limited reliability and accuracy of evidence sources. For example, many collective decision-making frameworks in the swarm robotics literature rely upon communications between peers and data received directly from sensors (Brambilla et al. 2013; Hamann 2018) and it is very difficult (if not impossible) for these evidence sources to be totally free from noise. This is particularly true in swarm robotics where the emphasis is on small and inexpensive robots such as the e-puck (Mondada et al. 2009) and the Kilobot (Rubenstein et al. 2012) which are often equipped with low cost sensors more prone to suffer from noisy readings.
A central theme in studies looking at the impact of noise in collective decision-making systems is the speed–accuracy trade-off (Douven 2019; Marshall et al. 2006; Valentini 2017). As Valentini (2017) notes, the impact of noisy sensor data can be felt twofold, affecting both the time needed by the system to reach a consensus and the accuracy of that resulting consensus. If the system converges to a consensus too quickly, it is in danger of coming to a decision on erroneous evidence. On the other hand, if the system is too distrusting of the evidence it receives, then it does not fully exploit the information it learns from an evidence source. Thus, in order to reach a consensus, this necessitates either the gathering of more evidence (taking more time) or a change to the communication network (Mateo et al. 2019; Rausch et al. 2019). From the perspective of social epistemology, the results in Douven and Kelp (2011) suggest that one way to improve this robustness for collective decision making is to use an updating procedure which takes into account both the beliefs of peers and direct evidence from the environment. Indeed, Talamali et al. (2019) show that when noise is present, blind trust in direct evidence and the opinions of others (the so-called direct comparison strategy) leads to a quick convergence but poor accuracy. Their results suggest that a probabilistic approach with negative feedback (also called cross-inhibition) works better in noisy environments than complete trust in direct evidence. Crosscombe and Lawry (2019) also show that using a combination of updating from direct evidence sources and combining of beliefs between agents leads to more accurate consensus than direct evidence only. Lawry et al. (2019) note that belief pooling can allow the population to correct any errors obtained from updating from a noisy evidence source.
The main contributions of this paper are as follows: The negative updating combined with the opinion pooling model introduced by us previously in Lee et al. (2018b) is validated in hardware with real robot experiments. The approach is then extended to hardware with (virtual) noisy sensors where we found that the model allows for self-correction within the population. We also present simulation experiment results which suggest that the approach is robust across different levels of error and that a combined updating procedure performs better in terms of accuracy than updating on evidence alone.
The paper is organised as follows: Section 2 outlines the probabilistic framework and evidential updating operators that will be used. Section 3 then presents robot experiments further testing the applicability of our approach to a site selection with noisy sensors. Section 4 presents discrete time simulation experiments investigating the scalability of the approach as the number of options n increases for different error levels. It also examines whether complete or partial pooling leads to better performance. Finally, Sect. 5 provides some conclusions and further work.
2 Best-of-n with opinion pooling and negative updating
Best-of-n is a popular class of collective decision making and learning problems often used in swarm robotics (Valentini et al. 2017). The aim is for the population of agents to achieve consensus on the most desirable option from n distinct possibilities using only local interactions and feedback. In the following work, this problem will be conceptualised as a site selection task, wherein the agents are faced with n possible sites and need to collectively agree on the most desirable site only by communicating with each other and using sensor data to judge the quality of the sites.
We formulate the problem within a probabilistic framework using an opinion-based approach from Wessnitzer and Melhuish (2003) as introduced in previous work (Lee et al. 2018a). Suppose we have a set of n exclusive and exhaustive hypotheses \(H = \{{\mathcal {H}}_m: m=1, \dots , n\}\) where \({\mathcal {H}}_m\) denotes the claim “option m is the best” and each option m has an associated quality value \(\rho _m\) within the interval [0, 1]. Let \(A=\{A_1, \dots , A_N\}\) denote a population of N agents, and each agent \(A_i\) represents their opinion that the hypothesis \({\mathcal {H}}_m\) is true as the probability vector \({\mathbf {x}}_i\) such that \(P_{A_i}({\mathcal {H}}_m)=x_{im}\) for \(m=1, \dots , n\) with \(\sum _{m=1}^n x_{im} = 1\). Agents pool their opinions using the product operator extended to multiple hypotheses given in Definition 1.
Definition 1
(Multi-hypothesis product operator (MProdOp) (Dietrich and List 2016)) Suppose we have a pool of k agents, \(A_1,\dots , A_k\), then MProdOp is defined as the pooling operator \(c: \left( \mathbb {P}^{n}\right) ^k \rightarrow \mathbb {P}^n\), where \(\mathbb {P}^n = \{{\mathbf {p}} \in [0, 1]^n : \sum _{i=1}^n p_i =1\}\):
Note that \(\bigodot\) is the Hadamard product and \(\left\| - \right\| _1\) is the \(L_1\) norm. For any two vectors, \({\mathbf {y}}\) and \({\mathbf {z}}\), the Hadamard product is defined as \(\left( {\mathbf {y}} \odot {\mathbf {z}}\right) _i = y_iz_i\) \(\forall i\).
The product operator is a simplified special case of the log-linear operatorFootnote 1 and has a wide range of applications including classifier combination (Hinton 1999, 2002), image processing (Roth and Black 2005), natural language processing (Osborne and Baldridge 2004), management sciences (Bordley 1982) and computational music modelling (Pearce et al. 2004). It is known to be evidence preserving, where the result after updating on a single piece of evidence is the same if the updating takes place before or after pooling (Dietrich and List 2016).
In addition to pooling their opinions with peers, agents also receive evidence directly from the environment. We assume that a single piece of evidence is the result of a direct comparison between two options. By directly comparing the options, the agent is then able to update their opinion with the knowledge on which option is definitely not the best, i.e. the one with a lower quality. To clarify, suppose that an agent is comparing options i and j with qualities \(\rho _i\) and \(\rho _j,\) respectively. Further assume without loss of generality that \(\rho _i > \rho _j\). Then, the agent can update using Bayes’ theorem on the evidence that option j is not the best option. In other words, the agent updates their prior on the evidence \(E=H-\{{\mathcal {H}}_j\}\), the complement of the hypothesis \({\mathcal {H}}_j\) with respect to H, using the evidential update rule in Definition 2.
Definition 2
(Negative evidential Updating) Suppose an agent has some concept of the reliability of the evidence, \(\varvec{\delta }_E \in [0,1]^n\), where \(\delta _{E, m}\) is the likelihood that the evidence E is reliable (true) if \({\mathcal {H}}_m\) represents the true state of the world, i.e. \(\delta _{E, m}=P(E|{\mathcal {H}}_m)\). Upon receiving some subset of hypotheses as evidence \(E \subset {\mathcal {H}}\), agent A would update their belief,
This form of negative updating aids the learning process by ruling out certain options and has already been applied effectively in swarm robotics in Lee et al. (2018b) to a site selection task where it was shown to be highly scalable with respect to n with relatively small population sizes. Lawry et al. (2019) also apply negative evidential updating to the best-of-n decision problem using an epistemic sets framework. Agent-based simulation experiment results show their approach is also scalable to large state spaces, even with small populations, and that it is also robust to noise.
3 Robot experiments
This section describes two sets of experiments conducted with a small-scale swarm of five e-puck robots attempting to solve the best-of-n problem using the negative updating method as outlined in Sect. 2. These experiments take the form of a site selection task, where the robots must choose the best from n possible sites. Each site i has an associated quality \(\rho _i\) such that if \(i<j\) then \(\rho _i>\rho _j\) with one ‘best’ site. The swarm is tasked with learning which site is the ‘best’ through pairwise comparisons between site qualities and opinion pooling using MProdOp. When setting the number of options n, a balance is needed between testing performance for larger values of n and the battery limitations of the e-pucks. For these experiments, we fix \(n=7\) as this problem is deemed completable in a reasonable time frame while also satisfying \(n>N\).
Our previous simulation experiments in Lee et al. (2018b) suggested that the negative updating method has potential as a method for solving the best-of-n decision problem in swarm robotics applications. However, we highlight three considerations to be reflected in our experimental design choices:
-
Sites were placed equidistant on a 1.5-m-radius disc surrounding the nest. This results in a symmetric cost (in terms of travel time) for visiting any individual site and returning to the nest; however, the cost for comparing any two sites is not symmetric. This meant that comparisons between some sites were biased over others and suggests a change in site selection method is needed.
-
In order to pool, robots would wait at the nest for a set amount of time and pool with any other robots returning to the nest. Having no constraints on pooling size led to a low average pooling size for runs (two out of nine possible neighbours). We found that smaller pools were inefficient as the robots incur the cost of returning to the nest site but receive a low amount of information and that runs with higher average pooling sizes tended to perform better.
-
Once a robot had converged to an opinion, it would cease both exploration and aggregation. We found that this led to very polarised performance as some robots converged upon a ‘best’ site very quickly, meaning the others continued without the benefits of being able to pool with their finished peers. In other words, the information gained was lost before it could benefit the other robots. Furthermore, a lack of constraints on the pooling size occasionally led to very large pools (five or six robots). While larger pools led to faster convergence for most of the population, combined with the cessation of aggregation by these converged robots, it isolated the remaining robots causing a large disparity in performance across the swarm (up to five iterations difference between swarm members).
3.1 Without noise
3.1.1 Experimental set-up
All experiments were conducted using e-pucks which had been adapted with a Linux extension board developed at the Bristol Robotics Laboratory (Liu and Winfield 2011) and an adapted version of the experimental set-up described by Castello et al. (2016), Pitonakova et al. (2018) and Blum et al. (2018). The arena was approximately \(2 \times 1.5\)m large with seven sites spaced around a central ‘nest’ site as can be seen in Fig. 1.
The experimental environment was semi-virtual—the robots interacted physically with each other and the arena, but received information about their global position and sensory feedback via an external server. Each robot’s position was captured through the camera-based tracking system VICON MX (by Vicon Motion Systems Ltd) and fed to the server’s ROS interface. Robots communicated with the server using an on-board Wi-Fi module and could then query a ROS topic for their global position, which they then used to navigate to their target location. If a robot was within a 15-cm radius of a site, they would query a ROS topic dedicated to that site for a virtual sensor reading, i.e. the quality for that site. Virtual sensing was chosen, as opposed to using the e-pucks’ on-board cameras, to enforce a lack of sensor noise in these experiments (the effects of noisy sensing is explored in the next section).

The arena set-up for run 0 showing the sites 0 to 6 and the robots’ initial positions around the central ‘nest’ location. Sites are drawn on the floor for visualisation purposes only. Both sites and the nest had a radius of 0.15m. The origin is at the centre of the nest site
The server also facilitated robot-to-robot communications by acting as a communications hub. If a robot was within a 15-cm radius of the nest, they would simultaneously broadcast their current belief (as a vector of n probabilities) to the server while also querying for the beliefs of any other agents in the vicinity. Each robot communication was also accompanied by that robot’s identifying number so that when pooling the robots could ignore their own communications or those of neighbours already received. The authors note that explicit communication is used here, but more work is needed to judge the feasibility of explicit communication in real-world environments where direct wireless communication (such as radio, Bluetooth or Wi-Fi) may be costly, unstable or even impossible to implement. Approaches which use implicit communication, such as neighbour observation (Garnier et al. 2009) or pheromone trails (Font Llenas et al. 2018), are becoming increasingly popular in swarm robotics as a robust alternative; however, it is not suitable for the approach explored in this paper. Figure 2 shows the flow of data between the different parts of the architecture.

Flow chart showing the flow of data within the experimental set-up for the robot position, virtual sensing and robot communications. All robots receive their orientation, sensor data and relevant communications data from the server (note some arrows have been omitted for clarity). All robots are also able to communicate with each other virtually via the server. For example, Epuck 3 sends its communications data to the server which then sends it to both Epuck 4 and Epuck 5 and so allowing them to virtually communicate. Inspired by Blum et al. (2018)
The experiment was run eleven times and lasted until the entire swarm had converged upon a belief in one of the hypotheses greater than 0.98. For each run, the robots were initialised by manually placing them at random around the nest. Care was taken to ensure an even distribution of the robots around the nest to avoid any initial spatial clumping to reduce lag caused at the beginning of the experiment from collisions. Each robot was controlled by a finite state machine as outlined in Fig. 3 which comprised two main behavioural states, exploration and aggregation. In the exploration state, the robot picks two sites to visit with a weighted random probability based on its current opinion, visit those sites taking a light sensor reading connoting the site’s quality and then negatively updates on the site with the lowest light sensor reading. It then transfers to the aggregation state where it first returns to the nest site and then concurrently broadcasts its opinion and receives opinions from any broadcasting neighbours. Once it has received opinions from k neighbours, it updates its opinion as the resulting pooled opinion. The robot then checks whether its opinion has converged, i.e. its opinion of one of the options is equal to 1. If so, the robot stops, otherwise it transfers back to the exploration state. The robots also implemented a form of Braitenberg obstacle avoidance where their steering is proportional to proximity sensor readings as presented in Braitenberg (1986).
During the experiment, robots would log their beliefs every ten control cycles, i.e. every ten cycles of their internal finite state machine, with each control cycle lasting approximately ten seconds. They also logged all site choices, virtual sensor readings and communications sent and receivedFootnote 2. The code used for the experiments is an adaptation of that created and added to by many members of the Bristol Robotics Lab’s Swarm Robotics teamFootnote 3. All experiments were filmed, and videos are available in Online Resource 2.

Overview of the two behavioural states the robots can be in. In the exploration state, the robot picks two sites to visit with a weighted random probability based on its current opinion, visit those sites taking a light sensor reading connoting the site’s quality and then negatively updates on the site with the lowest light sensor reading. It then transfers to the aggregation state where it first returns to the nest site and then concurrently broadcasts its opinion and receives opinions from any broadcasting neighbours. Once it has received opinions from k neighbours, it updates its opinion as the resulting pooled opinion. The robot then checks whether its opinion has converged, i.e. its opinion of one of the options is equal to 1. If so, the robot stops; otherwise, it transfers back to the exploration state
The following sections outline some experimental design choices made after reflections from previous work in Lee et al. (2018b):
3.1.2 Site selection method
In the robot simulation experiments conducted in Lee et al. (2018a), the sites were placed equidistant on a 1.5-m-radius disc surrounding the nest to ensure a symmetric environment. This results in a symmetric cost (in terms of travel time) for visiting any individual site and returning to the nest; however, the cost for comparing any two sites is not symmetric. For example, if we consider the arena as in Fig. 1, then clearly comparing sites 3 and 6 (which are across the arena from each other) will occur a greater travel cost than comparing sites 3 and 4 (which are neighbours). We note that this is a valid modelling assumption as the robots gain a much greater wealth of information by being able to compare sites from anywhere in the environment and so should incur some additional cost for this. However, when trying to implement this on the actual e-pucks, this disparity in comparison pairing cost becomes far more pronounced. The e-pucks use proximity sensors and simplistic obstacle avoidance to avoid bumping into each other. This works very well in simulation, but less so in the real experiments mostly due to noise in the proximity sensors and meant that the robots would regularly collide when crossing the arena, greatly increasing travel time costs. This time increases, particularly time spent travelling, had a large impact on the robots’ battery life. Thus, the robots’ method for selecting sites for comparison was altered to mitigate these travel time costs.
The first site is chosen using a weighted random choice from the robot’s opinions, i.e. the robot is more likely to choose a site it believes is likely to be the best site. The second site is then chosen at random from the two neighbouring sites. For example, taking the environment as shown in Fig. 1, if the result of the weighted random choice was site 3, then there would be a 50:50 chance that the comparison site would be either site 2 or site 4. If both of a site’s neighbouring sites have already been eliminated, the robot then chooses a comparison site at random from the remaining non-eliminated sites. Also, the robots are less likely to be travelling from one side of the arena to the other, leading to fewer collisions and less time spent travelling. This also seems a more realistic approach to site selection, as the system is now better able to exploit the fact that each individual robot is exploring a different part of the environment. It could be argued that the site locations should be distributed randomly as this would be more realistic. However, placing them equidistant around the nest ensures that no individual site is biased for or against by travel cost.
Restricting the site selection to only neighbouring sites means that the ordering of the site qualities becomes much more important. If sites were fixed in a sequential order, then every site comparison would result in the elimination of one of the sites. However, this guaranteed success means that the robots would all receive identical amounts of information each site comparison. Instead, we want to test the system when some robots are more successful than other. Thus, we conducted an initial control run with the sequential ordering to observe this behaviour. Then, another ten runs for which the order was randomised, as can be seen in Table 1, meaning that in some comparisons no site can be eliminated. This was due to different runs having a different number of local maxima, i.e. sites which cannot be eliminated through comparisons with neighbouring sites, and we hypothesise that system performance will be better on runs with fewer local maxima. For example, run 0 has only the single global maximum as site 0 is the only site which has the greatest quality when compared with both of its neighbouring sites. On the other hand, run 1 has a local maximum at site 1 as, when compared to both of its neighbouring sites it will have the greatest quality. Further, it will only be identified as not the best site when compared to site 0, which is not a neighbouring site.
3.1.3 Pooling size
As discussed above, a lack of constraints on pooling size caused issues in Lee et al. (2018b) and so pooling size is restricted to \(k=3\) in these experiments. To enforce this, a robot will stop querying for new communication data from the server once it has received the beliefs of \((k-1)=2\) distinct neighbours. If there are more than two neighbours at the nest, then this will mean the robot will not pool with all neighbours present. If there are less than two neighbours at the nest, the robot will wait at the nest for more to arrive. This also means that any two robots in the nest site at the same time are not guaranteed to have the same pool of neighbours. Also, this pooling is not reciprocal and so even if robot i pools using the belief of robot j this does not mean that robot j will pool using the belief of robot i.
At first \(k=3\) might seem a low pooling size; however, we see in the literature that full connectivity is not always optimal. Mateo et al. (2019) find that the optimal network topology (or pooling size) depends on the frequency of the driving signal. Also, higher pooling sizes can become impractical in more realistic scenarios, as noted by Rausch et al. (2019). In our experiments, despite the symmetrical nature of the environment, there will still be large variability in robot travel time when seeking evidence and so some robots could have long waiting times at the nest. This coupled with the chance of redundancy when pooling, meaning robots could waste time waiting with no new information to be gained, motivates smaller pooling sizes allowing the system to be more reactive. Further, higher pooling sizes causes spatial aggregation leading to more chances for robot-to-robot collisions. As the robots only employ very simplistic obstacle avoidance, these additional collisions can cause lengthy delays. Finally, higher pooling sizes require individual robots to knowingly communicate with a larger proportion of the population before continuing; however, as noted above the communications system is not reliable enough for this. As such, we opted for a pooling size of \(k=3\) as a trade-off between the improved performance of higher pooling sizes and the impracticalities faced as pooling size increases.
3.1.4 Continued opinion broadcasting
We implement continued opinion broadcasting, that is once a robot has converged to a ‘best’ site (i.e. \(x_{im} > 0.98\) for some robot i and hypothesis \({\mathcal {H}}_m\)), it then remains at the nest broadcasting its opinion to other robots. In other words, it ceases exploration but continues as a passive member in aggregation. This means that the information the robot has gained is not lost. The robot is instead likely to be a member of all future pools leading to all remaining undecided robots to converge to the same opinion and so quickening convergence. The authors sound a note of caution that while this works well in an environment with no sensory noise, and so final opinions can be trusted, in the presence of sensory noise or dynamic environments this behaviour could be very detrimental to performance.
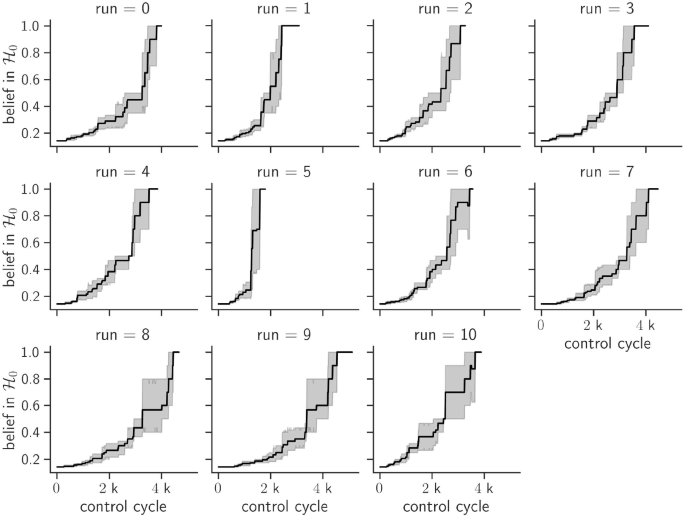
Plot showing the mean and variance of the population belief in \({\mathcal {H}}_0\), i.e. the best option is option 0, changing over time for each of the eleven runs. Each control cycle is approximately \(1/10\) seconds
3.1.5 Results
Figure 4 shows that for all runs the swarm was successful with respect to the first two key challenges; all robots reached consensus on a single hypothesis and that hypothesis was the true state of the world. In particular, the readers’ attention is drawn to the results for run 1 and run 5 which performed particularly well compared to the other runs. This is to be expected for run 5 as the ordering means there is only a global maximum and no local maxima. However, this is surprising for run 1 as it did have a local maximum yet performs better than runs with similar set-ups.
3.1.6 Time needed to reach consensus
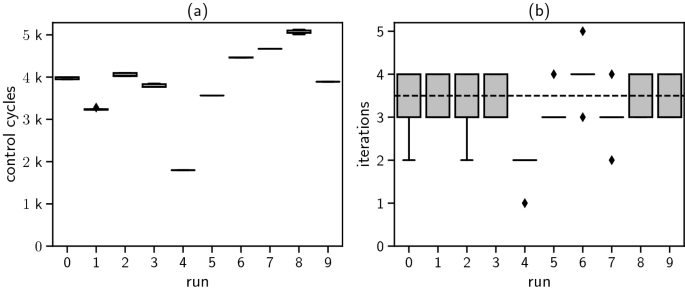
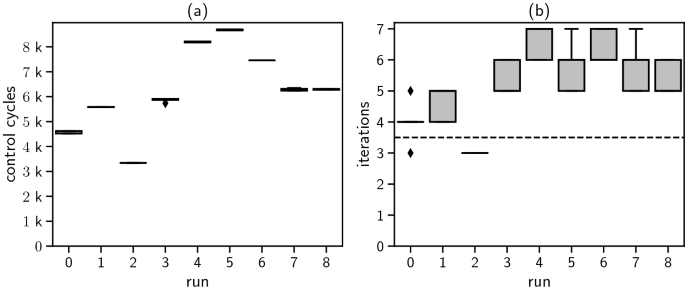
Box and whisker plots showing the spread of time taken to reach a consensus by the population of five robots for each of the eleven runs, where a shows the number of control cycles (\(\sim 1/10\) s) and b shows the number of iterations. Each box shows the median, lower (25th) and upper (75th) quartiles, the whiskers gives the minimum and maximum and the points show outliers for the five robots. In b, the dashed line at \(y=3.5\) shows the number of iterations \({\hat{t}}\) necessary for a robot to sample every option
For these experiments, the time taken for the system to converge on the correct consensus is evaluated in two ways, as shown in Fig. 5. Firstly, the number of iterations is measured, i.e. the number of times a robot completed the process of comparing two sites and pooling their opinion. The second measure is the number of control cycles needed for each robot in the swarm to converge. As a control cycle is approximately equal to a tenth of a second in real time, this provides a measure of real-world performance and considers the time cost of comparing sites and waiting for pooling. The variability of these across sites can be seen in Fig. 17a.
As is clear from Fig. 5a, there was significant variability in the average time taken by a swarm to converge to a consensus. Most notable are the differences in performance between run 9 and run 5, which have a difference of over 3, 000 control cycles or approximately five minutes. This large variability is not seen in the number of iterations the swarm needed to converge, supporting the argument that this variability reflects environmental pressures as opposed to the difficulty of the decision problem. Some of this variability could be due to differing battery levels as the robots tended to travel more slowly when the battery levels were lower. The robots also spent an unexpectedly high proportion of time waiting to pool (see Appendix section “Travelling and Waiting Time Costs” for a more in depth discussion), suggesting that future work is needed to better understand the trade-off between the potential information gain and the waiting time costs. There is still a question as to what is the ‘ideal’ pooling size and whether it should be fixed.
The number of iterations needed for the robots to converge is benchmarked against the number of iterations a robot would need to visit each site, visiting two sites every iteration. Figure 5b shows that most of the runs match this benchmark, taking into account that the robots cannot complete partial iterations. This is not an immediately impressive result and perhaps suggests that in this specific case single agent site by site elimination performs just as well if not slightly better. On the other hand, we note that this was a particularly difficult problem for the system as the population was small, with only \(N=5\) robots choosing between \(n=7\) options, meaning \(N<n\). Indeed, performance was much better in Lee et al. (2018b) where the population was much larger at \(N = 10\) and the cases where \(N < n\) was not tested. Further in this experiment, the population range of the number of iterations needed to converge is very low, at most two iterations. This is in direct contrast to experiments in Lee et al. (2018b), where the variation within a population across the number of iterations needed for convergence was as high as five iterations. This suggests that the experimental design choices outlined in the discussions on pool size and continued broadcasting in Sect. 3.1.1 have had the intended effect of minimising variability in individual robot performance. The authors conjecture that it is the continued opinion broadcasting which has the strongest impact; however, more work would be needed to confirm this.
3.1.7 Effects of site order
As was expected, Fig. 6 suggests that the ordering of sites around the arena in a run impacted the time needed by the swarm to reach a consensus. We can see that the more local maxima induced by the ordering, the more time needed to reach a consensus. At first, we suspected that this is due to additional travelling time costs incurred by having to travel across the arena to compare sites. Indeed, a deeper look at run 9, which performed the worst, reveals that it had two local maxima. However, as Fig. 6c shows, surprisingly, this is not the case as there is no clear relationship between the number of local maxima in a run and the average time spent travelling between comparison sites. Even more interestingly, there does appear to be a positive trend between the number of local maxima and the time robots spent waiting for two neighbours to pool with. We conjecture that this is because here we have only measured the time spent travelling between comparison sites rather than total travelling time from the nest, to each site and then back again. As the control architecture forces robots to compare all neighbouring sites first, robots only start comparing local maxima once all other options are exhausted. This limits the randomness in site selection across the population, leading to more congestion and collisions going to and from the nest. Despite the positive trend between the number of local maxima and the number of control cycles needed, there was no trend between the number of local maxima and the number of iterations needed. This is because increasing the number of local maxima does not affect the difficulty of the decision problem itself.

Plots a and b show the relationship between the number of local maxima in a run (see Table 1) and the time taken to reach a consensus in a control cycles and b iterations. Points give the mean, and the bars show the 95% confidence intervals. Plot c shows the relationship between the number of local maxima in a run and the average time spent travelling between comparison sites or waiting to pool. Outliers have been removed using the interquartile range (IQR) rule, i.e. results are removed if they are below \(Q1 - 1.5 IQR\) or above \(Q3 + 1.5 IQR\), where Q1 and Q3 are the first and third quartiles, respectively
3.1.8 Information gain
Information gain here is measured as the Kullback–Leibler (KL) divergence (Kullback and Leibler 1951) between a robot’s opinion before pooling and its opinion after pooling. In other words, for some robot \(R_i\) with neighbours \(R_h\) and \(R_j\), information gain is calculated as,
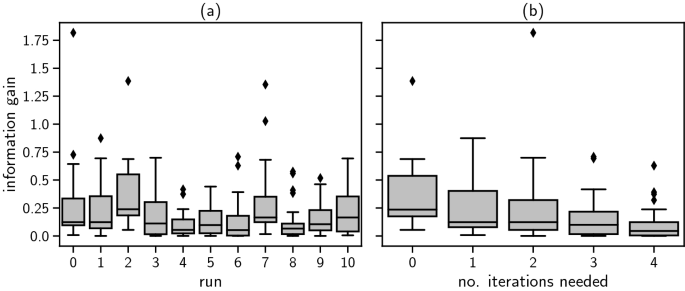
Figure 7a shows that for most runs the mean information gain across the whole run was roughly the same and corresponds to the elimination of two sites in every pool. The pooling size was fixed at \(k=3\), and so every robot pooling received information from two distinct neighbours. If the robot is then able to eliminate two sites during the pool, this could suggest that each neighbour contributed the elimination of one site. However, there were also clear instances of redundant pooling in many of the runs, where no information was gained. As expected, run 5 has the highest mean information gain with no cases of redundant pooling. Run 1 has the next highest mean information gain and no redundant pooling, perhaps explaining why its performance is so much better than the other runs with one local maximum like run 7 or run 10. Further work here could investigate the benefits of making the robots more discerning, i.e. they refuse to pool with neighbours whose opinions are too similar.
As might be expected, Fig. 7c suggests a slight negative trend between the number of iterations needed to converge and the average information gain in a pool. The robots learn less during pooling and so need to pool more to gain the same amount of information. Figure 7b suggests a slight positive trend between the pool ordinality and the information gain. This is surprising as between each pool the robots are also updating with external evidence and so increasing the number of sites they have each eliminated. Thus, we would assume that there is a higher chance of redundant pooling as the number of “available” sites decreases (and so reducing n). A possible explanation is that this is due to the continued opinion broadcasting behaviour. By the time some robots are pooling for the third or fourth time, there will likely be other robots at the nest who have already reached a final opinion. As these “finished” robots continue to broadcast, they are likely to be part of many pools, leading to the mass elimination of sites during pooling and the high information gain. This then snowballs, as the more “finished” robots at the nest, the more likely they will be picked for a pool by a returning robot.
A clear outlier in terms of information gain performance is run 5, with an average information gain of \(\sim 1.15\), corresponding to four or five sites eliminated in a pool. Table 2 reveals that there was a high level of variation in the first sites the population visited as every site was visited by at least one robot in the initial site comparisons and only one pair was duplicated. This meant that across the population many sites were initially eliminated and there was less chance of redundant pooling. Indeed, one robot converged after a single iteration after a very successful pool. This robot then influenced the rest of the swarm by continuing to broadcast its converged opinion. This resulted in the very good performance we saw for run 5 in terms of time taken, both for number of control cycles and iterations. This high variance in sites visited by the robots might also account for why the average travelling and waiting times were so low, as this variance led to spatial variance meaning there was less congestion and collisions. On the other hand, in run 7 only half of the sites were visited by a robot with one pair of sites (3 and 5) visited by four of the five agents. This led to redundancy when pooling and is likely the cause for the high number of iterations needed to reach a consensus in run 7. As this is a consequence of the random site selection, a possible alternative would be for each robot to have a slightly different weighting of their random choice to encourage heterogeneity in the selections made.
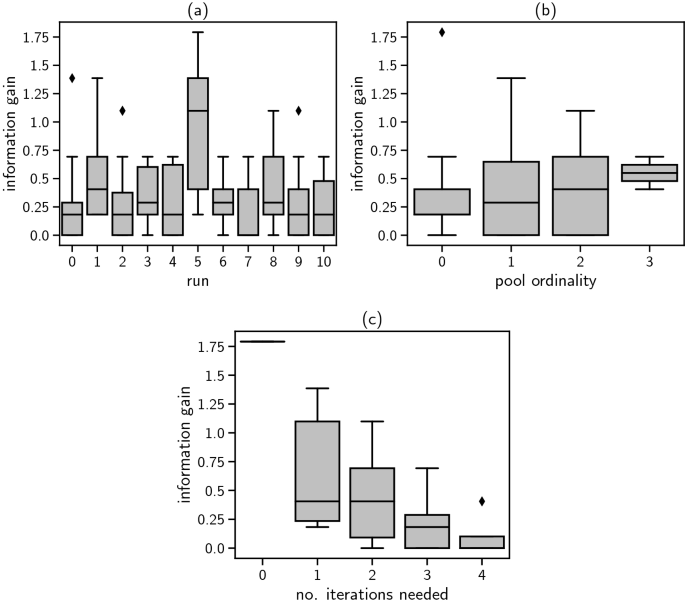
Box and whisker plots showing the relationship between the information gained when pooling and a the run, b the pool ordinality (i.e. was the pool the robot’s 1st, 2nd, ..., etc.) and c the number of iterations needed to converge
3.2 With noisy sensors
The previous experiments successfully solved the best-of-n problem using the negative updating method. These experiments were not entirely noiseless, and the approach proved robust to communication failures (see Appendix section “Communication Failures”). In this section, we further evaluate the method’s ability to perform well in more realistic scenarios and these experiments will include sensor noise. Throughout the experiment, virtual sensor readings will be sampled from Gaussian distributions to simulate the noise that real sensors would suffer.
3.2.1 Experimental set-up
The same experimental set-up and control architecture as described in Sect. 3.1.1 is used, with a small-scale swarm of five e-puck robots choosing between \(n=7\) options. The pooling size remains partial and fixed at \(k=3\) robots as this reduces some of the difficulties encountered when using a larger pooling size, such as spatial aggregation. We also suspect that partial pooling will improve performance in the noisy sensor experiments, as more variability in opinions will be retained by the swarm allowing for correction. Despite concerns that continued opinion broadcasting will be detrimental to performance in the presence of sensory noise, it remains part of the control architecture as it greatly reduced the variance in robot completion times within populations. Also, it is hoped that any errors caused by sensor noise will be corrected before robots converge upon a final opinion. As before, the experiment was run eleven times and lasted until the entire swarm had converged upon a belief in one of the hypotheses greater than 0.98. Other than run 0 which served as a control, the order of sites for each of the runs was randomised, as can be seen in Table 3. When updating on the belief that site i is not the ‘best’, we fix \(\delta _{E,i}=\alpha\) and \(\delta _{E,m}=1-\alpha\) for all \(m\ne i\) (from Definition 2). We set \(\alpha =0.1\) to indicate that the robots have a high level of trust in the evidence sources but fall short of absolute confidence (\(\alpha =0\)). This value was chosen as it appeared to balance convergence speed and accuracy in preliminary theoretical studies, but the authors note that more thorough analysis is needed to determine optimal values of \(\alpha\). All experiments were filmed, and videos are available in Online Resource 3.
3.2.2 Adding sensor noise
To have truly realistic sensor noise, it was originally planned that the e-pucks would use their on-board cameras to choose between different coloured sites; however, this did not allow any control when setting the noise or ensuring consistency of noise between individual e-pucks. Thus, sensing remains virtual with each robot querying an external server for sensory feedback, i.e. the quality value of the site. To simulate a noisy sensor, the server returns the quality value for the site plus some Gaussian noise, i.e. \({\hat{\rho }}_i = \rho _i + \epsilon\) where \(\epsilon \sim {\mathcal {N}}(0, \sigma )\) and \(\rho _i\) is the quality of site i. The server re-samples \(\epsilon\) every \({1}\,\hbox {Hz}\). For these experiments, \(\sigma =0.05\) was chosen as this gave a \(10\%\) chance of incorrectly comparing sites with neighbouring qualities when \(n=7\) where the difference between two sites is \(\rho _i - \rho _{i+1} = 0.125\) (see Appendix section “Sensor Noise” for more details). The chance of incorrectly comparing any options which do not have neighbouring qualities is very low to zero. This represents the expected behaviour of a real sensor—much more noise and the sensor is unlikely to be used.
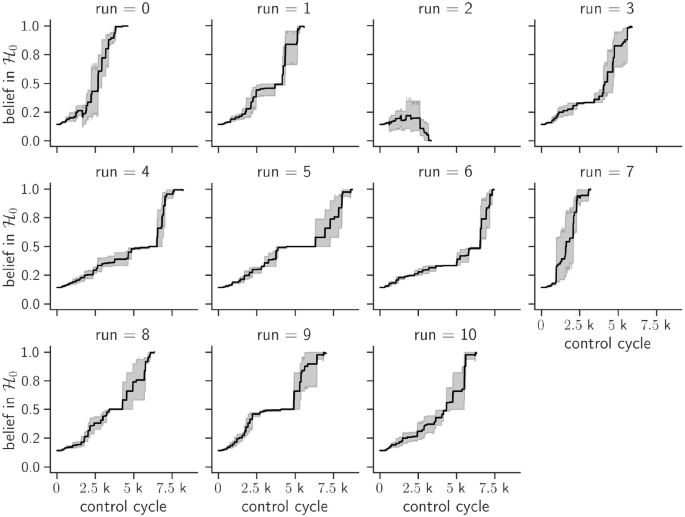
Plot showing the mean and variance of the population belief in \({\mathcal {H}}_0\), i.e. the best option is option 0, changing over time for each of the eleven runs. Each control cycle is approximately \(1/10\) seconds
3.2.3 Results
Figure 8 shows that the negative updating method exhibits significant robustness to sensor noise. In ten of the eleven runs, the swarm successfully identified \({\mathcal {H}}_0\) as the true state of the world, i.e. that site 0 was the best. The swarm appears to have only succumbed to noise in run 2 where \({\mathcal {H}}_0\) was rejected (in favour of \({\mathcal {H}}_2\)).
In run 0, the average population belief in \({\mathcal {H}}_0\) drops below the initial belief of \(1/7\) (recall initial beliefs are uniformly distributed). This indicates that some robot(s) in the swarm has become confused, i.e. received evidence suggesting that site 0 is not the best; however, the swarm clearly recovers suggesting that this confusion is corrected. In runs 1, \(3-10\) the average population belief in \({\mathcal {H}}_0\) never falls below the initial belief. This implies that in these runs, the swarm never experienced any evidence suggesting that site 0 was not the best and inspection of the log files confirms that this is indeed the case.
Even though all robots are receiving noisy (and so erroneous) site qualities throughout all runs, it is worth noting that only two runs (run 0 and run 2) show any indication of this affecting performance with respect to correct consensus attainment. We hypothesise that this is because the negative updating method only relies upon the comparison of site qualities and the subsequent ordering of the sites. In other words, it is only the order of quality values that needs to be correct if a valid updating is to take place, not the values themselves.
3.2.4 Time needed to reach consensus
As to be expected, the average time needed to reach consensus, measured in either control cycles or iterations, was much higher for experiments with noisy sensors in Fig. 9 than for the noiseless experiments in Fig. 5. Indeed, no successful run is better than the idealised benchmark of a single robot sequentially sampling sites, but this benchmark does not account for the impact of noise. We conjecture that while a single robot might complete the task faster, it is more susceptible to noise and so would be less reliable. Future work is needed to compare the performance of this collective approach with a single independent robot.
The increased time and number of iterations needed are a clear consequence of increasing \(\alpha\) which works to reduce the effect of updating upon some evidence and so slows down convergence. This is supported by comparing Fig. 10 to Fig. 7. Average information gain during pooling has decreased from 0.575 in the noiseless experiments to 0.188 with the introduction of noise. As there have been no other changes to the control architecture, we conjecture that this is most likely the result of increasing \(\alpha\); however, further exploration is needed to be sure. This effect is a familiar problem in collective decision making and is commonly referred to as the speed–accuracy trade-off, see (Hamann 2018; Valentini et al. 2015; Douven 2019). As \(\alpha\) increases, the robots become more discerning and so in theory their beliefs remain closer to the truth (or at least further away from the untruth), but this also results in the need for more evidence to convince them of the truth and so they take longer to converge.
Box and whisker plots showing the spread of time taken to reach a consensus by the population of five robots for each of the eleven runs, where a shows the number of control cycles (\(\sim 1/10\) second) and b shows the number of iterations. Each box shows the median, lower (25th) and upper (75th) quartiles, the whiskers gives the minimum and maximum and the points show outliers. In b, the dashed line at \(y=3.5\) shows the number of iterations \({\hat{t}}\) necessary for a robot to sample every option without noise accounted for
Box and whisker plot showing the relationship between the information gained when pooling and a the run and b the number of iterations needed to converge
3.2.5 Incorrect comparison—failure
Run 2 was the only run where the swarm failed to correctly identify the true state of the world \({\mathcal {H}}_0\), i.e. that site 0 was the best site. This indicates that the swarm has received some evidence suggesting that site 0 is not the best and that this evidence has been propagated throughout the swarm. Figure 11a and analysis of the robot log files confirm that this is the case. During its first iteration, bot 36 incorrectly compares sites 0 and 1 after observing the quality values \({\hat{\rho }}_0=0.749\) and \({\hat{\rho }}_1=0.781\), causing the initial dip in \(x_{36,0}\) (recalling that \(x_{r, m}=P_{A_r}({\mathcal {H}}_m)\)), i.e. robot r’s belief in hypothesis m. Bot 36 appears to start to correct this; Fig. 11a shows that \(x_{36, 0}\) begins to increase as a result of subsequent pooling and evidential updating, but this is only as other sites are eliminated. Indeed, immediately after its incorrect comparison, bot 36 pools with bot 1 which has correctly compared sites 0 and 1; however, the only information this gives bot 36 is that site 1 is also probably not the best site.
Unfortunately, bot 36 also manages to pool with every other member of the swarm over the course of the run which further spreads the misconception that site 0 is not the best. This effect is then reinforced when the robots pool with each other. For example, we see that bot 8 becomes very sure that either site 0 or site 2 is the best site but then pools with bots 36 and 11, who has also already previously pooled with bot 36. Note that the pooling operator MProdOp is evidence preserving (see Sect. 2) and this has a strong reinforcement effect of the evidence that increases over time. This effect can be very detrimental when, as in this example, a robot incorrectly updates so early in the experiment and raises the question of whether the opinion pooling operator should be evidence preserving in a noisy environment. We speculate that in noisy environments using the scalable product operator (SProdOp from Lee et al. (2018a)) as an adjustable evidence diluting operator would result in more robust performance.
The swarm does eventually converge to a consensus, but interestingly they do not conclude that site 1 (the next best site) is the best. Instead, they converge to the consensus that site 2 is the best. Note Table 3 where we can see that site 2 is a local maximum due to the site ordering; in other words, it is the best site in its immediate vicinity. Thus, it becomes crucial to note that throughout run 2 not a single robot compares sites 0 and 2. This is a result of the site selection method (discussed in Sect. 3.1.1), as the robots compare only neighbouring sites until forced to compare non-neighbouring sites because they are unable to eliminate some sites without these comparisons. This occurs when there are local maxima and run 2 should have required at least some of the robots in the swarm to compare these sites. However, this did not happen as the swarm incorrectly discounted site 0 before any individual robot was able to compare the two sites. With the current site selection method, some site orderings are more prone to incorrect comparisons than others. Firstly, if two neighbouring sites also have adjacent quality values, then they are more likely to be compared incorrectly, simply because they are more likely to be compared. Secondly, local maxima need to be directly compared to other local maxima (or the global maximum) to be eliminated. This becomes particularly problematic when site 0 and site 1 are neighbours and there are local maxima, as in the case of run 2. Table 3 shows that six of the eleven runs had site 0 and site 1 as neighbouring sites and four of these also had a local maximum (runs 2, 7, 8 and 10), but of these only run 2 failed.

Plot a shows individual robot beliefs in \({\mathcal {H}}_0\) changing over time in run 2. Annotations show where confusion occurs and how this is subsequently spread to the rest of the population. Plot b shows individual robot beliefs in \({\mathcal {H}}_0\) changing over time in run 0. Annotations show where comparison confusion occurs and where this is subsequently corrected
3.2.6 Incorrect comparison—correction
Figure 11b shows that in run 0, bot 1 incorrectly compares sites 0 and site 1 leading to a dip in \(x_{1, 0}\). It then manages to correct this belief through pooling without its confusion affecting the rest of the population and the swarm successfully converges to the correct consensus. There are two main differences between run 2 and run 0 which allowed for this corrective behaviour. Firstly, bot 1 happened to not be part of any other robots’ pool for the rest of the run, meaning this incorrect evidence never spread to other members of the swarm, but this is not a reliable or repeatable strategy. Secondly, and possibly of most importance, run 0 does not have any other local maxima and bot 1 was able to correct this incorrect evidence that site 0 was not the best site when it pooled with bots 4 and 11, both of whom at this point had either correctly compared sites 0 and 1 or had pooled with a robot which had.
In the next section, we use agent-based simulation experiments to further explore the best-of-n decision problem with noisy quality values. Using agent-based simulations rather than implementing on robots (real or simulation) allows for a more extensive and large-scale exploration of the parameter space.
4 Agent-based simulation experiments
We use a discrete-time multi-agent model to provide a more thorough exploration of the performance of the negative updating method applied to the best-of-n decision problem with noisy quality values. The robotic experiments in Sect. 3.2 showed that the negative updating method can be successful despite noisy sensors for \(n=7\) options and with only \(N=5\) robots. This section investigates the scalability of this robustness to noise with changes in both population size N and the number of options n. We hypothesise that as noise increases, performance will significantly decrease for higher values of n because of the increasing density of the quality space leading to a higher chance of confusion. This is a consequence of quality values lying within a bounded interval of the real line, i.e. in our case [0, 1]. Further, in the previous experiments a large concern when designing the swarm behaviour was the question of pooling regime—particularly does performance drop if partial pooling is used? So, in these experiments we will explore the performance with three different pooling regimes: evidence only (\(k=0\)), fixed partial pooling (\(k=3\)) and complete pooling (\(k=N\)).
4.1 Experimental set-up
The model presented here is like the one introduced in previous work in Lee et al. (2018b). We assume that a population of N agents begins with no prior knowledge of the qualities of n options, with agent opinions initialised uniformly. Agents then update their beliefs using two different mechanisms: at each iteration, every agent has some chance \(\epsilon\) of receiving evidence (i.e. a comparison between two sites) and then updates using the negative updating method. As in the robotic experiments we set \(\alpha =0.1\) to represent a level of distrust in the evidence sources. Every agent also has some chance \(\psi\) of pooling their opinion with k of their peers using the MProdOp operator. We no longer assume that agents return to a ‘nest’ location to pool and instead pool spontaneously. For an embodied system, this can be seen as an agent pooling opinions once it has communicated with the required threshold of peers while exploring the environment. As such, we set \(\epsilon =0.1\) and \(\psi =0.25\) to reflect the assumption that, unlike in the robot experiments, evidential updating and opinion pooling are unlikely to be synchronous. For each set of parameter values, 100 independent runs are carried out with each lasting for 1000 iterations.
4.1.1 Adding error to option quality comparisons
As in previous experiments in Sect. 3.2, we assume that the option quality values are uniformly distributed over the interval [0, 1] so that \(\rho _i=\frac {i+1}{n+1}\) for \(i=0, \dots , n-1\). To study the effect of noise on the system, we take the probability of confusing the ordering of the qualities \(\rho _i\) and \(\rho _j\) to be a decreasing function \(f: [0, 1] \rightarrow [0,1]\) of their difference. In other words, suppose an agent is comparing two options \({\mathcal {H}}_i\) and \({\mathcal {H}}_j\) such that \(\rho _i < \rho _j\), then under this noise model the agent will erroneously update on \({\mathcal {H}}_i\) with probability \(f(|\rho _i - \rho _j|)\) and correctly update on \({\mathcal {H}}_j\) with probability \(1-f(|\rho _i - \rho _j|)\).

The probability of confusing a two distributions \({\mathcal {N}}(\mu _1, \sigma )\) and \({\mathcal {N}}(\mu _2, \sigma )\) for different values of \(\sigma\) where d is the absolute difference between means \(|\mu _1 -\mu _2|\) and b as given by the error function \(f(d, \lambda )\) for different values of \(\lambda\) where d is the absolute difference between quality values \(|\rho _i - \rho _j|\)
For these experiments, we use the following parameterised error function from Lawry et al. (2019) which allows for differing severity levels:
Definition 3
(Error function (Lawry et al. 2019)) For \(d\in [0,1]\) and \(\lambda \in \mathbb {R}\),
Figure 12b shows how the error function changes for different values of \(\lambda\) and it is clear that increasing \(\lambda\) decreases the severity of noise in the system, analogous to decreasing \(\sigma\) in a Gaussian noise model. For these experiments, we choose the noise model from Lawry et al. (2019) rather than a traditional Gaussian noise model. This is because it has properties such as \(\lim _{d\rightarrow 1}f(d)= 0\) and allows us to easily model linear error (\(\lambda =0\)) while still behaving similarly to sensor noise. In the robot experiments (Sect. 3.2), a Gaussian noise model with \(\sigma =0.05\) was used and, by comparing Fig. 12a and b, we see that the noise model behaves very similarly to Definition 3 when \(\lambda =10\).
4.1.2 Pooling regimes
When setting pooling size for the robotic experiments (Sect. 3.1.1), a fixed partial pooling regime (\(k=3\) in \(N=5\)) was chosen as a trade-off between the expected improved performance of higher pooling sizes and the resulting physical impracticalities, such as higher collision rates. However, the introduction of noise makes the claim that increasing the pooling size always results in better performance less certain. In fact, higher pooling sizes might lead to worse performance since errors are propagated through the population much faster. Furthermore, higher pooling sizes could lead to more homogeneity in the population, meaning that pooling no longer becomes a mechanism for self-correction. For the following experiments, three different pooling regimes are investigated, no pooling, i.e. evidence only (\(k=0\)), fixed partial pooling (\(k=3\)) and complete pooling (\(k=N\)).
4.2 Results

Heatmaps showing the value of \({\overline{x}}_0\) after 1000 iterations averaged over 100 simulations. It shows scalability of robustness to noise for varying numbers of options n (from \(n=5\) to \(n=95\) in steps of five) and population sizes N (from \(n=5\) to \(n=95\) in steps of ten) under the different pooling types and error regimes. (\(\lambda =0\): linear noise, \(\lambda =10\): medium noise and \(\lambda =30\): low noise.)
The heatmaps in Fig. 13 show the value of \({\overline{x}}_0\) (i.e. the population belief in the best option \({\mathcal {H}}_0\)) after 1000 iterations averaged over 100 simulations for different values of \(\lambda\) and the three different pooling regimes, as N and n vary. The results for three values of \(\lambda\) presented represent linear noise (\(\lambda =0\)), medium noise comparable to that in the robot experiments (\(\lambda =10\)) and low noise (\(\lambda =30\)). Heatmaps for additional \(\lambda\) values are given in Online Resource 4. The method appears robust to noise when n is low. In the case of linear noise (\(\lambda =0\)), all pooling regimes result in average population beliefs over 0.5 when \(n=5\), while for lower noise values (\(\lambda =30\)), the method achieves this level of performance for up to \(n=45\).
As expected, the method struggles for high n, especially in very noisy environments. However, Lawry et al. (2019) note that choosing equally spaced quality values on a closed interval means that the difference between two consecutive quality values decreases with n. Recall that the quality values are defined \(q_i = \frac {i+1}{n+1}\) and so the difference between two consecutive quality values is,
The error function is a decreasing function of this difference for all \(\lambda\), meaning that the probability of confusing consecutive options increases with n. This leads to a scalability issue, wherein the decision problem with noisy qualities becomes increasingly difficult as n increases.
Scalability to higher n is a common problem in the collective best-of-n decision problem, see Valentini (2017). The problem here is that the quality values are distributed evenly within the restricted quality space. For some real-world applications, this might be mitigated by a very large disparity in quality values between the best option and the next best. Alternatively, a value-sensitive approach as used in Bose et al. (2017) to learning could be employed, whereby an option is deemed a valid solution if its quality value is above a threshold. The heatmaps in Fig. 14 replicate those in Fig. 13 but for \(\sum _{i}{\overline{x}}_i\) such that \(\rho _i \ge 0.75\) after 1000 iterations averaged over 100 simulations. (As before heatmaps for additional \(\lambda\) values are given in Online Resource 5.) Consistent with the findings in Lawry et al. (2019), we see that with this measurement of performance the robustness to increasing n is far better. Indeed, Fig. 15c shows that the standard deviation in performance for all n is smaller when measured using the “good enough” approach across all noise levels.

Heatmaps showing the value of \(\sum _i {\overline{x}}_i\) such that \(\rho _i>0.75\) after 1000 iterations averaged over 100 simulations. It shows scalability of robustness to noise for varying numbers of options n (from \(n=5\) to \(n=95\) in steps of five) and population sizes N (from \(n=5\) to \(n=95\) in steps of ten) under the different pooling types and error regimes. (\(\lambda =0\): linear noise, \(\lambda =10\): medium noise and \(\lambda =30\): low noise.)

Plots a and b show the value of \({\overline{x}}_0\) after 1000 iterations averaged over 100 simulations for a fixed population size \(N=5\) with varying noise levels and b fixed noise level \(\lambda =10\) with varying population sizes. Results shown are for \(n=15\) with different pooling regimes; ‘ev only’ (\(k=0\)), ‘partial’ (\(k=3\)) and ‘complete’ (\(k=N\)). Plot c shows the standard deviation across changing n as \(\lambda\) varies for the two measures of performance; the population belief in the best option \({\overline{x}}_0\) and the aggregate belief in all options such that \(\rho _i > 0.75\), \(\sum _{i: \rho _i > 0.75} {\overline{x}}_i\)
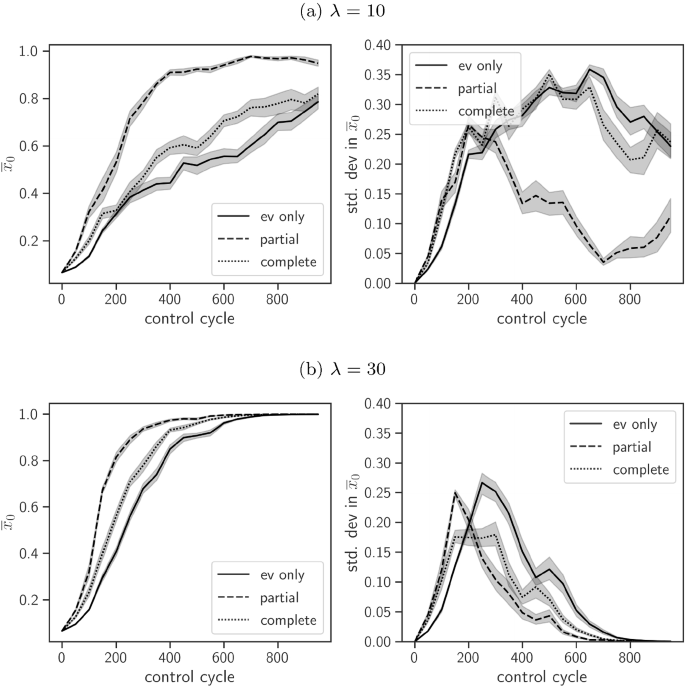
Time series plots showing the value of \({\overline{x}}_0\) and the population standard deviation averaged over 100 simulations for different pooling types. Results shown are for \(n=15\) and \(N=5\)
4.2.1 Effect of pooling regime choice
These simulation experiments were run with three different pooling regimes, to investigate optimal pooling strategies. Performance was judged on the value of \({\overline{x}}_0\) after 1000 iterations averaged over 100 runs. The heatmaps in Fig. 13 suggest that partial pooling outperforms both no pooling and complete pooling across all parameter value sets explored. Figure 15a shows that (for a small population size \(N=5\)) partial pooling demonstrates much better performance than the other regimes for high levels of noise. Also Fig. 15b shows that for a fixed noise level \(\lambda =10\), partial pooling is the best performing regime for all values of N. This suggests that continually increasing pooling size k does not guarantee improved performance when there is noise and that there is likely to be some optimal pooling size \(k^{\star }\in (0,N)\) dependent on the system parameters. The time series plots in Fig. 16 show the mean and standard deviation in population belief for a population of size \(N=5\) choosing between \(n=15\) options with \(\lambda =10\) and \(\lambda =30\). We focus on these parameters as they are demonstrative of those likely to be used in real-world scenarios (a small number of robots deciding between a larger number of options) and the results further support the argument for partial pooling. In particular, Fig. 16a shows that when there is more noise, partial pooling performs the best.
The results suggest that no pooling, updating on evidence only, leads to the worst performance and this is perhaps unsurprising and agrees with much of the literature, see Douven and Wenmackers (2017); Crosscombe and Lawry (2019); and Lawry et al. (2019). Each agent in the population is solving the decision problem individually, leading to slow convergence as evidence has no means to propagate throughout the system, and agents can only correct their beliefs if they receive evidence about the same two options again. Surprisingly, complete pooling performs only marginally better than no pooling. First suspicions were that this is because complete pooling forces homogeneity in population beliefs which can allow erroneous beliefs to propagate through the system too quickly and without review, i.e. the evidence is not confirmed by repeated visits. Contrary to these expectations, the time plots showing the average standard deviation in agent beliefs within a population in Fig. 16 show that the standard deviation of agent belief in \({\mathcal {H}}_0\) within the population reaches similar levels for all the pooling regimes, thus rejecting the claim that complete pooling leads to more homogeneous population beliefs. We hypothesise that the introduction of an aggregation rate \(\psi\) lessens this effect in these experiments and that the poor performance is because the erroneous beliefs caused by noise leads to disagreement within the population. Then, when pooling with the entire population, agents are more likely to pool with peers who have very different beliefs. This results in a loss of information, as the agents’ beliefs become more moderate (tends to uniform across the option) to accommodate the differing beliefs. Considering this, it is interesting to note that the fixed pooling size used (\(k=3\)) is very low and only a small proportion of the total population for larger N. Further work would explore whether strictly low values for k are optimal or whether it changes as a proportion of the population size.
4.2.2 Population Size
The most striking result to emerge from these experiments is that population size does not affect performance with respect to \({\overline{x}}_0\) after 1000 iterations. However, we note that the minimum population size tested was \(N=5\) and it is likely that much smaller populations, e.g. \(N=2,\) would result in poor performance. Figure 15b clearly shows that in the \(\lambda =10\) case, there is little benefit gained from increasing N and, in fact, \(N=5\) the smallest population tested, appears to perform the best. Inspection of the heatmaps in Fig. 13 suggests that this result holds across \(\lambda\) values. This finding contrasts with many current bio-inspired approaches in swarm robotics which have focused on large swarm sizes solving for low n, see Valentini et al. (2017). However, this indication of a preference for smaller population also agrees with conclusions made in Sect. 3.1, where we found that the speed to consensus does not increase linearly with population size. This becomes relevant in physical studies where there is a trade-off between the benefits and costs of adding individuals. This trade-off has been observed experimentally in Font Llenas et al. (2018), where physical interference among the robots reduced their individual efficiency and this has been observed in theory in Hamann (2012) and Khaluf et al. (2017) where increasing swarm density impacted performance.
5 Conclusion
In this paper, we have investigated the performance of an approach to solving the best-of-n decision problem in the presence of noise. In real robot experiments, we explored the applicability of the method and its robustness to sensor noise. In simulation experiments, we investigated the scalability of the approach to increasing n and the effect of different pooling regimes.
The experiments presented in this paper further support the conclusion in Lee et al. (2018b) that the approach has potential for solving best-of-n decision problems in real-world swarm robotics applications. The real robot experiments aimed at further testing the applicability of our approach, now considering more realistic constraints such as battery life, imperfect obstacle avoidance, and noisy sensors. Experiments were conducted with a small-scale swarm of N = 5 e-puck robots choosing between \(n=7\) options in a semi-virtual environment.
In the noiseless experiments, the swarm reached a consensus on the best option in all runs but were only able to match the time benchmark of exhaustive comparative search. However, we note that this was a particular difficult problem for this approach as \(N<n\). The defining feature of the run which did perform better than exhaustive comparative search was a high level of variance in the initial sites compared, as this resulted in less spatial congestion and more information gain during pooling.
The approach was also found to be remarkably robust when exposed to noise in the form of noisy sensor readings. Despite all robots receiving noisy (and so erroneous) site qualities throughout the experiments, only two out of the eleven runs showed any effect upon performance in the form of an incorrect direct comparison of sites. Moreover, the robots failed to reach a consensus on the best option in only one of these runs, managing to self-correct in all others.
The results from the simulation experiments in Sect. 4 confirm the robustness of the approach for low n, but, as expected, the method was less effective for high n. This is, in part, a consequence of the method of choosing option quality values; however, it also reflects a larger issue affecting the best-of-n decision problem and the impact of increasing n upon the density of the quality space. One approach to this problem, seen in work by Talamali et al. (2019) and Reina et al. (2017), is to study large n but avoid the issue of the density of the quality space by setting all inferior options to be equal. We note that when there is very little difference in quality between the top options, then a “good enough” approach might suffice for the application. For example, consider the agriculture problem where a group of robots are deciding which field needs weeding. In this situation, it might be advantageous to find the subset of sites which need weeding, as opposed to the single field which has the most weeds. This approach relates to the concept of value-sensitive decisions in the literature, see Bose et al. (2017).
Unexpectedly, we found that the system’s robustness to noise does not appear to be affected by the population size and the approach worked well even when N was very small. Although we note that larger populations might have shown an improvement in performance if the simulations had been run for longer. The simulation experiments do highlight the importance of choosing an appropriate pooling regime. We note that populations implementing a partial pooling regime (\(k<N\)) performed the best, especially with higher noise levels, while complete pooling (i.e. \(k=N\)) was found to perform only slightly better than no pooling at all (\(k=0\)). This finding is particularly fortunate as limitations in real-world applications mean that complete pooling is often impossible.
Taken together, the results from this paper suggest that negative updating combined with a partial opinion pooling regime is a promising approach to solving the best-of-n decision problem in the presence of option quality noise, e.g. sensor noise. However, this is only one form of possible noise that such a system would face in a real-world application. Another form of noise is communication noise and faulty agents. Further work will investigate the robustness of the system to this form of noise with the use of a scalable product opinion pooling operator. The authors also note that the only partial pooling regime explored is \(k=3\) and future studies should investigate whether pooling sizes should be kept as small as possible or if there is an optimal pooling size as a proportion of the population size. Finally, there is an implicit assumption underlying this work that the group behaviour will outperform a single robot and further work is needed to compare the approach with individual robot strategies.
Notes
see Genest and Zidek (1986) for an early overview of the log-linear operator.
Available in Online Resource 1
Online repository available here: https://caidin.brl.ac.uk/c53-lee/DecisionMakingEpucks
References
Blum, C., Winfield, A. F. T., & Hafner, V. V. (2018). Simulation-based internal models for safer robots. Frontiers in Robotics and AI, 4, 74.
Bordley, R. F. (1982). A multiplicative formula for aggregating probability assessments. Management Science, 28(10), 1137–1148.
Bose, T., Reina, A., & Marshall, J. A. R. (2017). Collective decision-making. Current Opinion in Behavioral Sciences, 16, 30–34.
Braitenberg, V. (1986). Vehicles: Experiments in Synthetic Psychology. Cambridge: MIT press.
Brambilla, M., Ferrante, E., Birattari, M., & Dorigo, M. (2013). Swarm robotics: a review from the swarm engineering perspective. Swarm Intelligence, 7(1), 1–41.
Cardona, G. A., & Calderon, J. M. (2019). Robot swarm navigation and victim detection using rendezvous consensus in search and rescue operations. Applied Sciences, 9(8), 1702.
Castello, E., Yamamoto, T., Dalla Libera, F., Liu, W., Winfield, A. F. T., Nakamura, Y., & Ishiguro, H. (2016). Adaptive foraging for simulated and real robotic swarms: The dynamical response threshold approach. Swarm Intelligence, 10(1), 1–31.
Crosscombe, M., & Lawry, J. (2019). Evidence propagation and consensus formation in noisy environments. In Proceedings of the 18th International Conference on Autonomous Agents and MultiAgent Systems, International Foundation for Autonomous Agents and Multiagent Systems, pp 1904–1906.
Dietrich, F., & List, C. (2016). Probabilistic opinion pooling. Hájek, A, & Hitchcock, C(Eds), Oxford Handbook of Probability and Philosophy, Oxford University Press, Oxford.
Douven, I. (2019). Optimizing group learning: An evolutionary computing approach. Artificial Intelligence, 275, 235–251.
Douven, I., & Kelp, C. (2011). Truth approximation, social epistemology, and opinion dynamics. Erkenntnis, 75(2), 271.
Douven, I., & Wenmackers, S. (2017). Inference to the best explanation versus Bayes’s rule in a social setting. The British Journal for the Philosophy of Science, 68(2), 535–570.
Font Llenas, A., Talamali, M. S., Xu, X., Marshall, J. A. R., & Reina, A. (2018). Quality-sensitive foraging by a robot swarm through virtual pheromone trails. In International Conference on Swarm Intelligence, LNCS vol 11172, Springer, pp 135–149.
Garnier, S., Gautrais, J., Asadpour, M., Jost, C., & Theraulaz, G. (2009). Self-organized aggregation triggers collective decision making in a group of cockroach-like robots. Adaptive Behavior, 17(2), 109–133.
Genest, C., & Zidek, J. V. (1986). Combining probability distributions: A critique and an annotated bibliography. Statistical Science, 1(1), 114–135.
Hamann, H. (2012). Towards swarm calculus: Universal properties of swarm performance and collective decisions. In International Conference on Swarm Intelligence, LNCS vol 7461, Springer, pp 168–179.
Hamann, H. (2018). Swarm robotics: A formal approach. Berlin: Springer.
Hinton, G. E. (1999). Products of experts. Proceedings of the Ninth International Conference on Artificial Neural Networks (ICANN 99) pp 1–6.
Hinton, G. E. (2002). Training products of experts by minimizing contrastive divergence. Neural Computation, 14(8), 1771–1800.
Kakalis, N. M. P., & Ventikos, Y. (2008). Robotic swarm concept for efficient oil spill confrontation. Journal of Hazardous Materials, 154(1–3), 880–887.
Khaluf, Y., Pinciroli, C., Valentini, G., & Hamann, H. (2017). The impact of agent density on scalability in collective systems: noise-induced versus majority-based bistability. Swarm Intelligence, 11(2), 155–179.
Kullback, S., & Leibler, R. A. (1951). On information and sufficiency. The Annals of Mathematical Statistics, 22(1), 79–86.
Lawry, J., Crosscombe, M., & Harvey, D. (2019). Epistemic sets applied to best-of-n problems. In European Conference on Symbolic and Quantitative Approaches with Uncertainty, Springer, pp 301–312.
Lee, C., Lawry, J., & Winfield, A. F. T. (2018a). Combining opinion pooling and evidential updating for multi-agent consensus. In Proceedings of the 27th International Joint Conference on Artificial Intelligence, AAAI Press, pp 347–353.
Lee, C., Lawry, J., & Winfield, A. F. T. (2018b). Negative updating combined with opinion pooling in the best-of-n problem in swarm robotics. In International Conference on Swarm Intelligence, LNCS vol 11172, Springer, pp 97–108.
Liu, W., & Winfield, A. F. T. (2011). Open-hardware e-puck linux extension board for experimental swarm robotics research. Microprocessors and Microsystems, 35(1), 60–67.
Marshall, J. A. R., Dornhaus, A., Franks, N. R., & Kovacs, T. (2006). Noise, cost and speed-accuracy trade-offs: Decision-making in a decentralized system. Journal of the Royal Society Interface, 3(7), 243–254.
Mateo, D., Horsevad, N., Hassani, V., Chamanbaz, M., & Bouffanais, R. (2019). Optimal network topology for responsive collective behavior. Science Advances, 5(4), eaau0999.
Mondada, F., Bonani, M., Raemy, X., Pugh, J., Cianci, C., Klaptocz, A., Magnenat, S., Zufferey, J. C., Floreano, D., & Martinoli, A. (2009). The e-puck, a robot designed for education in engineering. In: Proceedings of the 9th conference on autonomous robot systems and competitions, IPCB: Instituto Politécnico de Castelo Branco, LIS-CONF-2009-004, pp 59–65.
Osborne, M., & Baldridge, J. (2004). Ensemble-based active learning for parse selection. In Proceedings of the Human Language Technology Conference of the North American Chapter of the Association for Computational Linguistics: HLT-NAACL 2004.
Pearce, M., Conklin, D., & Wiggins, G. (2004). Methods for combining statistical models of music. In International Symposium on Computer Music Modeling and Retrieval, Springer, pp 295–312.
Peleg, D. (2005). Distributed coordination algorithms for mobile robot swarms: New directions and challenges. In International Workshop on Distributed Computing, Springer, pp 1–12.
Pitonakova, L., Winfield, A. F. T., & Crowder, R. (2018). Recruitment near worksites facilitates robustness of foraging e-puck swarms to global positioning noise. In 2018 IEEE/RSJ International Conference on Intelligent Robots and Systems (IROS), IEEE, pp 4276–4281.
Rausch, I., Reina, A., Simoens, P., & Khaluf, Y. (2019). Coherent collective behaviour emerging from decentralised balancing of social feedback and noise. Swarm Intelligence, 13(3–4), 321–345.
Reina, A., Marshall, J. A. R., Trianni, V., & Bose, T. (2017). Model of the best-of-N nest-site selection process in honeybees. Physical Review E, 95(5), 052411.
Roth, S., & Black, MJ. (2005). Fields of experts: A framework for learning image priors. In 2005 IEEE Computer Society Conference on Computer Vision and Pattern Recognition (CVPR’05), IEEE, vol 2, pp 860–867.
Rubenstein, M., Ahler, C., & Nagpal, R. (2012). Kilobot: A low cost scalable robot system for collective behaviors. In 2012 IEEE International Conference on Robotics and Automation, IEEE, pp 3293–3298.
Szymanski, M., Breitling, T., Seyfried, J., & Wörn, H. (2006). Distributed shortest-path finding by a micro-robot swarm. In International Workshop on Ant Colony Optimization and Swarm Intelligence, Springer, pp 404–411.
Talamali, M. S., Marshall, J. A. R., Bose, T., & Reina, A. (2019). Improving collective decision accuracy via time-varying cross-inhibition. In 2019 International Conference on Robotics and Automation (ICRA), IEEE, pp 9652–9659.
Valentini, G. (2017). Achieving Consensus in Robot Swarms. Berlin: Springer.
Valentini, G., Hamann, H., & Dorigo, M. (2015). Efficient decision-making in a self-organizing robot swarm: On the speed versus accuracy trade-off. In Proceedings of the 2015 International Conference on Autonomous Agents and Multiagent Systems, International Foundation for Autonomous Agents and Multiagent Systems, pp 1305–1314.
Valentini, G., Ferrante, E., & Dorigo, M. (2017). The best-of-n problem in robot swarms: Formalization, state of the art, and novel perspectives. Frontiers in Robotics and AI, 4, 9.
Wessnitzer, J., & Melhuish, C. (2003). Collective decision-making and behaviour transitions in distributed ad hoc wireless networks of mobile robots: Target-hunting. In European Conference on Artificial Life, Springer, pp 893–902.
Winfield, A. F. T. (2009). Foraging robots. In Encyclopedia of complexity and systems science, Springer, pp 3682–3700.
Acknowledgements
Detailed comments from anonymous referees strongly contributed to the presentation and quality of this paper. This research was partially funded by an EPRSC PhD studentship as part of the Centre for Doctoral Training in Future Autonomous and Robotic Systems (grant number EP/L015293/1). All underlying data are included in full within the paper.
Author information
Authors and Affiliations
Corresponding author
Ethics declarations
Conflict of interest
The authors declare that they have no conflict of interest.
Additional information
Publisher's Note
Springer Nature remains neutral with regard to jurisdictional claims in published maps and institutional affiliations.
Supplementary Information
Below is the link to the electronic supplementary material.
Appendices
Appendix: Travelling and waiting times
Environmental pressures can affect the time robots spent travelling or waiting during an experiment. For example, a low battery life can result in a robot travelling more slowly or waiting times increased due to congestion. As some environmental pressure cannot be controlled, their impact upon the performance in a run can vary and we see this variability (Fig. 17a). Figure 17b shows that on average across the runs, the largest component of this was time spent travelling between comparison sites with an average across runs of 252 control cycles (or \(\sim 25.2\) s), which is not unreasonable. Run 0 and run 4 have some extreme outliers for travel time, and from the videos, we can see that these were the result of unresolvable collisions. This is where two robots collide and then get stuck in a loop of re-colliding as both of their target destinations are behind the other robot. This was manually corrected for in most experiments after it became clear they could not self-correct and future improvements to the system would include the use of a more sophisticated obstacle avoidance algorithm.
As noted in Sect. 3.1.1, the robots did incur a time cost waiting for two neighbours to pool, with an average of 206 control cycles (or 20.6 seconds) across all the runs. This was unexpectedly high and is only five seconds less than the average time spent travelling. Furthermore, Fig. 17a shows that in three of the eleven runs, the warm spent a much larger proportion of time waiting at the nest site than travelling. Observations of the videos suggest that a contributing factor was congestion at the nest site, which could once again be mitigated by a more sophisticated obstacle avoidance algorithm.

Box and whisker plots showing the spread of time taken by the population (size \(N=5\)) when travelling between comparison sites and waiting to pool for a each of the eleven runs and b the average across all runs
Communication failures
The communications set-up had a margin of error (due to the use of user datagram protocol (UDP) protocol rather than transmission control protocol (TCP)), and Fig. 18 shows the proportion of erroneous communications per run. Some communications were ascribed to the wrong robot and this led to robots mistakenly pooling with themselves or accepting a neighbour’s opinion multiple times. This had the unfortunate effect of increasing the amount of redundant pooling in the system. However, the results show that our approach is robust to this communication noise with all runs still attaining good performance. Indeed, even in run 8, where 27% of the communications were erroneous, the swarm still achieved both consensus and convergence.

Bar plot showing the number of communications between agents during each run with the proportion of which were erroneous highlighted. Communications were cross-referenced between agents to detect whether a communication had been ascribed to the wrong robot and so was erroneous
Sensor noise
Figure 19 shows different levels of Gaussian noise against the probability of a robot receiving evidence about sites i and j to suggest incorrectly that \(\rho _i < \rho _j\) when in truth \(\rho _j > \rho _i\). For these experiments, \(\sigma =0.05\) was chosen as this gave a \(10\%\) chance of incorrectly comparing sites with neighbouring qualities when \(n=7\) where the difference between two sites is \(\rho _i - \rho _{i+1} = 0.125\). The chance of incorrectly comparing any options which do not have neighbouring qualities is very low to zero. This represents the expected behaviour of a real sensor as any more noise would result in a very poor-quality sensor. The resulting distributions of the quality values broadcast for each site during the robot experiments can be seen in Fig. 20.

Plots showing a the probability of confusing option i with option 0 (i.e. the best option) and b the probability of confusing two options depending on the difference between quality values (i.e. \(|\rho _i - \rho _j|\), where noise is normally distributed for each option with \(\mu = \rho _i\) and \(\sigma \in \{0.025, 0.05, 0.75, 0.1\}\) are compared
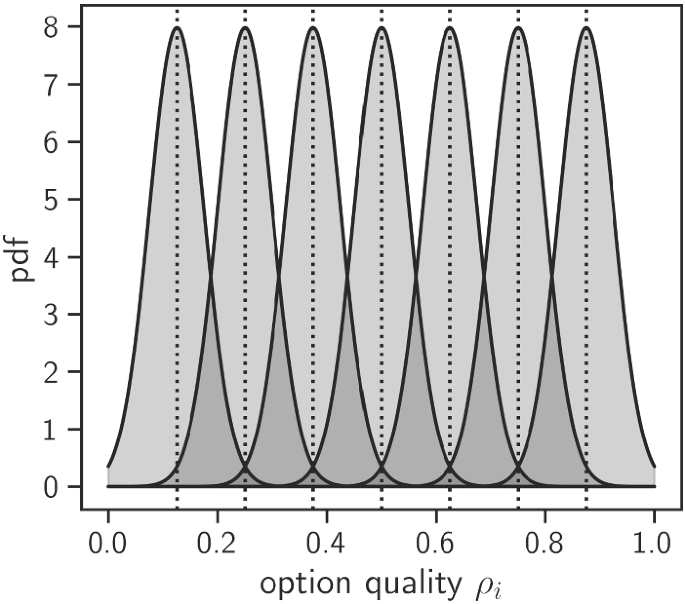
Plot showing the distribution of the quality values broadcast for each option during the robot experiment, where noise is normally distributed as \({\mathcal {N}}(\rho _i, 0.05)\) for each of the seven options
Rights and permissions
Open Access This article is licensed under a Creative Commons Attribution 4.0 International License, which permits use, sharing, adaptation, distribution and reproduction in any medium or format, as long as you give appropriate credit to the original author(s) and the source, provide a link to the Creative Commons licence, and indicate if changes were made. The images or other third party material in this article are included in the article's Creative Commons licence, unless indicated otherwise in a credit line to the material. If material is not included in the article's Creative Commons licence and your intended use is not permitted by statutory regulation or exceeds the permitted use, you will need to obtain permission directly from the copyright holder. To view a copy of this licence, visit http://creativecommons.org/licenses/by/4.0/.
About this article

Cite this article
Lee, C., Lawry, J. & Winfield, A.F.T. Negative updating applied to the best-of-n problem with noisy qualities. Swarm Intell 15, 111–143 (2021). https://doi.org/10.1007/s11721-021-00188-4
Received:
Accepted:
Published:
Issue Date:
DOI: https://doi.org/10.1007/s11721-021-00188-4