
Abstract
Purpose
The purpose of the European SENSE project was to define an integral system to assess and communicate the environmental impacts of food products and to develop a web-based tool for Small and Medium size Enterprises (SMEs). The tool has been tested in salmon, beef-and-dairy, and fruit juice production sectors.
Methods
The SENSE project has evaluated several existing methodologies for environmental impact assessment over the life cycle including also social aspects, in order to deliver a new integral system for the environmental and social assessment of agricultural and aquaculture food products.
Results and discussion
The system includes a standardization of a data gathering system, a selection of relevant key environmental performance indicators for food supply chains and a common methodology to perform simplified life cycle impact assessment. The results are based on collected information on the use of resources and emissions generated along the supply chain of food or drink products. The main result is a web-based software tool that is based on a summation of the partial impacts of the different steps in food supply chains. In this software, different actors in the supply chain can enter their own data and link them to the data of other companies. The results obtained in the tool could be used for at least six different approaches: (i) environmental impact assessment of the product, (ii) food chain hot spot identification, (iii) comparison of hypothetical or real improvement scenarios, (iv) assessment of the environmental impact development over the years, (v) benchmarking opportunity for the companies, and (vi) a business to business communication strategy. The scientific robustness of the tool has been tested comparing the obtained results with the same analysis with commercial software.
Conclusions
The SENSE tool is a simplified tool designed for food and drink SMEs to assess their sustainability on their own. This cannot be fully compared to a complete LCA study. The testing with SMEs showed that they need additional support for filling in the questionnaires correctly and interpret the results. The simplified evaluation of environmental impacts based on a life cycle approach could lead to benefits to SMEs within the food industry. The future application and development of the tool will be focused on adapting the tool to the Product Environmental Footprint initiative requirements and self-assessment opportunities.
1 Introduction
Food production and consumption cause significant strain on the environment. It is estimated that 29 % of global emissions of greenhouse gases (GHG) are from agriculture and food production (Vermeule et al. 2012). In the EU, food consumption accounts for 20–30 % of various environmental impacts and, in the case of eutrophication, more than 50 % (Tukker et al. 2005). In the UK, the food and drink sector is responsible for 14 % of industrial energy consumption and 7 Mt of carbon emissions per year; it also uses 10 % of all industrial water supplies and produces 10 % of the industrial and commercial waste stream (DEFRA 2006). Moreover, in Switzerland, i.e., nutrition causes about 12 % of total energy demand and 18 % of greenhouse gas emissions due to Swiss consumption patterns (Jungbluth et al. 2011; Jungbluth et al. 2013; Frischknecht et al. 2009).
The food and drink industry in Europe, of which according to Eurostat (2001) 99 % are small and medium enterprises, is highly fragmented, and food chains are very complex. Hence, to assess the environmental sustainability of a product, there is a need for applying integrated, harmonized, and scientifically robust methodologies, together with appropriate communication strategies for making environmental sustainability understandable to the different actors in the food chain and to the market.
Nowadays, the proactive communication of environmental impact of products can lead to great benefits to the industries which, in many cases, can lead to brand differentiation. However, most of the industries in the food sector, especially Small and Medium size Enterprises (SMEs), neither have a strong background nor the capability to assess the environmental impact of their products.
Environmental impacts linked to food production can be identified and quantified with the Life Cycle Assessment (LCA) methodology, an internationally recognized methodology (Pelletier et al. 2007). Nevertheless, the importance of including innovative methodological improvements in LCA to broaden its scope and shift to a more comprehensive and harmonized environmental analysis is a major concern for LCA practitioners. Consequently, in recent years, there are initiatives to harmonize and simplify the LCA methodology for the so-called Product Environmental Footprints (PEF).
In order to implement a representative LCA in the food and drink sector, the following aspects have to be defined:
-
i.
Functional unit (FU) selection: The FU is defined as the unit which is being studied and quantifies the service delivered by the product system, providing a reference to which the inputs and outputs can be related. Units selected should reflect both the goal of the study and the role of a particular food product in a diet. Nevertheless, this generates multiple questions in the food systems due to the fact that different functional units can be selected, for example, based on the mass (total product kg, kg of edible product), the volume (L, m3, etc.), or nutritional aspects (the caloric contribution, vitamin supply, protein supply, etc.) (Tyszler et al. 2014).
-
ii.
System boundary selection: There is also a challenge when setting the system boundaries of the investigated life cycle according to the goal and scope of the study. Some studies include the full life cycle including transportation home, storage, preparation, and disposal of waste and faces (Jungbluth 2000; Muñoz et al. 2008). Other studies are focused only in the gate-to-gate systems because the buying and preparation processes are out of the scope of the studies (Pardo et al. 2012).
-
iii.
Time scale: The selection of the time limits of the study is a difficult issue in the food LCAs especially in the studies based in the sourcing of “wild” raw materials or dependent on factors not controlled by humans. For example, the fish stocks vary considerably from year to year and therefore it is recommended to collect data of at least 3 years in order to obtain a robust result (Ramos et al. 2011; Vazquez-Rowe et al. 2012b).
-
iv.
Allocation procedure. Food product LCA is often complex because there is not just one product as output from the system. In the case of meat, some cattle are bred just to produce meat, but others are also part of the dairy chain. Hence, there can be difficulties assigning or allocating environmental impacts between the beef, dairy, and by-product components. ISO 14044:2006 leaves different options for this task, such as system expansion, mass allocation, or economic allocation.
-
v.
Impact methodology selection: There are still many impacts that are not being considered in the life cycle thinking such as loss of biodiversity (Curran 2010), discards (Vazquez-Rowe et al. 2012a), and damages to the marine seafloor (Ziegler and Valentinsson 2008). The globalization of the production systems forces the creation of some impact characterization factors according to the conditions in each region (Pfister 2013).
Within this framework, the European research project SENSE aims to deliver a harmonized system for the environmental impact assessment of food and drink products for SME producers and to propose a common approach to the above-mentioned aspects. Using the defined system and tool, all companies using the tool will be using the same methodology. The research evaluates existing relevant environmental impact assessment methodologies, to deliver a new integral system that can be linked to monitoring and traceability data. The system integrates the following:
-
(a)
Methodology for environmental impact assessment (described in Section 2.1) which defines the impact methodology selection;
-
(b)
A set of key environmental performance indicators plus a harmonized system to collect data (described in Section 2.2);
-
(c)
A common LCA framework for the food industry (described in Section 2.3) answering the functional unit, allocation procedure, definition of system boundaries, and the time scale.
-
(d)
A web-based tool which allows the environmental impact calculation for a food product (described in Section 3) in a simplified way.
The sustainability information is collected along the supply chain of the food product and reflected into an Environmental Identification Document (EID). This should contribute to making information on the environmental sustainability of a product as a part of the usual decision making and purchasing behavior in B2B. It also could provide a competitive advantage to those products and companies which choose to use the EID, through a comprehensive environmental communication between the industries.
2 Methods
In order to develop the tool, the main aspects as outlined before have been defined as follows.
2.1 LCIA methodology
In parallel to the SENSE project, the Roundtable for the Food and Drink Sustainable Consumption developed the ENVIFOOD protocol in 2013 (Food SCP RT 2013). A set of environmental impact indicators for the food supply chains was selected based on literature reviews (Landquist et al. 2013a). After the definition of the main impact categories, a specific characterization method for each impact was agreed on after the review of public and private initiatives. The life cycle assessment methodologies chosen for each impact category are listed in Table 1 along with the corresponding indicators and references. This task was done at the same time the ENVIFOOD protocol was being developed.
2.2 Key environmental performance indicators for easy data collection
A key issue in LCA is the collection of data for all stages in the life cycle. Often the list of required data is quite long. Therefore, a simplified approach has been developed in this project by focusing the data collection on a list of key environmental performance indicators (KEPI).
KEPIs are used in the SENSE tool to calculate the environmental impacts. The KEPIs are essential parameters that will be used as life cycle inventory inputs or outputs. These inputs are related to 1-year period and have been selected in order to have a set of parameters which together account for at least the 90 % of the impact related to a product (Fig. 1). KEPIs are yardsticks which can be easily measured by an actor in the food chain. For the selection of those parameters, three detailed LCAs have been performed in the beef and dairy, orange juice, and salmon aquaculture sectors based on the impact methodologies described in Section 2.1 (Doublet et al. 2014). Those LCA studies contribute to verifying the relevance of the KEPIs considering their contribution to the environmental impact, the data availability, and the easiness of measurement. As a main result for the environmental impact assessment, the most relevant KEPIs for each chain have been selected to create a list of inputs and outputs. The following main group of inputs and outputs for each chain were described by Doublet et al. (2014):

Captured figure of the SENSE tool results for the climate change potential characterization results for the farm stage of the dairy production chain
-
i.
Beef and dairy chain: The production of feed, the emissions from the use of fertilizers, and the manure and diesel used for the agricultural machinery are important contributors to environmental impact, representing up to 70 % of the total potential impact for all the potential impacts selected (Doublet et al. 2013a).
-
ii.
Orange juice production chain: The four main contributors to the orange cultivation impact assessment are the electricity use for the irrigation (50 % of the climate change potential impact), the N-fertilizer and P2O5-fertilizer use (95 % of the most impact studied), and the production and application of pesticides (50 % of the total ecotoxicity potential impact). Regarding post harvesting stages, the most relevant aspects for the juice pressing are the electricity use and thermal energy use (representing up to 50 % of the total global warming potential). Moreover, the main contributor to the bottling process is the manufacture of the PET bottle (Doublet et al. 2013b).
-
iii.
Salmon aquaculture chain: Feed is identified as a KEPI for the hatchery and the aquaculture farm representing up to 60 % of the most environmental impact studied as well as water use which is also identified for the secondary processing. Additionally, organic matter to sea from the aquaculture farm is identified as a KEPI, representing 97 % of the total impact of marine eutrophication (Ingólfsdóttir et al. 2013)
Taking into account main results obtained in these studies, in Table 2 the selected set of KEPIs for the production of all the food and drink supply chains is shown (Landquist et al. 2013b). The selection was based on their relevance for the environmental impact in the studies. Also the previous bibliography and the expertise of the project partners were taken into account. For example, use of fertilizers has been defined as KEPI, where production of fertilizers is also taken into account into the tool. For the moment, the tool does not include all types of fertilizers used for the agriculture, although it is prepared for it.
Some assumptions were taken in order to adapt the datasets to the studies. Following main assumptions are described:
-
Inorganic and organic fertilizer emissions: Calculations for direct emissions due to the application of fertilizers are based on scientific emission models and not on real measurements. The nitrogen and phosphorous emissions have been calculated depending on the N and P kilogram applied. Nitrogen emissions calculated according to ecoinvent report 15 (Nemecek and Schnetzer 2011) and IPCC 2006 guidelines (de Klein et al. 2006) as follows: emissions to the air 1 % of N in NO x and NH3; and 0.75 % of nitrate; and 30 % of applied N to groundwater as nitrate.
-
Livestock emissions: biogenic GHG emissions from manure management and enteric fermentation were calculated depending on the type of animal and country according to Tier 1 formula from IPCC 2006 guidelines (Dong et al. 2006).
-
Feed ingredients: Vegetable ingredients of the feed were taken directly from the ecoinvent dataset; however, for the marine feed ingredients, datasets were created for the catching and processing of 15 different fish species, including the reduction processes of fish to meal and oil. Datasets on feed were created for average feed in Norway in 2010 (Hognes et al. 2011) and average Icelandic feed from 2013 (Olafsdóttir et al. 2014) Background data for those datasets regarding fuel use for fisheries was obtained from SINTEF in Norway and information on the resource use for the salmon feed reduction process was based on published results (DEFRA 2007; Winther et al. 2009).
Pesticide emissions: Due to the lack of specific inventory models for pesticide emission quantification, most of the food LCA studies assume that 100 % is emitted to the soil in accordance with ecoinvent approach (Nemecek and Schnetzer 2011).
-
Fuel emission from combustion: The emission of tractor operation was taken from ecoinvent report 15 (Nemecek and Kägi 2007) while data for the diesel combustion in vessel was taken from ecoinvent report 14 (Spielmann et al. 2007).
-
Refrigerated transports: Refrigerant agent needed for the refrigerated transport was taken from Emanuelsson approach (2010).
-
Packaging: For plastics containers (such as PET bottles or GPS foam), a combined dataset between the type of plastic and a plastic transformation was taken from ecoinvent, assuming also a percentage of material losing according to ecoinvent dataset. For glass, can, and film, direct dataset from ecoinvent was taken (Hischier 2007).
-
Waste water: Two different types of waste water have been taken from ecoinvent: one representing waste water with high organic load (assimilated to potato starch production effluent) and another representing low organic load (assimilated to sewage, unpolluted). The discharge of organic matter from marine based system was estimated using an average N discharge (41 kg N eq/1 ton fish) to the marine environment due to feces and uneaten feed per kilogram of live fish (Heldbo et al. 2013).
For KEPI collection, yearly data gathering system has been described in detail (Alvarez et al. 2013). In order to facilitate the data gathering, the tool offers the possibility to send the questionnaires to the main suppliers of the chain.
2.3 Common LCA framework
In order to create a common framework, a reference flow of kilogram edible product is recommended for all the food products. It is not foreseen to introduce any functionality to the calculations nor including distribution or food consumption.
For the system boundary, a cradle-to-gate limit has been selected, excluding retailing, consumption, and end of life processes. This reflects the fact that the tool is designed for internal use and for business-to-business communication.
The main idea of the tool is to enter data for a specific year of production. This makes it also possible to monitor the environmental performance between different years.
For the allocation, some procedures proposed in ISO are out of the scope of this easy to use tool for SMEs. However, allocation cannot be avoided and allocation rules should be made as simple as possible. Thus, economic allocation has been selected; however, the tool allows introducing manually the percentage of the allocation of different incoming materials, such as packaging or main ingredients, if these can be clearly assigned to one output.
Furthermore, social aspects are tackled in the tool. Therefore, a questionnaire with relevant aspects has been developed. The questions were focused on adherence to labor standards and national laws, and communication of the companies’ policy regarding labor standards. The questions also addressed workers’ rights to join trade unions, their employment conditions, wages, and working hours. Additionally, questions were included on the status of occupational health and safety training, training related to employees well-being, and the actions of the companies to address issues regarding the influence of the company on the local communities both concerning remedies and additional costs as well as offering opportunities to local people. A grading scheme was also developed but so far the results of this questionnaire have not been evaluated quantitatively (Olafsdóttir et al. 2015).
2.4 Validation of the tool
Once the tool was developed and prior to implementing the SENSE tool in companies, the tool was tested by checking the functionality of the user interphase and the performed calculations. The aim was to verify that the outcome of the tool calculations were comparable with the results obtained when using the same input data in a commercial software (SimaPro and GaBi).
The validation of the integrated SENSE tool was based on performing simplified environmental impact assessment representing three food chains (fruit juice, meat, and aquaculture fish) in different European regions. An acceptance criterion was defined of less than 10 % of variation in the impact characterization in comparison with a conventional LCA (Olafsdóttir et al. 2014). The first validation was based on the comparison between the results of the complete LCA and the results from the simplified SENSE tool (Olafsdóttir et al. 2014). A complete LCA takes into account more inputs to the system such as secondary packaging materials or auxiliary materials and also models for each case study the emissions from the substances emissions such as pesticides, fertilizers, or manure emissions.
The second validation of the tool was to assess the functionality with 23 food SMEs. The results of SENSE tool calculations for the products assessed from the SMEs were checked by exploring if the range of values obtained were within the range of earlier SENSE tool case studies that had been validated in the SENSE project. Additionally, literature values for similar products (e.g., raw and pasteurized milk, orange juice, salmon, and arctic char) were used for comparison. The methodology or impact characterization factors applied in some of the studies reported in the literature vary and therefore only the climate change impact was assessed in this second validation (Olafsdóttir et al. 2015).
3 Results
3.1 Development of the tool
Taking into account the impact assessment methodology and the set of KEPIs selected, a web-based tool, the SENSE tool, has been designed and developed with a common server and database allowing an active interaction between users. The developed tool aims to be used by food SMEs without a strong LCA background and to provide easy to be interpreted environmental information.
The tool compiles the information available at different levels in the food chain. The collected data are characterized and evaluated in order to obtain the key indicators associated with the evaluated product. This tool provides a common framework to users from different stages of the supply chain and by introducing a simplified set of production data they can compare respective environmental impacts. The tool has been designed in a user friendly way and very intuitive to facilitate its use by SMEs.
The tool is accessible via internet; therefore, it is not necessary to install any software, making its use even simpler. This computer application has been developed using Visual Basic.Net, on Visual Studio 2010. The database engine used is SQL Server 2008 R2, where all the application’s information is stored. As far as the application imaging, both design and pictures implemented were done using Photoshop CS 6 and Gimp 2.8.
The SENSE tool application calculates the environmental impacts related to the selected impact categories. The impact characterization can be shown for each functional unit (kg of product) or the production of 1 year. The results of the tool are presented in the following ways:
-
A.
Environmental impact per process and year. Those results are shown in a bar chart and show the impact generated for the selected environmental indicator and process. A table with the impact value is also shown under the graphic (Fig. 1).
-
B.
Complete impact analysis: For each impact category, a pie graph is shown with the contribution of each process to the total impact. Additionally, a histogram is also shown with the summary of all the impact and processes (Fig. 2).
Fig. 2 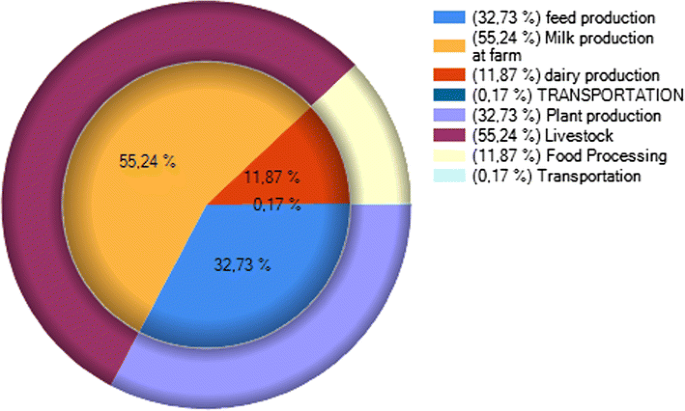
Captured figure of the SENSE tool results for climate change potential characterization for a dairy production chain expressed in pie chart
-
C.
Comparison between product’s environmental impacts. It is also possible to compare the impact of different product by process or by impact. When comparing the environmental impact by process, the weight of the different processes on the final impact of each product will be shown for each impact category. When comparing by impact, a complete graph will be shown comparing the final impact of each product.
-
D.
Evolution of the product impact. A line chart is shown with the evolution of the environmental impacts of the product along the years. With this data, the tendency of the environmental behavior of a given product could be assessed.
-
E.
Product benchmarking: In the future, this option would allow the user to benchmark its products internally (comparison between the companies own product in different years) and externally (with other similar products and between different companies). When selecting benchmarking option, a spider graph can show the deviation of the actual product impact assessment towards the average value for that product. For the moment, there is not enough data for the external benchmarking; however, the tool is ready for the future improvements.
-
F.
Coupled with those graphics, there is a possibility to extract the EID where a summary of main environmental results is described. The main objective of this document is to transmit the information along the B2B stakeholders involved in the food supply chains.

3.2 Validation of the tool
In order to ensure the functionality of the tool, main results of the complete LCA versus the SENSE tool results were compared. Although this comparison was made for the three selected chains, the results are just shown for juice and beef and dairy chain. For the aquaculture chain, the results of the complete LCA study performed were not comparable with the output from the SENSE tool since new datasets for feed had been implemented in the tool. Furthermore, organic emissions to sea were accounted for as BOD, nitrogen, and phosphorus per whole fish in the LCA study (Ingólfsdóttir et al. 2013). However, in the SENSE tool, this was simplified and only the release of nitrogen is accounted for based on published information (Heldbo et al. 2013).
The relative percentage difference between the environmental impacts calculated in the SENSE tool and the LCA on orange juice is below 10 % for some impact categories such as climate change, human toxicity, acidification, eutrophication terrestrial, eutrophication marine, abiotic resource depletion, and water depletion (Table 3). Moreover, the relative percentage difference between the environmental impacts of the SENSE tool and the LCA on Romanian beef is highly dependent on the impact category. Results for climate change, human toxicity cancer and non-cancer effects, ecotoxicity, freshwater, and land use had a difference smaller than 10 % for meat products (Table 3) (Olafsdóttir et al. 2014). The impacts with higher differences (eutrophication of freshwater, ecotoxicity of freshwater, and land use in orange use and acidification, terrestrial, freshwater and marine eutrophication, and water depletion in beef supply chain) are also due to differences in the data bases and the system boundaries as in the case of the aquaculture.
Moreover, a validation with 23 food SME’s was carried out. Overall, the results of the SENSE tool calculations of climate change for the products of the external companies fulfilled the testing criteria. The literature values for raw milk vary between 0.74 and 2.8 kg CO2 eq/kg raw milk (Doublet et al. 2013a) and the results obtained in the pilot studies are in line with the expected results from literature. The values for climate change were 1.40, 2.47, and 2.88 kg CO2 eq per liter raw milk. For aquaculture companies participating in the pilot studies, the results of the SENSE tool calculations for climate change impact for conventional net pen system were similar, around 2.4 kg CO2 eq/kg fish. The results are similar to earlier reported values by Ytrestöyl et al. for the 2010 feed (2.6 kg CO2 eq/kg). The land-based systems had higher impacts ranging from 3.20 to 5.1 kg CO2 eq/kg (Olafsdóttir et al. 2015). Comparison with other impact categories was not possible due to lack of references with the selected methodology. Most of the selected case studies for this comparison have been carried out with the CML or ReCiPe methodologies, both of them measure toxicity as 1,4 DB eq, while ILCD (EC 2013) and SENSE uses CTU. The same happens for example with the acidification, while CML and ReCiPe use kilogram SO2 eq, ILCD uses molc H+. Therefore, it is not possible to compare.
4 Discussion
4.1 Allocation procedures
The method used when distributing the environmental burden between the main product and its by-product can have a significant impact on the final results of a LCA (Svanes et al. 2011). Since the aim of the project is to obtain a simplified environmental analysis of the food and drink products, some limitations have to be accepted. Although it may be controversial, economic allocation is chosen in the SENSE tool as the default allocation approach which can be easily implemented for all production systems.
For the beef and dairy chain, the allocation procedures recommended by the international dairy federation (IDF 2010) to allocate the environmental impacts of beef and milk production at farm as well as the allocation matrix to distribute the environmental impacts of the individual dairy products are complex and time-consuming for somebody not familiar with life cycle assessment. However, the results for single dairy products are quite sensitive to the allocation approach chosen (Feitz et al. 2007). Feitz et al. (2007) suggested using economic allocation for inter-industry sectorial flows while Kim et al. (2013) allocated the incoming raw milk to the individual dairy products on a milk solids basis. Moreover, the allocation of environmental impacts to by-products is also an issue for the slaughtering process in the beef chain (Cederberg et al. 2009). These differences in the allocation methodology explain deviations of results in different tools and literature.
In the aquaculture chain, the use of economic allocation has been criticized as it does not reflect the biophysical properties of the production system and it is sensitive to changes in market prices (Pelletier and Tyedmers 2011; Svanes et al. 2011; Ytrestøyl et al. 2011). Mass allocation methods have been applied in studies on feed and aquaculture as well as fisheries (Boissy et al. 2011), while others have used gross nutritional energy (Pelletier et al. 2009) or economic allocation (Ellingsen et al. 2009). However, the use of by-products from environmentally costly productions such as livestock production or demersal fish trimmings in salmon feed production contribute substantially to the outcome of an LCA analysis in terms of energy use and CO2 emissions (Ytrestøyl et al. 2011). The economic allocation used in this case study gives a higher burden on the main product than if mass allocation would have been used. At the aquaculture farm, 10 % of the biomass at the farm is guts which are given away for free and therefore has zero environmental loads (Ingólfsdóttir et al. 2013).
The decision to use economic allocation rules for the SENSE tool may be the simplest approach for SMEs. However, since the SENSE tool offer the possibility to implement different allocation factors for each incoming product, this is a good approach that could be used if SMEs are willing to invest more time to obtain a more scientific environmental assessment.
4.2 Validation of the life cycle approach of the SENSE tool
As mentioned in Section 3.2, relevant differences were identified for some of the selected impacts when comparing the results from the SENSE tool and the SimaPro.
Differences identified in acidification and eutrophication during the fruit juice validation experience could be explained because the modeling of the emissions due to the land use and the application of manure as well as the additional data were taken into account in the complete LCA. Moreover, differences in the type of herbicides applied and the emissions from the land use explain the large deviation in the freshwater ecotoxicity and the freshwater eutrophication impact categories. In the SENSE tool, the modeling of the land use does not include the transformation from and to permanent crop. This explains the deviation in those impact categories (Doublet et al. 2013b).
For dairy and aquaculture products, the results of the earlier LCA case studies (Doublet et al. 2013a; Ingólfsdóttir et al. 2013) were not comparable with the SENSE tool calculations due to, e.g., difference in methodologies, allocation rules, or in background datasets applied (Olafsdóttir et al. 2014).
Overall, the methodology established for the SENSE tool does not replace complete LCA because the collection of data is simplified to be adapted to SMEs and, on the other hand, there is a limited amount of freedom degrees for the modeling of the studied system. However, this limitation is one of the objectives of the project itself, since all the studies are intended to be performed according to the same method in order to obtain comparable results.
4.3 Usefulness in SMEs
The testing of the deployment of the SENSE tool was performed by users in 23 companies in meat and dairy, fruit juice, and salmonid aquaculture sectors. The common impressions from the SMEs in all sectors indicate that the companies were at first reluctant to implement the SENSE tool into their company mainly due to lack of resources (time or people). However, when given support training and help to introduce data into the SENSE tool, the users agreed on several benefits of using the SENSE tool for sustainability assessment. Main benefits of the SENSE tool identified for the companies were as follows: (i) a user friendly tool that facilitates harmonized data gathering for life cycle inventory; (ii) benchmarking was considered a very interesting option (not implemented yet); (iii) the results can be used in sustainability reporting (environmental and social); (iv) aquaculture farms see benefit of carbon footprint calculations, to fulfill requirements of, e.g., the Aquaculture Stewardship Council standard; (v) the possibility to identify the hot spot of the processes; (vi) the possibility to use as a tool to improve suppliers performance.
While the milk and meat sector was least interested to participate in the testing, the aquaculture companies, mainly from Iceland, were most willing to participate. The willingness to test the tool in the aquaculture industry may be related to the fact that they are already under pressure to demonstrate their performance due to pressures from regulations, green accounting requirements, and upcoming standards. Data on the KEPIs that is needed to perform environmental impact assessment using the SENSE tool is therefore already available. In the meat and dairy sector as well as the fruit sector, the perception was that SMEs were reluctant to share data due to the fear of data misuse. In the juice sector, the lack of willingness is explained mainly by the lack of time and personal resources available for testing the tool. This is a common obstacle for the entire food SMEs, but the fruit sector is particularly seasonal and the time period where the testing was scheduled coincided with the peak activity. So, even though the companies are aware of the environmental issues, they could not invest time in testing a tool.
4.4 Using the SENSE tool for food sector
One of the main objectives of this project was to obtain a harmonized methodology to measure the environmental impact of the foods produced and consumed in Europe. For that purpose, case studies have been performed, but only in the previously mentioned three sectors and thus the results do not represent the whole food and drink sector. Therefore, it would be necessary to test this tool in other food sectors. Nevertheless, it is likely that the tool could be adapted to other food sectors, since the impact indicators and inventory flows were selected by taking also into account experience of experts and bibliography.
5 Conclusions
The SENSE tool has been designed to be suitable for SMEs in food and drink sector, and it has been shown by the testing companies that the objective has been achieved. However, it is important to highlight that the main aim is to obtain a simplified tool, and thus it would not be an alternative for the complete LCA studies in any case.
This tool is aligned with the new emerging initiative developed by the European Union Single Market for Green Products. This initiative is nowadays developing a new framework for measuring the “product environmental footprint” of all kind of good and services commercialized in the EU. Although the SENSE tool is not completely adjusted to this methodology, it is open for modifications in order to adapt it to the PEF initiative.
The integration of social aspects in product assessment is still not fully developed. Further research work is necessary in order to integrate this in a harmonized way according to CSR and UNEP/SETAC initiatives.
Finally, as a recommendation, it is important to highlight that there is a need to encourage food companies to include the environmental issues in the decision-making processes making the stakeholders of the food chains aware about the sustainability of their products.
References
Alvarez B, Kück M, Ramos S, Esturo R (2013) Standardised input of environmental information collection system. SENSE—Harmonised Environmental Sustainability in the European food and drink chain, Seventh Framework Programme: Project no. 288974. Funded by EC. Deliverable D 2.3 Biozoon Food Innovations GMBH, Germany
Boissy J, Aubin J, Drissi A, Van der Werf HMG, Bell G, Kaushik S (2011) Environmental impacts of plant-based salmonid diets at feed and farm scales. Aquaculture 321:61–70
Cederberg C, Sonesson U, Henriksson M, Sund V, Davis J (2009) Greenhouse gas emissions from Swedish production of meat, milk and eggs 1990 and 2005. SIK, The Swedish Institute for Food and Biotechnology, Göteborg
Curran M (2010) Biodiversity loss and life cycle assessment. http://www.lcaforum.ch/portals/0/df42/DF42-01%20Michael%20Curran.pdf LCA Discussion Forum 42. Lausanne, Switzerland
DEFRA (2006) Food industry sustainability strategy. FISS Secretariat, UK
DEFRA (2007) Sustainable production and consumption of fish and shellfish. Environmental impact analysis. Final report 9S6182
De Klein C, Novoa RSA, Ogle S, Smith KA, Rochette P, Wirth TC, McConkey BG, Mosier A, Rypdal K (2006) Chapter 11: NO Emissions from managed soils, and CO Emissions from lime and urea application. In: IPCC Guidelines for National Greenhouse Gas Inventories; Volume 4: Agriculture, Forestry and Other Land Use.54pp
Dong H, Mangino J, McAllister TA, Hatfield JL, Johnson DE, Lassey KR, de Lima MA, Romanovskaya A (2006) Chapter 10: Emissions from livestock and manure management. In: IPCC Guidelines for National Greenhouse Gas Inventories; Volume 4: Agriculture, Forestry and Other Land Use. 87pp
Doublet G, Ingólfsdóttir GM, Yngvadóttir E, Landquist B, Jungbluth N, Aronson A, Ramos S, Ólafsdóttir G (2014) Key environmental performance indicators for a simplified LCA in food supply chains. 9th International Conference LCA of Food San Francisco (USA)
Doublet G, Jungbluth N, Flury K, Stucki M et al. (2013a) Life cycle assessment of Romanian beef and dairy products. SENSE—Harmonised Environmental Sustainability in the European food and drink chain, Seventh Framework Programme: Project no. 288974. Funded by EC. Deliverable D 2.1 ESU-services Ltd.: Zürich. Retrieved from http://www.esu-services.ch/projects/lcafood/sense/
Doublet G, Jungbluth N, Flury K, Stucki M et al. (2013b) Life cycle assessment of orange juice. SENSE—Harmonised Environmental Sustainability in the European food and drink chain, Seventh Framework Programme: Project no. 288974. Funded by EC. Deliverable D 2.1 ESU-services Ltd.: Zürich. Retrieved from http://www.esu-services.ch/projects/lcafood/sense/
Ellingsen H, Olaussen J, Utne I (2009) Environmental analysis of the Norwegian fishery and aquaculture industry: a preliminary study focusing on farmed salmon. Mar Policy 33(3):479–488
Emanuelsson A, Skontorop Hognes E, Ziegler F, Sund V, Winther U, Ellingsen H (2010). Life cycle approach to Norwegian seafood logistics—new ways to model food transports. In Proceedings of the 7th International
European Commission (2013) Commission Recommendation of 9 April 2013 on the use of common methods to measure and communicate the life cycle environmental performance of products and organisations, Official Journal of the European Union, 2013/179/EU Retrieved from; http://eur-lex.europa.eu/legal-content/EN/TXT/PDF/?uri=CELEX:32013H0179&from=EN
Feitz AJ, Lundie S, Dennien G, Morian M, Jones M (2007) Generation of an industry-specific physico-chemical allocation matrix, application in the dairy industry and implications for system analysis. Int J Life Cycle Assess 12:109–117
Food SCP RT (2013) ENVIFOOD Protocol, Environmental Assessment of Food and Drink Protocol, European Food Sustainable Consumption and Production Round Table (SCP RT), Working Group 1, Brussels, Belgium
Frischknecht R, Steiner R, Jungbluth N (2009) The Ecological Scarcity Method—Eco-Factors 2006: a method for impact assessment in LCA. Federal Office for the Environment FOEN, Zürich und Bern
Goedkoop M, Heijungs R, Huijbregts MAJ, De Schryver A, Struijs J, van Zelm R (2009) ReCiPe 2008—a life cycle impact assessment method which comprises harmonised category indicators at the midpoint and the endpoint level. First edition. Report I: Characterisation. The Netherlands. http://lcia-recipe.net/
Guinée JB, Gorrée M, Heijungs R, Huppes G, Kleijn R, Koning A de, Oers L van, Wegener Sleeswijk A, Suh S, Udo de Haes H A, Bruijn H de, Duin R van, Huijbregts MAJ (2002) Handbook on life cycle assessment. Operational guide to the ISO standards. In: LCA in perspective. IIa: Guide. IIb: Operational annex. III: Scientific background. Kluwer Academic Publishers, ISBN 1-4020-0228-9, Dordrecht, 2002, 692 pp
Heldbo J, Rassmussen RS, Løvstad SH (2013) Bat for fiskeoppdrett i Norden bedste tilgængelige teknologier for Akvaculture I Norden TemaNord 2013:529. ISBN 978-92-893-2560-8 http://dx.doi.org/10.6027/TN2013-529
Hischier R (2007) Life cycle inventories of packagings and graphical papers. ecoinvent report 11. Swiss Centere for Life Cycle Inventories, Dübendorf
Hognes ES, Ziegler F, Sund V (2011) Carbon footprint and area use of farmed Norwegian salmon. SINTEF Fisheries and Aquaculture. Fisheries Technology. Report F21039
IDF (2010) A common carbon footprint approach for dairy—the IDF guide to standard lifecycle assessment methodology for the dairy sector. International Dairy Federation: Brussels, Belgium. http://www.idf-lca-guide.org/Files/media/Documents/445-2010-A-common-carbon-footprint-approach-for-dairy.pdf
Ingólfsdóttir GM, Yngvadóttir E, Ólafsdóttir G (2013) Life cycle assessment of aquaculture salmon. SENSE—Harmonised Environmental Sustainability in the European food and drink chain, Seventh Framework Programme: Project no. 288974. Funded by EC. Deliverable D 2.1 EFLA Consulting Engineers, Iceland
Jungbluth N (2000) Umweltfolgen des Nahrungsmittelkonsums. Dissertation ETH. Page: 284
Jungbluth N, Flury K, Doublet G (2013) Environmental Impact of food consumption and its reduction potential. The 6th International Conference on Life Cycle Management, Gothenburg (Sweeden)
Jungbluth N, Nathani C, Stucki M, Leuenberger M (2011) Environmental impacts of Swiss consumption and production: a combination of input-output analysis with life cycle assessment. Environmental studies no. 1111. ESU-services Ltd. & Rütter+Partner, commissioned by the Swiss Federal Office for the Environment (FOEN), Bern, CH
Kim D, Thoma G, Nutter D, Milani F, Ulrich R, Norris G (2013) Life cycle assessment of cheese and whey production in the USA. Int J Life Cycle Assess 18(5):1019–1035
Landquist B, Aronsson A, Esturo A, Pardo G, Ramos S (2013a) Key environmental challenges for food groups and regions representing the variation within the EU. SENSE—Harmonised Environmental Sustainability in the European food and drink chain, Seventh Framework Programme: Project no. 288974. Funded by EC. Deliverable D 1.1 SIK-Swedish Institute for Food and Biotechnology, Sweden
Landquist B, Ingólfsdóttir GM, Yngvadóttir E, Jungbluth N, Doublet G, Esturo A, Ramos S, Ólafsdóttir G (2013b) Set of environmental performance indicators for the food and drink chain. SENSE—Harmonised Environmental Sustainability in the European food and drink chain, Seventh Framework Programme: Project no. 288974. Funded by EC. Deliverable D 2.1 SIK-Swedish Institute for Food and Biotechnology, Sweden
Milà i Canals L, Romanyà J, Cowell SJ (2007) Method for assessing impacts on life support functions (LSF) related to the use of “fertile land” in Life Cycle Assessment (LCA). J Clean Prod 15:1426–1440
Muñoz I, Canals LM, Clift R (2008) Consider a spherical man. A simple model to include human excretion in Life Cycle Assessment of food products. J Ind Ecol 12(4):521–538
Nemecek T, Kägi T (2007) Life cycle inventories of Swiss and European Agricultural Production Systems. Final report ecoinvent V2.0 No. 15a. Agroscope Reckenholz-Taenikon Research Station ART, Swiss Centro for Life Cycle Inventories, Zurich and Dübendorf, CH retrieved from: www.ecoinent.ch
Nemecek T, Schnetzer J (2011) Methods of assessment of direct field emissions for LCIs of agricultural production systems, Data v3.0 (2012)
Olafsdóttir G, Doublet G, Kjeld A, Yngvadóttir E, Ramos S, Ingólfsdóttir GM, Esturo A, Landquist A, Pop B, Bogason S, Larrinaga L, Albinarrate U, Jungbluth N (2014) Pilot implementation of the SENSE tool: validation and functionality testing. SENSE—Harmonised Environmental Sustainability in the European food and drink chain, Seventh Framework Programme: Project no. 288974. Funded by EC. Deliverable D.4.1, University of Iceland, Reykjavík, Iceland
Olafsdóttir G, Keller R, Landquist B, Pop B, Yngvadóttir E, Gudmundsdottir RE, Kjeld A, Alvarez B, Ramos S, Esturo A, Larrinaga L, Albinarrrate U, Lane A, Jungbluth N, Bogason S (2015) SENSE tool deployment—report on the testing of SENSE-tool and EID scheme in food chains. SENSE—Harmonised Environmental Sustainability in the European food and drink chain, Seventh Framework Programme: Project no. 288974. Funded by EC. Deliverable D.4.2, University of Iceland, Reykjavík, Iceland
Pardo G, Ramos S, Zufia J (2012) Ecodesign of a chicken product through life cycle assessment methodology. In: 8th International Conference on LCA in the Agri-Food Sector, Rennes, France, 2–4 October 2012
Pelletier NL, Ayer NW, Tyedmers PH, Kruse SA, Flysjo A, Robillard G, Ziegler F, Scholz AJ, Sonesson U (2007) Impact categories for life cycle assessment research of seafood production systems: review and prospectus. Int J Life Cycle Assess 12:414–421
Pelletier N, Tyedmers P (2011) An ecological economic critique of the use of market information in life cycle assessment research. J Ind Ecol 15(3):342–354
Pelletier N, Tyedmers P, Sonesson U, Scholz A, Zeigler F, Flysjo A, Kruse S, Cancino B, Silverman H (2009) Not all salmon are created equal: life cycle assessment (LCA) of global salmon farming systems. Environ Sci Technol 43:8730–8736
Pfister S (2013) Regionalization in LCA. http://www.ifu.ethz.ch/ESD/education/bachelor/OeSA/regional
Posch M, Seppälä J, Hettelingh JP, Johansson M, Margni M, Jolliet O (2008) The role of atmospheric dispersion models and ecosystem sensitivity in the determination of characterisation factors for acidifying and eutrophying emissions in LCIA. Int J Life Cycle Assess 13:477–486
Ramos S, Vázquez-Rowe I, Artetxe I, Moreira MT, Feijoo G, Zufia J (2011) Environmental assessment of Atlantic mackerel (Scomber scombrus) in the Basque Country. Increasing the time line delimitation in fishery LCA studies. Int J Life Cycle Assess 6(7):599–610
Rosenbaum RK, Bachmann TM, Hauschild MZ, Huijbregts MAJ, Jolliet O, Juraske R, Köhler A, Larsen HF, MacLeod M, Margni M, McKone TE, Payet J, Schuhmacher M, Van de Meent D (2008) USEtox—the UNEP-SETAC toxicity model: recommended characterisation factors for human toxicity and freshwater ecotoxicity in Life Cycle Impact Assessment. Int J Life Cycle Assess 13(7):532–546
Solomon S, Qin D, Manning M, Alley RB, Berntsen T, Bindoff NL, Chen Z et al (2007) Technical Summary. In: Solomon S, Qin D, Manning M, Chen Z, Marquis M, Averyt KB, Tignor M, Miller HL (eds) Climate change 2007: the physical science basis. Contribution of Working Group I to the Fourth Assessment Report of the Intergovernmental Panel on Climate Change. Cambridge University Press, Cambridge, UK
Spielmann M, Bauer C, Dones R, Tuchschmid M (2007) Transport services. ecoinvent report No. 14. Swiss Center for Life Cycle Inventories, Dübendorf
Svanes E, Vold M, Hanssen OJ (2011) Environmental assessment of cod (Gadus morhua) from autoline fisheries. Int J Life Cycle Assess 16:611–624
Tukker A, Huppes G, Guinée J, Heijungs R, de Koning A, van Oers L, Suh S, Geerken T, Van Holderbeke M, Jansen B, Nielsen P (2005) Environmental Impact of Products (EIPRO). Analysis of the Life Cycle Environmental Impacts 23 Related to the Total Final Consumption of the EU25. Full Draft Report. Institute for Prospective Technological Studies (IPTS), 29 April 2005, 117 pp
Tyszler M, Kramer G, Blonk H (2014) Comparing apples with oranges: on the functional equivalence of food products for comparative LCAs. Int J Life Cycle Assess 19(8):1482–1487
Vazquez-Rowe I, Moreira MT, Feijoo G (2012a) Inclusion of discards assessment indicators in fisheries life cycle assessment studies. Expanding the use of fishery-specific impact categories. Int J Life Cycle Assess 17:535:549
Vazquez-Rowe I, Villanueva-Rey P, Moreira MT, Feijoo G (2012b) Environmental analysis of Ribeiro wine from a timeline perspective: harvest year matters when reporting environmental impacts. J Environ Manage 98:3–83
Vermeule SJ, Campbell BM, Ingram JSI (2012) Climate change and food systems. Annu Rev Environ Resourc 37:195–222
Winther U, Ziegler F, Skontorp Hognes E, Emanuelsson A, Sund V, Elligsen H (2009). Carbon footprint and energy use of Norwegian seafood products. Sintef Fishery and aquaculture Report, 89 pp
Ytrestøyl T, Aas TS, Berge GM, Hatlen B, Sørensen M, Ruyter B, Thomasses M, Hognes ES, Ziegler F, Sund V, Åsgård T (2011) Resource utilisation and eco-efficiency of Norwegian salmon farming in 2010. Nofima Report 53/2011, 66 pp
Ziegler F, Valentinsson D (2008) Environmental life cycle assessment of Norway lobster (Nephrops norvegicus) caught along the Swedish west coast by creels and conventional trawls—LCA methodology with case study. Int J Life Cycle Assess 13(6):487–497
Acknowledgments
The research leading to these results has received funding from the European Union’s Seventh Framework Programme under grant agreement no. 288974, SENSE—Harmonized Environmental Sustainability in the European Food & Drink Chain. Project website: http://www.senseproject.eu/
Author information
Authors and Affiliations
Corresponding author
Additional information
Responsible editor: Thomas Jan Nemecek
Rights and permissions
Open Access This article is distributed under the terms of the Creative Commons Attribution 4.0 International License (http://creativecommons.org/licenses/by/4.0/), which permits unrestricted use, distribution, and reproduction in any medium, provided you give appropriate credit to the original author(s) and the source, provide a link to the Creative Commons license, and indicate if changes were made.
About this article

Cite this article
Ramos, S., Larrinaga, L., Albinarrate, U. et al. SENSE tool: easy-to-use web-based tool to calculate food product environmental impact. Int J Life Cycle Assess 21, 710–721 (2016). https://doi.org/10.1007/s11367-015-0980-x
Received:
Accepted:
Published:
Issue Date:
DOI: https://doi.org/10.1007/s11367-015-0980-x