
Abstract
The OSIRIS-REx Camera Suite (OCAMS) will acquire images essential to collecting a sample from the surface of Bennu. During proximity operations, these images will document the presence of satellites and plumes, record spin state, enable an accurate model of the asteroid’s shape, and identify any surface hazards. They will confirm the presence of sampleable regolith on the surface, observe the sampling event itself, and image the sample head in order to verify its readiness to be stowed. They will document Bennu’s history as an example of early solar system material, as a microgravity body with a planetesimal size-scale, and as a carbonaceous object. OCAMS is fitted with three cameras. The MapCam will record color images of Bennu as a point source on approach to the asteroid in order to connect Bennu’s ground-based point-source observational record to later higher-resolution surface spectral imaging. The SamCam will document the sample site before, during, and after it is disturbed by the sample mechanism. The PolyCam, using its focus mechanism, will observe the sample site at sub-centimeter resolutions, revealing surface texture and morphology. While their imaging requirements divide naturally between the three cameras, they preserve a strong degree of functional overlap. OCAMS and the other spacecraft instruments will allow the OSIRIS-REx mission to collect a sample from a microgravity body on the same visit during which it was first optically acquired from long range, a useful capability as humanity reaches out to explore near-Earth, Main-Belt and Jupiter Trojan asteroids.
1 Introduction
The sample-return mission of the Origins, Spectral Interpretation, Resource Identification and Security–Regolith Explorer (OSIRIS-REx) must thoroughly characterize the near-Earth asteroid 101955 Bennu before being able to acquire a sample from a scientifically interesting location on its surface with minimal risk, either to the spacecraft or to mission success (Ajluni et al. 2015; Beshore et al. 2015; Lauretta 2015, 2016; Bierhaus et al. 2018; Lauretta et al. 2018). In addition, the mission team will map Bennu’s global properties, characterize its geologic and dynamical history, document the morphology and chemistry of the sample site, and determine Bennu’s spin, surface area, and thermal emission. To this end, the spacecraft includes within its instrument complement the OSIRIS-REx Thermal Emission Spectrometer (OTES), which will determine Bennu’s mineralogical and thermo-physical properties (Christensen et al. 2018); the OSIRIS-REx Visible and InfraRed Spectrometer (OVIRS), which will provide surface maps of interesting materials such as carbonates, silicates, sulfates, oxides, adsorbed water, and a wide range of organic species (Reuter et al. 2018); the OSIRIS-REx Laser Altimeter (OLA), which will produce a comprehensive topographic mapping of Bennu’s surface (Daly et al. 2017); the Radio Science experiment, which will use radiometric tracking data to estimate significant components of the gravity field (McMahon et al. 2018); the Regolith X-ray Imaging Spectrometer (REXIS), which will measure the abundances of key elements (Allen et al. 2013; Masterson et al. 2018); and finally the OSIRIS-REx Camera Suite (OCAMS), whose three imagers will visually record Bennu’s near-asteroid environment and surface at a sufficiently high resolution as to be able to document the presence of satellites and plumes, record spin state, enable an accurate model of its shape (Gaskell et al. 2008), and identify any surface hazards. The spacecraft and science teams will use these instruments to identify the presence of sampleable regolith on the surface, identify features useful to guide the spacecraft’s trajectory to the surface, document the sampling process itself, and confirm the existence of sample material inside the sampling head after the sampling event. Complemented by the Touch and Go Camera System (TAGCAMS), another three-camera suite, whose imagers will facilitate navigation to the target asteroid and confirm stowage of the sample (Bos et al. 2018), OCAMS enables the OSIRIS-REx mission to accomplish a feat rare in planetary exploration: to collect a sample from a microgravity body on the same visit during which it first acquires it visually at long range (Berry et al. 2013, 2015; McMahon et al. 2014; Antreasian et al. 2016; Clark et al. 2016; Getzandanner et al. 2016; Hamilton et al. 2016; Mario and Debrunner 2016; Scheeres et al. 2016; Dworkin et al. 2018; Hesar et al. 2017).
OCAMS will function primarily as a mission-critical scientific instrument on this journey. Its three imagers satisfy competing optical and radiometric requirements to carry out their primary task: acquiring images during each mission phase that will inform the operations of subsequent mission phases and provide key scientific data about the asteroid. These phases will include navigation and approach to the asteroid, various proximity-operations campaigns, and eventually, acquisition of the sample (Lauretta et al. 2018). OCAMS’ requirements were first established during the generation of the OSIRIS-REx Design Reference Mission (DRM) (Mink et al. 2014; Stevens et al. 2017). The DRM was in turn influenced by OCAMS’ design, capabilities, and functional redundancy. This feedback process was repeated until a mature DRM and comprehensive set of imaging requirements for OCAMS emerged. These requirements divided naturally between the three imagers while preserving a strong degree of functional overlap (Smith et al. 2013; Merrill and Williams 2016).
In addition to informing mission operations, the camera suite will also gather information scientifically interesting in its own right. For example the (Mapping Camera) MapCam will record color images of Bennu as a point source in wavelength bands related to the Eight-Color Asteroid Survey (ECAS). This imaging will connect Bennu’s ground-based point-source observational record to later surface spectral imaging at higher resolutions (Tedesco et al. 1982; Clark et al. 2011). It will also record color-filter images of Bennu’s surface that allow a high-resolution classification of its surface, contributing to the ranking of sample sites by scientific interest. The Sample Acquisition Verification Camera (SamCam) will document the sample site before, during, and after it is disturbed by the sample mechanism and image the sample head with millimeter resolution post-sampling in order to verify the process. The Polyfunctional Camera (PolyCam) is capable of detecting Bennu from several million kilometers away; its focusing mechanism will allow it to image the surface of the asteroid to ranges below 200 m at sub-centimeter resolutions.
Development of the camera suite was a collaboration between the University of Arizona’s (UA) Lunar and Planetary Laboratory and several other institutions, including the UA’s College of Optical Sciences (PolyCam optical train), Utah State University’s Space Dynamics Laboratory (detector read-out modules), Baja Electronics (electronics controller design), UA’s Steward Observatory (systems, mission assurance, configuration management, as well as mechanical engineering support), and Teledyne DALSA’s Custom Division (detector). Goddard Space Flight Center was responsible for providing NASA management and technical oversight and worked closely with Lockheed Martin Space Systems and the UA to define the interface between instruments and spacecraft.
2 Instrument Design
OCAMS supports OSIRIS-REx’s methodical approach to the surface of Bennu (Mink et al. 2014). Data gathered during a year of approach-phase and proximity operations will identify hazards in the asteroid proximity environment, characterize the asteroid’s gravity (through the determination of its shape), rotation, and surface states, and systematically reduce mission risks. Step by step, the OSIRIS-REx science team will determine the shape of the body, and develop safety-, deliverability-, sampleability-, and science-value maps (Nolan et al. 2013; Lauretta et al. 2018). The team will confirm the presence, within the prospective sample site, of material capable of being ingested by the sample head, during close-range reconnaissance passes. Next, during sampling campaign rehearsals, it will acquire images to verify the correct execution of the various steps. Finally, the process will culminate when spacecraft instrumentation, including OCAMS, verify the choreographed steps of the sampling event itself and acquire post-sampling images to confirm its success or failure. At each phase, and after each campaign, the science team will examine, analyze and compare the results of the imaging and other instruments with requirements for a successful sampling campaign to guide OSIRIS-REx’s path toward sample acquisition.
To support these operations, the OCAMS optical systems consist of two refractive optical systems of medium and low resolution (MapCam and SamCam, respectively) and one high-resolution reflecting system with a two-lens field corrector, plus a focusing mechanism (PolyCam). In several aspects, they share a heritage with the Surface Stereo Imager and Robotic Arm Camera on the Phoenix mission to Mars, the previous Surface Stereo Imagers on the Mars Pathfinder and Mars Polar Lander missions, and the three imagers on the Descent Imager/Spectral Radiometer on Cassini/Huygens (Smith et al. 1997; Keller et al. 2001; Tomasko et al. 2002; Lemmon et al. 2008). To accomplish the mission’s requirement to image the asteroid over a nine orders-of-magnitude variation in range to target, the three imagers span a factor of 25 in resolution and field of view (FOV) (Table 1), allowing mission planners a primary and a backup camera to image at any resolution or range short of the sample-acquisition event (Fig. 1). Figure 1 indicates the approximate focal ranges for nominal operations which correspond to PolyCam (180 m to infinity), MapCam (100 m to infinity), and SamCam (3 m to infinity). Resolution is defined here as a 3-pixel subtension on the focal plane. Figures 2, 3, 4 show the optical layouts of all three systems. This document describes them in more detail below. Our team constructed all refractive elements from the Schott radiation-hardened glasses BK7G18, F2G12 and K5G20, including the PolyCam field-correcting doublet (BK7G18 and F2G12).

OCAMS operational range resolution. Regions of OCAMS imager operation at different mission phases are plotted by resolution and range. Colored lines show the operating in-focus range of each camera: SamCam (blue); MapCam (green); PolyCam (purple). Vertical lines intersect with the solid colored lines and indicate a camera observation is possible at a specific range. A horizontal line intersecting at the same point gives the 3-pixel resolution at that range for that camera. Note: the SamCam focal range includes \(\infty\), but is not shown

MapCam lens design schematic. MapCam optical design displayed along with traces of key field rays. It is a 125-mm focal length, F/3.3 five-element rad-hard telephoto design. Glasses are labeled

SamCam lens design schematic. SamCam optical design displayed along with traces of key field rays. It is a 24-mm F/5.5 six-element rad-hard double-Gauss design. Glasses are labeled

PolyCam lens design schematic. PolyCam optical design displayed along with traces of key field rays. It is a 20-cm-wide aperture, F/3.15 Ritchey-Chretien telescope with a 629-mm focal length at infinity. Elements are identified. The focusing mechanism works by actuating Lens 1 of the field-correcting doublet
The camera suite’s extensive (PolyCam), or limited (MapCam, SamCam), refocus capability is a feature that addresses the mission’s variation in range to target. Figure 1 shows it as the blue and green dots along the SamCam and MapCam curves, respectively, as well as the continuation of the magenta PolyCam curve from the right edge of the figure down to 200 m. For each imager, altering the optical train enables it to operate at additional ranges in support of mission objectives. Meanwhile, the camera team permanently set the position of each detector during alignment.
Actuating the first of its two refracting field corrector lenses over a 5.7-mm operational range enables the PolyCam’s refocusing capability from infinity to ∼180 m, using a continuously variable mechanism enabled by four gears (Figs. 5–6). A motor drives the system, identical to those that drive the MapCam and SamCam filter wheels. A single focus step corresponds to one-third of a shutter gear rotation, 180 motor steps. The full mechanical range includes 40 different shutter rotations, while the operational range has 25 different optically useful shutter rotations.

PolyCam focus mechanism exploded view. The PolyCam focus mechanism contains a threaded hub, holding a lens, that leverages itself against grooved rollers as it is advanced back and forth along an optical axis by a 56-tooth gear. This gear is driven by a 28-tooth idler gear which is itself driven by a smaller (20-tooth) geared shaft rotated by a stepper motor. The large gear, in its turn, rotates a shutter gear (15-tooth)

PolyCam focus mechanism disassembled. The PolyCam focus mechanism is shown partially disassembled, allowing a view of the mounting arrangement for the various components. Lens 1 on the right-hand side, one of a field-correcting doublet, appears blue in the image, mounted to the baffled threaded hub (not seen). Lens 2 is seen on the left, next to the 15-tooth gear that enables the shutter to be driven
Rotating a filter of different thickness into the optical path between the focusing optics and the detector refocuses the MapCam. The SamCam refocuses by rotating in a diopter lens in its filter wheel, which is positioned in front of the focusing optics. These enhancements allow focused imaging at 30-m and 2-m ranges for the MapCam and SamCam, respectively (Figs. 7–8). For the MapCam, four medium-width color filters allow high-resolution and high-signal spectral characterizations of the asteroid both as a point source and as an extended object. For the SamCam, two additional copies of the same Panchromatic filter back up the primary Pan filter in case dust obscures it during the initial sampling attempt.

MapCam filter definition. MapCam filters are identified by index position, label, and motor step position. The filter wheel complement is represented by two blocking positions, one Panchromatic (Pan) position, four color filters, and a refocusing plate which allows in-focus operation at a range of 30 m

SamCam filter definition. SamCam filters are identified by index position, label, and motor step position. The filter wheel is mounted externally to the optical system. Three identical Pan filters allow imaging during three sampling attempts even if an earlier attempt causes contamination severe enough to blanket the glass plates with regolith dust
To reduce complexity, all three cameras possess identical focal planes, a \(\mbox{1k}\times\mbox{1k}\) frame-transfer Charge-Coupled Device (CCD) array (Fig. 9). The development team removed this detector’s cover glass in order to reduce optical ghosting. The common Camera Control Module (CCM) (Fig. 10) runs these systems. The dual-redundant CCM includes primary and redundant power supplies, motor/heater drivers, and controller boards, which interface both to the spacecraft and their detector assemblies. The CCM operates all mechanisms, heaters, and light-emitting diodes (LEDs) used for indexing and calibration. It also gathers housekeeping temperatures, voltages, currents, and software/hardware states.

OCAMS detector (Teledyne DALSA). The Teledyne DALSA detector, used at the focal plane of all three OCAMS imagers, is shown in this microscope image. A frame transfer device, its active area is the brighter square in the image, while the masked storage region is located just below. Tiny bottle-shaped output gate structures can be seen left and right near the bottom. Typically provided with a cover glass, the detectors were used in OCAMS without the glass cover in order to reduce scattered light

OCAMS Camera Control Module (CCM). The OCAMS electronic control module is shown in this image, taken during its final assembly. It is comprised of a dual-redundant three-board set, mounted horizontally, primary triplet above and redundant triplet below. Within each group of three, the data processing unit is mounted on top, the motor/heater board in the middle, and the power board on the bottom. Connections are provided (1) to each side of the spacecraft Command and Data Handling (C&DH) from both primary and redundant, allowing four separate parallel links, if needed; (2) to all three cameras’ data interfaces; (3) to all three cameras’ motors and heaters; (4) to spacecraft power and all three cameras’ power connections. Spacecraft connectors are larger; camera connectors are smaller
The three OCAMS imagers mount on the \(-\mbox{X}\), \(+\mbox{Y}\) quadrant of the OSIRIS-REx science deck (Fig. 11, Lauretta et al. 2018, Fig. 11). Table 2 lists their coordinates in the S/C system. The MapCam sits closest to the science deck’s edge; the SamCam mounts—its optical axis tilted—close to the SRC so as to view the deployed Touch And Go Sample Acquisition Maneuver (TAGSAM) arm. The PolyCam sits between MapCam and OTES.

OCAMS mounting configuration. The OSIRIS-REx Camera Suite shown as mounted to the spacecraft’s science deck during thermal vacuum test operations. The spacecraft’s coordinate system is defined with the \(+\mbox{Z}\) axis pointing normal to the science deck, upward through the center of the Sample Return Capsule (SRC) and the \(+\mbox{X}\) axis pointing outward through the high-gain antenna. OCAMS, the three imagers of which are circled, is located on the \(-\mbox{X}\), \(+\mbox{Y}\) quadrant of the science deck. Largest is the PolyCam; next to it is the MapCam and closest to the SRC is the SamCam. Credit: Lockheed Martin Space Systems
In the following, we describe each of the three imagers in greater detail.
2.1 PolyCam
The OSIRIS-REx Polyfunctional Camera, PolyCam, is a 20-cm-wide aperture, F/3.15 Ritchey-Chretien telescope. When imaging at infinity, it possesses a focal length of 629-mm and a plate scale of 13.5 μrad/pixel. At 200-m range its focal length is 610-mm and its plate scale is 13.9 μrad/pixel. Its field of view is 0.8° wide (Table 1). Figure 12 shows a view which emphasizes the sharply angled sugar scoop baffle.

OSIRIS-REx Polyfunctional Camera (PolyCam). PolyCam is shown—minus its thermal dressing—in a perspective view that emphasizes the sharply angled sugar scoop baffle. The back face of the secondary mirror is visible within the telescope’s dark interior
The optical design depicted in Fig. 4 combines several elements:
-
1.
The OCAMS instrument team constructed the slightly hyperbolic primary (\(K = -1.27\)) and the strongly hyperbolic secondary mirror (\(K = -10.4\)) from Zerodur, the low coefficient of thermal expansion (CTE) lithium-aluminosilicate glass ceramic produced by Schott AG. The back surface of the primary mirror has a double arch structure mounted to the 6061-T6 aluminum base housing using bi-pod flexures made of Invar 36, another low CTE material. The bottoms of the bipod flexures bolt to the base housing, while the tops bolt to three pucks, also made of Invar 36, bonded to the mirror. Both Invar 36 parts were heat-treated after rough machining and again after final machining.
-
2.
The optical support tube (OST), also made of Invar 36, maintains the primary and secondary mirrors at a precise distance from each other to tight tolerances over the operational temperature range of the camera. The OST is scalloped at its bottom-edge mounting surface; 12 tongues provide compliance at the mounting interface between the dissimilar materials of Invar 36 and Al. Designers and machinists laser welded annular stray light control vanes and a secondary mirror hub with a four-vane spider, also made of Invar 36, to the OST.
-
3.
A focusing mechanism, constructed inside a 6061-T6 aluminum case, includes a two-element radiation-hardened field corrector and actuates the first element (Figs. 5 and 6). The focus mechanism also rotates a calibration/solar-blocking shutter in and out of the optical axis.
-
4.
A stray light control sugar scoop baffle with its own annular stray light control vanes bolts to the top of the OST above the secondary mirror spider. Primary and secondary mirror stray light control baffles, made of Ultem 2300, bolt through the primary mirror to the focus mechanism and to the secondary mirror spider hub, respectively. Aeroglaze Z307 paint coats all inside surfaces black.
-
5.
The base housing accommodates the common OCAMS detector assembly package. Each assembly consists of three flex-connected circuit boards folded into a compact installed configuration. The design is similar in layout and concept to the MapCam and SamCam detector assemblies.
The PolyCam’s focus mechanism accommodates range-to-target changes during mission imaging campaigns. In early concepts, refocusing the PolyCam used glass plates, mounted on a heritage filter wheel, which allowed a small number of finite ranges to be in focus. That concept would have permitted the telescope to focus at only a few object ranges and significantly constrained spacecraft operations. As a result, the refocusing plates were replaced by the focus mechanism concept, which greatly lowered operations risk.
The focus mechanism is capable of 8.3 mm of total travel, 2.6 mm more than its operational range of 5.7 mm. As the mechanism motor moves lens 1 through its full range of travel to achieve focus, it simultaneously rotates a sun-blocking shutter in and out of the optical path. Over the full range of travel, the shutter moves into and out of the field of view some 40 times. This makes a shutter available to block the beam with a motor displacement that takes only a few seconds throughout the travel interval. The flight software exploits this fact when safing the camera: it always moves to the nearest shutter position.
The sun-blocking shutter—made of 6061-T6 aluminum—is shaped like a circular wedge with an angular width of 85°. Over the full range of travel it blocks the beam about one-fourth of time (i.e., the system renders about 23% of the potentially available focus positions inaccessible to the camera.) The spacecraft’s flight software controls its operation directly, as with all OCAMS mechanisms, through the CCM, by issuing a dynamically alterable command (Table 3). This flexibility is useful when the range to surface changes frequently (e.g., during the reconnaissance phase). The focus position can be adjusted dynamically based on ranging measurements provided to the spacecraft flight software (FSW) by the Guidance Navigation and Control (GNC) subsystem. For simplicity and uniformity of operation, each of the PolyCam’s 40 accessible shutter rotations divides into three valid focus positions, corresponding to shutter positions 120° apart. A single table defines and controls the focus mechanism’s operation.
The PolyCam will support mission operations at several different ranges to the asteroid, each with its own resolution and sensitivity requirements. Acquiring the asteroid Bennu during the Approach phase requires the PolyCam to image an object of magnitude 12. As the spacecraft nears the surface of the asteroid, major campaigns involving the PolyCam will occur at ranges of 3.2 km (Detailed Survey Baseball Diamond), 750 m (Orbital B Site-Specific Surveys), and 225 m (Reconnaissance). During the Reconnaissance phase, the PolyCam will image prospective sample sites and resolve objects less than 2 cm in diameter. This dimension corresponds to that of the maximum-sized regolith unit that can be successfully ingested by TAGSAM. Additionally, the PolyCam will back up the MapCam in its mapping, shape determination, and optical navigation functions.
A passive thermal design cold-biases the PolyCam. As such, a radiative thermal balance at a typical time throughout the mission drives it colder than an optimum operating temperature. Thus, it requires survival heat—provided by heaters controlled by the spacecraft itself—to actively maintain a desirable temperature. A radiator pointed to space radiates the heat produced by its detector electronics; four survival heaters controlled by the spacecraft flight software on two different circuits (CCD, focus mechanism, read-out electronics, and secondary mirror) keep critical components of the PolyCam warm when not in use. Four redundant operational heaters controlled by the OCAMS flight software (CCD, focus mechanism, base/primary mirror, and focus motor) heat the optics, electronics, and mechanisms during operations. Thermally insulating flexures decouple PolyCam from the spacecraft to maximize the effect of on-camera radiating surfaces and heaters. Table 4 lists the resulting predicted flight operating temperatures for the various subsystems.
Designers used flexures at several locations throughout the camera to connect parts of the camera made from materials with dissimilar CTE: (1) Deck mounting duckbill-shaped flexures (Ti 6Al-4V) mount the 6061-T6 aluminum base housing to the carbon fiber spacecraft science deck. (2) Three Invar-36 bi-pod flexures connect the Zerodur primary mirror to the base housing. (3) The scalloped edge of the Invar 36 OST provides compliance to the base housing. In addition to providing compliance between materials with mismatched CTE, designers used Z-shaped flexures to provide compression and keep refractive optics in place. Near-zero-expansion materials like Zerodur and Invar 36 largely maintain separation between optics, the most important of which is the primary–secondary separation distance. In addition, the wide range of thermal environments where the PolyCam must perform requires an athermalized design, i.e., one whose component CTE’s compensate for each other’s displacements in a controlled manner. The combined effect is to minimize net displacements between the system’s different optical components induced by temperature changes.
2.1.1 Focus Mechanism Operation
The PolyCam focus mechanism uses a stepper motor to power a system of four gears that rotates a threaded helical hub holding lens 1 against a system of grooved rollers (Figs. 5 and 6). The action of moving lens 1 closer to the secondary mirror and away from lens 2 reduces the refractive power of the doublet and increases the PolyCam focal length. The object distance which results in best focus at a fixed image plane moves toward infinity. While the motor drives the lens 1 hub it also drives the shutter, which blocks external light from the detector. The side of the shutter facing the detector, grit-blasted to provide a matte finish, acts as a quasi-Lambertian reflector for a pair of green LEDs to provide an internal flat field. These LEDs are positioned on either side of the stepper motor below the shutter blade. The camera team can use this internal calibration source to monitor changes in the detector spatial responsivity due to aging or radiation damage.
The linear travel range of the threaded hub corresponds to an operating focus range from 180 m to slightly beyond infinity. The focus mechanism leaves about 1.3 mm of margin (corresponding to about seven shutter rotations) at either end to accommodate temperature and workmanship-related resets of the PolyCam focus induced by launch vibration. The ability to focus on targets beyond infinity allows a simple through-focus test to very precisely determine best focus. Figure 13 presents the curve describing the correspondence between motor step position and in-focus range.

Focus mechanism range (m) dependence upon motor step position. The relationship between focal range and focus mechanism absolute motor step position is shown here. The dependence is a nonlinear one, where the focus changes most dramatically with motor position at near ranges. The PolyCam can be said to be in good focus at a particular range if the motor is positioned within a horizontal range corresponding roughly to half a division, or around 500–600 motor steps
The spacecraft team has loaded the PolyCam focus table into flight software and can use it to enable the automatic refocusing of the PolyCam in a stepped fashion as the range to target changes.
2.2 MapCam
The MapCam is a 125-mm focal length, F/3.3, five-element, radiation-hardened refractive system based on a telephoto lens design (Figs. 2 and 14). It possesses a 68-μrad/pixel plate scale, a 4° field of view, and incorporates a filter wheel. Its best focus ranges from 125 m to infinity (Table 1). It adds one refocusing filter that adjusts focus to a 30-m range (Fig. 1).

OCAMS Mapping Camera (MapCam). The MapCam’s cylindrical housing contains its lens cell and filter wheel. It mounts atop a base similar to that of the other two imagers, which contains the detector assembly and supports a sugar-scoop baffle and two white radiating areas
A medium-resolution imager, MapCam’s optical design consists of:
-
1.
A fore-optics positive-negative achromatic doublet and a rear-optics triplet consisting of two positive elements and one negative element (Fig. 2)
-
2.
An eight-filter wheel with one panchromatic filter thickness optimized for operation at ranges between 125 m and infinity and another optimized for focus at ranges between 25 and 35 m (Fig. 7)
-
3.
Two sun-safe blocking plates, designed to provide a position that prevents light from reaching the detector. One of these blocking positions can also serve as an on-board flat-field tracing calibration position when illuminated on their detector side by on-board green LEDs.
-
4.
Four 60- to 100-nm-wide color filters with passbands based on the Eight-Color Asteroid Survey filter passbands (Tedesco et al. 1982); the thicknesses of the filters partially compensate for chromatic aberrations of the MapCam optics over their spectral band and to provide best focus for operation at ranges between 500 m and infinity
The MapCam’s mechanical design matches the thermal expansion of the three types of radiation-hardened lens material (N-BK7G18, N-F2G12, and N-K5G20) to a titanium Ti6Al4V lens cell and lens flexures. The 6061-T6 Al base contains the detector read-out assembly and mounts on Ti6Al4V thermally isolating duckbill deck flexures.
The MapCam’s two Pan filters use the same coating as the PolyCam and SamCam to achieve transmission between 500 and 800 nm (Fig. 15). One achieves a focus from 125 m to infinity, and the other near 30 m. Three of the four color filters (v, w, x) align exactly with several filters in the Eight-Color Asteroid Survey (ECAS) filter set. The need to improve optical and radiometric performance and minimize aging effects due to radiation shifts the b filter toward longer wavelengths from the ECAS blue filter. The MapCam backs up the PolyCam for asteroid acquisition and sub-cm imaging by reducing the ranges of such observations from 2000000 to 500000 km and from 200 to 30 m, respectively. To carry out the latter observation, the MapCam uses its Pan 30-m filter.

OCAMS MapCam filter transmissions. OCAMS MapCam filter transmission curves (B = dark blue, V = green, W = red, X = brown, Pan = black) compared to measured solar relative spectral irradiance (gold), general detector quantum efficiency (magenta), and theoretical laboratory relative spectral irradiance (light blue)
MapCam’s parameters will allow it to survey Bennu from a safe and convenient stand-off distance. The whole surface—northern and southern hemispheres—can be mapped at less than 1-meter resolution by a campaign consuming less than 9 hours while Bennu spins through two rotation periods.
Figure 15 shows the transmission curves of the four color filters (B, V, W, X), which it compares to the solar spectrum, the OCAMS detector’s quantum efficiency, the Pan filter, and a typical laboratory blackbody spectrum (quartz-tungsten halogen light filament). The filters possess high transmission in band and sharp cutoffs to minimize their optical ghosting potential and to have large out-of-band blocking. The wide-band filters will achieve multiple purposes:
-
1.
To acquire disk-integrated color observations of the asteroid’s phase function and light curve and determine how these relate to previous Hubble Space Telescope and ground-based studies of Bennu as a point source
-
2.
To provide high-spatial-resolution color band-ratio maps that differentiate and classify the asteroid’s surface into color-units relatable to the more detailed classification performed by OVIRS
-
3.
To use the color-unit classes to rate the various prospective sample sites as higher, or lower, science-value targets
-
4.
To connect disk-integrated color observations of asteroids directly to their surface resolved properties, thereby aiding in the spectral interpretation of asteroid color data from ground-based observations
The B filter will gauge the degree of radiation damage that the asteroid has experienced in its lifetime. Some researchers feel that long-term space weathering on organic asteroids may make them slightly bluish (Chapman 1996; Kaňuchová et al. 2012; Lantz et al. 2013; Fornasier et al. 2014; Moroz 2004). Bennu’s color, spectral shape, and albedo are consistent with B-type asteroids, a class characterized by spectral enhancement of its blue reflectance (Clark et al. 2011). The V and X filters will establish a continuum through the visible and near-infrared light reflected from Bennu’s surface. The flux observed in the W filter compared to V–X will provide a diagnostic for the presence of iron-bearing phyllosilicates (hydroxyl sheet silicate minerals) in Bennu’s regolith. It is well-aligned with an established broad, solid-state absorption feature near 710 nm (Vilas 1994; Clark et al. 2011).
MapCam mounts to the \(-\mbox{X}\), \(+\mbox{Y}\) quadrant of the OSIRIS-REx science deck, similarly to PolyCam, but 10 cm closer to the high-gain antenna (\(+\mbox{X}\)) and 25 cm further out toward the \(+\mbox{Y}\) edge of the deck (Fig. 11 and Table 2 from this paper and Figure 11 from Lauretta et al. 2018). MapCam possesses a passively cold-biased thermal design that uses two radiators (Fig. 14). Three survival heaters counterbalance these radiators under the control of the spacecraft flight software (CCD, lens assembly, and read-out electronics) and four operational heaters controlled by the OCAMS controller software (filter wheel motor, lens assembly, filter wheel housing, CCD). Of the two radiators, one is a dedicated plate, and one is a painted area on the upper portion of the riser housing. Predicted flight temperatures can be compared in Table 4.
2.3 SamCam
SamCam is a 24-mm F/5.5 radiation-hardened refractive system (Fig. 16). It possesses a plate scale of 354 μrad/pixel and a field of view of 20.8°. Its primary imaging activity occurs when the spacecraft approaches the surface of the asteroid. Its nominal best-focus range is ∼3–30 m, as shown in Fig. 1.

OCAMS Sample Acquisition Camera (SamCam). The SamCam cylindrical housing contains its lens and filter wheel and is mounted on a base containing the detector assembly similar to that of the other two imagers. The radiator is the vertical plate; the filter wheel motor protrudes upward from the center of the housing; and the entire assembly is mounted at angle of 9.4° from vertical in order to have an optimum view of the TAGSAM arm while it is elongated into its sampling position
This relatively low-resolution imager features:
-
1.
A five-element refractive system based on a double-Gauss design (Fig. 3)
-
2.
A six-position filter wheel positioned externally to the optical cell (Fig. 8). This filter wheel houses:
-
a.
Three identical panchromatic filters (500–800 nm bandpass)
-
b.
Two blocking plates, one of which doubles as a calibration tracing system when illuminated by on-board LED’s, allowing the calibration beam to travel through the entire optical system, in contrast to MapCam and PolyCam
-
c.
One diopter lens that allows imaging at a distance of 2 m
-
a.
-
3.
The common OCAMS detector package
Through one of its three Pan filters SamCam will image the 15–20 minute sampling event at the highest cadence possible (around 4 images every 5 seconds) in order to capture the moment of sample acquisition, including the activation of the nitrogen canisters. Post-TAGSAM, the camera will acquire images to verify the presence of sample external to the sampling head and determine if particles larger than 5–6 mm are present. Such particles could interfere with the insertion of the TAGSAM head into the sample return capsule (SRC).
SamCam mounts closer to the SRC than either of its siblings, reflecting its primary task of observing the deployed TAGSAM head and sample site during sample acquisition. Unlike either the MapCam or PolyCam, which are collinear with the \(+\mbox{Z}\) axis, the SamCam tilts 9.4° within the Y–Z plane toward the \(-\mbox{Y}\) direction in order to maintain a view centered on the TAGSAM head when the sample arm is fully extended.
Because of its position on the deck, SamCam does not thermally couple to space as well as the other two cameras. Its thermal inertia will keep it cooler for longer when the spacecraft approaches the hot surface of Bennu. Otherwise, its thermal design resembles that of the other two cameras, using radiators and heaters to maintain a temperature range for the optics, electronics, and detector around 0°C. It makes use of two survival heaters (CCD and read-out electronics) and four operational heaters (lens assembly, filter wheel housing, CCD, and filter wheel motor). Predicted flight temperatures can be observed in Table 4.
2.4 Electronics and Software
OCAMS consists of several electronics subsystems controlled by software and firmware that:
-
1.
Will act to record an optical image of an external scene, digitize it, packetize it, and transfer it to the spacecraft’s Data Telemetry and Command Interface (DTCI);
-
2.
Will operate a network of housekeeping sensors monitoring temperature, voltage, current, mechanical position, and software state to record their values at periodic intervals, package them, and submit them to the spacecraft both as separate housekeeping telemetry packets and as ancillary housekeeping information bundled with each recorded image; the latter populates the header of each OCAMS image, whose native format is FITS (Flexible Image Transport System);
-
3.
Will actuate three motors that operate three mechanisms, one for each camera; two of them are filter wheels; one is a focus mechanism;
-
4.
Will supply and regulate power to visible Light-Emitting Diodes (LEDs) as part of an in-flight calibration tracing system;
-
5.
Will supply and regulate power to infrared LEDs which illuminate fiducials to enable the deterministic control and positioning of the camera mechanisms.
OCAMS’ major electronic subsystems comprise the detectors, the Detector Assemblies (DA), and the CCM itself. Field-programmable gate arrays (FPGAs) control the last two. The detector assemblies and detectors combine with the optics into the three sensor heads. Figure 17 displays system functionality and subsystem relationship as a block diagram. It can be seen that \(3 \times 2\) boards occupy the CCM Chassis: two redundant central processing unit (CPU) boards, two Motor/Heater boards, and two low-voltage power supplies (LVPS).

OCAMS system block diagram. Six boards occupy the CCM chassis: primary and redundant CPU boards, Motor/Heater boards, and low-voltage power supply (LVPS) boards. They control operation of the detector assembly, mechanisms, lamps, and heaters of the three sensor heads and receive input from dozens of sensors that monitor temperature, voltage, current, mechanical position, and software state. All information is digitally stored and packaged and then sent to the spacecraft’s command and telemetry interface
2.4.1 Camera Control Module
The CCM (Fig. 10) services and directs the three OCAMS sensor heads. It will use commands submitted through the spacecraft virtual machine language (VML) engine to operate the three OCAMS imagers throughout the mission (Table 3 shows the list of commands). The CCM can operate through either a primary or redundant side (Fig. 17). In between commands, it regulates power, monitors the health of all OCAMS subsystems, maintains control of all operational (as opposed to spacecraft-controlled survival) heaters, and, every 2 seconds, collects and sends housekeeping data to the spacecraft to relay to the ground.
Running on the CCM, the OCAMS flight software will accept commands from the spacecraft and control the operation of the various subsystems: the detector assemblies, mechanisms, operational heaters, and calibration tracing lamps. It will collect and transmit the housekeeping and imaging packets. Spacecraft commands will initiate detector assembly power-on and entry into standby mode. Imaging can be collected through either of the detector’s two taps or through both at once. Using the detector assembly’s own digital processing front-end, the CCM can record detector read-out diagnostic information and image test patterns. It can read and write detector read-out registers and dump memory locations. And it can provide data that can be used to characterize both vertical and horizontal charge transfer efficiency through an extended-pixel edge response (EPER) technique.
The CCM communicates to each camera detector assembly (DA) through a synchronous, Low-Voltage Differential Signaling (LVDS), serial interface as defined in ANSI/TIA/EIA-644. It provides each DA with \(\pm24~\mbox{V}\) and \(+\mbox{5}~\mbox{V}\) regulated power rails. Each DA begins functioning within 10 seconds of turn-on. A menu of 4-byte commands provides control.
An 8051 microcontroller IP processing core hosted on an Actel RTAX-2000 Field-Programmable Gate Array forms the core of the CCM architecture. The OCAMS electronics design team selected this architecture for its simplicity, speed, and heritage. The implementation divides into redundant sets of three boards each: a Data Processing Unit (DPU), a Low-Voltage Power Supply (LVPS), and a motor/heater interface/driver. Both high-speed data links, between DA and CCM, and between CCM and spacecraft, are LVDS interfaces. Clocks running at 20- and 24-MHz frequencies, respectively, provide a time reference for DA/CCM and CCM/spacecraft interfaces. Internally, the CCM FPGA clocks itself at 36 MHz.
The Instrument team chose the parts used by both CCM and DA under a strict regime controlled by Goddard Space Flight Center (GSFC) EEE-INST-002 and PEM-INST-001 (Rev 2007), as well as a parts control board (PCB). The PCB created and maintained a Parts Identification List (PIL) and a Project-Approved Parts List (PAPL). Reasons for rejection included insufficient radiation tolerance, either to proton radiation or low-dosage ion radiation, or insufficient thermal tolerance. The team tested others, including detectors and LEDS, in order to demonstrate sufficient tolerance to solar proton radiation.
As mentioned above, the CCM outputs some 97 housekeeping variables every 2 seconds as an independent data set Application Process ID (APID) 75 or attached to an imaging data set (APIDs 76–78). These header entries include temperatures, voltage and current states, lamp and mechanism states, software state, and key software variables.
In contrast to the OCAMS sensor heads, the CCM mounts on the underside of the spacecraft instrument deck and couples to it thermally.
2.4.2 Detector Assembly
The DAs were provided by Space Dynamics Laboratory at Utah State University in Logan, UT. They consist of three boards each: one hosting the interface, LVDS drivers, and Actel RTAX-1000 FPGA; one containing the CDS (Correlated Double Sampling) Analog-to-Digital (A/D) converter signal processing chip, the clock drivers, regulators, and analog ground; and the third, a D-shaped board, mounted to intercept the optical axis, which contains the CCD. The D-board provides CCD bias voltages, video signal buffers, and the CCD interface. A Coordinate Measuring Machine precisely measured the position of the light-sensitive portion of the chip to titanium inserts bonded to the DA board.
The analog front-end device—the Texas Instruments LM98640W-MLS dual-channel 14-bit signal processing chip—implements the CDS read-out of the CCD output, as well as the A/D conversion. Its pairing with the FPGA which controls the analog signals expected by the CCD allows significant flexibility in the operation of the OCAMS detector through the manipulation of registers.
The OCAMS CCD (Fig. 9) requires a choreographed power-on/power-off sequence in order to maintain proper bias voltage on its substrate. The detector module implements opto-couplers to monitor CCD bias voltage status while the detector assembly FPGA reacts to possible faults. A bias fault condition causes the FPGA to immediately remove power from the CCD.
The OCAMS sensors have no windows or cover glass to minimize the possibility of optical ghosting. They are equipped with an internal platinum resistance thermometer (PRT) temperature sensor. An external thermistor mounted to the rear of the device allows a redundant CCD temperature monitor.
The DA FPGA controls the read-out electronics through five top-level blocks. The command executor handles all host commands, populates and monitors the control and status registers, and controls the flow of data between blocks. The host interface handles communication protocols. The CCD controller executes imaging commands and handles CCD clocking patterns. The ADC (Analog-to-Digital Converter) controller constructs the interface logic for the analog-to-digital converter; it synchronizes the FPGA control-status register values with the ADC via the SPI (Serial Peripheral Interface). Finally, the SDRAM (Synchronous Dynamic Random Access Memory) arbiter controls the flow of data between the FPGA and the 128 MB SDRAM.
2.4.3 Detector
The frame-transfer detector at the heart of OCAMS consists of a \(\mbox{1k}\times\mbox{1k}\) CCD array, with \(6.5 \times 8.5~\upmu \mbox{m}\) pixels on an 8.5 μm pitch, provided by Teledyne-DALSA’s Custom Division in Waterloo, Ontario. A series of ranked criteria informed by mission imaging requirements resulted in its selection. The detector exhibits a relatively high dynamic range, a quantum efficiency spectrum well-aligned to that of the solar spectrum, acceptable read noise, low dark current, and short shutter time. Its smaller format minimizes downlink needs. The chip also has a powerful anti-blooming capability and known ionizing radiation tolerance against gamma radiation.
The detector itself consists of 1024 by 1024 active pixels surrounded by a:
-
1.
4-pixel transitional zone
-
2.
24-pixel-wide covered columns left and right
-
3.
6-pixel-deep covered rows top and bottom
-
4.
16-pixel-wide electronic lead-in columns left and right (bias columns) (Fig. 18)
Fig. 18 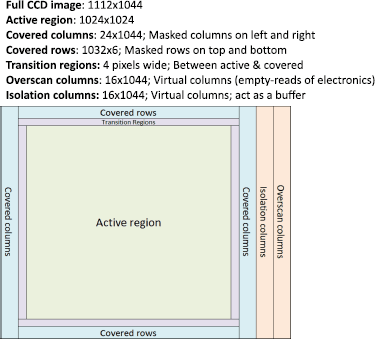
Format of the OCAMS CCD defined by region. The active region is surround by a 4-pixel-wide transitional zone which may receive light, 24-pixel-wide covered columns left and right, and 6-pixel-deep covered rows top and bottom. Sixteen-pixel-wide electronic lead-in columns left and right are also present. The image is finally packaged and released as a fits file as shown

TD Waterloo was contracted to provide all necessary device qualification and validation, except for proton radiation, which was performed by the UA team in separate tests at UC Davis’ Crocker Nuclear Labs.
3 Instrument Performance
As a requirements-driven design and mission system, OCAMS’ ground calibration was fully embedded within an extensive, but focused, verification effort (Merrill and Williams 2016). This program measured optical and radiometric performance, spectral responsivity, and stray light exclusion. The measurement of absolute responsivity was derived as an outgrowth of the verification of minimum detectable radiance for all three cameras. Bennu’s surface is one of the darkest in the solar system (Hergenrother et al. 2013). The dependence of optical and radiometric performance on temperature was derived from environmental testing. Stray light sensitivity followed upon the verification of stray light requirements. The Instrument team plans to perform the geometric distortion calibration in-flight for all 3 cameras. They performed this calibration for the PolyCam as a post-environmental ATLO (Assembly, Test, and Launch Operations) floor verification.
In summary, the OCAMS ground calibration measured:
-
1.
Optical resolution performance in the form of modulation transfer function (MTF), which was trended throughout the assembly and testing of the cameras; related metrics, including ensquared energy and root-mean-square (RMS) spot size Full-Width at Half-Maximum (FWHM), as a function of object distance, were also derived.
-
2.
Radiometric performance in the form of the minimum detectable radiance and maximum detectable magnitude; related metrics included vignetting and flat field uniformity.
-
3.
Detector characterization, including read noise, photon transfer curve shape, and dark current generation rate.
-
4.
Spectral responsivity.
-
5.
Mechanism functionality and mechanical calibration.
-
6.
Field of view/pointing.
-
7.
Stray light characterization, including in-field and out-of-field stray light and the characterization of ghosts.
-
8.
Distortion (for the PolyCam).
The advantages of embedding the calibration effort so completely within the verification effort outweighed the disadvantages. With eight boxes to calibrate (three cameras + electronics controller, EQM [Engineering Qualification Model], and FM [Flight Model] versions), and some 2000 requirements to verify, great emphasis was placed upon efficiency, straightforward metrics, and strict Configuration Management (CM) of alterations. The major disadvantage—the speed with which the calibration was conducted leaving little time to address inevitable flaws and deficiencies discovered during the calibration process—was remediated by an extensive program of special tests, including at the spacecraft level. More than 130 special tests were conceived and performed in this effort. Special test requests were submitted through the CM process, rapidly reviewed, implemented, and incorporated into the standard calibration program.
After each instrument completed its standard calibration regime, a hardware analysis review was convened in which the results of the calibration were reviewed and a decision taken whether to proceed.
3.1 Optical Resolution Performance
Optical resolution performance for each of the systems was measured by imaging back-illuminated slightly slanted slit targets at nine points within each camera’s field of view. From these high-contrast slanted-slit images, densely sampled line-spread profiles were derived in the direction perpendicular to the slit length (Golish et al. 2014). The amalgamated line-spread function (LSF) profiles provide the data to compute the modulation transfer function (MTF) of the system along the direction perpendicular to the slit. Optical designers typically plot MTF as a function of spatial frequency. The Instrument team used it as the primary optical resolution performance metric. The technique is flexible and was used while the imagers were housed and tested in environmental chambers (system level) and while they were mounted on the spacecraft (observatory level) during ATLO.
For the MapCam and PolyCam, laboratory test bench collimating systems were used to project the image of the tilted slits and point sources—that appeared to be distant—into each camera’s field of view during ambient and environmental testing. For the SamCam, real images were observed at the camera’s specified range. In all cases, projected or real range to target was altered in order to explore the dependence of optical resolution performance on range in order to verify its behavior accorded with predictions (Fig. 19).

(a) MapCam MTF slant line target. Backlit slant line target projected through collimator and imaged by MapCam in order to measure modulation transfer function (MTF) and verify optical resolution performance; (b) PolyCam MTF slant target; (c) SamCam MTF slant target; (d) SamCam MTF slant target on ATLO floor
In general terms and for the purposes of planning, to describe the resolution characterizing extended-object observations of Bennu, the OSIRIS-REx team adopted a 5-pixel criterion: it considers a small feature such as a pebble or distant boulder fully resolved when its diameter subtends 5 pixels for a well-focused optical system. We define such a well-focused system as one with an optical resolution performance that is approximately Nyquist-limited, characterized by an MTF at Nyquist spatial frequencies of 20%. Writing the important resolution requirements in this way minimizes the possibility of aliasing while providing a significant amount of margin against degradation in both optical and radiometric performance because S/N (signal-to-noise) levels at Bennu for the three cameras may routinely exceed 100.
One can formulate this rule of thumb more precisely by requiring all 15 operational optical pathways (six for MapCam’s five filters + focus plate, four for SamCam’s three filters + diopter, and five for PolyCam’s focal state at the five different ranges used to characterize its optical resolution performance during its fabrication and testing) to separate two spots described by Gaussian illumination profiles with a \(3\sigma\) confidence (99.7%) and evaluating them on their ability to do so:
where \(F\) is the spatial frequency characteristic of the spot separation, \(S/N\) is the signal-to-noise ratio characterizing the data, and \(\mathit{MTF}\) is the modulation contrast at a given \(F\). The 3 in the numerator refers to the \(3\sigma\) confidence characterizing the separation. The above relationship states that if the S/N characterizing the observation is around 20, then separating two points with a 99.7% confidence requires an MTF at Nyquist of at least 15%; if the S/N attains 100, then an MTF equal to only 3% is sufficient. If a smaller confidence on the detection is tolerable (1 or \(2\sigma\)) then the MTF (contrast) can be correspondingly lower as scaled by the S/N characterizing the measurement. If an optical system records images with larger signal-to-noise due to its higher radiometric sensitivity, then a lower contrast system may be fielded.
As is usual in space applications, when aperture size is limited by the desire to not excessively increase mass, optical resolution performance—controlled by focal length—and radiometric performance—controlled by F number—trade against each other. In addition, increasing the aperture decreases F number and reduces depth of field. Maximizing the quality of the end product is always the goal, whether satellite or plume search image, cobble identification from a range of 3.5 km or pebble identification from a range of 200 m. The final design is specified after including as many of the operational details as can be learned in the early stages of mission planning.
A specific case drives each optical pathway—usually an important imaging campaign with an anticipated and specific range, lighting condition, and ground-track velocity—distinguished from the others by the use of a distinct filter or focus range. It determines a single MTF criterion at a given spatial frequency. Some eight separate optical resolution performance requirements governing resolution, ensquared energy, depth of field, contrast, and LSF itself controlled the performance of MapCam. SamCam had six such requirements and PolyCam 13. These drove the optical and radiometric characteristics of the final designs.
The actual MTF measurements observed two angled slit targets at nine locations within the field of view of each optical system (Fig. 20). The width of a slit target projects to a sub-pixel (∼1/10 pixel typical) feature when imaged onto that camera’s focal plane (Golish et al. 2014). The slight angles—typically 5° to 7°—to the nominal row-column alignment of each detector, allow the process to acquire a sub-pixel sampling of the camera’s line-spread function (along two orientations, vertical and horizontal); it could routinely acquire more than 100 points to trace out the line-spread function (Fig. 21).

OCAMS field of view relative location positions. OCAMS relative optical and radiometric performance can be referenced to these relative field-of-view positions

Measured line-spread function. The ensemble of points transverse to the core of the slant line used in the MTF measurement are shown in green here, interpolated by a blue line. They are plotted against the transverse distance from the slant line peak. The MTF is derived from the line-spread function by a Fourier Transform
The Instrument team measured optical resolution performance for a range of simulated object distances; it set the simulated distance based on computer-controlled motion of the target at the focus of the collimator. The accuracy of the simulated range was then independently verified using a custom-designed pentaprism divergence-angle measurement system. The pentaprism is placed within the collimator beam and translated perpendicularly across the beam in order to measure the angles of the incoming rays by their degree of displacement from a reference position corresponding to a perfectly collimated ray ensemble (from \(\infty\)) (Fig. 22). In the infinite reference case, the displacement measured by the pentaprism is essentially zero (limited by collimator aberrations). At all finite ranges, a nonzero displacement is measured and related to the range.

Pentaprism range verification system. The pentaprism range verification system is circled in this image; it is mounted in front of the Alnitak self-illuminated flat panel which is used for PolyCam flat-fielding. The system observes reflected light from the collimator beam and records the deviation from a null result (which corresponds to infinite range). Finite deviations correspond to finite ranges
Table 5(a)–(c) shows the results for each camera in the form of line-spread function full-width-at-half-max vs. range-to-target and also in the form of system MTFs for each camera during ambient conditions before and after vibration testing and during thermal-vacuum testing (Figs. 23–27). It also shows results for horizontal slits (the worst case, because of the rectangular shape of each pixel). The horizontal slits sample the widest dimension of each pixel’s \(8.5\times 6.5~\upmu \mbox{m}\) active area. System performance in the other dimension is typically 25% better at Nyquist or 1/2 Nyquist.

MapCam System MTF for Pan filter vs. Spatial Frequency: ambient conditions. MapCam System MTF for the Pan filter at different ranges to target is shown at ambient temperature and pressure. Horizontal slit result is shown (worst case) before Thermal Vacuum TVAC and vibrational testing. Results are shown at 125-m, 500-m, 950-m, 3500-m, and infinite ranges

MapCam System MTF for Pan filter: cold vacuum. MapCam System MTF is shown for the Pan filter vs. range to target at flight-like cold temperature and vacuum pressure for horizontal slits (worst case) after TVAC and vibrational testing. Performance improves somewhat at longer ranges and decreases somewhat at shorter ranges due to the colder optical temperatures. In addition, after vibration and thermal testing, optimum camera optical resolution performance shifted slightly toward longer ranges for all temperatures. Results are shown at 125-m, 500-m, 950-m, 3500-m, and infinite ranges

SamCam System MTF for Pan filter: ambient conditions. SamCam System MTF is shown for the Pan filter vs. range to target at ambient temperature and pressure using horizontal slits (worst case). Results are shown at 2.8- and 5-m ranges

SamCam System MTF for Pan filter: cold vacuum. SamCam System MTF for the Pan filter vs. range to target is shown at flight-like cold-temperature vacuum conditions using horizontal slits (worst case). Results are shown at 2.8- and 5-m ranges


PolyCam System MTF at 200-, 290-, 440-, 900-m, and infinite ranges: ambient vs. cold vacuum. PolyCam System MTF performance at 200-m (a), 290-m (b), 440-m (c), 900-m (d), and infinite (e) ranges using horizontal slit comparing pre-vibe, pre-TVAC performance at ambient temperature and pressure on the left with post-vibe, cold-temperature performance in a vacuum on the right. In general, the horizontally oriented MTF (as opposed to the vertically oriented MTF) represents the worst-case resolution performance for the detector
3.2 Radiometric Performance
Bennu orbits the Sun between 0.89 and 1.36 AU. Its mean diameter and expected density of 500 m and \(1.3~\mbox{g}\,\mbox{cm}^{-3}\), respectively, result in typical gravitational accelerations of 2–7 μg and orbital velocities of \(5\mbox{--}15~\mbox{cm}\,\mbox{sec}^{-1}\) (Chesley et al. 2014; Hergenrother et al. 2014). The range to target falls between several hundred to several thousand meters from the body’s center, implying angular velocities of surface features of 0.01 to \(0.75~\mbox{mrad}\,\mbox{sec}^{-1}\). At even the most rapid relative velocity, and at most ranges to target, an exposure time of 20 msec (1/50 sec) produces a motion blur of barely a pixel. However, on several campaigns the demands of mission operations are better served by acquiring images while continually slewing the OSIRIS-REx spacecraft pointing at a rate of up to \(2~\mbox{mrad}\,\mbox{sec}^{-1}\) and at times accepting blurs on the order of a pixel or more (Mink et al. 2014).
The near-Earth asteroid Bennu is fully as dark as the nucleus of comets such as 1P/Halley, 81P/Wild, 19P/Borrelly, or 103P/Hartley and as asteroids such as 253 Mathilde (Hergenrother et al. 2013). In addition, Bennu possesses a disk-averaged phase function that plummets at high phase angle (Hergenrother et al. 2013, Fig. 5). Various disk-integrated photometric models, derived based on different conventional functional-form assumptions, display a disparity between noontime observations at the equator at perihelion and near-terminator observations at aphelion. The latter can be 3 orders of magnitude dimmer (Takir et al. 2015). By combining a wide dynamic range detector with exposure times ranging from millisecond to tens of seconds the camera systems achieve a large dynamic range. In addition to these considerations, the signal-to-noise ratio characterizing the resulting observations strongly affects the overall optical resolution performance, as shown in Eq. (1).
Many of the definitive campaigns that will gather the information needed to enable successful sampling require the spacecraft to orbit near the solar-terminator (Berry et al. 2013, 2015; Beshore et al. 2015; Lauretta et al. 2015; Williams et al. 2018). In this attitude, the weak gravitational force balances the solar radiation pressure on the OSIRIS-REx spacecraft and will allow a quasi-stable orbit. Incidence and emission angles at this vantage point will result in phase angles that routinely exceed 100°. Radiance will be reduced by a factor of 1000 from the sub-solar point.
Anticipating this illumination geometry, radiance requirements for each camera were among the most highly scrutinized. These 16 separate requirements on the MapCam, SamCam, and PolyCam Minimum Detectable Radiance (MDR) drove unusually fast designs for the MapCam and PolyCam, and a relatively fast design for the SamCam (Table 1). We say “unusually” because, after all, the spacecraft spends a good fraction of its lifetime at a solar range near 1 AU in very bright sunlight and should not require such fast cameras for any “normal” body with even twice the reflectance and surfaced with a regolith constructed from relatively smooth cobbles and pebbles (e.g., Itokawa) (Fujiwara et al. 2006; Saito et al. 2006; Yano et al. 2006; Miyamoto et al. 2007; Marshall and Rizk 2015). The combination of Bennu’s very low albedo and steep phase function demands fast imagers.
The radiometric performance of the OCAMS imagers was verified and calibrated relative to the internal surface of a 20-inch integrating sphere illuminated by a 3400 K QTH (quartz-tungsten-halogen) laboratory blackbody source (Fig. 28) for the MapCam and SamCam and by a self-illuminated Alnitak Flat-Man flat panel (Fig. 22) for PolyCam. The blackbody source’s calibration traces to a NIST source using a proxy reference: a calibrated standard detector (OL DH-300C) provided by Gooch & Housego. This detector mounts perpendicularly to the axis of the sphere’s 8-inch exit port, centered, and at a measured distance (Fig. 28). A second calibrated standard detector reference (OL 730-5A), mounts to the sphere and simultaneously observes the sphere’s surface, with responsivity identical to the first to within 1%, in order to monitor temporal changes in light level. The manufacturer freshly calibrated both detectors before use.

OCAMS radiance calibration testbed. The OCAMS radiance calibration integrating sphere; units under test mount opposite the main port and view the interior. Simultaneously, a calibrated standard detector views the interior from an equatorial port
The combination of the calibrated detectors, one positioned in front of the integrating sphere (proxy detector) with its well understood solid angle view of the source, and the other detector at the sphere’s equator with a direct view of the interior, allows the precise determination of the solid angle of the reference detector’s observation geometry when mounted to the sphere:
where \(\varOmega_{proxy}\) is the solid angle of the open integrating sphere port as seen from the proxy detector, \(\theta\) is the half-angle of the solid angle, \(r\) is the radius of the integrating sphere port, and \(d\) is the distance from the detector to the integrating sphere port (Fig. 29). Table 6 presents the value of other quantities in Eq. (2).

Radiance calibration illumination geometry. A schematic of the radiance calibration testbed as seen from above is shown. Proxy calibrated standard detector mounted to view the integrating sphere’s main port, while a calibrated standard detector monitors the radiance within the sphere. Light is injected into the sphere from a small sphere illuminated by a quartz-tungsten-halogen (QTH) lamp
Table 7 presents the results. If one assigns the OCAMS detectors, by analogy to photographic film, an ISO rating scaled to a working signal level and resulting signal-to-noise ratio, then one derives the curve displayed in Fig. 30. At a 40:1 signal-to-noise ratio (SNR), the ISO rating is around 830, and at a 10:1 SNR, the ISO rating is 4700.

OCAMS ISO rating. Signal-to-noise ratio plotted against OCAMS detector equivalent ISO rating. At a 40:1 signal-to-noise ratio, the ISO rating is around 830, and at a 10:1 SNR, the rating is 4700
3.3 Spectral Performance
The relative spectral responsivity for all seven distinct optical paths was measured to verify seven spectral-related requirements. Figure 31 shows the configuration. A single-pass monochromator (Acton SL-150), backlit with a QTH source, filled an integrating sphere with light over a 12-nm-wide band. It was observed by the unit-under-test (UUT) and a standard detector (Gooch and Housego OL 730-5A) calibrated for spectral responsivity. The scans of the MapCam color filters were performed at both 1-nm and 10-nm spacings. The scans of the Pan filters for all cameras were performed with a10-nm spacing.

Spectral responsivity illumination geometry. A schematic of the spectral responsivity laboratory testbed as seen from above is shown. A single-pass monochromator injects light, and a calibrated standard detector monitors the radiance of the sphere’s interior
Order-blocking filters prevent second-order diffraction on the monochromator grating from introducing light at one-half the wavelength required. A UV-blocking filter accomplishes this task for wavelengths from 350 to 700 nm. For wavelengths above 700 nm, an order-blocking filter is used which blocks wavelengths lower than about 665 nm. The overlap region between the two datasets is used to tie the short- and long-wave datasets together.
Figures 32, 33, 34 show the results.

MapCam relative spectral responsivity. MapCam relative spectral responsivity for all six optical paths, using data acquired at coarse (10 nm) and fine (1 nm) monochromator slit resolutions shown as solid- and broken-line blue (B), green (V), red (W), and gold (X) for the color filters. Black and gray indicate the Pan and Pan-30 plates which plot on top of each other; they were measured with a 10-nm resolution

Spectral responsivity of the PolyCam Pan filter. Spectral responsivity of the PolyCam Pan filter is shown

Spectral responsivity of the SamCam Pan filter. Spectral responsivity of the SamCam Pan filter is shown
3.4 Stray Light Performance
During the design phase, in order to simulate and better exclude stray light from each system’s focal plane, stray light models were created for each camera in FRED, Photon Engineering’s ray-tracing and optical design utility. Both out-of-field and in-field stray light for the most demanding illumination geometries during various mission campaigns were predicted and analyzed. When not already known, surface reflectances for all critical camera surfaces were measured, modeled, and incorporated into the relevant model. The results guided and verified each camera’s baffle design.
The resulting baffle structure for all three cameras began from the outside with external sunshades cut at a narrow angle to the optical axis sufficient to exclude the direct solar beam during the campaign when its closest angle to the Sun was expected. This geometry occurs during the Detailed Survey phase (Sect. 5.4), when the spacecraft surveys Bennu for dust and gas plumes in forward-scattered solar light. The high sides of the three sugar-scoops face the Sun. The three OCAMS imagers mount so that all of their sugar-scoop baffle high-sides face the \(+\mbox{X}\) side of the spacecraft. The \(+\mbox{X}\) side is also where the spacecraft’s high-gain antenna mounts and serves as a de facto sunshade throughout the mission, aided by several perpendicular baffles erected alongside it on the science deck.
During ground verification and calibration, the success of the design was tested by several stray light testbeds: (1) a bright point source imaged through a collimator that measured out-of-field rejection along two perpendicular axes and (2) a uniform bright field target surrounding designated dark regions that measured in-field rejection. Figures 35–39 show the results for this testing. Ghosting was also tested by imaging a very bright source at different positions in and out of the field of view of the cameras.

Degree of PolyCam scattered light (X-axis). The magnitude of stray light scattered onto the PolyCam focal plane is shown as a relative quantity in this diagram, the Point Source Normalized Irradiance Transmittance (PSNIT). The PSNIT is the ratio of the detector irradiance to the irradiance incident on the camera. It magnitude is the result of a theoretical model of scattered light involving the tracing of billions of rays from an off-axis point source. The lateral position along the PolyCam X-axis of this point source is plotted along the graph’s horizontal axis; the relative signal from this point source which is scattered onto the focal plane is shown along the vertical axis

Degree of PolyCam scattered light (Y-axis). The magnitude of stray light scattered onto the PolyCam focal plane is shown as a relative quantity in this diagram, the PSNIT. The lateral position along the PolyCam Y-axis of this point source is plotted along the graph’s horizontal axis; the relative signal from this point source which is scattered onto the focal plane is shown along the vertical axis

Degree of MapCam scattered light (X-axis). The magnitude of stray light scattered onto the MapCam focal plane is shown as the PSNIT. The lateral position along the MapCam X-axis of this point source is plotted along the graph’s horizontal axis; the relative signal from this point source which is scattered onto the focal plane is shown along the vertical axis

Degree of MapCam scattered light (Y-axis). The magnitude of stray light scattered onto the MapCam focal plane is shown as the PSNIT. The lateral position along the MapCam Y-axis of this point which is scattered onto the focal plane source is plotted along the graph’s horizontal axis; the relative signal from this point source is shown along the vertical axis

Degree of SamCam scattered light (X-axis). The magnitude of stray light scattered onto the SamCam focal plane is shown as the PSNIT. The lateral position along the SamCam X-axis of this point source is plotted along the graph’s horizontal axis; the relative signal from this point source is shown along the vertical axis
Glints from the sample head into the SamCam images of the TAGSAM event have been extensively studied. The original metallic surface finish of the sampling arm and head was reworked and shielded in order to remove or reduce the effects of single-bounce interfaces threatening to swamp the desired signal of the dark asteroid surface with the series of SamCam images acquired during the sampling maneuver.
3.5 Detector Performance
The CCD detectors residing at the focal plane of each of the OCAMS imagers were selected because they provided a relatively high dynamic range with low dark current, acceptable format, read noise, shutter speed, pixel pitch, anti-blooming, and a heritage design with radiation-tolerant features. Their fabrication process was relatively mature, and they were qualified for flight operation at delivery.
3.5.1 Noise Results
Maintaining the electronic detector readout noise (read noise) to the required level of 50 electrons at room temperature (less than 12 DN) was a primary concern of the detector readout and operation within its active electronic environment. Common-mode chokes and point-to-point grounding were employed to suppress power supply noise and grounding loops through the design’s implementation to a level of 8.2–8.6 DN at room temperature, rising to 9–10 DN at colder detector temperatures. Each camera possesses an individually recognizable noise pattern, which was maintained essentially unchanged throughout all electromagnetic susceptibility testing.
3.5.2 Radiation
The OCAMS detectors had to successfully pass a radiation screening. This screening occurred on three separate sessions at Crocker Nuclear Labs in Davis, CA, where several Grade A and B engineering versions of the Teledyne DALSA detector were subjected to proton irradiation. These engineering and flight-lot devices were irradiated with 64-MeV protons to levels comprising two to six times the dose expected during the full mission at the position of the OCAMS focal planes, corresponding to a total ionization dose (TID) equivalent of 0.6, 1.2, 1.4, and 2.0 krad.
Irradiation of the focal planes produced hardly any change in the photon transfer curves, a negligible decrease in both vertical and horizontal charge transfer efficiency, and an increase in bulk dark current by a factor of one to two.
The irradiated detectors do display a significant increase of hot pixels. Hot pixels show a dark current generation rate greatly elevated relative to the rest of the detector plane. However, they are removable using dark frames taken at similar temperatures, reasonably close in time (e.g., minutes to hours), to the target frames.
More significant is the radiation-induced onset of flicker noise in the dark frames. This random telegraph signal noise (RTS), has a temporal impermanence that could potentially make it problematic. Its distinctive signature, that of an individual pixel whose signal is elevated abruptly over that of its neighbors, has the appearance of a cosmic ray strike. Therefore it is removable by identifying the pixels that exhibit this behavior and replacing their signal levels with averages of their neighboring pixels. We will identify these pixels by analyzing individual pixel signals in long-exposure dark frames and flagging those that are statistically anomalous (e.g., with distinctive values of kurtosis, skewness and mean).
The flickering pixels, the hot pixels, and the bulk dark current all decline with decreasing exposure times and decreasing temperatures. Since the majority of the imaging campaigns occur at temperatures and exposure times well below those used in the pre- and post-irradiation testing, one of the main conclusions of the radiation testing was that the OCAMS detectors have significant margin toward radiation exposure when used as the focal plane for the three OCAMS cameras.
3.6 Focus Mechanism Performance
In practice and as mentioned in Sect. 2.1.1, the operational range of the PolyCam focus mechanism is divided into 80 valid positions within the PolyCam operational range (i.e., the range in which the PolyCam is actually in focus at some real distance to target). Forty settings outside of this range position the refocusing lens—lens 1 (L1)—outside any current valid focus range. They represent design margins on the PolyCam optical system that allow it to recover gracefully from a massive shift of focus, should one be experienced in flight, due to either thermal or mechanical disruptions.
The PolyCam focus table is based on a model of the optical system constructed in Zemax, the optical ray-tracing tool. The tool is used to generate a third-order functional relationship between L1 offset \(m\) from the infinity position \(m_{\infty} \) (slightly dependent on temperature) and best focus object distance (Range \(R\)). The coefficients \(a\), \(b\), and \(c\) are determined and \(m_{\infty} \) adjusted to fit focus test data. The fit weights errors inversely with the depth of field. Since the depth of field at large ranges approaches 1/2 to 1 times the range itself, while the depth of field at low ranges (near 200 m) is less than 5% of the range itself, the low-range data gets weighted much more significantly and the curve tied much more tightly to these points. This analysis predicts the functional form of the relationship between linear focus mechanism travel and range of optimum focus to be adequately described by an inverse cubic.
where
- \(R\)::
-
Range (dependent variable) [in meters]
- \(m\)::
-
Motor Step Position (independent variable) [in motor steps]
- \(m_{\infty} = 18336\)::
-
Motor Step Position at Infinity (Fitted Parameter, dependent upon temperature)
- \(s = 2539.84\)::
-
L1 steps per travel [in motor steps per revolution]
- \(a = - 8.67 \times 10^{ - 7}\)::
-
linear coefficient in inverse cubic fit
- \(b = 1.75 \times 10^{ - 8}\)::
-
second-order coefficient in inverse cubic fit
- \(c = - 2.64 \times 10^{ - 14}\)::
-
third-order coefficient in inverse cubic fit
One determines the correspondence to actual range by fitting motor step position to laboratory virtual ranges measured using the pentaprism-based rangefinder that travels across the laboratory collimator to directly assess the ray angles (Fig. 22).
3.7 Thermal Performance
3.7.1 Focus vs. Temperature (PolyCam)
Figure 13 shows the PolyCam’s measured focus dependence on temperature, as well as its shift due to mechanical vibration. The value of \(m_{\infty} \), the fitted motor-step position at infinity, characterizes it. From cold to hot temperatures, lens 1, the first lens of the field-correcting doublet, must be shifted toward the secondary and higher motor-step positions by roughly 1000 motor steps (about two shutter rotations) in order to achieve best focus at the hotter temperatures. If the ambient PolyCam focus-mechanism possesses an \(m_{\infty} \) near 17371, then \(m_{\infty} \) values of 17060 and 18050 characterize the “Cold” (\(-20~\mbox{C}\)) and “Hot” (\(+30~\mbox{C}\)) curves, respectively.
The “Hot” and “Cold” curves in Fig. 13 are based on behavior observed within a thermal-vacuum chamber during environmental testing, while the “Post-Vibe” curve is based on ambient testing near room temperature after random vibration testing. Further characterization of this dependence awaits actual temperature-dependent flight data.
4 In-Flight Calibration
The OCAMS in-flight calibrations will characterize and track the three imagers’ optical and radiometric performance throughout the OSIRIS-REx mission to the asteroid Bennu. Instrument self-calibrations will measure changes in detector responsivity, dark current and bias level, charge transfer efficiency, and calibration lamp positioning. Notable star calibrations will gauge absolute and spectral responsivity, geometric boresight and distortion, focus changes, and stray light. To improve efficiency, calibrations may be split into individual test campaigns, or several calibrations gathered into a single campaign (e.g., the instrument health check).
The cruise phase will extend from launch in September 2016 until the staged approach to the asteroid begins in August 2018. During this period, the Instrument team will characterize the distortion map for all three imagers and their filters, acquire an absolute and relative radiometric calibration independent from the pre-flight ground calibration, and update their detector responsivities by monitoring internal calibration tracing lamp illumination profiles. Along the way, the team will regularly monitor the health of the several OCAMS modules, ensuring that existing operating procedures and flight rules maintain their validity.
The harsh launch and space environment will present a number of challenges to the operation of a camera, including ionizing radiation–induced damage to the focal-plane solid-state detectors, to the electronics, and to the mechanism LEDs, contamination, vibration and other launch-associated performance alterations, extreme temperatures, and rapid temperature changes. Of these, one the most impactful—Random Telegraph Signal pixel creation in the focal plane—can be readily calibrated by recording the light pattern of a dark source. Other effects will include radiation-induced changes in the CCD’s charge transfer efficiency, the dark current, the calibration of the housekeeping temperatures, voltages, and index-lamp responsivities (index lamps provide light fiducials that aid in controlling the operation of all three mechanisms).
4.1 Self-Calibration
The primary means of monitoring OCAMS’ general performance will be the Instrument Health Checkout. At a minimum, the Instrument team will run it post-launch and every 6 months starting in March 2017. It will closely follow a sequence used during ground testing that operated all copper pathways in the cameras, without excessively exercising limited-life mechanisms. It will test heater, motor, lamp, and detector functionality, basic optical resolution performance, dark current, and detector responsivity relative to the on-board lamps. All heaters will be activated and deactivated; all mechanisms will be operated. The instrument team will analyze anomalies detected by the Instrument Health Checkout, and track changes in detector or optical responsivity, dark current, and bias level.
After launch, the instrument team’s primary goals will be to record launch-induced changes from the ground-based calibration and functional tests. It will record dark frames and images illuminated by the in-flight calibration lamps and EPER (Extended-Pixel Edge Response) frames, allowing the post-launch estimation of the charge transfer efficiency. Immediate post-launch imaging will benefit from minimal radiation-induced changes to the three detectors. Effects due to the launch itself (optics or detector-related physical shifts) can be isolated.
The OCAMS health check will not require an external target, but external targets will enhance the functional check if present in the field of any of the three cameras.
4.2 Distortion Calibration
The distortion calibration will use observation of open star clusters repeated at multiple locations within a camera’s field of view to establish the observational basis of a camera distortion model. Precise column/row coordinate centroids will record the observed location differences of star positions relative to each other, especially at the center and corners. The instrument team will model them both as relative and as absolute differences from each other. It will use either a catalogued star position reference or the consistency of an internal difference reference to derive the error in observed location vs. actual feature absolute position against location within the camera field of view. This will inform a camera distortion model.
Similarly to focus and optical resolution performance, the instrument team plans distortion calibrations at both hot and cold optics and detector temperatures, anticipating the temperature range to be experienced during proximity operations. Predicted optics and detector temperature extremes during important proximity-operations observational campaigns, such as Orbital A and B, Detailed Survey, and Reconnaissance, will inform target temperatures. Using operational temperature sensors and heaters, the CCM will monitor and control MapCam and SamCam lens stack and detector temperatures. It will perform the same function for the PolyCam primary and secondary mirrors, the refractive element/focus mechanism assembly, and the detector. When it is difficult to simultaneously achieve all temperature extremes for these subsystems, the goal will be to get within 3–4°C of the targets.
For the PolyCam, which possesses the largest physical assembly with the most complicated thermal profile, the instrument team will record observations at focus positions from infinity to near 800-m range (the lowest range for which star point-spread envelopes can be centroided). Two full rotations of the 56-tooth lens gear (Figs. 5 and 6) will be recorded, at approximately 120° intervals, a spacing corresponding to 672 motor steps. These lens gear fiducials are realized at focus mechanism motor step positions 17371 (32A), 16650 (30C), 16110 (29C), 15390 (28B), 14669 (27A), and 13950 (25C), corresponding to the nominal ranges 39 km–\(\infty\), 3.3–3.7 km, 2.1–2.2 km, 1.3–1.5 km, 1.03–1.07 km, and 0.80–0.82 km. A baseline of 13 positions within the field of view (with a potential descope to 5 positions) will be recorded, depending upon the degree of fidelity desired and the time and effort available to prepare the command sequencing for the calibration. Table 8 shows the target list for the initial calibration.
For the MapCam, observations are recorded through all six filters (Pan, Pan-30, B, V, W, X) and at five positions within the FOV; potential targets include Hyades and Coma clusters; a total of about 360 images are recorded. For the SamCam, observations are recorded through one of the three Pan filters (1, 2, or 5).
4.3 Absolute Responsivity Calibration
In addition to the two clusters listed in Table 8, the instrument team will include two solar twins as spectral reference targets and observe them at multiple positions within the MapCam field of view. For SamCam and PolyCam, these targets will be placed at the center of each FOV when observed. Five distinctive light paths will be recorded for MapCam and one each for SamCam and PolyCam. Similarly to the open cluster observations, the calibration will be repeated for hot and cold extremes.
4.4 Earth Gravity Assist Observations and Calibrations
The Earth Gravity Assist observations will provide an opportunity for OCAMS to observe terrestrial and lunar surfaces after closest approach. During the encounter, the spacecraft will approach the Earth on its dark side, duck under the South Pole and emerge on the day side over the Pacific Ocean. Imaging will begin several hours after closest approach, at a range of around 100000 km. These observations will continue until the spacecraft reaches a range of 200000 km, and then repeat at a range of 2.8 million km. The imagers will observe the Moon at a range of around 1.1 million km. Highest priority will be to derive absolute and color responsivities from the Earth/Moon imaging. Once acquired, the images can be compared with the measured signals of (1) simultaneous independent observations by Earth-orbiting spacecraft in the case of the Earth and (2) calibrated lunar radiances, in order to derive an absolute calibration. Such a calibration can be compared to those acquired from stellar standard candles.
A target will rarely fill the field of any of the OCAMS imagers at the planned observational ranges. Useful flat fields will be very unlikely, even for the PolyCam. For the lunar disk, which will not fill the field of view of any of the cameras, the campaign will attempt to image it in as many locations within the cameras’ field of view as feasible.
PolyCam will record observations at long and short exposure times, near infinity (motor step position 17371, 32A), and at phase angles between 15° and 24° and around 33° for the Earth, and around 41° for the Moon. It will record an Earth image at location P50 within its FOV (Fig. 20); for the Moon, center-of-bright-disk images are recorded at locations P10–P90. The other cameras will record observations at long and short exposure times through five filters (Pan, B, V, W, X), centered at P50, for MapCam and through one of the Pan filters (1, 2, or 5), for SamCam.
5 Concept of Operations
The instrument team optimized OCAMS imager designs to serve the goals of the OSIRIS-REx mission. Similarly, the imperative to gather critical asteroidal information with sufficient fidelity strongly affected the design of the OSIRIS-REx concept of operations for OCAMS (Mink et al. 2014). It will enable (1) the low-risk, and successful, acquisition and return of the sample from Bennu’s surface, (2) the selection of a scientifically interesting sample site, and (3) the documentation of both the asteroid’s surface properties and the nature of the sample site itself. The mission designers will lay out spacecraft trajectories to provide appropriate spatial resolution; they will tailor mission phases and campaigns to ensure comprehensive coverage; the spacecraft’s orientation and pointing will permit the acquisition of high-signal image data across desired photometric geometries.
Products derived from OCAMS images will decrease the risk to sample acquisition by resolving Bennu’s physical parameters (Antreasian et al. 2016). PolyCam and MapCam will also directly perform optical navigation from ranges greater than 7.6 km in order to verify Bennu’s ephemeris and confirm the spacecraft’s relative position. Although primarily the responsibility of TAGCAMS, OCAMS can also provide images for optical navigation at ranges less than 7.6 km, if necessary. For example, on the rehearsal approaches to the sample site, after the Matchpoint maneuver, MapCam and SamCam will record images of the surface in order to confirm the reduction of the spacecraft’s lateral velocity with respect to the surface to less than \(2~\mbox{cm}\,\mbox{sec}^{-1}\), the maximum permissible rate for a successful sampling attempt (Berry et al. 2015).
The ability of MapCam to spectrally image terrain, which will also be observed by OVIRS and OTES with higher spectral resolutions but at lower spatial resolutions, will allow the team to identify scientifically valuable regions from which to collect the sample. The characteristics determined by OVIRS will be extended to higher spatial resolution by MapCam after cross-calibrating on regions observed simultaneously by both instruments. The thermal inertias determined by OTES will be similarly extended by the same observations. Researchers believe Bennu, a B-type asteroid and possible CM-chondrite spectral analog, to be primitive and volatile-rich (Clark et al. 2011), and possibly derived from the inner regions of the main belt (Campins et al. 2010; Bottke et al. 2015). The physical state of its surface, unresolvable by ground-based observations, can be constrained and used to determine whether key spectral slopes are caused by compositional or grain-size effects (Müller et al. 2012; Emery et al. 2014; Binzel et al. 2015).
The Design Reference Mission (DRM) (Mink et al. 2014) contains ten operational phases. Figure 23 of Lauretta et al. (2018) illustrates all of them. To support the primary objective of returning a pristine sample of asteroid Bennu to Earth, each mission phase will increase the knowledge of Bennu (or of the calibration and performance of the imagers). OCAMS will acquire data in nearly all mission phases to inform the key decision points faced by the OSIRIS-REx team. As the mission progresses, the fidelity of the asteroid shape and distribution of the surface features on Bennu will gradually improve with corresponding increases in image spatial resolution. In particular, the OSIRIS-REx team will refine knowledge of the surface slopes, regolith grain size, and composition of candidate sample sites until a sampling site is chosen.
The early phases (Approach, Preliminary Survey) will focus on acquiring Bennu as a point source, gathering long-range optical navigation, and shape-model imaging with the PolyCam, as well as performing astrometry and disk-integrated photometry and conducting a natural satellite survey with the MapCam. Following the Approach and Preliminary Survey phases, the OSIRIS-REx team will generate an early shape model that, combined with the radio science (McMahon et al. 2018), will establish the gravitational field and whether or not the environment near Bennu is debris free and safe for orbital insertion. Successfully entering orbit immediately following the Preliminary Survey will represent a significant mission milestone and retire a great deal of risk.
After leaving orbit, the spacecraft will proceed through multiple campaigns in Detailed Survey. This phase will focus on improving the resolution of Bennu’s shape model, mapping the distribution of TAGSAM head-sized hazards across the asteroid, and identifying candidate sample sites that can be examined in more detail during subsequent phases. Bennu’s geological and color units will be globally mapped using OCAMS data from this campaign. The data acquired from Detailed Survey will also enable the team to identify up to a dozen candidate sample sites.
The completion of Detailed Survey will initiate Orbital B, where the 12 sites will be imaged at higher resolution and more subtle illumination geometries to support a down-selection to two candidate sites. Successive mission phases (Reconnaissance and TAG Rehearsal) will acquire the highest-resolution data at the two prospective sample sites. The OSIRIS-REx team will this information to plan the TAG (touch and go) maneuver and decrease the risk associated with carrying out TAG. Finally, the Sampling Phase will collect the sample from the prime candidate site and record the sampling event.
5.1 Approach Phase
During the Approach phase, the OCAMS imagers will verify the location of the asteroid and confirm the trajectory of the spacecraft, identify any near-asteroid dust clouds from a range of 1 million km, search for natural satellites from 1000-km and 200-km ranges, and begin to assemble images for a preliminary shape model (Lauretta et al. 2018). On approach to Bennu, MapCam will also measure both the disk-integrated phase function and asteroid light curve, observations that can be compared to similar ground-based and Hubble Space Telescope studies (Hergenrother et al. 2013). Figure 26 of Lauretta et al. (2018) shows the approach trajectory in schematic form. While the expected position of Bennu has an uncertainty of a few km (Milani et al. 2009; Chesley et al. 2014), a campaign to acquire the asteroid from a range of some 2 million km will begin in August 2018. During the campaign OCAMS will image Bennu against the star field background to precisely determine its position, and a regular series of PolyCam frames will be acquired to allow optical navigation to verify the asteroid’s trajectory (18 images every 3 days for a month and a half, then 18 every day for a full month).
Both PolyCam and MapCam are capable of performing the campaign to acquire the asteroid: while the OSIRIS-REx team expects PolyCam to acquire Bennu in late August, the MapCam should be able to acquire it by mid-September, well in advance of the trajectory correction maneuver AAM1 (Lauretta et al. 2018, Fig. 26) planned for the beginning of October 2018. Bennu will become an extended object for all three cameras in October: near October 12 for PolyCam at a range around 37,000 km; near the 15th for MapCam at a range around 7400 km; and not until the 26th for SamCam at a range of 1400 km.
In mid-September, the PolyCam and MapCam will conduct a campaign to survey the dust environment proximal to Bennu, with 64 images each planned. These observations will capture Bennu as a point source (range nearly 1000000 km), imaging the asteroid’s iso-photopic fall-off and comparing it to comet-like profiles where the signature of a coma is evident.
Further observation programs during this phase will include:
-
1.
A full suite of MapCam images (1152) to measure Bennu’s light curve in four colors
-
2.
400 MapCam images to measure Bennu’s phase function in four colors
-
3.
120 MapCam images devoted to two satellite-search campaigns, one from a 1000-km and one from a 200-km range
-
4.
1142 PolyCam images devoted to shape-model determination acquired in the last week and a half before spacecraft arrival in proximity to Asteroid Bennu, as the range decreases from 140 to 25 km
5.2 Preliminary Survey
Several campaigns across the mission will be devoted to the development of accurate digital terrain models of the asteroid using MapCam and PolyCam. During the Preliminary Survey phase the asteroid shape and gravity models will be significantly improved. Three hyperbolic trajectories will cross over and under Bennu’s north and south poles and move along the equator at a close-approach range of 7 km (Lauretta et al. 2018, Fig. 27). The team will use the spacecraft’s radio track and improved shape to refine the Bennu’s gravitational field, allowing for entry into a safe orbit (Orbital A). A large number of PolyCam images will be acquired in three transits over the north and south poles as well as an equatorial flyby. MapCam and PolyCam will deliver image with which to construct a 75-cm-resolution shape model (Digital Terrain Model, or DTM) and associated maplets/landmarks by the end of Preliminary Survey to allow for transition to landmark-based OpNav to occur during Orbital A (Berry et al. 2013, 2015; McMahon et al. 2014, 2018; Beshore et al. 2015; Antreasian et al. 2016; Mario and Debrunner 2016). At least 100 landmarks will be identified by the end of this period.
5.3 Orbital A
During Orbital A, the spacecraft will take up a 1- to 1.5-km-radius 50-hour terminator orbit around Bennu; it will be the first time a manmade object assumes an orbit around a body so small (Lauretta et al. 2018, Fig. 28). Currently no OCAMS images are planned during Orbital A; this phase provides a 4-week period for the Flight Dynamics team to transition from starfield-based to landmark-based optical navigation (Williams et al. 2018).
5.4 Detailed Survey
Detailed Survey will be one of the most important scientific imaging surveys during the OSIRIS-REx mission. During Detailed Survey, >80% of Bennu’s surface will be mapped by separate Pan and color imaging campaigns across a series of hyperbolic flybys (Lauretta et al. 2018, Figs. 29 and 30). The range to the surface and illumination geometries of images acquired during this phase will allow surface hazards to be readily identified and catalogued and will also provide the first digital base maps of Bennu, while simultaneously improving the resolution of the asteroid shape model from 75 to 35 cm. Images acquired during Detailed Survey will inform surface-resolved phase and disk functions, updating the photometric model for Bennu. OSIRIS-REx will perform a high-resolution search for dust and/or gas plumes to identify any potential source regions on the asteroid. Finally, the science team can identify regions of interest (ROIs), areas of regolith free from hazards, and divide Bennu’s surface into “go” and “no-go” areas. The ROIs identified during this period will be subjected to further study at higher resolution.
During the Baseball Diamond campaign, PolyCam will acquire a comprehensive set of images from a range of 3.5 km, where the instantaneous field of view (IFOV) is 5 cm/pixel, with the goal of identifying all hazards \(>21~\mbox{cm}\) on the surface of Bennu (Lauretta et al. 2018, Fig. 29). These images will be mosaicked into digital base maps and also improve Bennu’s shape model to an accuracy of better than 35 vertical cm per facet.
The second part of Detailed Survey will include seven equatorial stations located at distinct local asteroid times ranging from 12:30 p.m. to 3 a.m. Observations will be acquired at each station during south-to-north hyperbolic flybys at a range of 5 km from the surface of Bennu (Lauretta et al. 2018, Fig. 30). As the spacecraft passes through the equatorial plane of Bennu, the field of view of MapCam will sweep from pole to pole while the asteroid rotates over a full rotation period, thus providing global coverage. MapCam will acquire images in all four color filters. These data will provide sufficient information to derive a surface-resolved phase function of Bennu per wavelength and update the disk-integrated photometric model of the asteroid acquired from approach and ground-based observations (Takir et al. 2015). Bennu’s phase function is likely to be interesting for two reasons that are strongly correlated: composition and micro-texture. As observed in Hergenrother et al. (2013), as asteroid albedos decrease, the magnitudes of the slopes of their phase functions increase, especially for carbonaceous asteroids (Li et al. 2006). Throughout the mission, OCAMS observations at different scales will clarify this correlation and potentially elucidate the cohesive properties of Bennu’s carbonaceous regolith.
Detailed Survey MapCam data, especially those acquired at low phase angle, will reveal the spectral properties of Bennu at high spatial resolution. Using these images, band-ratio composites can be generated to determine the strength of visible–near IR slopes as well as the presence of the 700-nm absorption feature indicative of the Fe-bearing phyllosilicates in carbonaceous chondrites (e.g., Johnson and Fanale 1973; King and Clark 1989). Global band-ratio maps of Bennu will be assembled from these data in an effort to illustrate the distribution of color-units on Bennu. Color-units will be a powerful diagnostic for understanding if spectral variations are associated with differences in surface composition (e.g., Delamere et al. 2010; Le Corre et al. 2013), grain size and particle size-frequency distribution (e.g., Jaumann et al. 2016), or space weathering (Chapman 1996). Correlating these observations with spectrometer measurements will allow for enhanced identification of scientifically compelling ROIs—perhaps indicating areas with a maximum likelihood of volatile content.
A MapCam X-filter reflectance map acquired from these images will also serve as a proxy for the performance of the GNC LIDAR (Light Detection and Ranging), used to guide the spacecraft toward Bennu’s surface during the TAG rehearsal and TAG maneuvers. Specifically, these data (acquired at 860 nm) can be extrapolated to a 1064-nm reflectance map using OVIRS’ spectral results as a key. The mission team will use this map to ensure that any candidate TAG site is within the range of reflectance values for which the LIDAR is designed to operate.
Researchers have noted that Bennu may be a transitional object between comets and asteroids and may have active dust and/or gas plumes. Accordingly, MapCam (backed up by PolyCam) will search for plumes during a campaign of Pan observations of the asteroid limb at high phase angles (∼135°) in forward-scattered light. If and when plumes are observed, the mission team will model the observed plumes in order to identify their surface origin(s). Finally, geological maps based on the MapCam data can be used to study four important feature types: craters, linear features, boulders, and regolith in order to classify Bennu’s surface, as well as revealing its topography sufficiently to understand its geological history (Walsh and Richardson 2006; Delbo and Michel 2011; Walsh et al. 2012, 2013; Connolly 2015).
5.5 Orbital B
After Detailed Survey, the spacecraft will transfer to a 1.0-km-radius orbit with an average range to surface of 0.75 km, and begin the Orbital B phase (Lauretta et al. 2018, Fig. 31). During various campaigns within this phase, PolyCam will acquire a series of images at 1 cm per pixel to characterize up to 12 candidate sample sites by identifying features with a maximum size of 5 cm. The high-phase-angle illumination geometries characterizing these observations can be expected to enhance detectability of pebbles and small cobbles by the relatively long shadows they cast. These detailed images will be used in tandem with context imaging from earlier phases to further catalogue the grain size-frequency distribution on Bennu and ensure that surface material at the candidate sites can be ingested by TAGSAM. Prior to Orbital B, the mission team expects a second DTM to be delivered with a resolution of 35 cm.
The spacecraft trajectory during Orbital B will provide a “Safe Home” state from which all sampling sorties can depart and return. The 12 candidate sites identified in Orbital B will be reduced to two sites: a primary and secondary. Armed with a high-resolution asteroid shape model, spin state, gravity models, well-calibrated propulsion and attitude control systems, and the experience gained from performing precise, close-proximity maneuvers from this orbit, the OSIRIS-REx science team will embark on campaigns to inspect specific potential sample sites at closer range in the Reconnaissance phase.
5.6 Reconnaissance
During the Reconnaissance phase, the mission will image primary and backup sample sites at increasingly higher resolution to verify their viability. Sampleable regolith consists of particles and grains 2 cm or smaller in diameter: this is the diameter than can safely fit through the throat of the TAGSAM head. PolyCam (backed up by MapCam) will verify the presence and map the extent of such grains for prospective sample sites.
The Reconnaissance phase will consist of four 225-m-altitude flyovers over the illuminated side of Bennu, out of the 1-km terminator orbit plane, to collect sampleability data for two candidate sites, followed by two 525-m flyovers of both sites to characterize their science value with MapCam color imaging (Lauretta et al. 2018, Fig. 32). The six low-range sorties will be spaced by two-week intervals in the 1-km Safe Home orbit. Between sorties, the mission team will process, analyze and interpret the data in order to evaluate the selection of the prime site. The 525-m sorties will be performed to collect spectral data with favorable illumination (40°–70° solar phase angles) to aid in determining the site’s composition and identifying whether phyllosilicates are present.
For the four 5-hour flyovers at 225-m range, solar phase angle will vary between 30° and 50°. This viewing geometry will provide both sufficient light and shadows to identify 2-cm-sized pebbles. During the transit to each site the spacecraft will retain a thermally favorable attitude, with the High Gain Antenna (HGA) pointed at the sun. Prior to reaching the site, the spacecraft will reorient to a nadir-pointing attitude and slew back and forth perpendicular to the flight direction, collecting images with PolyCam and altimetry data with OLA. The trajectory will target ranges to the surface between 200 m and 287 m, the altitudes at which PolyCam provides sub-cm spatial resolution if one assumes each target pebble to be at least 5 pixels wide. Following each flyover, the spacecraft will return to a sun-point attitude until it performs a maneuver to return to the 1-km-radius orbit. While in the 1-km orbit, spacecraft operations will follow a similar pattern of 16 hours of nadir and nadir-relative pointing for optical navigation image collection, and 8 hours of downlink and tracking. OVIRS solar calibrations will also occur from the 1-km orbit. Following two weeks of data evaluation and planning, the mission will repeat the 225-m flyover maneuver and observing sequence until both sites have been surveyed.
During the 525-m flyovers, MapCam will acquire Pan and color filter images at each of the candidate sample sites. Images will be concentrated around the site, with a slower image cadence on approach and return. Only Pan images will be collected during the approach to the sample site and on return to safe home orbit to give context to the color data and to minimize the data volume per sortie. Images acquired during this phase will be used to construct band-ratio composites of the final two sites to aid in an assessment of their scientific value.
5.7 TAG Rehearsal
OSIRIS-REx’s trajectory to the surface will be a three-segment pathway in space and time synchronized with the rotation of Bennu (Lauretta et al. 2018, Fig. 33). The mission planners have designed this trajectory to deliver the spacecraft to the selected sample site and allow it to contact the surface for sampling. The spacecraft will travel autonomously along a predefined corridor to a final leg. Two predefined maneuvers will punctuate the journey—at the waypoints known as Checkpoint and Matchpoint. Passing through these successfully will require the spacecraft to achieve a particular spacecraft state (location plus velocity) at a specific time.
Preparing for this scenario will consist of rehearsing these two critical maneuvers in a mission phase called TAG Rehearsal. The spacecraft will traverse the corridor to the primary sample site and practice flying through each of the two control points. The mission team will evaluate the ability to deliver the spacecraft to the targeted sample site with an accurate touchdown velocity and minimum attitude and rate errors, which will include acquiring MapCam and SamCam images and comparing them to the expected image set.
5.8 Sampling
During the Sampling campaign, the spacecraft will approach the primary sample site in a deliberate maneuver that safely harvests at least 60 grams of Bennu’s regolith from its surface (Lauretta et al. 2018, Fig. 34). The MapCam and SamCam images pre- and post-Checkpoint and pre- and post-Matchpoint will contribute significant science. Nearly all post-Matchpoint images will provide unique views of the sample site. These data will not only document the pre-sampled state of the sample area, but will also capture frames from the touch-and-go sampling maneuver, which will help to assess its success. SamCam frames, which will be acquired at a range of 3–5 m and a rate of three every 5 seconds, will optically verify the release and effects of the flow of gas that will activate the sampled regolith. The mission team plans to acquire some 200 MapCam images during the entire TAG sequence, and about 150 SamCam images.
5.9 Post-Sampling Verification
Immediately after sampling, the spacecraft will retreat to a range from Bennu of 20 km. Here, the spacecraft will perform a rotation to measure its moment of inertia, which the mission team will compare to the pre-sample value in order to verify that the required mass was collected. SamCam will then image the TAGSAM head to document the presence of the sample and thus to determine and verify the success of both the bulk and surface-sampling efforts. If the mission team finds the sampling event to have been successful, it will command the TAGSAM arm to place the TAGSAM head into the Sample Return Capsule (SRC), and at the appropriate maneuver window, OSIRIS-REx will begin its journey back to Earth.
The SamCam will collect three series of images following the sampling event(s). They will inform three different verifications. In each instance the SamCam will image the TAGSAM head using the 2.1-m diopter plate. The spacecraft will reposition the TAGSAM arm in order to achieve this distance. It will reorient the TAGSAM head so that images are collected at a minimum of three different positions. The SamCam will acquire each at a different sun angle.
Several aspects of the post-sample TAGSAM head will be of interest: (1) the images will provide optical documentation of the total area of the TAGSAM surface sample collection discs covered with sample; researchers will assess this area and use it to determine whether sufficient surface sample mass has been acquired; (2) the SamCam will record the TAGSAM head backlit by solar light in order to observe the silhouette of sample contained within the chamber seen through the head’s screens; (3) the mission team will use a series of images along the head’s bottom surface to determine if any particles clinging to the TAGSAM head are large enough to cause interference with entry into the sample return capsule (SRC); the largest diameter of the adhering particles must be less than 6.0 mm to not interfere with SRC storage.
6 Conclusion
Of more than 100 exploratory deep-space missions sent beyond low-Earth orbits by various space agencies, very few have attempted to collect a sample from a planetary body and return it to Earth on a single visit. Missions have typically relied upon an object’s prior exploration, survey, mapping, and even landed investigations (Siddiqi 2002) to gather actionable details about that body’s environment and physical state. For example, the U.S.S.R. Luna program launched at least 24 separate spacecraft to the Earth’s Moon, whose primary tasks included intentionally crash-landing, orbiting, and landing on the surface and documenting its conditions before one returned a sample from its surface. Space missions often failed, requiring multiple attempts to increase the probability of a single success.
In contrast, OSIRIS-REx will perform sample collection and sample return on humanity’s first physical encounter with Bennu. The three OCAMS imagers, and the well-chosen complement of instruments mounted on OSIRIS-REx science deck, will greatly contribute toward mitigating the risk of this encounter. Combining low- (SamCam), medium- (MapCam), and high-resolution (PolyCam) optical systems with a radiometric sensitivity tuned to the low albedo of the target, OCAMS will provide long-range Bennu acquisition, sub-centimeter surface sample site reconnaissance, global mapping and shape determination, optical navigation during the approach phase and as a back-up during proximity operations, sample-site characterization, sample-acquisition documentation, and post-sample verification of sampling success. In addition, various critical direction and velocity changes can be independently documented, up to and including the TAG (touch-and-go) maneuver that acquires the sample itself, providing both a check and a backup to the mission’s navigation cameras. At every stage, the cameras will identify possible hazards: satellites, potential dust plumes, extreme slopes, large boulders, and smaller cobbles.
The imagers—especially MapCam and PolyCam—will provide redundant capabilities for each other’s key tasks and provide context for one another by imaging the asteroid’s surface from alternate ranges. The medium-angle MapCam can, if necessary, provide both long-range Bennu acquisition and sub-cm sample site reconnaissance of the surface of Bennu. The PolyCam can enable global mapping and shape determination and sample-site reconnaissance, and can support optical navigation during proximity operations. The wide-angle SamCam can perform sample-site characterization and optical navigation.
The OCAMS concept of operations was an important aspect of designing the Design Reference Mission. The DRM organized the mission’s stages into various phases characterized by the spacecraft’s mean distance from Bennu, the character of its orbit, whether hyperbolic or elliptical, and the intensity and direction of solar illumination. These characteristics allowed for the specification of camera requirements which were traded off against altering the DRM in its key aspects in order to minimize both technical and development risk across mission, spacecraft, and instrument implementation.
In addition to their role as a mission system, the OCAMS imagers will increase the overall scientific return of the mission by documenting the surface of a microgravity object at unusually high resolution over a high proportion of its surface. These observations will provide insight into the microgravity physics of Bennu, a body representative of the planetesimals that acted as the building blocks of the solar system. Images acquired by OCAMS will hopefully reveal the physical processes at work on Bennu’s surface, its surrounding environment, and subsequently the asteroid’s geological history. They will provide visual documentation to detail the nature of mass wasting and material ponding processes, particle size-frequency distributions at sub-centimeter scales, and cohesion of surface regolith as it interacts with the TAGSAM during sampling. These details will be vital for understanding the strength and structure of small bodies and geological processes that exist within microgravity environments.
Pairing high-resolution OCAMS images with other OSIRIS-REx instrument results will provide complimentary datasets that enhance one another. Correlating MapCam color images with OVIRS spectra at bands similar to the MapCam filters extends OVIRS’ spectral identifications to higher spatial resolutions. PolyCam images acquired during Reconnaissance detail sub-centimeter grain sizes, will provide some “ground truth” to OTES measurements of thermal inertia at the surface of Bennu. Comparing image-derived stereophotoclinometric shape and terrain models with the OLA terrain data will also provide a unique cross-validation of image-based and LIDAR observation techniques. Finally, comparing images of Bennu as a point source to surface-resolved images acquired during proximity operations will provide a rare opportunity for evaluating disk-integrated observations of asteroids, especially ground-based ones. The requirements and mission plan defined for OSIRIS-REx have been driven by the need to enable and reduce the risk of an asteroid sample-return mission; however, it is clear that these plans have resulted in a robust set of instrumental assets to maximize the science return of the OSIRIS-REx mission.
Abbreviations
- AAM:
-
Asteroid Approach Maneuver
- APID:
-
Application Process Identification
- A/D, ADC:
-
Analog-to-Digital Conversion
- ATLO:
-
Assembly, Test, and Launch Operations
- C&DH:
-
Command and Data Handling
- CCD:
-
Charge-Coupled Device
- CCM:
-
Camera Control Module
- CDS:
-
Correlated Double Sampling
- CM:
-
Configuration Management
- CPU:
-
Computer Processing Unit
- CTE:
-
Coefficient of Thermal Expansion
- DA:
-
Detector Assembly
- DN:
-
Data Number
- DPU:
-
Data Processing Unit
- DRM:
-
Design Reference Mission
- DTCI:
-
Data Telemetry Command Interface
- DTM:
-
Digital Terrain Model
- ECAS:
-
Eight-Color Asteroid Survey
- EPER:
-
Extended-Pixel Edge Response
- EQM:
-
Engineering Qualification Model
- F/:
-
F-Stop or F-number
- FITS:
-
Flexible Image Transport System
- FM:
-
Flight Model
- FOV:
-
Field of View
- FPGA:
-
Field-Programmable Gate Array
- FRED:
-
Fred Optical Engineering Software
- FSW:
-
Flight Software
- FWHM:
-
Full-Width-at-Half-Max
- GNC:
-
Guidance Navigation and Control
- GSFC:
-
Goddard Space Flight Center
- HGA:
-
High Gain Antenna
- IFOV:
-
Instantaneous Field of View
- IP:
-
Intellectual Property
- ISO:
-
International Standards Organization
- L1:
-
Lens 1
- LED:
-
Light-Emitting Diode
- LGA:
-
Low Gain Antenna
- LIDAR:
-
Light Detection and Ranging
- LPL:
-
Lunar and Planetary Laboratory
- LSF:
-
Line-Spread Function
- LVDS:
-
Low-Voltage Differential Signaling
- LVPS:
-
Low-Voltage Power Supply
- MapCam:
-
Mapping Camera
- MDR:
-
Minimum Detectable Radiance
- MGA:
-
Medium Gain Antenna
- MHD:
-
Motor/Heater Interface/Driver
- MTF:
-
Modulation Transfer Function
- NASA:
-
National Aeronautics and Space Administration
- NFPO:
-
New Frontiers Program Office
- NFT:
-
Natural Feature Tracking
- NIR:
-
Near-Infrared
- NIST:
-
National Institute of Standards & Technology
- OCAMS:
-
OSIRIS-REx Camera Suite
- OLA:
-
OSIRIS-REx Laser Altimeter
- OSIRIS-REx:
-
Origins, Spectral Interpretation, Resource Identification, Security–Regolith Explorer
- OST:
-
Optical Support Tube
- OTES:
-
OSIRIS-REx Thermal Emission Spectrometer
- OVIRS:
-
OSIRIS-REx Visible and InfraRed Spectrometer
- Pan:
-
Panchromatic
- PAPL:
-
Project-Approved Parts List
- PCB:
-
Parts Control Board
- PIL:
-
Parts Identification List
- PSNIT:
-
Point Source Normalized Irradiance Transmittance
- PolyCam:
-
Polyfunctional Camera
- PRT:
-
Platinum Resistance Thermometer
- QTH:
-
Quartz-Tungsten-Halogen
- REXIS:
-
Regolith X-ray Imaging Spectrometer
- RMS:
-
Root-Mean-Square
- ROI:
-
Region of Interest
- RTS:
-
Random Telegraph Signal
- RWA:
-
Reaction Wheel Assembly
- SamCam:
-
Sample Acquisition Verification Camera
- S/C:
-
Spacecraft
- S/N, SNR:
-
Signal-to-Noise Ratio
- SDRAM:
-
Synchronous Dynamic Random Access Memory
- SPI:
-
Serial Peripheral Interface
- SRC:
-
Sample Return Capsule
- TAG:
-
Touch And Go
- TAGCAMS:
-
Touch And Go Camera System
- TAGSAM:
-
Touch And Go Sample Acquisition Maneuver
- Ti 6Al-4V:
-
Titanium Alloy (Titanium, 6% Aluminum, 4% Vanadium)
- TID:
-
Total Ionization Dose
- TVAC:
-
Thermal Vacuum
- UA:
-
University of Arizona
- UUT:
-
Unit-Under-Test
- UV:
-
Ultraviolet
- VML:
-
Virtual Machine Language
References
T. Ajluni, T. Linn, W. Willcockson, D. Everett, R. Mink, J. Wood, OSIRIS-REx, returning the asteroid sample. NASA Technical Report GSFC-E-DAA-TN19766, 2015 IEE Aerospace Conf. (4–17 Mar. 2015)
B. Allen, J. Grindlay, J. Hong, R.P. Binzel, R. Masterson, N.K. Inamdar, M. Chodas, M.W. Smith, M.W. Bautz, S.E. Kissel, J. Villasenor, M. Oprescu, N. Induni, The REgolith X-Ray Imaging Spectrometer (REXIS) for OSIRIS-REx: identifying regional elemental enrichment on asteroids, in Optical Modeling and Performance Predictions VI, ed. by M.A. Kahan, M.B. Levine. Proc. of SPIE, vol. 8840 (2013)
P.G. Antreasian, M. Moreau, C. Jackman, K. Williams, B. Page, J.M. Leonard, OSIRIS-REx orbit determination covariance studies at Bennu, in AAS 16-101, A 39th AAS Guidance, Navigation, and Control Conference, Breckenridge, CO (2016)
K. Berry, P. Antreasian, M.C. Moreau, A. May, B. Sutter, OSIRIS-REx touch-and-go (TAG) navigation performance, in AAS 15-125, 38th AAS Guidance, Navigation, and Control Conference, Breckenridge, CO (2015)
K. Berry, B. Sutter, A. May, K. Williams, B.W. Barbee, M. Beckman, B. Williams, OSIRIS-REx touch-and-go mission design and analysis, in AAS 13-095, 36th Annual AAS Guidance and Control Conference (2013)
E. Beshore, B. Sutter, R. Mink, D. Lauretta, M. Moreau, W. Boynton, D. Everett, J. Dworkin, C. Shinohara, J. Gal-Edd, The OSIRIS-REx asteroid sample return mission, in IEEE Aerospace Conference (2015)
E.B. Bierhaus, B.C. Clark, J.W. Harris, K.S. Payne, R.D. Dubisher, D.W. Wurts, R.A. Hund, R.M. Kuhns, T.M. Linn, J.L. Wood, A.J. May, J.P. Dworkin, E. Beshore, D.S. Lauretta, The OSIRIS-REx Touch-and-Go Sample Acquisition Mechanism (TAGSAM) and flight system. Space Sci. Rev. 214 (2018, this issue)
R.P. Binzel, F.E. DeMeo, B.J. Burt, E.A. Cloutis, B. Rozitis, T.H. Burbine, H. Campins, B.E. Clark, J.P. Emery, C.W. Hergenrother, E.S. Howell, D.S. Lauretta, M.C. Nolan, M. Mansfield, V. Pietrasz, D. Polishook, D.J. Scheeres, Spectral slope variations for OSIRIS-REx target asteroid (101955) Bennu: possible evidence for a fine-grained regolith equatorial ridge. Icarus 256, 22–29 (2015)
B.J. Bos, M.A. Ravine, M. Caplinger, J.A. Schaffner, J.V. Ladewig, R.D. Olds, C.D. Norman, D. Huish, M. Huges, S.K. Anderson, D.A. Lorenz, A. May, C.D. Jackman, D. Nelson, M. Moreau, D. Kubitschek, K. Getzandanner, K.E. Gordon, A. Eberhardt, D.S. Lauretta, Touch and Go Camera System (TAGCAMS) for the OSIRIS-REx asteroid sample return mission. Space Sci. Rev. 214 (2018, this issue)
W.F. Bottke, D. Vokrouhlický, K.J. Walsh, M. Delbo, P. Michel, D.S. Lauretta, H. Campins, H.C. Connolly, D.J. Scheeres, S.R. Chelsey, In search of the source of asteroid (101955) Bennu: applications of the stochastic YORP model. Icarus 247, 191–217 (2015)
H. Campins, A. Morbidelli, K. Tsiganis, J. De Leon, J. Licandro, D. Lauretta, The origin of asteroid 101955 (1999 RQ36). Astrophys. J. Lett. 721(1), L53–57 (2010)
C.R. Chapman, S-type asteroids, ordinary chondrites and space weathering: the evidence from Galileo’s fly-bys of Gaspra and Ida. Meteorit. Planet. Sci. 31, 699–725 (1996)
S.R. Chesley, D. Farnocchia, M.C. Nolan, D. Vokrouhlický, P.W. Chodas, A. Milani, F. Spoto et al., Orbit and bulk density of the OSIRIS-REx target asteroid (101955) Bennu. Icarus 235, 5–22 (2014)
P.R. Christensen, V.E. Hamilton, G.L. Mehall, D. Pelham, W. O’Donnell, S. Anwar, H. Bowles, S. Chase, J. Fahlgren, Z. Farkas, T. Fisher, O. James, I. Kubik, I. Lazbin, M. Miner, M. Rassas, L. Schulze, K. Shamordola, T. Tourville, G. West, R. Woodward, D.S. Lauretta, The OSIRIS-REx thermal emission spectrometer (OTES) instrument. Space Sci. Rev. 214 (2018, this issue)
B.C. Clark, E.B. Bierhaus, J.W. Harris, K.S. Payne, D.W. Wurts, R.D. Dubisher, S.L. Deden, TAGSAM: a gas-driven system for collecting samples from solar system bodies, in IEEE Aerospace Conference (2016)
B.E. Clark, R.P. Binzel, E.S. Howell, E.A. Cloutis, M. Ockert-Bell, P. Christensen, M.A. Barucci, F. DeMeo, D.S. Lauretta, H.C. Connolly Jr., A. Soderberg, C. Hergenrother, L. Lim, J. Emery, M. Mueller, Asteroid (101955) 1999 RQ36: spectroscopy from 0.4 to 2.4 μm and meteorite analogs. Icarus 216(2), 462–475 (2011)
H.C. Connolly, Towards understanding the dynamical evolution of asteroid 25143 Itokawa: constraints from sample analysis. Earth Planets Space 67, 12 (2015)
M.G. Daly, O.S. Barnouin, G. Dickinson, J. Seabrook, C.L. Johnson, G. Cunningham, T. Haltigin, D. Gaudreau, C. Brunet, I. Aslam, A. Taylor, E.B. Bierhaus, W. Boynton, M. Nolan, D.S. Lauretta, The OSIRIS-REx Laser Altimeter (OLA) investigation and instrument. https://doi.org/10.1007/s11214-017-0375-3
W.A. Delamere, L.L. Tornabene, A.S. McEwen, K. Becker, J.W. Bergstrom, N.T. Bridges, E.M. Eliason et al., Color imaging of Mars by the High Resolution Imaging Science Experiment (HiRISE). Icarus 205, 38–52 (2010)
M. Delbo, P. Michel, Temperature history and dynamical evolution of (101955) 1999 RQ 36: a potential target for sample return from a primitive asteroid. Astrophys. J. Lett. 728(2), L42 (2011)
J.P. Dworkin, L.A. Adelman, T. Ajluni, A.V. Andronikov, J.C. Aponte, A.E. Bartels, D.M. Ballou, E. Beshore, E.B. Bierhaus, W.V. Boynton, J.R. Brucato, B.H. Bryan, A.S. Burton, M.P. Callahan, S.L. Castro-Wallace, B.C. Clark, S.J. Clemett, H.C. Connolly Jr., W.E. Cutlip, S.M. Daly, V.E. Elliott, J.E. Elsila, H.L. Enos, D.F. Everett, I.A. Franchi, J.S. Fust, D.P. Glavin, H.V. Graham, J.E. Hendershot, J.W. Harris, S.L. Hill, A.R. Hildebrand, G.O. Jayne, R.W. Jenkens Jr., K. Johnson, W.E. Kretsch, R.M. Kuhns, D.S. Lauretta, J.V. Ladewig, A.S. Lewis, J. Loiacono, C.C. Lorentson, J.R. Marshall, M.G. Martin, L.L. Matthias, H.L. McLain, S.R. Messenger, R.G. Mink, J. Moore, K. Nakamura-Messenger, J.A. Nuth III, C.V. Owens, C.L. Parish, B.D. Perkins, M.S. Pryzby, C.A. Reigle, K. Righter, B. Rizk, W.D. Roher, J.F. Russell, S.A. Sandford, J.P. Schepis, J. Songer, M.F. Sovinksi, S.E. Stah, K. Thomas-Keprta, J.M. Vellinga, M.S. Walker, OSIRIS-REx contamination control strategy and implementation. Space Sci. Rev. 214 (2018, this issue). https://doi.org/10.1007/s11214-017-0439-4
J.P. Emery, Y.R. Fernández, M.S.P. Kelley, K.T. Warden, C. Hergenrother, D.S. Lauretta, M.J. Drake, H. Campins, J. Ziffer, Thermal infrared observations and thermophysical characterization of OSIRIS-REx target asteroid (101955) Bennu. Icarus 234, 17–35 (2014)
S. Fornasier, D. Perna, C. Lantz, M. Barucci, The Themis-Beagle families: investigation of space-weathering processes on primitive surfaces, in Conference Abstracts ACM 2014, Helsinki, Finland (2014)
A. Fujiwara, J. Kawaguchi, D.K. Yeomans, M. Abe, T. Mukai, T. Okada, J. Saito, H. Yano, M. Yoshikawa, D.J. Scheeres et al., The rubble-pile asteroid Itokawa as observed by Hayabusa. Science 312, 1330–1334 (2006)
R.W. Gaskell, O.S. Barnouin-Jha, D.J. Scheeres, A.S. Konopliv, T. Mukai, S. Abe, J. Saito et al., Characterizing and navigating small bodies with imaging data. Meteorit. Planet. Sci. 43(6), 1049–1061 (2008)
K. Getzandanner, D. Rowlands, E. Mazarico, P. Antreasian, C. Jackman, M. Moreau, An independent orbit determination simulation for the OSIRIS-REx asteroid sample return mission, in AAS 16-103, AAS GNC Conference, Breckenridge, CO, Feb. 5–10, 2016
D. Golish, W. Black, S. O’Dougherty, S. Peterson, L. Harrison, C. Drouet d’Aubigny, An angled slit MTF calculation technique for alignment and characterization of the OSIRIS-REx Camera Suite. Imaging and Applied Optics OSA, paper IM2C.5 (2014). https://doi.org/10.1364/ISA.2014.IM2C.5. Accessed 4 March 2017
R.W. Hamilton, C. Norman, D. Huish, OSIRIS-REx asteroid sample collection: open-loop testing of optical-based feature tracking at the Space Operations Simulation Center (SOSC), in AAS 16-086, AAS GNC Conference, Breckenridge, CO Feb. 5–10, 2016
C.W. Hergenrother, M.C. Nolan, R.P. Binzel, E.A. Cloutis, M.A. Barucci, P. Michel, D.J. Scheeres, C.D. d’Aubigny, D. Lazzaro, N. Pinilla-Alonso, H. Campins, J. Licandro, B.E. Clark, B. Rizk, E.C. Beshore, D.S. Lauretta, Lightcurve, color and phase function photometry of the OSIRIS-REx target asteroid (101955) Bennu. Icarus 226, 663–670 (2013)
C.W. Hergenrother, M.A. Barucci, O. Barnouin, B. Bierhaus, R.P. Binzel, W.F. Bottke, S. Chesley, B.C. Clark, B.E. Clark, E. Cloutis, C.D. d’Aubigny, M. Delbo, J. Emery, B. Gaskell, E. Howell, L. Keller, M. Kelley, J. Marshall, P. Michel, M. Nolan, B. Rizk, D. Scheeres, D. Takir, D.D. Vokrouhlicky, W. Beshore, D.S. Lauretta. The design reference asteroid for the OSIRIS-REx mission target (101955) Bennu. An OSIRIS-REx Document (April 14, 2014)
S.G. Hesar, D.J. Scheeres, J.W. McMahon, Sensitivity analysis of the OSIRIS-REx terminator orbits to maneuver errors. J. Guid. Control Dyn. 40(1), 81–95 (2017). https://doi.org/10.2514/1.G002058
R. Jaumann, K. Stephan, K. Krohn, K.D. Matz, K. Otto, W. Neumann, M.C. De Sanctis, Age-dependent morphological and compositional variations on Ceres, in Lunar and Planetary Science Conference, vol. 47 (2016), p. 1455
T.V. Johnson, F.P. Fanale, Optical properties of carbonaceous chondrites and their relationship to asteroids. J. Geophys. Res. 78, 8507–8518 (1973)
Z. Kaňuchová, R. Brunetto, M. Melita, G. Strazzulla, Space weathering and the color indexes of minor bodies in the outer Solar System. Icarus 221(1), 12–19 (2012)
H.U. Keller, H. Hartwig, R. Kramm, D. Koschny, W.J. Markiewicz, N. Thomas, M. Fernades, D.A. Paige, The MVACS Robotic Arm Camera. J. Geophys. Res. 106, 17609–17621 (2001)
T.V. King, R.N. Clark, Spectral characteristics of chlorites and Mg-serpentines using high-resolution reflectance spectroscopy. J. Geophys. Res., Solid Earth 94(B10), 13997–14008 (1989)
C. Lantz, B.E. Clark, M.A. Barucci, D.S. Lauretta, Evidence for the effects of space weathering spectral signatures on low albedo asteroids. Astron. Astrophys. 554, A138 (2013)
D.S. Lauretta, OSIRIS-REx asteroid sample-return mission, in Handbook of Cosmic Hazards and Planetary Defense, ed. by J.N. Pelton, F. Allahdadi (Springer, New York, 2015)
D.S. Lauretta, The seven-year mission to fetch 60 grams of asteroid. Sci. Am. 315(2), 62–69 (2016)
D.S. Lauretta, S.S. Balram-Knutson, E. Beshore, W.V. Boynton, C. Drouet d’Aubigny, D.N. DellaGiustina, H.L. Enos, D.R. Gholish, C.W. Hergenrother, E.S. Howell, C.A. Johnson, E.T. Morton, M.C. Nolan, B. Rizk, H.L. Roper, A.E. Bartels, B.J. Bos, J.P. Dworkin, D.E. Highsmith, M.C. Moreau, D.A. Lorenz, L.F. Lim, R. Mink, J.A. Nuth, D.C. Reuter, A.A. Simon, E.B. Bierhaus, B.H. Bryan, R. Ballouz, O.S. Barnouin, R.P. Binzel, W.F. Bottke, V.E. Hamilton, K.J. Walsh, S.R. Chesley, P.R. Christensen, B.E. Clark, H.C. Connolly, M.K. Crombie, M.G. Daly, J.P. Emery, T.J. McCoy, J.W. McMahon, D.J. Scheeres, S. Messenger, K. Nakamura-Messenger, K. Righter, S.A. Sandford, OSIRIS-REx: sample return from asteroid (101955) Bennu. Space Sci. Rev. 214 (2018, this issue) https://doi.org/10.1007/s11214-017-0405-1
D.S. Lauretta, A.E. Bartels, M.A. Barucci, E.B. Bierhaus, R.P. Binzel, W.F. Bottke, H. Campins, S.R. Chesley, B.C. Clark, B.E. Clark, E.A. Cloutis, H.C. Connolly, M.K. Crombie, M. Delbo, J.P. Dworkin, J.P. Emery, D.P. Glavin, V.E. Hamilton, C.W. Hergenrother, C.L. Johnson, L.P. Keller, P. Michel, M.C. Nolan, S.A. Sandford, D.J. Scheeres, A.A. Simon, B.M. Sutter, D. Vokrouhlicky, K.J. Walsh, The OSIRIS-REx target asteroid (101955) Bennu: constraints on its physical, geological, and dynamical nature from astronomical observations. Meteorit. Planet. Sci. 50(4), 834–849 (2015)
L. Le Corre, V. Reddy, N. Schmedemann, K.J. Becker, D.P. O’Brien, N. Yamashita, P.N. Peplowski, T.H. Prettyman, J-Y. Li, E.A. Cloutis, B.W. Denevi, T. Kneissl, E. Palmer, R.W. Gaskell, A. Nathues, M.J. Gaffey, D.W. Mittlefehldt, W.B. Garry, E. Ammanito, Olivine or impact melt: Nature of the “Orange” material on Vesta from Dawn. Icarus 226, 1568–1594 (2013)
M.T. Lemmon, P. Smith, C. Shinohara, R. Tanner, P. Woida, A. Shaw, J. Huges, R. Reynolds, R. Woida, J. Penegor, C. Oquest, S.F. Hviid, M.B. Madsen, M. Olsen, K. Leer, L. Drube, R.V. Morris, D. Britt, The Phoenix Surface Stereo Imager (SSI) investigation, in 39th Lunar and Planetary Science Conference (2008), p. 2156
J.-Y. Li, L.A. McFadden, J.W. Parker, E.F. Young, S.A. Stern, P.C. Thomas, C.T. Russell, M.V. Sykes, Photometric analysis of 1 Ceres and surface mapping from HST observations. Icarus 182, 143–160 (2006)
C. Mario, C. Debrunner, Robustness and performance impacts of optical-based feature tracking to OSIRIS-REx asteroid sample collection mission, in AAS 16-087, AAS GNC Conference, Breckenridge, CO, Feb. 5–10, 2016
J. Marshall, B. Rizk, Rounded boulders on Itokawa as clues to geological processes in the early solar system. Planet. Space Sci. 119, 181–184 (2015)
R.A. Masterson, M. Chodas, L. Bayley, B. Allen, J. Hong, P. Biswas, C. McMenamin, K. Stout, E. Bokhour, H. Bralower, D. Carte, M. Chen, M. Jones, S. Kissel, H. Schmidt, M. Smith, G. Sondecker, J. Grindlay, R.P. Binzel, Regolith X-ray Imaging Spectrometer (REXIS) aboard the OSIRIS-REx asteroid sample return mission. Space Sci. Rev. 214 (2018, this issue)
J.W. McMahon, D.J. Scheeres, K. Berry, Asteroid proximity navigation using direct altimetry measurements, in AAS 14-354, AAS Guidance, Navigation, and Control Conference, Breckenridge, CO, Jan 31–Feb. 5, 2014
J.W. McMahon, D.J. Scheeres, S.G. Hesar, D. Farnocchia, S.R. Chesley, D.S. Lauretta, The OSIRIS-REx radio science experiment at Bennu. Space Sci. Rev. 214 (2018, this issue)
C. Merrill, B. Williams, Systems engineering process for the OSIRIS-REx Camera Suite (OCAMS), in INCOSE International Symposium, vol. 26 (2016), pp. 1399–1416. https://doi.org/10.1002/j.2334-5837.2016.00235.x
A. Milani, S.R. Chesley, M.E. Sansaturio, F. Bernardi, G.B. Valsecchi, O. Arratia, Long term impact risk for (101955) 1999 RQ36. Icarus 203, 460–471 (2009)
R. Mink, D.S. Lauretta, J. Dworkin, D. Everett, J. Gal-Edd, M. Walker, A. Bartels, M. Moreau, OSIRIS-REx Project Design Reference Mission and mission plan. OSIRIS-REx-OPS-0002 (2014)
H. Miyamoto, H. Yano, D.J. Scheeres, S. Abe, O. Barnouin-Jha, A.F. Cheng, H. Demura, R.W. Gaskell, N. Hirata, M. Ishiguro, T. Michikami, Regolith migration and sorting on asteroid Itokawa. Science 316(5827), 1011–1014 (2007)
L. Moroz, Space weathering of surface organic materials on dark primitive small bodies, in 35th COSPAR Scientific Assembly (2004)
T.G. Müller, L. O’Rourke, A.M. Barucci, A. Pál, C. Kiss, P. Zeidler, B. Altieri, B.M. González-García, M. Küppers, Physical properties of OSIRIS-REx target asteroid (101955) 1999 RQ36: derived from Herschel, VLT/VISIR, and Spitzer observations. Astron. Astrophys. 548, A36 (2012)
M.C. Nolan, C. Magri, E.S. Howell, L.A.M. Benner, J.D. Giorgini, C.W. Hergenrother, R.S. Hudson, D.S. Lauretta, J-L. Margo, S.J. Ostro, D.J. Scheeres, Shape model and surface properties of the OSIRIS-REx target asteroid (101955) Bennu from radar and lightcurve observations. Icarus 226(1), 629–640 (2013)
D.C. Reuter, A.A. Simon, J. Hair, A. Lunsford, S. Manthripragada, V. Bly, B. Bos, C. Brambora, E. Caldwell, G. Casto, Z. Dolch, P. Finneran, D. Jennings, M. Jhabvala, E. Matson, M. McLelland, W. Roher, T. Sullivan, E. Weigle, Y. Wen, D. Wilson, D.S. Lauretta, The OSIRIS-REx Visible and Infrared Spectrometer (OVIRS): Spectral maps of the asteroid Bennu. Space Sci. Rev. 214 (2018, this issue)
J. Saito, H. Miyamoto, R. Nakamura, M. Ishiguro, T. Michikami, A.M. Nakamura, H. Demura, S. Sasaki et al., Detailed images of asteroid 25143 Itokawa from Hayabusa. Science 312, 1341–1344 (2006)
D.J. Scheeres, S.G. Hesar, S. Tardivel, M. Hirabayashi, D. Farnocchia, J.W. McMahon, S.R. Chesley, O. Barnouin, R.P. Binzel, W.F. Bottke, M.G. Daly, The geophysical environment of Bennu. Icarus 276, 116–140 (2016)
A.A. Siddiqi, Deep Space Chronicle: A Chronology of Deep Space and Planetary Probes 1958–2000. Monographs in Aerospace History, vol. 24 (NASA History Office, 2002)
P.H. Smith, B. Rizk, E. Kinney-Spano, C. Fellows, C.D. d’Aubigny, C. Merrill, The OSIRIS-REx Camera Suite (OCAMS), in LPSC-44. LPI Contribution, vol. 1719 (2013), p. 1690
P.H. Smith, M.G. Tomasko, D. Britt, D.G. Crowe, R. Reid, H.U. Keller, N. Thomas, F. Gliem, P. Rueffer, R. Sullivan, R. Greeley, J.M. Knudsen, M.B. Madsen, H.P. Gunnlaugsson, S.F. Hviid, W. Goetz, L.A. Soderblom, L. Gaddis, R. Kirk, The imager for Mars Pathfinder experiment. J. Geophys. Res. 102, 4003–4025 (1997)
C. Stevens, B. Williams, A. Adams, C. Goodloe, Cleared for launch—lessons learned from the OSIRIS-REx system requirements verification program, in Proceedings of the IEEE Aerospace Conference, Big Sky, MT March, 2017
D. Takir, B.E. Clark, C. Drouet d’Aubigny, C.W. Hergenrother, J.-Y. Li, D.S. Lauretta, R.P. Binzel, Photometric models of disk-integrated observations of the OSIRIS-REx target asteroid (101955) Bennu. Icarus 252, 393–399 (2015)
E.F. Tedesco, D.J. Tholen, B. Zellner, The eight-color asteroid survey: standard stars. Astron. J. 87, 1585–1592 (1982)
M.G. Tomasko, D. Buchhauser, M. Bushroe, L.R. Doose, A. Eibl, C. Fellows, M.J. Pringle, B. Rizk, C. See, P.H. Smith, K. Tsetsenekos, The Descent Imager/Spectral Radiometer (DISR) instrument aboard the Huygens entry probe of Titan. Space Sci. Rev. 104, 469–551 (2002)
F. Vilas, A cheaper, faster, better way to detect water of hydration on Solar System bodies. Icarus 111(2), 456–467 (1994)
K.J. Walsh, M. Delbó, W.F. Bottke, D. Vokrouhlicky, D.S. Lauretta, Introducing the Eulalia and new Polana asteroid families: re-assessing primitive asteroid families in the inner Main Belt. Icarus 225(1), 283–297 (2013)
K.J. Walsh, D.C. Richardson, Binary near-Earth asteroid formation: rubble pile model of tidal disruptions. Icarus 180(1), 201–216 (2006)
K.J. Walsh, D.C. Richardson, P. Michel, Spin-up of rubble-pile asteroids: disruption, satellite formation, and equilibrium shapes. Icarus 220(2), 514–529 (2012)
B. Williams, P. Antreasian, E. Carranza, C. Jackman, J. Leonard, D. Nelson, B. Page, D. Stanbridge, D. Wibben, K. Williams, M. Moreau, K. Berry, K. Getzandanner, A. Liounis, A. Mashiku, D. Highsmith, B. Sutter, D.S. Lauretta, OSIRIS-REx flight dynamics and navigation design. Space Sci. Rev. 214 (2018, this issue)
H. Yano, T. Kubota, H. Miyamoto, T. Okada, D. Scheeres, Y. Takagi, K. Yoshida, M. Abe et al., Touchdown of the Hayabusa spacecraft at the Muses Sea on Itokawa. Science 312, 1350–1353 (2006)
Acknowledgements
We thank the many people throughout the OSIRIS-REx project, at the University of Arizona, at Goddard Space Flight Center, and at Lockheed Martin Space Systems for the tremendous assistance and support they have provided to the development of this camera system. This material is based upon work supported by NASA under Contracts NNM10AA11C, NNG12FD66C, and NNG13FC02C issued through the New Frontiers Program. Copy editing and indexing provided by Mamassian Editorial Services.
Author information
Authors and Affiliations
Corresponding author
Additional information
OSIRIS-REx
Edited by Dante Lauretta and Christopher T. Russell
Rights and permissions
Open Access This article is distributed under the terms of the Creative Commons Attribution 4.0 International License (http://creativecommons.org/licenses/by/4.0/), which permits unrestricted use, distribution, and reproduction in any medium, provided you give appropriate credit to the original author(s) and the source, provide a link to the Creative Commons license, and indicate if changes were made.
About this article

Cite this article
Rizk, B., Drouet d’Aubigny, C., Golish, D. et al. OCAMS: The OSIRIS-REx Camera Suite. Space Sci Rev 214, 26 (2018). https://doi.org/10.1007/s11214-017-0460-7
Received:
Accepted:
Published:
DOI: https://doi.org/10.1007/s11214-017-0460-7