
Abstract
This study proposes an approach for visualizing a knowledge structure, the proposed approach creates a three-dimensional “Research focused parallelship network”, a “Keyword Co-occurrence Network”, and a two-dimensional knowledge map to facilitate visualization of the knowledge structure created by journal papers from different perspectives. The networks and knowledge maps can be depicted differently by choosing different information as the network actor, e.g. author, institute or country keyword, to reflect knowledge structures in micro-, meso-, and macro-levels, respectively. Technology Foresight is selected as an example to illustrate the method proposed in this study. A total of 556 author keywords contained in 181 Technology Foresight related papers have been analyzed. European countries, China, India and Brazil are located at the core of Technology Foresight research. Quantitative ways of mapping journal papers are investigated in this study to unveil emerging elements as well as to demonstrate dynamics and visualization of knowledge. The quantitative method provided in this paper shows a possible way of visualizing and evaluating knowledge structure; thus a computerized calculation is possible for potential quantitative applications, e.g. R&D resource allocation, research performance evaluation, science map, etc.
Mapping knowledge structure by bibliometric analysis
Kuhn (1962) popularized the terms “paradigm” and “paradigm shift”. Dosi (1982) investigated technology trajectories on the basis of paradigm shift and found continuous innovation can be regarded as proceeding within a technology paradigm, while discontinuous innovation might be the initiation of a new paradigm. Many researchers have proposed and applied these methodologies in various knowledge fields for understanding the paradigm or the dynamic development of selected knowledge fields (Gupta and Bhattacharya 2004). The methodology that usually is used for this purpose is bibliometric analysis on the basis of literature publication metadata and information. For example, Kostoff has very complete and systematic studies on literature-related analysis, and published a series of papers based on combination of text mining and statistics on scientific papers. Also he proposes a systematic literature-related discovery method for linking two or more literature concepts that have heretofore not been linked, in order to produce novel, interesting, plausible, and intelligible knowledge (Kostoff et al. 1998, 2002; 2005a, b, 2007a, b, c, d, e, 2008a, b, c, d; Kostoff 2008a, b, c; Kostoff and Briggs 2008). Ding et al. (2001) mapped information retrieval research using co-word analysis on papers collected from the Science Citation Index (SCI) and Social Science Citation Index (SSCI) for the period of 1987–1997. Baldwin et al. (2003) mapped ethics and dementia research using keywords. Tian et al. (2008) used the Institute for Scientific Information (ISI) database to measure scientific output of the field of Geographic Information System (GIS) using keywords. Similar approaches have been made to map knowledge evolution in other fields, such as software engineering (Coulter et al. 1998), chemistry (Callon et al. 1991), scientometrics (Courtial 1994), neural network research (Noyons and Van Raan 1998; Van Raan and Tijssen 1993), biological safety (Cambrosio et al. 1993), optomechatronics (Noyons and Van Raan 1994), bioeletronics (Hinze 1994), adverse drug reactions (Rikken et al. 1995; Clarke et al. 2007), biotechnology (Rip and Courtial 1984; De Looze and Lemarié 1997), environmental science (Ho 2007), condensed matter physics (Bhattacharya and Basu 1998), severe acute respiratory syndrome (SARS), tsunami (Chiu et al. 2004; Chiu and Ho 2007), and Parkinson’s disease (Li et al. 2008).
Also, citation-based analyses together with keyword analysis have been investigated. For example, Kajikawa utilized citation analysis on SCI papers together with clustering citation network actors and analyzing keywords to understand structural change of sustainable energy (Kajikawa et al. 2008), biomass and bio-fuels (Kajikawa and Takeda 2008) and organic LED (Kajikawa and Takeda 2009).
What is the knowledge structure of Technology Foresight research?
Technology Foresight was begun from Delphi research initiated by the Rand Corporation of the US in the 1950s (Landeta 2006; Kaplan et al. 1950), followed by Helmer-Hirschberg and Rescher (1959) and Dalkey (1969). Japan was the first country that started holistic Delphi-based foresight activities at the national level in the early 1970s (NISTEP 2005). These initial efforts were followed by the practices of European governments (Saritas et al. 2007). Already a number of countries have conducted holistic Technology Foresight activities for the formulation of feasible science and technology policies. Some even conducted such activities on a regular basis, e.g. Japan, Korea, etc. (Havas 2003; Saritas et al. 2007; Yang et al. 2004; NISTEP 2005; Schlossstein and Park 2006; Czaplicka-Kolarz et al. 2009; Mu et al. 2008).
To the best of our knowledge, Irvine and Martin (1984) coined the term “foresight” in the early 1980s and pointed to its communication or procedural power, and Linstone and Turoff (1975) defined Delphi as “a method for structuring a group communication problem”. The term foresight is used in the sense of outlook. Foresight is equivalent to a bundle of systematic efforts to look ahead and to choose more effectively (Grupp and Linstone 1999). However, this methodology was first named as “Delphi” 50 years ago, then “foresight”, and recently almost standardized as “Technology Foresight”, as more and more researchers used this term “Technology Foresight” to refer these methods to long term technology forecasting.
Attempts have been made to compare different Technology Foresight activities in order to have a more systematic understanding of the overall picture of Technology Foresight. For example, Martin and Johnston (1999) have compared national foresight exercises conducted in UK, Australia, and New Zealand, Keenan and Popper (2008) compare foresight “style” in six world regions using different indicators, i.e. territorial scale, foresight sponsors, participation scale, time horizon, target groups, domain coverage, methods used, and codified outputs, Gavigan and Scapolo (1999) discuss recent trends in public-administration-led foresight exercises from the perspective of how the choice of objectives and scope is reflected in the methods used. Schlossstein and Park (2006) compare Technology Foresight studies in Korea and China. Alsan and Oner (2003) proposed Integrated Foresight Management Model (IFM) to review national foresight studies to understand the nature of comparative national foresight studies. Grupp and Linstone (1999) summarize recent experiences in government or national technology forecasting which are termed “foresight”. Amsteus (2008) investigates what foresight is, reviews past usages and definitions of foresight, and synthesizes them into one generic definition, in order to make the concept measurable. In summary, many researchers have tried to characterize Technology Foresights conducted in different places and understand the fundamental elements or nature of this research in different contexts. However, they can only partially resolve the structure of Technology Foresight, because there is considerable difference in Technology Foresight activities between the countries and within the countries (Grupp and Linstone 1999).
The purpose of this study is to unveil knowledge structure created by journal papers of Technology Foresight by combing social network analysis and bibliometric analysis. The method proposed in this study, is capable of providing an insight into Technology Foresight. It not only contributes to ways of understanding knowledge structure, but also proposes a method of characterizing journal publications.
Mapping knowledge structure of Technology Foresight by keyword network
A “structure” defines what makes up a system. A “structure” is a collection of inter-related components or services (Wikipedia 2009). The more concrete way of describing a structure is “network” where the two main components of a network, (1) network actors and (2) network ties, correspond with “components” and “inter-relationship among components” in a structure. Therefore applying network theory to understanding knowledge structure is expected to be feasible if network actors and network ties can be well-defined. We previously investigated knowledge structure of patented technology by integrating network theory and patent citation information, in that case patent is the network actor and citation is the network tie (Lee et al. 2009). In this study, however, if we apply network theory on literature publication to draw the knowledge structure of “Technology Foresight”, what information is readily available in literature publications that can be used as network actors and network ties?
Since “Technology Foresight” is an emerging, developing, or expanding research field, the boundary of this field is still not well-defined. To clearly depict the range within the boundary so that an objective definition of Technology Foresight can be widely accepted, a group of core keywords is believed to be essential. Those keywords should be filtered out of the field to impress researchers and motivate them to define this research field. After a group of core keywords are retrieved from literature publications, any level of research unit, i.e. author, institute or countries, containing the obtained keywords can be used as network actors. Also, the co-occurrence of keywords on different level of research units establishes the relationships among network actors. Hence, knowledge structure of Technology Foresight can be drawn since the two basic requirements for establishing a network structure, network actors and network ties, have been met.
Create Technology Foresight knowledge map by integrating keyword and network theory
This study combines social network analysis and bibliometric analysis on the field of “Technology Foresight” using different publication information, e.g. keyword, research institute, and origin of country, as actors in network, in order to understand the knowledge structure of Technology Foresight research. The network actors and linkages correspond to publication information and keyword co-occurrence, can be visualized, and thus dynamic knowledge evolution can be mapped. Furthermore, network properties of networks created in this study can be calculated to obtain quantitative analysis on knowledge evolution (Granovetter 1973). In short, the contribution of this research is to propose a systematic method, on the basis of keyword-based bibliometric analysis and social network analysis, to quantitatively and visually obtain a knowledge map.
Research method
This research integrates social network analysis and bibliometric keyword analysis to draw a picture for the development of knowledge of Technology Foresight, which can be called “Technology Foresight knowledge map”. Here each country, research institute, or researcher that contributed to literature can be positioned. Processes for research method are: (1) literature retrieval and filtering, (2) keyword revision and basis statistical analysis, (3) visualization of three-dimensional keyword network, (4) network properties calculation, and (5) visualization of two-dimensional knowledge map.
Literature retrieval and filtering
To retrieve sufficient “Technology Foresight” related papers, the Web of Science (SCI and SSCI) literature database is initially used for paper retrieval. In order to have sufficient coverage of the papers, two following queries have been tried: (1) (foresight*) or (technolog* forecast*) in topic or title, (2) (foresight*) or (technolog* forecast*) or (Delphi) in topic or title. 2010 papers are retrieved by the first query and 5,751 papers are retrieved by the second query. After examining the paper titles and abstracts, it is found that most of the 5,751 papers are irrelevant to foresight research due to the noise generated by taking into account of “Delphi”. Thus, the 2010 papers are selected as the target to be further filtered manually. The papers filtered out are strongly related to the investigated field—“Technology Foresight”. To have wider coverage of papers which are beyond the Web of Science database, the references of these papers are examined and it is found that significant number of papers belong to other databases. For examples, (1) International Journal of Foresight and Innovation Policy, International Journal of Technology, Policy and Management belong to the Inderscience database, (2) Foresight belongs to Emerald database. Therefore, the same paper retrieval strategy is also applied on Inderscience and Emerald databases. Again, retrieved papers are then reviewed to preclude those which are irrelevant to the investigated field.
Finally after manual review, a total of 258 papers are obtained, 18.6% from Inderscience database, 38.0% from Scicenedirect, and 59.7% from Web of Science. Paper retrieval time is 26 September 2008. However, only 181 papers out of the total 258 papers contain keywords.
Keyword revision and basic statistical analysis
Due to the fact that different words can be used for describing the same concept, it is necessary to standardize words. For example, (1) plural forms are standardized to their singular form; (2) technique, technologies, technology are standardized to technology; and (3) Delphi analysis, Delphi method, and Delphi methodology are standardized to Delphi method. The top 20 high occurrence keywords are listed in Table 1.
We believe it is better not to modify the concept of keywords defined and selected by the authors, since this will avoid unnecessary debates. Every standardized author keyword is treated as a unique concept different from others in this study. The network linkages can be created by co-occurrence of keywords, i.e. by the co-occurrence of concepts. In this sense, what we modify is only the wording, so the concept of every keyword remains the same. Hence, the established linkage based on standardized author keyword is actually based on the concept of the original author keywords. In other words, there will not be double count problems among “Technology Foresight”, “technology”, and “foresight” (foresight and technology are the subset words of “Technology foresight”) because the three words have different concepts and are treated differently in this study.
Visualization of three-dimensional keyword network
Networking of keywords is based on sufficient relations among keywords. A relation is presented as a “network tie”. This study provides two methods of network tie generation. (1) Relation between two different papers occurred because these two papers share at lease one same keyword. A network generated by this method is defined as RFP network (research focus parallelship network. (2) Relation among plural keywords occurred because these keywords are listed in the same paper. A network generated by this method is defined as KCO network (keyword co-occurrence network). Detailed explanation for these two methods is as follows:
-
1.
RFP network (research focus parallelship network): the relation between two different papers occurred because these two papers share at least one keyword. For example, a paper is used as a network actor (network node) and any of two actors sharing one same keyword will be linked. This is based on an assumption made in this study that keywords represent the core research of a paper and sharing the same keyword implies these two papers partially overlap each other. The two papers are thus regarded as a pair of parallel papers and the constructed network is defined as an RFP network (research focus parallelship network). However, the network node is not necessarily the paper. It can also be selected from different actors, e.g. first author, research institute, country, by which papers are published. Hence, there are three types of RFP networks in this study, noted below:
-
RFP-country network: Research focus parallelship network with country as the network actor.
-
RFP-institute network: Research focus parallelship network with research institute as the network actor.
-
RFP-author network: Research focus parallelship network with first author as the network actor.
In this study, these networks are investigated in order to understand parallelship of knowledge evolution of Technology Foresight at macro-, meso-, and micro-levels.
-
-
2.
KCO network (keyword co-occurrence network): relations of author keywords are formed because author keywords specified by authors are listed in the same paper. Author keywords listed in the same papers are linked together because they are all terms that can be used to represent the core of a research paper and stronger relations to each other can be expected. Keywords in the same paper share equal importance for the paper. The shortest distance between any two keywords that are not directly linked can be regarded as how close the two keywords are. Author keywords with higher network centrality are those closer to the core of knowledge of Technology Foresight.
-
KCO network: Keyword co-occurrence network.
In this study, KCO network is investigated in order to understand co-occurrence of keywords in Technology Foresight papers at micro level.
-
Network properties calculation
Computer software is used to visualize RFP network and KCO network and then network properties are calculated. In social network theory, centrality is used to estimate the influence of actors. Centrality as an indicator can be used to understand to what degree an actor is able to obtain or control resources. Brass and Burkhardt (1992) indicated that network centrality is one source of influence from the viewpoint of organizational behavior. A person with higher centrality in an organization is always the one with higher influence. Freeman (1979) suggested three methods of centrality measurement for a network: (1) degree centrality, (2) between centrality, and (3) closeness centrality. Network properties are calculated by the above three methods in this study in order to understand the influencing power of first author, research institute, and country. A social network can be either a directed network or an undirected network. Networks constructed in this research are undirected networks because there no in-and-out concept exists behind any linked keywords, e.g. no causal relation, position difference, resource exchange, flows, or diffusion.
Visualization of two-dimensional knowledge map
Two-dimensional maps are created by calculating relative positions and density of network actors on the basis of the network constructed previously. These are named as “two-dimensional knowledge maps” since they directly reflect the fundamental structure of knowledge. The algorithm used in this study is proposed by Van Eck and Waltman (2007).
-
1.
Actor position: the positions of network actors in the map are based on visualization of similarities. If there are totally n actors, a two-dimensional map where the actor 1 ~ n are positioned in a way that the distance between any pair of actor i and j reflects their association strengths a ij as accurately as possible, i.e. distance between i and j is proportional to a ij , Van Eck and Waltman’s algorithm is used to minimize a weighted sum of the squared Euclidean distance between all pairs of actors, the objective function to be minimized is given as below:
$$ E\left( {x_{1} , \ldots , x_{n} } \right) = \sum\limits_{i < j} {a_{ij} \left\| {x_{i} - x_{j} } \right\|}^{2} $$where the vector x i = (x i1, x i2) denotes the location of actor i in a two-dimensional space and ||·||denotes the Euclidean norm.
-
2.
Actor density: actor density at a specific location in a map has to be calculated. The actor density is calculated by first placing a kernel function at each actor location and taking a weighted average of the kernel function.
The actor density at location x = (x 1, x 2) is given by
$$ D(x) = {\frac{1}{{h^{2} \sum\nolimits_{i = 1}^{n} {C_{ii} } }}}\sum\limits_{i = 1} {C_{ii}}^{K\left( {{\frac{{x_{1} - x_{i1} }}{h}},{\frac{{x_{2} - x_{i2} }}{h}}} \right)} $$where K denotes a kernel function and h denotes a smoothing parameter. C ii denotes the number of occurrences of actor I and x = (x 1, x 2) denotes the location of actor i in the map. The kernel function K is a non-increasing Gaussian kernel function given by
$$ K\left( {t_{1} ,t_{2n} } \right) = {\frac{1}{2\pi }}\exp \left( {{\frac{{ - t_{1}^{2} + t_{2}^{2} }}{2}}} \right). $$
Results and discussion
Three-dimensional keyword network analysis
Network overview
-
1.
RFP-country network:
Of all the retrieved 258 papers from 34 countries, the UK is the country with the most papers (52 papers), then the US (26), Australia (21), Germany (19), Netherlands (19), Finland (16), France (16), Spain (16), etc. And any two actors (country) with the same keyword are linked together. A totally of 33 networked actors and 385 network ties are obtained and shown in Fig. 1.
Fig. 1 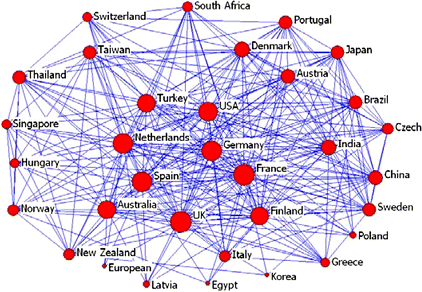
Research focus parallelship network with country as network actor
European countries are the major countries that contribute the most to this field. Asian countries are Japan, Taiwan, Korea, Singapore, Thailand and India; American countries are the US and Brazil, and other areas including Australia and South Africa.
-
2.
RFP-institute network:
Papers are classified by research institute, and any two research institutes with the same keyword are linked together. A total of 109 network actors and 1,335 network ties are obtained.
-
3.
RFP-author network:
Any two actors (first author or paper) with the same keyword are linked together. A total of 168 network actors and 2,399 network ties are obtained.
-
4.
KCO network (keyword as network actor in KCO network):
Each keyword is treated as a network actor; keywords within the same papers are linked together. A total of 546 network actors and 2,269 network ties are obtained.

For the three-dimensional keyword network analysis, the above four types of networks are created in this study, but only the first one (RFP-country network) is presented in this paper, since the other three networks are too complicated and can only be analyzed by computer.
Two-dimensional knowledge map analysis
The constructed two-dimensional maps (Figs. 2, 3) provide a quick way for human eyes to perceive knowledge structure of Technology Foresight with country, institute, author and keyword as actors.

Two-dimensional knowledge map with countries as actors

Two-dimensional knowledge map with keywords as actors
Figure 2 is a two-dimensional knowledge map with countries as actors. It illustrates a country knowledge map where all these countries are relatively uniformly distributed. This indicates a nice international collaboration in which each country finds its particular way to contribute different knowledge. The more uniform distribution, the higher efficiency with which the knowledge can be developed. In other words, knowledge contributed by each country plays the role of a piece in a jigsaw. After all the knowledge is put together, it became a beautiful picture. In Fig. 2, the distribution of countries is pretty uniform but still we can find two highly concentrated spots: (1) Netherlands, UK, France, Span, Australia, and (2) Sweden, India, Japan, Brazil, Austria. Most of these are developed European countries.
Figure 3 is a two-dimensional knowledge map with keywords as actors, it shows a big continent in the center with two separated islands denoted as “complaint analysis” located on the left and “Europe” located on the right. To understand what constructs the continent and two islands, those keyword components underlying the three areas are examined. Due to the limitations of figure size and computer resolution, the detailed components can not be shown in Fig. 3, but can be observed from a computer screen. After we enlarge Fig. 3, detailed components for the three areas are listed as follows:
-
Components of big continent: Foresight, Technology Foresight, planning, governance, critical technology, scenario planning, R&D, Delphi method, innovation policy, evaluation, forecasting, emerging technology, strategic planning, etc.
-
Components of “complaint analysis” island: complaint analysis, obstacle analysis, user behavior, quality function deployment, quality analysis, need-pull, customer satisfaction, market acceptance, quality function deployment, etc.
-
Components of “Europe” island: Europe, electronic industry, air conditioning industry, grants, chemical industry, etc.
According to component analysis for the three areas, the big continent is found to be the central concept of Technology Foresight because the associated keyword components all fall in the categories of technology forecast, policy planning, etc. But “complaint analysis” island and “Europe” island are more associated with business or industrial development. They are, unsurprisingly, not really the core concepts directly related to Technology Foresight. This is why both are small isolated islands separated from the big continent.
Summary and conclusion
The number of “Technology Foresight” activities conducted globally has been dramatically increasing due to the global awareness of the importance of resource allocation and technology forecast. “Technology Foresight” is no longer only a methodology but has gradually become an emerging research field which requires a systematic analysis of its knowledge structure. This study integrates social network analysis and keyword analysis to investigate knowledge structure created by journal papers of “Technology Foresight” for the purpose of systematically examining fundamental components underlying Technology Foresight activities undertaken differently in different regions of the world.
In summary, this study first proposes four types of three-dimensional network based on co-occurrence of keywords for full spectrum analysis on literature publication, i.e. RFP-country network, RFP-institute network, RFP-author network and KCO network, to reflect knowledge structures of Technology Foresight on micro-, meso-, macro-, and micro-levels, respectively. A total of 556 keywords contained in 181 Technology Foresight related papers have been analyzed in this study. Three-dimensional networks and two-dimensional maps are quantitatively and visually created to describe latest Technology Foresight knowledge structure. Keywords such as foresight, Technology Foresight, planning, governance, critical technology, scenario planning, R&D, Delphi method, innovation policy, evaluation, forecasting, emerging technology, strategic planning, etc., are served as important components of the backbone of knowledge structure of Technology Foresight. Also, European countries, China, India and Brazil are countries located at the core of the Technology Foresight.
It is well known that conventional bibliometric analysis on most research fields for the purpose of performance evaluation usually shows that the US is ranked No. 1 in terms of both publication quantity and quality. The US is then followed by either Japan or European which are easily ranked No. 2. However, in the field of Technology Foresight, the US is no longer the leading country even though US’s Rand Corporation was the first-mover back in the 1950s (Landeta 2006; Kaplan et al. 1950). Centrality calculation shows the US is only ranked No. 6 or 8 (now shown in this paper). This is because the US government does not tend to introduce significant intervention on national development by Technology Foresight, but tries to sustain a free market with insignificant regulation, no single monetary system, and no governmental monopolies. However, for smaller countries with limited resource, resource allocation becomes of greater importance and Technology Foresight activities need to be conducted to prioritize technology developments and thus sustain maximum national competitivenesses. The importance of more efficient resource allocation has been perceived by most countries and hence we observed the increasing number of countries conducting national scale Technology Foresight activities after the 1990s.
The availability of the two-dimensional knowledge maps provides the basis for a quick and careful, though still limited, international, inter-organizational and interpersonal comparison of competitiveness (this paper presents the two-dimensional knowledge maps with countries as actors, Fig. 2, but two-dimensional knowledge maps with institutes and authors as actors can also be created by the same method). Figure 3 provides the basis for indicating which concepts are fundamental building blocks in Technology Foresight. By the use of two-dimensional knowledge maps, researchers are allowed to understand how a country, institute or author is positioned in the knowledge map.
The knowledge maps, obtained quantitatively, allow potential quantitative application, e.g. (1) R&D resource allocation, (2) research performance evaluation, (3) understanding of future research opportunity, and (4) potential collaborator or competitor identification.
For (1) R&D resource allocation, one can estimate what has been done or what has not been done by examining Fig. 3. Different colors in the map indicate different levels of research occupations. It maybe positive to spend R&D resource on a research project featured by a set of keywords co-occurring in two existing separate “islands”, because this newly funded research project will serve as an interdisciplinary research to bridge the two islands.
For (2) research performance evaluation, network centrality (Freeman 1979) for each network actors can be calculated for Research Focus Parallelship Network (Fig. 1). Actors with more paper output have more linkages to other actors, because they have more keywords which provide more opportunities to be linked. Therefore, their network centralities increase and are positioned in the highly dense area centered in Fig. 2. The introduced R&D resource can thus be compared with actors’ centrality to understand research performance effectiveness.
For the field of “Technology Foresight”, (3) and (4) are relatively more important because, except Japan with long historical Technology Foresight experiences, most countries have not yet or only just initiated national-scale Technology Foresight. Therefore, seeking collaborators or benching marking other countries are necessary. For example, the first German Delphi Study on the development of science and technology was conducted by the Fraunhofer Institute for Systems and Innovation Research (FhG-ISI) on behalf of the then Federal Ministry of Research and Technology (BMFT) in 1992/1993, and carried out in cooperation with the National Institute of Science and Technology Policy (NISTEP) in Japan (Cuhls et al. 1995). The German (Cuhls et al. 1995) and British Technology Foresight (Loveridge et al. 1995) were analyzed in order to prepare for the Austrian Delphi in 1997 (Wild and Torgersen 2000). In addition, some research has some international comparisons (Martin and Johnston 1999; Schlossstein and Park 2006; Keenan and Popper 2008) on Technology Foresight activities. The two-dimensional knowledge maps proposed in this study provide a quick way for international benchmarking or potential partnership identification. These are of particular importance for some fields, e.g. Technology Foresight, which globally are under emerging development.
It has to be understood that some research limitations or biases are inevitable and more efforts are needed in order to maximize this approach to knowledge structure. For example:
-
1.
The purpose of this study is to illustrate a visualization method to characterize knowledge structure created by journal papers. However, any type of visualization is only an approach and will never be perfect because a real “knowledge structure” is far beyond any two or three dimensional system. In other words, a real knowledge structure can never be perfectly visualized in such simple ways.
-
2.
A knowledge structure constructed by knowledge production, knowledge diffusion, etc., is very complicated. As an early step of visualizing “Technology Foresight”, this study only considers journal papers. It is desirable to have more types of publications, e.g. books, reports, conference papers, patents, etc., taken into account in the future in order to obtain a more complete picture of knowledge development.
-
3.
Some processes which are currently beyond a computer’s capability have to be manually handled such as standardization of keywords and selection of papers strongly related to investigated field. This is because there is no standard way to standardize keywords or determine how strongly a paper is related to the investigated fields. This study tries to be as objective as possible to maximize reliability and validity, but computer assisted solution will be investigated in our future study.
References
Alsan, A., & Oner, M. A. (2003). An integrated view of foresight: Integrated foresight management model. Foresight, 5, 33–45.
Amsteus, M. (2008). Managerial foresight: Concept and measurement. Foresight, 10, 53–66.
Baldwin, C., Hughes, J., Hope, T., Jacoby, R., & Ziebland, S. (2003). Ethics and dementia: Mapping the literature by bibliometric analysis. International Journal of Geriatric Psychiatry, 18, 41–54.
Bhattacharya, S., & Basu, P. K. (1998). Mapping a research area at the micro level using co-word analysis. Scientometrics, 43, 359–372.
Brass, D. J., & Burkhardt, M. E. (1992). Centrality and power in organizations. Networks and Organizations: Structure, Form and Action, 191, 215.
Callon, M., Courtial, J. P., & Laville, F. (1991). Co-word analysis as a tool for describing the network of interactions between basic and technological research: The case of polymer chemistry. Scientometrics, 22, 155–205.
Cambrosio, A., Limoges, C., Courtial, J. P., & Laville, F. (1993). Historical scientometrics? Mapping over 70 years of biological safety research with coword analysis. Scientometrics, 27, 119–143.
Chiu, W. T., & Ho, Y. S. (2007). Bibliometric analysis of tsunami research. Scientometrics, 73, 3–17.
Chiu, W. T., Huang, J. S., & Ho, Y. S. (2004). Bibliometric analysis of severe acute respiratory syndrome-related research in the beginning stage. Scientometrics, 61, 69–77.
Clarke, A., Gatineau, M., Thorogood, M., & Wyn-Roberts, N. (2007). Health promotion research literature in Europe 1995–2005. The European Journal of Public Health, 17, 24–28.
Coulter, N., Monarch, I., & Konda, S. (1998). Software engineering as seen through its research literature: A study in co-word analysis. Journal of the American Society for Information Science, 49, 1206–1223.
Courtial, J. P. (1994). A coword analysis of scientometrics. Scientometrics, 31, 251–260.
Cuhls, K., Breiner, S., & Grupp, H. (1995). Delphi-Bericht 1995 zur Entwicklung von Wissenschaft und Technik-Mini-Delphi. Karlsruhe: Fraunhofer-Institut ISI (auch herausgegeben als BMBF-Brosch\üre, Bonn 1996).
Czaplicka-Kolarz, K., Stańczyk, K., & Kapusta, K. (2009). Technology foresight for a vision of energy sector development in Poland till 2030. Delphi survey as an element of technology foresighting. Technological Forecasting and Social Change, 76, 327–338.
Dalkey, N. C. (1969). The Delphi method: An experimental study of group opinion. Santa Monica: RAND Corp.
De Looze, M. A., & Lemarié, J. (1997). Corpus relevance through co-word analysis: An application to plant proteints. Scientometrics, 39, 267–280.
Ding, Y., Chowdhury, G. G., & Foo, S. (2001). Bibliometric cartography of information retrieval research by using co-word analysis. Information Processing and Management, 37, 817–842.
Dosi, G. (1982). Technological paradigms and technological trajectories: A suggested interpretation of the determinants and directions of technical change. Research Policy, 11, 147–162.
Freeman, L. C. (1979). Centrality in social networks: Conceptual clarification. Social Networks, 1, 215–239.
Gavigan, J. P., & Scapolo, F. (1999). A comparison of national foresight exercises. Foresight, 1, 495–517.
Granovetter, M. S. (1973). The strength of weak ties. American Journal of Sociology, 78, 1360–1380.
Grupp, H., & Linstone, H. A. (1999). National technology foresight activities around the globe: An experimental study of group opinion. Technological Forecasting and Social Change, 60, 85–94.
Gupta, B. M., & Bhattacharya, S. (2004). A bibliometric approach towards mapping the dynamics of science and technology. DESIDOC Bulletin of Information Technology, 24, 3–8.
Havas, A. (2003). Evolving foresight in a small transition economy. Journal of Forecasting, 22, 179–201.
Helmer, O., & Rescher, N. (1959). On the epistemology of the inexact sciences, Management Science, 25–52.
Hinze, S. (1994). Bibliographical cartography of an emerging interdisciplinary discipline: The case of bioelectronics. Scientometrics, 29, 353–376.
Ho, Y. S. (2007). Bibliometric Analysis of Adsorption Technology in Environmental Science. Journal of Environmental Protection Science, 1, 1–11.
Irvine, J., & Martin, B. R. (1984). Foresight in science: Picking the winners. London: Pinter.
Kajikawa, Y., & Takeda, Y. (2008). Structure of research on biomass and bio-fuels: A citation-based approach. Technological Forecasting and Social Change, 75, 1349–1359.
Kajikawa, Y., & Takeda, Y. (2009). Citation network analysis of organic LEDs. Technological Forecasting and Social Change, 76, 1115–1123.
Kajikawa, Y., Yoshikawa, J., Takeda, Y., & Matsushima, K. (2008). Tracking emerging technologies in energy research: Toward a roadmap for sustainable energy. Technological Forecasting and Social Change, 75, 771–782.
Kaplan, A., Skogstad, A. L., & Girshick, M. A. (1950). The prediction of social and technological events. Public Opinion Quarterly, 14, 93–110.
Keenan, M., & Popper, R. (2008). Comparing foresight ‘style’ in six world regions. Foresight, 10, 16–38.
Kostoff, R. N. (2008a). Literature-related discovery (LRD): Introduction and background. Technological Forecasting and Social Change, 75, 165–185.
Kostoff, R. N. (2008b). Literature-related discovery (LRD): Potential treatments for cataracts. Technological Forecasting and Social Change, 75, 215–225.
Kostoff, R. N. (2008c). Comparison of China/USA science and technology performance. Journal of Informetrics, 2, 354–363.
Kostoff, R. N., Antonio del Río, J., Cortés, H. D., Smith, C., Smith, A., Wagner, C., et al. (2005a). The structure and infrastructure of Mexico’s science and technology. Technological Forecasting and Social Change, 72, 798–814.
Kostoff, R. N., Bhattacharya, S., & Pecht, M. (2007a). Assessment of China’s and India’s science and technology literature—introduction, background, and approach. Technological Forecasting and Social Change, 74, 1519–1538.
Kostoff, R. N., Block, J. A., Solka, J. L., Briggs, M. B., Rushenberg, R. L., Stump, J. A., et al. (2008a). Literature-related discovery (LRD): Lessons learned, and future research directions. Technological Forecasting and Social Change, 75, 276–299.
Kostoff, R. N., & Briggs, M. B. (2008). Literature-related discovery (LRD): Potential treatments for Parkinson’s disease. Technological Forecasting and Social Change, 75, 226–238.
Kostoff, R. N., Briggs, M. B., & Lyons, T. J. (2008c). Literature-related discovery (LRD): Potential treatments for multiple sclerosis. Technological Forecasting and Social Change, 75, 239–255.
Kostoff, R. N., Briggs, M. B., Rushenberg, R. L., Bowles, C. A., Icenhour, A. S., Nikodym, K. F., et al. (2007c). Chinese science and technology—structure and infrastructure. Technological Forecasting and Social Change, 74, 1539–1573.
Kostoff, R. N., Briggs, M. B., Rushenberg, R. L., Bowles, C. A., Pecht, M., Johnson, D., et al. (2007d). Comparisons of the structure and infrastructure of Chinese and Indian Science and Technology. Technological Forecasting and Social Change, 74, 1609–1630.
Kostoff, R. N., Briggs, M. B., Solka, J. L., & Rushenberg, R. L. (2008b). Literature-related discovery (LRD): Methodology. Technological Forecasting and Social Change, 75, 186–202.
Kostoff, R. N., Eberhart, H. J., & Toothman, D. R. (1998). Database tomography for technical intelligence: A roadmap of the near-earth space science and technology literature. Information Processing and Management, 34, 69–85.
Kostoff, R. N., Johnson, D., Bowles, C. A., Bhattacharya, S., Icenhour, A. S., Nikodym, K., et al. (2007b). Assessment of India’s research literature. Technological Forecasting and Social Change, 74, 1574–1608.
Kostoff, R. N., Koytcheff, R. G., & Lau, C. G. (2007e). Global nanotechnology research literature overview. Technological Forecasting and Social Change, 74, 1733–1747.
Kostoff, R. N., Solka, J. L., Rushenberg, R. L., & Wyatt, J. A. (2008d). Literature-related discovery (LRD): Water purification. Technological Forecasting and Social Change, 75, 256–275.
Kostoff, R. N., Tshiteya, R., Pfeil, K. M., & Humenik, J. A. (2002). Electrochemical power text mining using bibliometrics and database tomography. Journal of Power Sources, 110, 163–176.
Kostoff, R. N., Tshiteya, R., Pfeil, K. M., Humenik, J. A., & Karypis, G. (2005b). Power source roadmaps using bibliometrics and database tomography. Energy, 30, 709–730.
Kuhn, T. S. (1962). The structure of scientific revolutions. USA: University of Chicago.
Landeta, J. (2006). Current validity of the Delphi method in social sciences. Technological Forecasting and Social Change, 73, 467–482.
Lee, P.-C., Su, H.-N., & Wu, F.-S. (2009). Quantitative mapping of patented technology—the case of electrical conducting polymer nanocomposite. Technological Forecasting and Social Change, 77, 466–478.
Li, T., Ho, Y. S., & Li, C. Y. (2008). Bibliometric analysis on global Parkinson’s disease research trends during 1991–2006. Neuroscience Letters, 441, 248–252.
Linstone, H. A., & Turoff, M. (1975). Delphi method: Techniques and applications. USA: Addison-Wesley.
Loveridge, D., Georghiou, L., & Nedeva, M. (1995). United Kingdom Technology Foresight Programme Delphi Survey.
Martin, B. R., & Johnston, R. (1999). Technology foresight for wiring up the national innovation system: Experiences in Britain, Australia, and New Zealand. Technological Forecasting and Social Change, 60, 37–54.
Mu, R. P., Ren, Z. B., Yuan, S. D., & Yuan, Q. (2008). Technology foresight towards 2020 in China: The practice and its impacts. Technology Analysis and Strategic Management, 20, 287–308.
NISTEP. (2005). NISTEP Report No. 94–98: The 8th Science and Technology Foresight Survey. NISTEP.
Noyons, E. C. M., & Van Raan, A. F. J. (1994). Bibliometric cartography of scientific and technological developments of an R&D field. Scientometrics, 30, 157–173.
Noyons, E. C. M., & Van Raan, A. F. J. (1998). Monitoring scientific developments from a dynamic perspective: Self-organized structuring to map neural network research. Journal of the American Society for Information Science, 49, 68–81.
Rikken, F., Kiers, H. A. L., & Vos, R. (1995). Mapping the dynamics of adverse drug reactions in subsequent time periods using INDSCAL. Scientometrics, 33, 367–380.
Rip, A., & Courtial, J. P. (1984). Co-word maps of biotechnology: An example of cognitive scientometrics. Scientometrics, 6, 381–400.
Saritas, O., Taymaz, E., & Tumer, T. (2007). Vision 2023: Turkey’s National Technology Foresight Program: A contextualist analysis and discussion. Technological Forecasting and Social Change, 74, 1374–1393.
Schlossstein, D., & Park, B. (2006). Comparing recent technology foresight studies in Korea and China: Towards foresight-minded governments? Foresight, 8, 48–70.
Tian, Y., Wen, C., & Hong, S. (2008). Global scientific production on GIS research by bibliometric analysis from 1997 to 2006. Journal of Informetrics, 2, 65–74.
Van Eck, N. J., & Waltman, L. (2007). Bibliometric mapping of the computational intelligence field. International Journal of Uncertainty Fuzziness and Knowledge Based Systems, 15, 625.
Van Raan, A. F. J., & Tijssen, R. J. W. (1993). The neural net of neural network research: An exercise in bibliometric mapping. Scientometrics (Print), 26, 169–192.
Wikipedia. (2009). Wikipedia.
Wild, C., & Torgersen, H. (2000). Foresight in medicine Lessons from three European Delphi studies. Oxford: Oxford University Press.
Yang, Q. Q., Gong, Z. M., Cheng, J. Y., & Wang, G. (2004). Technology foresight and critical technology selection in China. International Journal of Foresight and Innovation Policy, 1, 168–180.
Author information
Authors and Affiliations
Corresponding author
Rights and permissions
About this article
Cite this article
Su, HN., Lee, PC. Mapping knowledge structure by keyword co-occurrence: a first look at journal papers in Technology Foresight. Scientometrics 85, 65–79 (2010). https://doi.org/10.1007/s11192-010-0259-8
Received:
Published:
Issue Date:
DOI: https://doi.org/10.1007/s11192-010-0259-8