
Abstract
This paper analyses how short-term operational efficiency and the \(\hbox {CO}_{2}\) emissions of a power system depend on different subsidies for wind power and on the flexibility of the power system. This is analysed in the framework of a numerical power market model, calibrated to Danish data, where the start-up costs and other constraints in fossil-fuelled power plants are taken into account. The main conclusion is that flexibility is crucial for the costs of integrating wind power in an existing system. If thermal power plants are inflexible, subsidies for wind power should strive to increase the flexibility of the market by passing market signals to wind power. A subsidy that conceals market signals from wind power producers (a production subsidy) or disconnects wind power incentives from the market signals altogether (a fixed price) increases costs considerably. An inflexible power system should aim to introduce optimal subsidies (an investment subsidy) instead of production subsidies or a fixed price. The design of the subsidy scheme should take into account both the characteristics of the existing system and the characteristics of renewables.


Notes
The common subsidy schemes in the EU—feed-in tariffs and tradable green certificates—are versions of a production subsidy or fixed producer price. Feed-in tariffs (guaranteed prices for renewable electricity or guaranteed mark-ups on the market price of electricity) are used in Denmark, France, Germany and Spain, among other countries (COM 2005). Tradable green certificates have been used in Italy, Norway, Sweden and the UK. Investment subsidies have been used in Finland and Portugal.
Similarly, solar and wave power are also variable, while other renewable technologies (e.g. biomass-based combined heat and power) are more similar to conventional power plants or are flexible (e.g. hydropower).
Other goals, such as support for domestic industry or regional development, are perhaps less pronounced, but nevertheless evident in the variety of renewable support schemes in the EU countries. Other emissions (\(\hbox {SO}_{2},\,\hbox {NO}_{x}\)) are regulated in other ways.
The EU Emission Trading Scheme (EU ETS) puts a cap on total \(\hbox {CO}_{2}\) emissions, but emissions caused by starting and stopping thermal power plants could make the necessary emission reduction more expensive than it would otherwise be.
The interaction between a tradable green certificates market and the power market has been analysed in a number of papers, including Amundsen and Mortensen (2001), Unger and Ahlgren (2005), Morthorst (2001), and Jensen and Skytte (2003). However, these studies also focus on the medium to long-term impacts of renewables.
Amundsen et al. (1999), Halseth (1998), Hauch (2003) and Johnsen (1998) use partial equilibrium models for policy analyses of the Nordic power market. However, the time horizon of these models is considerably longer (typically one year with only a few seasons and load periods), making them unsuitable for addressing the short-term issues relating to the start-up of thermal power plants. Hence, with a finer time resolution, the present model could complement the traditional long-term policy analyses.
This strand of literature has a different focus, however, being largely concerned with finding the solution algorithms for the actual operation of large power systems; see e.g. Sen and Kothari (1998) or Sheble and Fahd (1994). Environmental or climate policy issues have not been at the centre of attention.
Results from Rosnes (2008), who studies a single power producer’s response to climate policies, indicate that the impact of uncertainty is probably similar to that of inflexibility.
The figure shows the net demand faced by thermal producers and wind power producers combined, after subtracting the power supply of a third type of producer, namely small combined heat and power (CHP) plants. These plants primarily produce heat, which shows a consistent pattern over a week similar to power demand; power is merely a by-product. Thus, the power output from small CHPs is not price-elastic.
Fig. 1 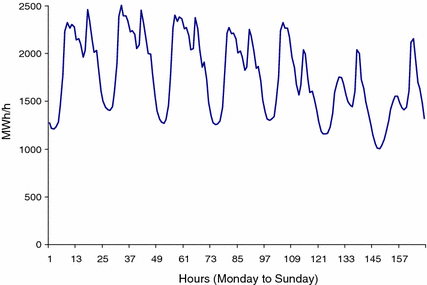
Electricity demand in Western Denmark during a week in January 2006. Source: www.energinet.dk
Availability depends on the wind force every hour. In order to produce, there must be wind blowing. On the other hand, if the wind blows too hard, the turbines must be turned off in order to avoid damage. The availability parameter \(\sigma _{t}\) in the model represents the available capacity converted into kilowatt-hours. Any wind force that exceeds the possible production threshold is simply denoted \(\sigma _{t}=0.\) Similarly, a windless moment implies \(\sigma _{t}=0.\)
The availability of wind can be the same for all wind power producers (for instance when the wind-mills are located in the same geographical area) or it can be individual (when the wind-mills are located in different areas). For simplicity, it is assumed here that the same \(\sigma _{t}\) applies to all wind power producers, implying a concentrated wind farm.
In fact, negative prices were introduced on the European Energy Exchange (EEX) in September 2008 and on the Nordic power exchange Nord Pool’s day-ahead market in October 2009.
Due to the severe consequences of even a short-term market imbalance, there is always a market operator in a power market, either implicitly (a system operator) or explicitly (a power exchange).
This is similar to the Nordic power exchange, Nord Pool, where the day-ahead market is cleared simultaneously for each of the 24 h of the following day (see www.nordpoolspot.com).
In reality, the next week shows a similar pattern, although it is not identical due to seasonal variation.
These assumptions are rules of thumb used in the industry (personal communication with Jens Pedersen, Energinet.dk, in June 2004). Indirect costs are essentially asset depreciation costs and they increase as the number of starts increases. However, it is a rule of thumb in the industry to treat them as a fixed cost. This approach is followed here.
The fraction of cold start costs that occurs when the plant has been off for \(\gamma _{it}\) periods is usually modelled as an exponential function: \(\varphi _{t}=(1-e^{\frac{-\gamma _{it}}{\widehat{\gamma }}}),\) where \(\widehat{\gamma }\) is the cooling constant measuring how quickly the boiler cools down (Wood and Wollenberg 1996). The constant \(\widehat{\gamma }\) for the Danish plants is typically 6–8 h (personal communication with Jens Pedersen, Energinet.dk, in June 2004). Here, \(\widehat{\gamma }=6\) is used.
Note that actual production data may indicate wind power production that exceeds domestic demand since, in reality, it is possible to export the excess wind power, a point discussed in Sect. 6.2. This excess production is truncated in the model simulations. This is in line with the actual operation of the power market: the market operator can disconnect excess production in order to maintain balance in the market.
Marginal cost per MWh produced (average for the week) can serve as a proxy for price. Usually, the marginal cost of increasing production by one unit in the model is interpreted as the shadow price. However, this marginal cost must be treated with caution in MIP-models: it is the cost of a marginal production increase for a given operational status of the plants. It may be the case, however, that it is optimal to change the operational status of a plant.
The deadweight loss of collecting taxes is not included here, only the actual amount of money paid to the wind power producers.
We do not know the necessary or optimal level of investment subsidy, and, since the investment subsidy does not influence the production decision, the exact level is not important for the numerical model.
Germany has often been quoted as a showcase for the effectiveness of feed-in tariffs in achieving large investments in wind power. However, the German success is based on the very high level of feed-in tariffs. In other countries, with low feed-in tariffs, such tariffs have failed to contribute to investments.

References
Acemoglu, D. (2009). Introduction to modern economic growth. Princeton, NJ: Princeton University Press.
Amundsen, E. S., Nesse, A., & Tjøtta, S. (1999). Deregulation of the Nordic power market and environmental policy. Energy Economics, 21, 417–434.
Amundsen, E. S., & Mortensen, J. B. (2001). The Danish green certificate system: Some simple analytical results. Energy Economics, 23, 489–509.
Brooke, A., Kendrick, D., Meeraus, A., & Raman, R. (1998). GAMS—A user’s guide. GAMS Development Corporation, Washington, DC
COM. (2005). The support of electricity from renewable energy sources. Communication from the Commission COM(2005). 627 final. Brussels, 7.12.2005.
EC. (2001). Directive 2001/77/EC of the European Parliament and of the Council of 27 September 2001 on the promotion of electricity produced from renewable energy sources in the internal electricity market.
EC. (2009). Directive 2009/28/EC of the European Parliament and of the Council of 23 April 2009 on the promotion of the use of energy from renewable sources and amending and subsequently repealing Directives 2001/77/EC and 2003/30/EC.
Energinet.dk (2007). http://www.energinet.dk/da/menu/Marked/Afregning/Vedvarende+energi/Vedvarende+energi.htm. Accessed January 2007.
Green, R. (2007). Nodal pricing of electricity: How much does it cost to get it wrong? Journal of Regulatory Economics, 31, 125–149.
Green, R. (2008). Electricity wholesale markets: Design now and in a low-carbon future. The Energy Journal, Special Issue. The Future of Electricity: Papers in Honor of David Newbery, pp. 95–124.
Halseth, A. (1998). Market power in the Nordic electricity market. Utilities Policy, 7, 259–268.
Hauch, J. (2003). Electricity trade and CO\(_{2}\) emission reductions in the Nordic countries. Energy Economics, 25, 509–526.
IEA. (2010). Policies and measures databases. http://www.iea.org/textbase/pm/index.html.
Jensen, S. G., & Skytte, K. (2003). Simultaneous attainment of energy goals by means of green certificates and emissions permits. Energy Policy, 31, 63–71.
Johnsen, T. A. (1998). Modelling the norwegian and nordic electricity markets. Ph.D. thesis, No. 48–1998, Department of Economics, University of Oslo.
Just, S., & Weber, C. (2008). Pricing of reserves: Valuing system reserve capacity against spot prices in electricity markets. Energy Economics, 30, 3198–3221.
Kiviluoma, J., & Meibom, P. (2010). Influence of wind power, plug-in vehicles, and heat storages on power system investments. Energy, 35(3), 1244–1255.
Lijesen, M. G. (2007). The real-time price elasticity of electricity. Energy Economics, 29, 249–258.
Mansur, E. T. (2008). Measuring welfare in restructured electricity markets. The Review of Economics and Statistics, 90(2), 369–386.
Menanteau, P., Finon, D., & Lamy, M.-L. (2003). Prices versus quantities: Choosing policies for promoting the development of renewable energy. Energy Policy, 31, 799–812.
Morthorst, P. E. (2001). Interactions of a tradable green certificate market with a tradable permits market. Energy Policy, 29, 345–353.
Munoz, F., Sauma, E., & Hobbs, B. (2013). Approximations in power transmission planning: Implications for the cost and performance of renewable portfolio standards. Journal of Regulatory Economics, 43(3), 305–338.
Newbery, D. M. (2012). Reforming competitive electricity markets to meet environmental targets. Economics of Energy & Environmental Policy, 1(1), 69–82.
Patrick, R. H. & Wolak F. A. (1997). Estimating the customer-level demand for electricity under real-time market prices. Preliminary Draft, August 1997.
Rosnes, O. (2007). Carbon costs in power markets: The importance of the flexibility of power plants. Essay 2 in Short-term effects of long-term policies: Climate policies in power markets. PhD Dissertation No. 2007:11. Department of Economics and Resource Management, Norwegian University of Life Sciences.
Rosnes, O. (2008). The impact of climate policies on the operation of a thermal power plant. The Energy Journal, 29(2), 1–22.
Sen, S., & Kothari, D. P. (1998). Optimal thermal generating unit commitment: A review. Electrical Power & Energy Systems, 20, 443–451.
Sheble, G. B., & Fahd, G. N. (1994). Unit commitment literature synopsis. IEEE Transactions on Power Systems, 9, 128–135.
TRM. (2007). En visionær dansk energipolitik 2025 (A visionary Danish energy policy 2025; in Danish). Ministry of Transport and Energy.
Tseng, C., & Barz, G. (2002). Short-term generation asset valuation: A real options approach. Operations Research, 50, 297–310.
Unger, T., & Ahlgren, E. O. (2005). Impacts of a common green certificate market on electricity and \(\text{ CO }_{2}\)-emission markets in the Nordic countries. Energy Policy, 33, 2152–2163.
Wood, A. J., & Wollenberg, B. F. (1996). Power generation, operation, and control. New York: Wiley.
Acknowledgments
I am grateful to Arndt von Schemde, Berit Tennbakk, Haakon Vennemo, Torstein Bye, Eirik Romstad, Knut Einar Rosendahl, Maria Sandsmark, Atle Seierstad, the editor and two anonymous referees for helpful discussions and valuable comments. Suggestions from Arne Drud regarding modelling are highly appreciated. Any remaining errors are the responsibility of the author. Funding from the Research Council of Norway, the Norwegian Electricity Industry Association, Agder Energi, BKK, Dalane Energi, E-CO, Statkraft and Professor Wilhelm Keilhaus Minnefond is also gratefully acknowledged.
Author information
Authors and Affiliations
Corresponding author
Rights and permissions
About this article

Cite this article
Rosnes, O. Subsidies for renewable energy in inflexible power markets. J Regul Econ 46, 318–343 (2014). https://doi.org/10.1007/s11149-014-9258-7
Published:
Issue Date:
DOI: https://doi.org/10.1007/s11149-014-9258-7