
Abstract
Many international survey projects contain items on corruption that facilitate comparative analyses of individual-level determinants of perceived and experienced corruption, yet such data remain under-used. To encourage more and better use of the wealth of available survey projects, this article presents a comprehensive review of the largest collection of extant cross-national data suitable for research on corruption in Europe. I examine a total of 1129 items on corruption stemming from 21 international survey projects and their 89 survey waves that cover 45 European countries during the period 1989–2017. Within three decades, the number of corruption items has grown remarkably, rising from just one in 1989 to nearly a hundred in 2017. This article shows the trends: a considerable increase in experiential items; greater differentiation between forms of corruption; a move from items on ‘what government has done’ to items on ‘what ordinary people can do’; and inclusion of items on corruption in private sector. Researchers interested in understanding perceptions and experiences of corruption, as they are shaped by social contexts, are offered an opportunity of exploring the availability of corruption items in international survey projects in a systematic manner in order to analyzed patterns of corruption, its causes and consequences. Concluding part of the paper contains some remarks on the challenges of using survey data on corruption in a comparative framework.
1 Introduction
Corruption, broadly defined as the misuse of entrusted power for private gain, ranges from bribery and embezzlement in economic transactions to favoritism, cronyism, and nepotism, i.e. ‘social corruption,’ in professional relations (Holmes 2015). In all forms, corruption harms society: it creates barriers for economic development (Mauro 1995; Aidt 2009), decreases effectiveness and efficiency of public services (Rose-Ackerman 1999; Rose and Peiffer 2015), increases transaction costs (Lambsdorff 2002), undermines legal rules (Karklins 2005), damages government legitimacy (Rothstein 2011), and weakens the social fabric of democratic society (Melgar et al. 2010; Anderson and Tverdova 2003).
When studying this world-wide, persistent and prevalent social problem, scholars interested in understanding corruption as influenced both by the personal characteristics and by the socio-economic and political contexts can turn toward cross-national public opinion surveys. The reasons to do so are manifold. Cross-national surveys on representative samples of the adult population facilitate generalization. They allow to assess, among others, citizen’s personal experience with ‘petty’ or bureaucratic corruption and perceptions of the elite level acts of ‘grand’ corruption committed by governments and multi-national corporations (Holmes 2015; Heath et al. 2016). They give voice to perceptions and first-hand experiences of different social groups and contain sufficiently large number of observations to enable scholars to test hypotheses of micro-level correlates of corruption and their cross-level interactions with institutional and national contexts (Povitkina and Wysmulek 2017). Unlike some of the composite corruption indices, public opinion surveys on corruption are also more transparent and allow for disaggregation of measured components (Richards 2017). Nonetheless, despite this great potential, public opinion survey data on corruption remain under-used (Richards 2017, p. 4; Chabova 2017).
To encourage more and better use of the wealth of publicly available cross-national survey data, this article presents a comprehensive review of the largest collection of extant surveys suitable for comparative research on corruption. The review covers 21 international survey projects and their 89 waves conducted in 45 European countriesFootnote 1 from 1989 to 2017, and a total of 1129 items on corruption. With these data I trace (i) the dynamics of interest in cross-national research on corruption, as depicted by trends of survey data collection from 1989 to 2017 (ii) changes in types of corruption items collected by specialized survey projects, like the Global Corruption Barometer, the corruption-themed Eurobarometer, the International Crime Victim Survey, and the Life in Transition Survey, and (iii) availability and types of corruption items in international survey projects that are not specialized on corruption, like the European Social Survey, the International Social Survey Programme, the World Values Survey and other.
This article builds on the valuable knowledge about the use of corruption items in most famous cross-national survey projects on corruption (Malito 2014; Chabova 2017). I take the analyses further, to systematically examine the universe of corruption items in well-established international survey projects conducted in Europe over the last decades that are both corruption-themed and general. These sources collect a wide range of corruption items that could be used to study different dimensions of corruption over a great number of years and many countries. Moreover, in general surveys, questions on corruption come with a wide range of items on social, economic, and political attitudes and behaviors. Thus, scholars could use these data to test theory-informed hypotheses in cross-national perspective. To date, there is no systematic assessment of corruption items in both corruption-themed and general international survey projects covering Europe.
This article contributes to the literature of systematic reviews of survey items and approaches to analyses of collections of survey questions on a common topic, such as status attainment (Treiman and Ganzeboom 2000) and happiness (De Jonge et al. 2017). Moreover, the procedures that I present to check the availability of corruption items across projects and waves have the potential to facilitate secondary data use within new analytical frameworks and to inform new data collection efforts. In the article on resources for cross-national survey research, Smith (2015) concludes that locating cross-national data for secondary analysis can be a challenge because “the holy grail of having one search tool to locate study- and question-level information across surveys, time, and countries has not yet been developed” (p. 408). Smith (2015) adds that there has been progress in this regard. The broader aim of this paper is to add to this type of scholarly progress.
1.1 Studying corruption with survey data
Public opinion surveys play a vital role in corruption research. To test theories and advance ideas on micro-level correlates of perceived and experienced corruption and their interactions with institutional and national contexts, surveys on general public provide key information. As Heath et al. (2016) point out in their review of research on corruption in developed world, the large body of research on corruption is based on macro-level indicators, but our understanding of causes and consequences of corruption at the micro-level still remains vague.
Corruption perception and corruption experience constitute important concepts that can be examined with cross-national survey data: the extent to which they are common among members of the wider society reflects the pervasiveness of the social problem. Corruption perception measures (also called “perceived corruption”) capture the amount of corruption that respondents believe to exist in a specific sector or country. The main advantage of such items is that they give an insider’s perspective and capture a person’s view formed on both experience and observation of corruption in their country. The disadvantage is that this type of item does not differentiate between petty and grand corruption. It also does not directly measure whether corruption actually happened, and thus its validity can be questioned (see also Heath et al. 2016: pp. 57–58). While limitations of perception measures should be acknowledged, they do not imply that researchers should refrain from using them. Rather, their analyses should come with careful interpretation of statistical results.
Corruption experience (sometimes referred to as behavior, extortion or victimization measure) pertains to citizens’ unmediated participation in a corrupt act, such as bribing public officials, making an unofficial payment, or an expensive gift. To measure this concept, international survey projects include questions that ask respondents directly about their engaging in corrupt acts, most commonly, bribe-giving. Corruption experience items are often sector-specific and follow a survey question on respondent’s contact with an institution. Yet because they deal with a socially frowned upon behavior, researchers are concerned about response bias, and its impact on the accuracy of estimating the phenomenon’s prevalence in given countries and times. At least partly because of this concern, surveys tend to include items on perceptions rather than experience. Such limitations notwithstanding, researchers consider corruption experience measures as “the most promising development in the past decade” (Heath et al. 2016, p.58). Developments in crime victimization research show that respondents are more willing to answer questions on illegal behavior than it was previously assumed (Seligson 2006). Seligson’s (2006) focus group research discovered that the underreporting problem in corruption behavior measures exists, but is “surprisingly limited” (p. 388).
While there are substantive challenges of measuring corruption in a survey setting (Karalashvili et al. 2015), a growing awareness of the unfortunate universality and negative consequences of corruption, and forceful demands for better anti-corruption actions, have motivated recent research on how best to observe and measure different dimensions of this phenomenon (Malito 2014; Heath et al. 2016). Scholars have presented overviews of corruption and anti-corruption measures derived from survey data (Malito 2014; Trapnell 2015; Chabova 2017; Povitkina and Wysmulek 2017). They have examined how survey-based measures of corruption compare to composite indices (Chabova 2017) and how citizen-survey measures accord with those of experts (Charron 2016) and compare with measures of corruption in firms and business (Chatterjee and Ray 2012). Studies of survey-based corruption measures have looked at how perception measures deviate from experience measures (Donchev and Ujhelyi 2014) and analyzed the effects of respondents’ reticence to estimate the level of corruption (Karalashvili et al. 2015). Some researchers have proposed new or integrated measures of corruption (e.g. Escresa and Picci 2015; Standaert 2015; Rose and Peiffer 2016).
By and large, two international organizations play the leading role in the provision of survey data: Transparency International and their Global Corruption Barometer survey project (an adult population sample), and the World Bank’s Enterprise Survey (a firm-level sample) (Holmes 2015; Malito 2014; Chabova 2017). Yet, there are many high-quality international public opinion surveys that cover the topic of corruption—along with other items on government perceptions, democratic values and institutional experiences—but are less commonly used among researchers. Although these data differ in depth and quality, the holistic view of main available sources of public opinion data on corruption can lead to new substantive and methodological contributions.
The review of Heath et al. (2016) shows how corruption measures from general public surveys can be used to test theories on the relation of corruption and individual’s trust in institutions (Ariely and Uslaner 2014), religious identity (Lee and Guven 2013), subjective class assessment in interaction with macro-level income inequality (You and Khagram 2005). General surveys allow also to analyze the relation of perceived corruption and individual’s cultural values in interaction with dominant values in a country (Kravtsova et al. 2017). The review of Heath et al. (2016), supported by the findings of Dimant and Tosato’s (2018) review of past decades empirical research on corruption, demonstrate the wide array of theories that can be tested using survey data of general public. In addition to substantive research, micro-level survey data also allows for methodological tests of the quality of survey measures on corruption, which aim at improving the measurement and better understanding of its underlying concept (Chatterjee and Ray 2012; Charron 2016).
1.2 Availability of corruption items: state of the art and beyond
Two recent overviews of major existing corruption measures have laid the groundwork for this expanded study. Malito (2014) examines the development and functions of corruption indices. Malito argues that, in their methodological orientation, indicators based on citizen surveys can be classified as either the ‘first generation’ of corruption measures that center around measurement of corruption, or to the ‘second generation’ of good governance indicators, where corruption is one of the dimensions of a broader concept of governance effectiveness. In the mid-1990s, both first- and second-generation methodological orientations emerged in parallel.Footnote 2 Malito identifies a recent methodological orientation towards country-specific measures that, while helpful for intervention strategies, do not facilitate cross-national comparisons.
Malito (2014) makes it clear that any given corruption measure emerged within a certain ontological orientation and thus bears the burden of their own conceptual and methodological constraints.Footnote 3 This ontological biases is reflected in the disagreement between researchers about the definition, nature and origin of corruption, as well as differing understanding of its core components. An important conclusion from Malito (2014) is that, to properly evaluate corruption in Europe and elsewhere with survey data, we need to know what items are available, we need to use multiple survey sources, and we need to be cognizant of the methodological and conceptual biases inherent to the surveys and to the items we, the researchers, choose to use.
Chabova (2017) presents an overview of well-established datasets for research on corruption in Europe. A watershed article, Chabova (2017) provides recommendations on which datasets are the most valid and reliable for different kinds of analysis. However, Chabova included just five cross-national survey projects: the European Social Survey, the Eurobarometer, the Global Corruption Barometer, the International Social Survey Programme, and the World Values Survey, from 1995 to 2013. The author concludes that public opinion survey data on corruption have several strong advantages over composite indices, such as their clear methodology, representatively and possibility of microanalysis.
Malito (2014) and Chabova (2017) correctly note that time and country coverage and cross-national and over-time comparability continue to be a problem for survey-based corruption measures. I build on this argument to review the universe of corruption items found in high-quality and publicly available cross-national survey projects. Examination of only corruption-specialized survey projects severely limits the possibility to conduct a comprehensive analysis on the dynamics of interest in corruption by broader group of scholars, as depicted by the number of items on corruption in both specialized and non-specialized surveys.
I build on the pioneering work of Malito (2014) and Chabova (2017) and extend the inclusion criteria of survey projects for which to check availability of corruption items across nations and time. Specifically, for this paper I focus on international public opinion surveys that are both general in scope (i.e. non-specialized) and corruption-themed (i.e. specialized), are free of charge for academic purposes, conducted in Europe during the period 1989–2017, and have national samples intended to be representative of the adult population. Based on these criteria, I evaluate 89 waves of 21 international survey projects that cover a total of 45 European countries. This goes well beyond the eight world-wide projects in Malito (2014) and five Europe-based projects in Chabova (2017). Moreover, this paper also assesses a wider range of corruption forms: it is the first to include, among others, the measures of favoritism—the use of personal connections and informal networks for getting ahead—in public opinion surveys. This form of ‘social’ corruption is harmful and widespread, yet gets less attention from scholars than bribery. This collection of corruption items allows to address questions on patterns and trends in measuring corruption in both corruption-themed and general citizen surveys.
2 Data and methodology
My data are based on the cross-national surveys’ documentation gathered within the Survey Data Recycling project on survey data harmonizationFootnote 4 (Słomczyński et al. 2016; Słomczyński and Tomescu-Dubrow 2018), and within the collections of data archiving institutions, such as the GESIS Data Archive for the Social Sciences (https://dbk.gesis.org/dbksearch), the UK Data Service (http://discover.ukdataservice.ac.uk) and the Inter-university Consortium for Political and Social Research (ICPSR, www.icpsr.umich.edu).Footnote 5 Moreover, one-third of all cross-national surveys discussed in this paper and relevant for research on corruption are located on separate project web-sites (see “Appendix A1”). These are: the Caucasus Barometer, the Global Corruption Barometer, the European Social Survey, the European Quality of Government Survey, the International Crime Victim Survey, the Life in Transition Survey and the Pew Global Attitudes Project. To identify corruption items dispersed on project web-sites, a literature review and consultations with experts supported my search for suitable corruption surveys.
My criteria for survey selection are as follows: all selected surveys are cross-national, have samples that are designed to be representative of an adult population for a given country, are available for free (in public domain or upon request), and are sufficiently documented in English. In this review, I excluded country specific surveys and surveys with specific target sample (for example firm-level survey data gathered in the World Bank Enterprise Surveys project). I concentrate on surveys that cover European countries in the time span from 1989 to 2017.
The search for corruption surveys revealed the names of survey projects where at least one question on corruption appeared. On this basis, I collected the datasets and their documentation (master codebooks and questionnaires for project waves) for all relevant survey project waves. Based on this information, I created a common file with available international survey data that features corruption items, following the standardization of documentation template created within the Data Harmonization project (Wysmulek et al. 2015). For each selected questionnaire item, I noted survey name, survey wave, year of survey wave, name of the variable, question wording, response categories, and comments, including mainly information on filtering questions and waves repeating the question.
Using Cygwin command-line environment for automatic search, I checked the input files (codebooks, questionnaires and data dictionaries)Footnote 6 for lines that contain a match with key words and their grammar variations: ‘corrupt’, ‘bribe’, ‘gift’, ‘tip’, ‘favor’ (‘favour’), ‘compensation’, ‘reward’, ‘payment’, ‘present’, ‘tie’, ‘connection’, and ‘informal’.Footnote 7 If I found a matching case, I examined the neighboring questions and response categories to get information on the contextual meaning of the key word and on filtering and follow-up questions.Footnote 8 The key words used in this article are based on the common definition of corruption ‘as the abuse of public power for private gains’, where ‘abuse of public power’ is understood as both ‘economic’ improprieties such as embezzlement or accepting bribes and ‘social’ improprieties such as favoritism, cronyism or nepotism as forms of using connections for private gains (Holmes 2015).
Table 1 presents basic information on survey projects that met the selection criteria. The table shows the full name of the project, its abbreviation, the number of waves, year coverage and availability of documentation sources for survey projects in which corruption question appeared (see “Appendix A1” for details on data and documentation sources).Footnote 9 It also shows the total number of questions on corruption (called here corruption items) asked in the survey project.Footnote 10
2.1 I divided surveys intro three categories
-
1.
Survey projects with a block of corruption items—called here specialized surveys: all selected survey projects and their waves, which contain the block of items (more than ten items per survey wave) on corruption.
-
2.
Large general survey projects with some items on corruption: large survey projects in terms of country and year coverage with less than ten question items on corruption.
-
3.
Other survey projects with some items on corruption: other survey projects covering minimum three countries and with less than ten question items on corruption per survey wave, subdivided into other general survey projects and other regional survey projects.
The results of the review of 1989–2017 survey data show that there is a total of 1129 questions on corruption dispersed in 21 international survey projects and their 89 waves (or editions) (see Table 1). The time span of available data for public use indicates also the common delay in data availability, inherent in the survey data life cycle. We can expect that with time more data will become publicly available for the last three-four years of the review.
The number of questions on corruption is not equally distributed across different surveys and survey waves. Some selected survey waves had a block of corruption items, and the other waves of the same survey project may contain only a couple of questions or just one question on corruption.
3 Results
3.1 Trends in the number of corruption items by survey types from 1989 to 2017
In this next section, I trace the number of corruption items included in public opinion surveys from 1989 to 2017 and then I examine what types of surveys included corruption items. Figure 1 presents the total number of survey waves and average of corruption variables per survey wave, independently from the type of question on corruption. The years are grouped into periods that reflects the cycle of cross-national data gathering process.
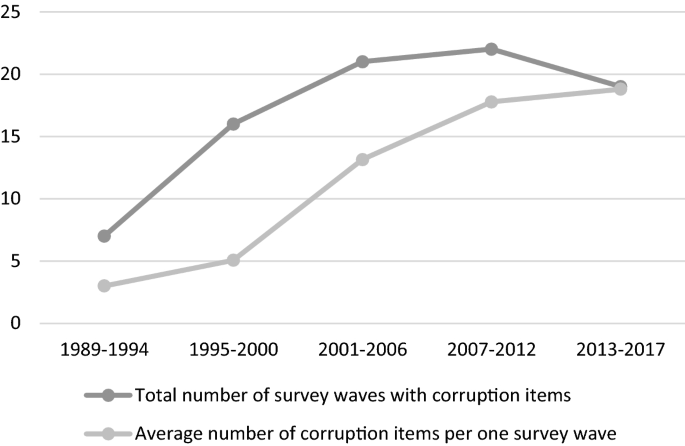
The total number of survey project waves and the average number of corruption items per wave by year
Figure 1 shows the rapidly increasing trend in the amount of surveys that include questions on corruption from 1989 to 2001. The number of survey waves is three times higher in 2001–2006 as compared to 1989–1994—it increases from the total of 7 to 21 cross-national survey waves that started to include question modules on corruption. The average number of items on corruption per survey wave also rises sharply.
In the next five years, from 2001 to 2006, most specialized corruption surveys were launched. This trend led to the first peak in 2003–2005, when the largest amount of surveys projects in Europe included question modules on corruption (Fig. 2). The peak is also connected with the first wave of Global Corruption Barometer—the corruption-themed survey that gathered data in Europe each year from 2003 till 2007, and later in 2009, 2010 and every three years since then.
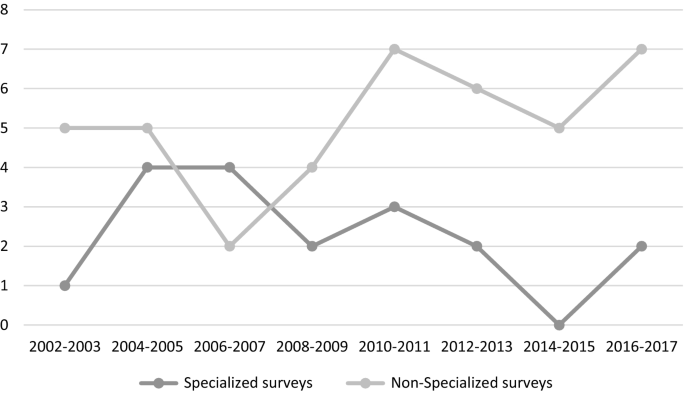
The total number of survey waves with corruption items by year: specialized and non-specialized surveys
From 2004 to 2013, the amount of corruption items per wave remains fairly stable—surveys that included question modules on corruption before usually repeat or develop these modules. The pace of gathering data on corruption relatively slows down in 2014–2015 and revives again in 2016–2017. The relative slow-down in 2014–2015 is connected with the gap in gathering data by specialized surveys in corruption: The Global Corruption Barometer slows down the pace and stops gathering annual data from Europe, the corruption-themed Eurobarometer skips corruption module in 2015, and the Life in Transition survey took an unusually large six-year break between waves.
This gap in gathering corruption-related data in 2014–2015 might be coincidental, but if a similar trend as observed in 2013–2017 continues, it will mean a shift towards less frequent survey data on corruption collected in Europe through specialized corruption-themed surveys (every three to four years instead of annually) and an increasing interest in questions on corruption in general surveys. The amount of publicly available survey waves for 2016–2017 will grow soon, as it usually takes about two years before the data are released to the public.
3.2 Trends and availability of corruption items in specialized survey projects
Public opinion surveys that contain a block of items on corruption differ in many respects, but they contain a set of similar characteristics, as revealed in selection criteria for this study and in special attention to the issue of corruption that is reflected in their questionnaires. This section presents the main international survey projects with a block of questions on corruption and analysis of the trends in the content of their questionnaires.
3.2.1 Global corruption barometer (GCB)
Global Corruption Barometer is a cross-national public opinion survey organized by the non-governmental organization Transparency International. The survey originates from the Voice of the People Survey 2002 of the Gallup International Association. The main cross-national survey aim is to gather views and experiences of corruption, which is a step to Transparency International’s aim to tackle corruption worldwide. As of 2017, GCB has had nine editions with the first wave of the project dating back to 2003. The first 2003 wave of the project covered the total of 31,394 respondents from 43 countries. The number of countries participating in the project grew: by 2013, it reached 107 countries with around 1000 respondents in each country (114,270 people). In 2016, GCB collaborated with LITS to implement a question module on corruption in Europe (Transparency International 2016). All waves of GCB are available for free upon request from Transparency International.
The corruption related subset of questions in the GCB—core questions that appear in almost every GCB wave—is about corruption perception and experience of bribe-giving in specified public institutions, prospective and retrospective evaluation of corruption level in the country, and evaluation of government actions to combat corruption. Each wave has specific characteristics, such as additional questions and new methodological experiments of how better to measure corruption. For example, in 2003 we can find a hypothetical question: “If you had a magic wand and you could eliminate corruption from one of the following institutions, what would your first choice be?”Footnote 11 In the next 2004 wave, we can find a question on the severity of specific types of corruption that distinguishes between petty and grand corruption.Footnote 12 The subsequent wave offers interesting follow-up questions to the bribe-giving issue on why they pay bribes and the overall amount of money they paid in bribes during the last 12 months. GCB interests changed wave to wave, from the perception of the fairness of judges (2006 wave), to the evaluation of the quality of specific utility providers such as water service (2007 wave), to acceptance of certain types of corrupt behavior (corruption behavior scenario questions, 2009), to experience with formal bribe complaint (2009 wave). The waves of GCB from 2010, 2011 and 2013 offer us information about the attitudes and experiences of different ways of fighting corruption, changing the from ‘what government has done’ to ‘what ordinary people can do’.
Although the GCB dataset contains many detailed questions on corruption perception and behavior, it offers little information about the respondents’ other views and experiences. It does contain the basic demographic information on respondent’s age, gender, place of residence, income level, education, employment status and religious denomination, recoded from their original form in the Voice of the People Survey or the Life in Transition survey.
3.2.2 Eurobarometer corruption themed (EB_corr)
Eurobarometer (EB) is an international series of surveys conducted by different research institutes on the behalf of the European Commission, Directorate-General Communication, or on behalf of the European Parliament. It consists of the four survey series, namely Standard and Special Eurobarometer (EB, since 1970), the Central and Eastern Eurobarometer (CEE, 1990–1997) and the Candidate (or Applicant) Countries Eurobarometer (CCEB, 2000–2004). The general aim of EB is to monitor public opinion in the European Union and about the European Union. The set of questions on corruption appear in six EB editions repeating usually every two years since 2005 (Eurobarometer Corruption Themed, EB_corr).Footnote 13 They cover 27 countries which are European Union member countries, accession countries and candidate countries at the time of data gathering (European Commission 2013).
Corruption related questions first appeared as a series of four question types (with an average of seven sub questions each) in 2005, capturing general perceptions of corruption and actual experience of paying bribes in specified public institutions, opinions on who is responsible for fighting corruption, and levels of agreement on the statement that ‘corruption is a major problem in a country’ or ‘most corruption is caused by organized crime’. Compared to similar questions in other surveys, EB_corr questions have different levels of politicians and institutions: national, regional, local, the European Union. In subsequent waves, these questions were repeated with slight modifications, as for example in 2011 ‘private companies’ and in 2013 ‘banks’ were added as a separate institution, including in the analysis of corruption both public and private sector. Other important issues include main reasons why there is corruption in society, the level of trust to organizations to resolve corruption, and the evaluation of efforts to fight corruption by different bodies, such as the EU (asked in 2009 and 2011). In 2011, another ‘player’ added to the perception of corruption level and anti-corruption complaints was mass media. Media, newspapers and journalists are added as an important sector that respondents may trust to complain and deal with corruption. Respondents are also asked whether they feel well-informed about the corruption level in their country and in the EU.
In EB_corr 2013, there was an interesting development of the block of corruption items—as much as 75% of these items were new and not asked in previous EB survey waves. Continuity was kept in only four questionnaire items, but even those underwent some modifications in question wording. The section in the questionnaire on corruption in the EB_corr 2013 starts with the issue of informal payment in hospitals. The remarkable change in formulation of questions is that for the first time the different forms of petty corruption are distinguished, such as giving money, giving a gift or doing a favor. Turning into the next, more general block of questions, interviewers are asked to tell respondents “From now on, when we mention corruption, we mean it in a broad sense, including offering, giving, requesting or accepting bribes or kickbacks, valuable gifts or important favors, as well as any abuse of power for private gain” (European Commission 2013, p. 545)—an important attempt to predefine the meaning of an abstract and ambiguous concept which corruption is. Among other peculiar data that we can find in 2013 questionnaire is the set of questions on the exact amount of bribe asked by institutions. The corruption question module from 2013 is largely repeated in 2017 wave of the survey, with only minor modifications.
Themed EB editions offer a wide range of questions that cover topics other than corruption, such as for example attitudes to women in a decision-making position, perceptions of economic crises, health care habits and daily routines, to name a few.
3.2.3 International crime victim survey
International Crime Victim Survey (ICVS) is a cross-national survey project initiated in 1987 by a group of European criminologists as a comparative measure of crime rates independent from police statistics. Since its inception, the project has been mainly supported by the Dutch Ministry of Justice. Currently, the project is run by the International Victimology Institute Tilburg and the United Nations Interregional Crime and Justice Research Institute.
Following the ICVS methodology, European Survey on Crime and Safety emerged in 2005 and integrated with the ICVS database. Overall, by 2005 they gathered over 320 000 interviews from individual respondents from 37 countries in its five released editions of 1989, 1992, 1996, 2000 and 2004/2005. Generally, the ICVS questionnaires concentrate on household experience of common crimes and victimization (Van Kesteren 2007). The section on corruption appeared in the second edition of ICVS project in 1992.
ICVS is one of the best-known sources of corruption experience data. The core question on corruption in ICVS captures whether during the last year a respondent was expected to pay a bribe or was asked for a bribe. The questionnaire provides a list of officials who might have been involved, such as government official, customs offices, police officer, inspector, elected municipal councilors, municipal officials, tax-revenue officials, doctor-nurse, teacher-professor, official in courts, private sector or “other”. Since 1996, there is also a standard follow-up question on whether the respondent reported this incident to the police or a private agency.
The number of questions on corruption expanded significantly in the 2000 ICVS edition. The title of documentation for 2000 questionnaire itself started to include the word ‘corruption’, although corruption-related questions cover only three pages out of 39-page long questionnaire. What was new? The questions that appeared cover mainly three new topics: retrospective evaluation of corruption experience; likelihood of paying money for service that is entitled by law (for free); and reasons to report or not to report official’s request for a bribe, as well as evaluation of police work, if the respondent reported the corruption experience.
ICVS offers rich information about the experience and attitudes of respondents to different types of crimes, such as consumer fraud, hate crimes, and drug problems. The questionnaire also addresses the subjective evaluation of feeling safe and trust in the police.
3.2.4 Life in transition survey
Life in Transition Survey (LITS) is a cross-national project organized by The European Bank for Reconstruction and Development that started in 2006 as the joint endeavor with the World Bank. As continuation, the consequent waves of the project were conducted in 2010 and 2016. Research organizers aimed to gather data from Central and Eastern Europe, Commonwealth of Independent State, as well as Turkey and Mongolia (Ipsos MORI 2011). The general aim of LITS is to study the perception, impact, and attitudes towards transition across world regions. In the first wave of the survey in 2006, LITS includes individual questionnaires (profiles) of 29 000 respondents from 29 countries. In 2016, the coverage of LITS increased to 34 countries.
In all three waves of LITS, corruption related questions constitute an important part of LITS questionnaires. Questions that appear in all survey waves cover such issues as the general perception of corruption level in the country, evaluation of the importance of corrupt practices for success and frequency of informal payments demanded by public officials. The peculiarity of the questionnaires lay in the specific emphasis on the comparison of the situation now to the time before regime change, especially evident in the 2006 questionnaire. In 2016, the question module on corruption in LITS was enlarged and developed in collaboration with GCB. The new questions in 2016 wave include, among others, items on fighting corruption.
Unusual for corruption surveys, LITS covers the frequency of informal payments to many different kinds of public officials. This includes specific situations as the interaction with the road police, interactions with the police on matters other than traffic, requesting official documents from authorities, going to courts for a civil matter, receiving medical treatment in the public health system, receiving public education, requesting unemployment benefits and requesting other social security benefits. The general opinion about frequency of informal payments is followed up in the 2010 questionnaire with specific questions about household experience of paying or not paying a bribe in a given situation (experiential question, similar to ICVS). The respondents that declared a personal experience of corrupt behavior were also asked to specify the main reason of it from the list of possible motivations, such as for example “I offered to pay, to get things done quicker or better” or “I was not asked to pay but I wanted to express my gratitude” and other.
Comparing the block of questions on corruption in different waves of LITS, there are some new trends. Questions become more specific and types of situations better defined. There is a higher number of items on experiential data. For example, the respondents in 2006 questionnaire are asked about the importance of connections, and in 2010 this question is developed in the evaluation of specific situation when connections might be or have been important, such as for example getting a job or getting to the university. In terms of public institutions, the interest seems to shift from police (e.g. in 2006 questionnaire—more specific situations for bribing police officers) to education institutions and health care (e.g. in 2010 questionnaire—more specific questions about informal payment in different school levels and types).
Like the EB themed editions, LITS data contains a wide range of questions on attitudes and opinions apart from questions on corruption. As survey organizers suggest, LITS survey may contribute to the analysis of “relationships among life satisfaction and living standards, poverty and inequality, trust in state institutions, satisfaction with public services, and attitudes to a market economy and democracy throughout the region” (Ipsos MORI 2011, p. 5).
3.3 Availability of corruption items in non-specialized public opinion surveys
The total number of corruption items in general survey projects that do not specialize in corruption is 156 questions (average of about 2 corruption items per wave). There are 38 corruption items found in 19 waves of four large general survey projects: the European Social Survey, the European Value Survey, the International Social Survey Program and the World Value Survey. Although corruption is not a central topic in any of these surveys (there are from one to maximum three questions per wave), they offer a wealth of answers to these questions gathered from a large number of countries (average of 38 countries in Europe with 54 091 individual profiles per wave). There are also 118 corruption items dispersed in 49 waves of 13 smaller general or regional cross-national survey projects.
Although question wordings and response categories vary depending on the project, there are certain repeated topics they cover. The harmonized analysis or any form of comparison of results gathered by different research project on the same topic open new possibilities in research by, for example, enlarging the sample or controlling for survey quality.
The results of the analysis of corruption items are presented in aggregated form in Table 2 with the reference to the wave where the question can be found. The questionnaire items are shortened to the core question, capturing the meaning of the question but not depicting the exact wording or response categories. The corruption items are divided into groups of questions referring to corruption in general and questions specifically referring to bribe-giving or connections (allowing to measure favoritism, cronyism and nepotism). The aim of this analysis is to present the coverage of certain topics depicted in corruption items in different surveys.
Most questions which are repeated in different survey project waves refer to the perception of corruption (generally). There are fourteen core questions on perception of corruption distinguished, which are repeated in minimum two survey project waves. The most popular question is “How widespread do you think corruption is in public service?”, first asked in WVS 1994 and then repeated in fifteen waves of nine different survey projects. There are years in which this question was asked in the same country but by different survey projects, as for example Italy in 2000 (ASES and CDCEE) or Latvia in 2004 (ISSP and NBB), which opens new analytical possibilities (for example by using ex-post harmonization).
There is also a large number of questions that refer specifically to bribe giving. I would like to underline two of them here. First, “Can accepting/paying a bribe be justified?” is the question with a wide project wave coverage—asked in nine waves of such three survey projects as WVS (1989–2005), EVS (1990–2008) and most recently in CB (2011). It is interesting that this is the only question that was asked in 1989 (WVS 1989), which makes it the oldest question in the sample. Second, the question that gained its popularity quite recently in cross-national surveys and refers to specific experience of paying bribes “In the past 12 months have you or anyone living in your household paid a bribe in any form?”. Since 2000, it appeared in nine waves of four survey projects that do not specialize in corruption.
The specific questions on the importance of connections is asked mostly in regional surveys such as CB and NBB (Table 2). The question on connections that is most widely asked is “How important is using connections (to get a good job, for getting ahead in life)?”. In addition to the specialized survey waves, it can be found in the CB, ISJP, EB and ISSP (total of thirteen additional survey project waves).
The review of corruption item coverage reveals that not only many of the corruption items have a similar or identical core question, but also that some topics asked in non-specialized cross-national surveys are unique and can be used as an important additional material or context. For example, the question asked in PEW 2012 “In what European Union country, if any, are people the most corrupt?”.
4 Summary and discussion
In this article I presented the largest systematic review of international public opinion surveys, conducted in Europe in the period 1989–2017, to show a great availability of corruption items. Results show that within a couple decades, the growth of corruption items in international public opinion surveys in Europe has been remarkable, rising from just one in 1989 to nearly a hundred in 2017. A rapid increase in the amount of survey data on corruption began in 2003, when the corruption-specialized surveys were launched. This upward trend typical for the beginning of the 2000s goes in line with the overall increase in the number of cross-national public opinion surveys in Europe (Granda et al. 2010), the changes in media coverage of corruption related issues (Makowski 2008), the increasing corruption awareness-raising by international organizations (such as Transparency International), and discourse processes around corruption awoken by the enlargement of European Union (Moroff and Schmidt-Pfister 2010). In recent years, most corruption modules introduced to questionnaires during the peak of interest are just repeated, and not further developed or extended. There is also a slight change toward fewer specialized corruption-themed surveys and an increasing interest in questions on corruption in general surveys.
Based on the collected documentation for over 1100 corruption items, I also addressed the question of the continuity and change in types of corruption items in the international general public surveys. These trends are: gathering experiential data in addition to perception measure (including questions on corruption behavior scenarios); distinguishing between different forms of corruption (e.g., grand vs. petty corruption, or kinds of favoritism as cronyism and nepotism); changing perspective from ‘what government has done’ to ‘what ordinary people can do’; and increasing number of items on corruption in the private sector, in banks, and media, in particular.
Up to now information on public opinion survey data on corruption has been scattered, leaving a number of potential users of these data unaware of their richness. The lack of archival infrastructure for efficient search of micro-data and still limited possibilities for interdisciplinary cooperation between corruption researchers create the new need for analysis of the available survey measures to evaluate corruption. Especially across Europe, the amount of high-quality public opinion data is growing, which, together with novel analytical methods, offer a great potential for corruption researchers but also demands knowing about and understanding of these existent sources.
Presently, with all the information available, there are several challenges to use these data for testing hypotheses on corruption patterns, its causes and consequences. Some of these challenges are of theoretical nature, requiring elaboration of concepts that can be captured by survey data. The other, methodological challenges also persist and are not limited to the index construction and issues related to the within-survey validity and reliability. These methodological challenges extend to the between-surveys ex-post harmonization of data if the data richness is to be fully exploited. One important aspect of data harmonization involves assessment of survey-data quality expressed in terms of variables, impact of which can be controlled in substantive analyses. Success of overcoming these challenges depend on archival infrastructure for efficient use of micro-data and also on the interdisciplinary cooperation, since harmonization process involves knowledge from various domains, including data science and advanced statistics.
Notes
Specifically, the review covers: Albania, Andorra, Armenia, Austria, Azerbaijan, Belarus, Belgium, Bosnia and Herzegovina, Bulgaria, Croatia, Cyprus, Czech Republic, Denmark, Estonia, Finland, France, Georgia, Germany, Greece, Hungary, Iceland, Ireland, Italy, Kosovo, Latvia, Lithuania, Luxembourg, Macedonia (FYROM), Malta, Moldova, Montenegro, Netherlands, Norway, Poland, Portugal, Romania, Russia, Serbia, Slovakia, Slovenia, Spain, Sweden, Switzerland, Ukraine, and the United Kingdom.
Malito (2014) mentioned eight cross-national citizen survey projects—the Global Corruption Barometer, the Voice of the People Survey, the Eurobarometer, the International Crime Victimization Survey, the European Values Study, the Latinobarometer, the Afrobarometer and the World Value Survey—that are components of some corruption indices.
Ontological consideration is understood by Malito (2014) as the manner in which corruption is defined and conceptualized (p. 5). The researcher distinguishes four fundamental ontological critiques of the present research on corruption: the polyarchy of definitions, the lack of distinction from other related concepts (i.a. state capture), the disagreements in operationalization of corruption as political vs economic indicator, and conceptual incongruence.
The Survey Data Recycling (SDR) is an analytical framework for integrating information from extant sources and their meta-data to create multi-country multi-year dataset that enable comparative research. The SDR analytical framework is applied in the SDR project on survey data harmonization, which among other research tools, provides the collection of standardizes original survey materials such as survey codebooks and questionnaires available across different survey data archives and individual survey web-sites. This paper has been using the collection of the SDR documentation of original survey materials. The detailed description of the SDR project and its tools is in Słomczyński and Tomescu-Dubrow 2018, available at dataharmonization.org.
Additionally, (1) the data search tool of the ROPER Public Opinion Research Archive (https://ropercenter.cornell.edu (2) the search tool developed by the World Bank, the Microdata Catalog and (3) The CESSDA Data Catalogue are available for researchers, but where not the main sources of metadata in this paper.
Codebooks, questionnaires and data dictionaries contain information on question wording, variable values and coded textual responses.
Some codebooks and questionnaires are saved not as a textual information but as a picture, which enabled automatic search and involved individual human processing.
Questions on corruption behavior (also called practice or experience) are often asked after the filtering question on whether a person had a recent contact with an institution (e.g. in the past 12 months). There are also ‘specification’ questions (or conditional, ‘follow-up’ questions): this is the question like “If yes (on paying bribes): did you report? Or what amount did you pay? In the filtering and follow up questions the key words used for Cygwin search do not appear. Yet, I mention them in the collection of corruption item: Filtering questions on contact are added in the comments to a relevant corruption item, and ‘follow up’ questions are counted as separate items. Moreover, general questions where corruption (or its type) was listed among other social problems in one line and open-ended questions (such as ‘the most important issues our society is facing now’ and the like), which contained in their response the key word (e.g. corruption) were not included in further research.
As even in those survey projects, where corruption items appeared, it was usually not repeated in each wave, the number of waves (and years) in the Table 1 do not correspond to the total number of project waves in which the search was conducted.
The number of items generally correspond to the number of variables, as coded in the source dataset, except for the Eurobarometer survey, where response categories are often coded as dummy variables. In the case of EB, when calculating the total number of relevant items, I omitted the dummy variables (mentioned/not mentioned) that often refer to missing values or spontaneous answers, such as ‘don’t know’, ‘refused’ and ‘other (spontaneous)’. I counted in total only those response categories as separate items that were given as option to the respondent and can measure separate theoretical constructs.
Question is not repeated in other GCB waves.
From the GCB 2004 questionnaire: “Petty or administrative corruption that is corruption in ordinary people’s daily lives, such as bribes paid for licenses, traffic violations, etc. […] Grand or political corruption that is corruption at the highest levels of society, by leading political elites, major companies, etc.” (Transparency International 2004, p. 13).
These editions are EB 2005/64.3, EB 2007/68.2, EB 2009/72.2, EB 2011/76.1, EB 2013/79.1 and EB 2017/88.2.
References
Aidt, T.S.: Corruption, institutions, and economic development. Oxf. Rev. Econ. Policy 25(2), 271–291 (2009)
Anderson, C.J., Tverdova, Y.V.: Corruption, political allegiances, and attitudes toward government in contemporary democracies. Am. J. Polit. Sci. 47(1), 91–109 (2003)
Ariely, G., Uslaner, E.M.: Corruption, Fairness, and Inequality. (2014). https://ssrn.com/abstract=2460399. Accessed 23 Mar 2019
Chabova, K.: Measuring corruption in Europe: public opinion surveys and composite indices. Qual. Quant. 51(4), 1877–1900 (2017)
Charron, N.: Do corruption measures have a perception problem? Assessing the relationship between experiences and perceptions of corruption among citizens and experts. Eur. Pol. Sci. Rev. 8(1), 147–171 (2016)
Chatterjee, I., Ray, R.: Does the evidence on corruption depend on how it is measured? Results from a cross-country study on microdata sets. Appl. Econ. 44(25), 3215–3227 (2012)
De Jonge, T., Veenhoven, R., Kalmijn, W.: Diversity in Survey Questions on the Same Topic, vol. 68. Springer International Publishing, Cham (2017)
Dimant, E., Tosato, G.: Causes and effects of corruption: What has past decade’s empirical research taught us? J. Econ. Surv. 32(2), 335–356 (2018)
Donchev, D., Ujhelyi, G.: What do corruption indices measure? Econ. Pol. 26(2), 309 (2014)
Escresa, L., Picci, L.: A new cross-national measure of corruption. World Bank Econ. Rev. 29(3), 196–219 (2015)
European Commission: Eurobarometer 79.1. (2013)—Variable Report. GESIS Data Archive, (2016). https://dbk.gesis.org/dbksearch/sdesc2.asp?no=5687. Accessed 23 Mar 2019
Granda, P., Wolf, Ch., Hadorn, R.: Harmonizing survey data. In: Harkness, J.A., Braun, M., Edwards, B., Johnson, T., Lyberg, L., Mohler, PPh, Pennell, B.-E., Smith, T.W. (eds.) Survey methods in multinational, multicultural and multiregional contexts, pp. 315–332. Wiley, Hoboken (2010)
Heath, A.F., Richards, L., de Graaf, N.D.: Explaining corruption in the developed world: the potential of sociological approaches. Ann. Rev. Sociol. 42, 51–79 (2016)
Holmes, L.: Corruption: A Very Short Introduction. Oxford University Press, Oxford (2015)
Ipsos MORI: Life in Transition Survey I. A brief report on observations, experiences and methodology, (2006). http://www.ebrd.com/what-we-do/economic-research-and-data/data/lits.html. Accessed 23 Mar 2019
Ipsos MORI: Life in Transition Survey II. Technical report, (2011) http://www.ebrd.com/what-we-do/economic-research-and-data/data/lits.html. Accessed 23 Mar 2019
Karalashvili, N., Kraay, A., Murrell, P.: Doing the survey two-step: the effects of reticence on estimates of corruption in two-stage survey questions (No. World Bank Policy Research Working Paper 7276), (2015) http://papers.ssrn.com/sol3/papers.cfm?abstract_id=2609623. Accessed 23 Mar 2019
Karklins, R.: The system made me do it: corruption in post-communist societies. ME Sharpe (2005)
Kravtsova, M., Oshchepkov, A., Welzel, C.: Values and corruption: do postmaterialists justify bribery? J. Cross Cult. Psychol. 48(2), 225–242 (2017)
Lambsdorff, J.G.: Making corrupt deals: contracting in the shadow of the law. J. Econ. Behav. Org. (2002). https://doi.org/10.1016/S0167-2681(01)00217-7
Lee, W.-S.: Guven, C: Engaging in corruption: The influence of cultural values and contagion effects at the microlevel. J. Econ. Psychol. 39, 287–300 (2013)
Makowski, G.: Korupcja jako problem społeczny. Warszawa, Wydawnictwo “Trio” (2008)
Malito, D.: Measuring corruption indicators and indices. Robert Schuman Centre for Advanced Studies Research Paper 2014/13, (2014). http://dx.doi.org/10.2139/ssrn.2393335. Accessed 23 Mar 2019
Mauro, P.: Corruption and growth. Q. J. Econ. 110(3), 681–712 (1995)
Melgar, N., Rossi, M., Smith, T.W.: The perception of corruption. Int. J. Pub. Opin. Res. 22(1), 120–131 (2010)
Moroff, H., Schmidt-Pfister, D.: Anti-corruption movements, mechanisms, and machines—an introduction. Global Crime. 11(2), 89–98 (2010)
Povitkina, M., Wysmulek, I.: Quantitative methods in researching corruption: surveys, cross-national studies, and measurement issues. In: Schwickerath, A., Varraich, A., Smith, L.-L. (eds.) How to Research Corruption, pp. 25–34. ICR_Forum_Amsterdam_Conference_Procedings, (2017). http://nbn-resolving.de/urn:nbn:de:0168-ssoar-52393-1. Accessed 23 Mar 2019
Richards, L.: Using Survey Methods to Research Corruption. In: Schwickerath, A., Varraich, A., Smith, L.-L. (eds.) How to Research Corruption, pp. 4–13. ICR_Forum_Amsterdam_Conference_Procedings, (2017). http://nbn-resolving.de/urn:nbn:de:0168-ssoar-52393-1. Accessed 23 Mar 2019
Rose, R., Peiffer, C.: Integrating institutional and behavioural measures of bribery. Eur. J. Crim. Policy Res. 22(3), 525–542 (2016)
Rose, R., Peiffer, C.: Paying Bribes for Public Services: A Global Guide to Grass-Roots Corruption. Palgrave Macmillan, Basingstoke (2015)
Rose-Ackerman, S.: Corruption and Government: Causes, Consequences, and Reform. Cambridge University Press, Cambridge (1999)
Rothstein, B.: The Quality of Government: Corruption, Social Trust, and Inequality in International Perspective. University of Chicago Press, Chicago (2011)
Seligson, M.A.: The measurement and impact of corruption victimization: survey evidence from latin America. World Dev. 34(2), 381–404 (2006)
Słomczyński, K.M., Tomescu-Dubrow, I., Jenkins, C.J., Kołczyńska, M., Powałko, P., Wysmułek, I., Oleksiyenko, O., Zieliński, M.W., Dubrow, J.K.: Democratic Values and Protest Behavior. Harmonization of Data from International Survey Projects. IFiS Publishers, Warsaw (2016)
Słomczyński, K.M., Tomescu-Dubrow, I.: Basic principles of survey data recycling. In: Johnson, T.P., Pennell, B.-E., Stoop, I.A.L., Dorer, B. (eds.) Advances in Comparative Survey Methodology, pp. 937–962. Wiley, New York (2018)
Smith, T.W.: Resources for conducting cross-national survey research. Pub. Opin. Q. (2015). https://doi.org/10.1093/poq/nfv004
Standaert, S.: Divining the level of corruption: a Bayesian state-space approach. J. Comp. Econ. 43, 782–803 (2015)
Transparency International: D7.1 Large scale, publicly accessible household survey dataset: The Global Corruption Barometer (GCB) survey report—summary, (2016). http://anticorrp.eu/wp-content/uploads/2016/12/D7.1-Survey-report-Summary.pdf. Accessed 17 Sep 2018
Transparency International: Report on the Transparency International Global Corruption Barometer 2004, (2004). https://www.transparency.org/whatwedo/publication/gcb_2004. Accessed 23 Mar 2019
Trapnell, S.: User’s Guide to Measuring Corruption and Anti-Corruption. United Nations Development Programme, New York (2015)
Treiman, D.J., Ganzeboom, H.B.G.: The fourth generation of comparative stratification research. In: Quah, S.R., Sales, A. (eds.) The International Handbook of Sociology, pp. 122–150. Sage, London (2000)
Van Kesteren, J.N.: Integrated Database from the Crime Victim Surveys (ICVS) 1989-2005, data and codebook. Tilburg, INTERVICT (2007)
Wysmulek, I., Oleksiyenko, O., Powalko, P., Zielinski, M.W., Slomczynski, K.M.: Towards standardization: target variable report template in the harmonization project. Harmonization: Newsletter Surv. Data Harmon. Soc. Sci. 1(2), 13–18 (2015)
Wysmulek, I.: Creating a ‘common file’ of source variables for ex-post harmonization of international surveys featuring corruption items. Harmonization: Newsletter Surv. Data Harmon. Soc. Sci. 2(2), 19–24 (2017)
Wysmulek, I.: Corruption items in cross-national general surveys (1989–2017). https://doi.org/10.7910/DVN/DL9QCE. Harvard Dataverse (2019)
You, J.-S., Khagram, S.: A comparative study of inequality and corruption. Am. Sociol. Rev. 70(1), 136 (2005)
Acknowledgements
I would like to thank Kazimierz M. Slomczynski, Joshua K. Dubrow and Irina Tomescu-Dubrow for their invaluable support and guidelines. I am also very grateful to Zbigniew Sawinski, J. Craig Jenkins and Tom W. Smith for their comments on the earlier versions of this paper. Special thanks to Przemek Powałko for teaching me how to use Cygwin. I also wish to thank two anonymous reviewers for their time and feedback.
Funding
This research is based on work supported by the mobility grant of the Polish Ministry of Science and Higher Education ((1292/MOB/IV/2015/0) and the US National Science Foundation Grant No (PTE 1738502).
Author information
Authors and Affiliations
Corresponding author
Ethics declarations
Supplementary materials
Supplementary materials are available at Harvard Dataverse, see Wysmulek (2019).
Additional information
Publisher's Note
Springer Nature remains neutral with regard to jurisdictional claims in published maps and institutional affiliations.
The extended abstract of this article has been published in the Newsletter on Survey Data Harmonization in the Social Sciences, Tomescu-Dubrow and Dubrow (eds.), see Wysmulek (2017).
Appendix A1
Rights and permissions
Open Access This article is distributed under the terms of the Creative Commons Attribution 4.0 International License (http://creativecommons.org/licenses/by/4.0/), which permits unrestricted use, distribution, and reproduction in any medium, provided you give appropriate credit to the original author(s) and the source, provide a link to the Creative Commons license, and indicate if changes were made.
About this article

Cite this article
Wysmułek, I. Using public opinion surveys to evaluate corruption in Europe: trends in the corruption items of 21 international survey projects, 1989–2017. Qual Quant 53, 2589–2610 (2019). https://doi.org/10.1007/s11135-019-00873-x
Published:
Issue Date:
DOI: https://doi.org/10.1007/s11135-019-00873-x