
Abstract
The International Society for Clinical Electrophysiology of Vision (ISCEV) standard for full-field electroretinography (ERG) describes a minimum protocol for clinical testing but encourages more extensive testing where appropriate. This ISCEV extended protocol describes an extension of the ISCEV full-field ERG standard, in which methods to record and evaluate the growth of the dark-adapted (DA) ERG b-wave with increasing stimulus energy are described. The flashes span a range that includes the weakest flash required to generate a reliable DA ERG b-wave and that required to generate a maximal b-wave amplitude. The DA ERG b-wave stimulus–response series (also known historically as the “intensity–response” or “luminance–response” series) can more comprehensively characterize generalized rod system function than the ISCEV standard ERG protocol and may be of diagnostic or prognostic value in disorders that cause generalized rod system dysfunction.
Introduction
The International Society for Clinical Electrophysiology of Vision (ISCEV) standard for full-field electroretinography (ERG) describes a minimum set of tests but encourages the use of additional ERG protocols for clinical ERG testing [1]. This extended protocol describes the flash stimulus–response series for the dark-adapted (DA) ERG b-wave amplitude, referred to as the “intensity–response” or “luminance–response” function in many published studies. The protocol is a specialized procedure that is well established and broadly accepted by experts in the field and was prepared by the authors in accordance with ISCEV procedures (http://www.iscev.org/standards/index.html#guide2procedures). The protocol was approved by the ISCEV Board of Directors on February 27, 2019.
Scope and applications
The ERG is a graded response whereby amplitude, timing and waveform change with increasing stimulus strength (Fig. 1). This protocol describes the process of recording DA ERGs using a series of increasing stimulus strengths and of analyzing the data by their fit to a heuristic model. The derived parameters of the model characterize the maximal rod-mediated retinal response and provide a measure of retinal sensitivity that may aid understanding of pathophysiology in some retinopathies.

After: Johnson (1991) in Heckenlively and Arden [2]
Human DA ERG waveforms recorded to flashes of increasing strength (intensity).
Naka and Rushton derived the stimulus–response (V–log I) function, expanded by others and detailed below, by recording intra-retinal voltage (S-potentials) in fish to a range of light stimuli [3]. The stimulus–response characteristics of human DA ERG b-waves were first described by Fulton and Rushton [4], who fit b-wave amplitude data with a saturating hyperbolic (H2) function. Later, the DA ERG stimulus–response relationship was refined in a letter to the editor by Massof and Johnson [5] that specifically documented an exponentiated form of a hyperbolic relationship. This function was referred to as the so-called Naka–Rushton equation in a 1984 study of ERGs in retinitis pigmentosa [6], and this name was retained in most subsequent studies of the ERG b-wave stimulus–response function (but see “Technical Issues: f. Nomenclature”).
The flash stimulus–response series for the DA ERG b-wave amplitude may be described reasonably well by the following function:
where V (µV) is the ERG b-wave amplitude generated in response to flash intensity I (cd·s/m2). The derived parameter Vmax (µV) is the asymptotic amplitude of the function, K (cd·s/m2) is the flash intensity that elicits a response that is ½ Vmax, and n is a dimensionless number representing the slope of the curve and generally considered to equal 1. An exception to the approximation of n as 1 occurs in disorders producing marked heterogeneity in retinal sensitivity, such as retinitis pigmentosa (RP). In these disorders, “n” can be much < 1, and thus, it is necessary to allow “n” to vary in order to achieve a good approximation to the data. Vmax has been interpreted as an index of both the number of rods responding and the gain (µV/quanta) for each b-wave generator. A reduction in Vmax can result from loss of photoreceptors, disruption of the dark current, inner retinal dysfunction or some other types of response compression. The parameter K has been interpreted as an index of retinal sensitivity that represents the efficiency of quantal capture. An increase in K would shift the entire function to the right, indicating that a stronger stimulus is required to elicit b-waves of comparable amplitude. Reductions in Vmax and increases in K may be seen individually, or more frequently, in combination in many retinal diseases. Figure 2 is an example of b-wave amplitude data recorded as a function of log flash intensity in a normal human observer.

An example of flash stimulus–response amplitude data for DA ERG b-waves recorded from a healthy subject to flashes of increasing strength (intensity, I)
Stimulus–response function parameters Vmax and K may be used to obtain additional information about the etiology or prognosis in a number of disorders. Such parameters have helped characterize fundamental differences between the mechanisms of rod dysfunction and degeneration in rod–cone dystrophy (RP) and cone–rod dystrophy [7]. Patients with RP typically show a loss in Vmax along with an increase in K, whereas patients with cone–rod dystrophy usually show normal values for these parameters. Exceptions include KCNV2 retinopathy (“cone dystrophy with supernormal rod ERG”), characterized by generalized cone system dysfunction, pathognomonic DA ERG changes and an abnormal ERG stimulus–response series [8, 9].
Figure 3 shows an illustrative example of a normal stimulus–response function compared with one from a case of venous stasis retinopathy (VSR). There is loss in Vmax in the affected eye of 0.13 log, but an increase in K of 0.92 log. The fellow eye also showed a large increase in K (0.61 log) with a normal Vmax, highlighting the possibility of subclinical involvement.

DA ERG b-wave stimulus–response functions in the affected and clinically normal eyes of a patient with venous stasis retinopathy (VSR), compared to an age-similar healthy subject
Stimulus–response functions also have been used to evaluate the timeline of retinal development and aging [10,11,12,13], and toxicity and efficacy in pharmaceutical studies [14,15,16,17,18]. They have been recorded in many degenerative retinal disorders [6, 7, 19,20,21,22,23,24,25,26,27], as well as in congenital stationary night blindness (CSNB), in which they reveal differences between the complete and incomplete forms [28]. The function has also been useful in other disorders such as age-related macular degeneration (AMD; [29]), altitude retinopathy [30], central retinal artery and vein occlusions [31,32,33,34,35,36] and diabetic retinopathy [37,38,39].
Patients who have an increase in log K will also have a delay in b-wave timing because peak times change with stimulus strength. ERG peak time measurements can be used to estimate retinal sensitivity loss and have been used to predict proliferative retinopathy in CRVO [31, 35, 36] and diabetic retinopathy [37, 39].
Patient population
Patients of all ages, able to tolerate ganzfeld stimulation, are referred for investigation of rod-mediated retinal function. Using this paradigm, patients with selective cone-mediated abnormalities will usually show minimal changes in the derived parameters produced by the curve fit to the data [7].
Technical issues
This protocol has the same requirements as those outlined under the basic technology section of the ISCEV ERG protocol [1]. Additional considerations are outlined below.
-
(a)
Range of flash strengths
To adequately characterize the stimulus–response series, flash stimuli must span a range that includes the dimmest flash required to generate a reliable DA ERG b-wave and that required to generate a maximal b-wave amplitude. This normally occurs over a flash range of 3.5 to 4 log units.
-
(b)
Inter-stimulus interval
The inter-stimulus interval should be sufficiently long to maintain the same level of dark adaptation throughout the procedure. The ISCEV ERG standard specifies an inter-stimulus interval of 2 s for DA 0.01 and 10 s for DA 3.0, but there are no specific recommendations for stimuli between these two stimulus strengths. It is recognized that the stimulus–response series will asymptote at stimuli well lower than DA 3.0 for most individuals.
-
(c)
Amplifier gain
Amplifier gain will need to be higher for the dim stimuli and should be increased until responses can be seen well enough to judge reliability.
-
(d)
Signal quality
Waveforms may be small or of long peak time and prone to noise or intrusion of blink and eye movement artifacts [40].
-
(e)
Fitting the series
Near the asymptote of the stimulus–response function, a second hyperbolic function can be seen in normal subjects (Fig. 4). By showing that this is observed in rod monochromats, Peachey et al. [41] suggested that the second limb did not result from an interaction between rod and cone systems but is more likely to represent interference between the processes responsible for the a- and b-waves, since b-wave amplitudes are measured from the trough of the a-wave to the peak of the b-wave.
Fig. 4 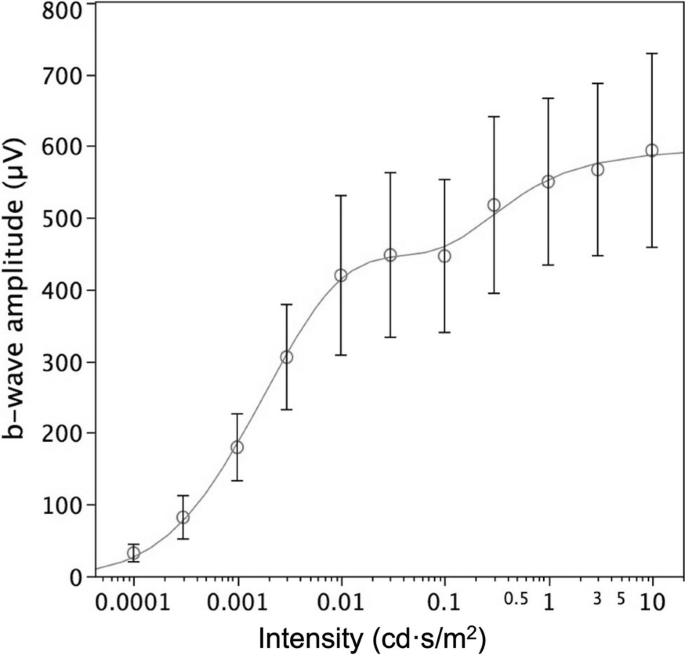
An example of flash stimulus–response amplitude data for DA ERG b-waves averaged from 85 healthy subjects to flashes of increasing strength (intensity). Circles are averages, error bars the 95% confidence limits, and the line a mathematical model that includes the second limb, seen in all normal subjects tested above flash strengths of approximately 0.1 cd·s/m2

The occurrence of a second limb may confound routine application of a single hyperbolic stimulus–response function and would result in a spuriously high Vmax and an elevated log K. The latter is illustrated in Fig. 5, which shows a single hyperbolic function fit to data obtained from one subject. When all of the data are included (dashed line), estimates of Vmax increased from 233 to 438 µV, and the corresponding log K estimates increased from − 1.89 to − 1.03, when compared to the parameters obtained from fitting just the first limb (solid line). Thus, in most patients, use of strong flashes will confound analysis unless the second limb is identified.

Figure reprinted with permission of Springer Nature (Documenta Ophthalmologica 85 [2] pp. 135–150). The care and fitting of Naka–Rushton functions to electroretinographic intensity–response data (Severns ML, Johnson, MA, Copyright 1993) [42]
Example of ERG b-wave stimulus–response data, fit by single Naka–Rushton equations to all of the data (dashed line) and to just the first limb (solid line).
A heuristic method for identifying and excluding the second limb has been described [42]. The optimal stimulus increment size for recognizing the second limb was 0.4 log unit up to about the point the b-wave begins to grow rapidly, and 0.2 log unit steps afterward. The smaller increment is necessary to recognize the occurrence of a second limb when it exists. The second limb can also be excluded manually, i.e., those data points that do not form a part of the single hyperbolic function can be omitted prior to curve fitting.
-
(f)
Nomenclature
In seminal studies and in most relevant publications, the light stimulus–response function is referred to as the ERG “intensity–response” function. The term “luminance–response” function has also been used. It is acknowledged that flashes should be described in terms of energy (luminous energy per unit solid angle per unit area) rather than intensity, but this and the widely used term “intensity–response” are retained in reference to historical data and to the parameter (I) used in the equation. The term “Naka–Rushton” equation is commonly used to describe the DA ERG b-wave amplitude stimulus–response function mathematically, but the eponym is difficult to justify based on the original studies that described a more basic equation (see above).
Calibration
All stimuli should be individually calibrated and rechecked over time following the current ISCEV standard and guidelines [1]. Nominal flash strengths or nominal increments in flash stimuli should not be used. Standard ERG stimuli may have a very short duration (10 µs for xenon bulbs), so a calibration device that can time-integrate flashes is required. Dim flashes from a xenon source generally vary more than flashes from a light-emitting diode (LED) and may require assessment of multiple flashes to measure mean flash intensity. LED sources can produce more reliable flash stimuli because their output is determined by the current applied to them. Most conventional ERG equipment that is manufactured currently uses LEDs, which produce more stable flash intensities.
Protocol specifications
This protocol follows the same procedures for patient preparation and recording that are outlined under the clinical protocol section of the ISCEV standard full-field ERG protocol [1]. Other specifications are listed below.
-
(a)
Flash strength
Flash stimuli should span a range of approximately 3.5 to 4.0 log units. In the absence of retinal dysfunction, the typical range would be approximately − 3.5 to 0.5 log cd·s/m2, starting with the lowest flash strength that will generate a reliable DA ERG b-wave up to that required to elicit a maximal b-wave. Initially, stimuli should be recorded in increasing steps of about 0.4 log units, until the b-wave amplitude begins to grow rapidly (near log K). Thereafter, step sizes should be reduced to 0.2–0.3 log units to enable detection of the second limb. Thus, at a minimum, about a dozen points are required to characterize the stimulus–response series in the absence of dysfunction.
-
(b)
Inter-stimulus interval.
To avoid light adaptation, this protocol specifies a time between flashes of 2 s for stimuli up to 0.01 cd·s/m2, 3 s for stimuli up to 0.1 cd·s/m2 and 5 s for stimuli up to 3 cd·s/m2. For most patients, the stimulus–response function will asymptote at values between 0.1 and 1.0 cd·s/m2.
-
(c)
Amplifier gain.
There is no specific requirement for amplifier gain except that it needs to be high enough to evaluate the waveform and may need to be increased for responses to dim stimuli.
-
(d)
Signal averaging.
Individual ERG waveforms should be assessed for repeatability, and inconsistent or artifactual waveforms should be eliminated before averaging. If signal averaging is needed, 3 to 10 sweeps are usually sufficient.
Response evaluation
The DA ERG b-wave amplitudes should be measured as described in the ISCEV ERG standard [1]. The b-wave amplitudes at different flash strengths should then be input into one of the many commercially or privately available computer programs that provide a fit to the data using a suitable mathematical stimulus–response function (as above). Many of these programs use the “Michaelis–Menten” equation for enzyme kinetics. (The “Michaelis–Menten” equation is the same as the “Naka–Rushton” equation except that the former sets “n” to 1.) The program used, in addition to fitting a curve to the data, should provide estimates of the maximum amplitude (Vmax) and the semi-saturation constant (K). The plot of b-wave amplitude versus flash strength should be visually examined for goodness of fit. If a second limb is present, the computer fit to the data should be adjusted either by omitting the points on the second limb and refitting the data, or by using a heuristic method that fits both limbs and eliminates the second [42]. As mentioned above, significant retinal heterogeneity will reduce “n,” and an equation that allows all the three parameters to vary may be necessary to obtain a good fit to the data.
Reporting
Use of the ISCEV extended stimulus–response protocol for the DA ERG b-wave should be acknowledged, and any departures from the ISCEV standard ERG methods or extended protocol should be stated. Any technical or compliance difficulties such as excessive eye movements or eye closure should be noted.
Parameters Vmax and log K should be reported, as well as normal ranges for fully dilated eyes. It is recognized that for some applications, a qualitative description of the stimulus–response series may be sufficient to corroborate or suggest a diagnosis. Eyes with smaller pupils will have an increasingly dimmer retinal illuminance (measured in Trolands), which will affect the value of log K. For this reason, pupil size should always be measured. Compensation for light attenuation from small pupils is possible using Table 1, and any correction to log K should be stated.
References
McCulloch DL, Marmor MF, Brigell MG, Hamilton R, Holder GE, Tzekov R et al (2015) ISCEV Standard for full-field clinical electroretinography (2015 update). Doc Ophthalmol Adv Ophthalmol 130(1):1–12
Heckenlively JR, Arden GB (eds) (1991) Principles and practice of clinical electrophysiology of vision, 1st edn. Mosby Year Book, St. Louis
Naka KI, Rushton WA (1966) S-potentials from luminosity units in the retina of fish (Cyprinidae). J Physiol 185(3):587–599
Fulton AB, Rushton WA (1978) The human rod ERG: correlation with psychophysical responses in light and dark adaptation. Vis Res 18(7):793–800
Massof RW, Johnson MA (1981) Prereceptor light absorption in setters with neuronal ceroid lipofuscinosis. Investig Ophthalmol Vis Sci 20(1):134–136
Massof RW, Wu L, Finkelstein D, Perry C, Starr SJ, Johnson MA (1984) Properties of electroretinographic intensity-response functions in retinitis pigmentosa. Doc Ophthalmol Adv Ophthalmol 57(3):279–296
Birch DG, Fish GE (1987) Rod ERGs in retinitis pigmentosa and cone-rod degeneration. Investig Ophthalmol Vis Sci 28(1):140–150
Robson AG, Webster AR, Michaelides M, Downes SM, Cowing JA, Hunt DM et al (2010) “Cone dystrophy with supernormal rod electroretinogram”: a comprehensive genotype/phenotype study including fundus autofluorescence and extensive electrophysiology. Retina (Philadelphia, PA) 30(1):51–62
Zobor D, Kohl S, Wissinger B, Zrenner E, Jagle H (2012) Rod and cone function in patients with KCNV2 retinopathy. PLoS ONE 7(10):e46762
Aylward GWJB, Billson FA (1990) Normal variation and the effect of age on the parametric analysis of the intensity-response series of the scotopic electroretinogram, including the scotopic threshold response. Clin Vis Sci 5:353–362
Hamilton R, Bradnam MS, Dudgeon J, Mactier H (2008) Maturation of rod function in preterm infants with and without retinopathy of prematurity. J Pediatr 153(5):605–611
Mets MB, Smith VC, Pokorny J, Pass A (1995) Postnatal retinal development as measured by the electroretinogram in premature infants. Doc Ophthalmol Adv Ophthalmol 90(2):111–127
Birch DG, Anderson JL (1992) Standardized full-field electroretinography. Normal values and their variation with age. Arch Ophthalmol (Chicago, Ill: 1960) 110(11):1571–1576
Gabrieli CB, Regine F, Vingolo EM, Rispoli E, Fabbri A, Isidori A (2001) Subjective visual halos after sildenafil (Viagra) administration: electroretinographic evaluation. Ophthalmology 108(5):877–881
Balacco Gabrieli C, Regine F, Vingolo EM, Rispoli E, Isidori A (2003) Acute electroretinographic changes during sildenafil (Viagra) treatment for erectile dysfunction. Doc Ophthalmol Adv Ophthalmol 107(2):111–114
Stahl A, Feltgen N, Fuchs A, Bach M (2009) Electrophysiological evaluation of retinal photoreceptor function after repeated bevacizumab injections. Doc Ophthalmol Adv Ophthalmol 118(2):81–88
Ziemssen F, Luke M, Messias A, Beutel J, Tatar O, Zrenner E et al (2008) Safety monitoring in bevacizumab (Avastin) treatment: retinal function assessed by psychophysical (visual fields, colour vision) and electrophysiological (ERG/EOG) tests in two subgroups of patients. Int Ophthalmol 28(2):101–109
Varghese SB, Reid JC, Hartmann EE, Keyser KT (2011) The effects of nicotine on the human electroretinogram. Investig Ophthalmol Vis Sci 52(13):9445–9451
Birch DG, Fish GE (1986) Rod ERGs in children with hereditary retinal degeneration. J Pediatr Ophthalmol Strabismus 23(5):227–232
Yagasaki K, Miyake Y, Litao RE, Ichikawa K (1986) Two cases of retinal degeneration with an unusual form of electroretinogram. Doc Ophthalmol Adv Ophthalmol 63(1):73–82
Birch DG (1987) Diurnal rhythm in the human rod ERG: retinitis pigmentosa. Investig Ophthalmol Vis Sci 28(12):2042–2048
Birch DG, Herman WK, deFaller JM, Disbrow DT, Birch EE (1987) The relationship between rod perimetric thresholds and full-field rod ERGs in retinitis pigmentosa. Investig Ophthalmol Vis Sci 28(6):954–965
Peachey NS, Fishman GA, Derlacki DJ, Alexander KR (1988) Rod and cone dysfunction in carriers of X-linked retinitis pigmentosa. Ophthalmology 95(5):677–685
Sandberg MA, Miller S, Berson EL (1990) Rod electroretinograms in an elevated cyclic guanosine monophosphate-type human retinal degeneration. Comparison with retinitis pigmentosa. Investig Ophthalmol Vis Sci 31(11):2283–2287
Shady S, Hood DC, Birch DG (1995) Rod phototransduction in retinitis pigmentosa. Distinguishing alternative mechanisms of degeneration. Investig Ophthalmol Vis Sci 36(6):1027–1037
Rosenfeld PJ, Hahn LB, Sandberg MA, Dryja TP, Berson EL (1995) Low incidence of retinitis pigmentosa among heterozygous carriers of a specific rhodopsin splice site mutation. Investig Ophthalmol Vis Sci 36(11):2186–2192
Hood DC, Shady S, Birch DG (1994) Understanding changes in the b-wave of the ERG caused by heterogeneous receptor damage. Investig Ophthalmol Vis Sci 35(5):2477–2488
Raghuram A, Hansen RM, Moskowitz A, Fulton AB (2013) Photoreceptor and postreceptor responses in congenital stationary night blindness. Investig Ophthalmol Vis Sci 54(7):4648–4658
Sunness JS, Massof RW, Johnson MA, Finkelstein D, Fine SL (1985) Peripheral retinal function in age-related macular degeneration. Arch Ophthalmol (Chicago, Ill: 1960) 103(6):811–816
Schatz A, Willmann G, Fischer MD, Schommer K, Messias A, Zrenner E et al (2013) Electroretinographic assessment of retinal function at high altitude. J Appl Physiol (Bethesda, MD: 1985) 115(3):365–372
Johnson MA, Hood DC (1996) Rod photoreceptor transduction is affected in central retinal vein occlusion associated with iris neovascularization. J Opt Soc Am A Opt Image Sci Vis 13(3):572–576
Sverak J, Peregrin J, Kralove H (1968) Electroretinographic intensity–response curves in central retinal. Arch Ophthalmol (Chicago, Ill: 1960) 79(5):526–530
Breton ME, Quinn GE, Keene SS, Dahmen JC, Brucker AJ (1989) Electroretinogram parameters at presentation as predictors of rubeosis in central retinal vein occlusion patients. Ophthalmology 96(9):1343–1352
Breton ME, Montzka DP, Brucker AJ, Quinn GE (1991) Electroretinogram interpretation in central retinal vein occlusion. Ophthalmology 98(12):1837–1844
Johnson MA, McPhee TJ (1993) Electroretinographic findings in iris neovascularization due to acute central retinal vein occlusion. Arch Ophthalmol (Chicago, Ill: 1960) 111(6):806–814
Johnson MA, Marcus S, Elman MJ, McPhee TJ (1988) Neovascularization in central retinal vein occlusion: electroretinographic findings. Arch Ophthalmol (Chicago, Ill: 1960) 106(3):348–352
Holopigian K, Greenstein VC, Seiple W, Hood DC, Carr RE (1997) Evidence for photoreceptor changes in patients with diabetic retinopathy. Investig Ophthalmol Vis Sci 38(11):2355–2365
Chung NH, Kim SH, Kwak MS (1993) The electroretinogram sensitivity in patients with diabetes. Korean J Ophthalmol KJO 7(2):43–47
Roecker EB, Pulos E, Bresnick GH, Severns M (1992) Characterization of the electroretinographic scotopic B-wave amplitude in diabetic and normal subjects. Investig Ophthalmol Vis Sci 33(5):1575–1583
Johnson MA, Massof RW (1982) The photomyoclonic reflex: an artefact in the clinical electroretinogram. Br J Ophthalmol 66(6):368–378
Peachey NS, Alexander KR, Fishman GA (1989) The luminance-response function of the dark-adapted human electroretinogram. Vis Res 29(3):263–270
Severns ML, Johnson MA (1993) The care and fitting of Naka–Rushton functions to electroretinographic intensity-response data. Doc Ophthalmol Adv Ophthalmol 85(2):135–150
Sverak J, Peregrin J, Hejcmanova D, Erben J (1984) Long-term observation of retinal electrical activity in dialyzed and renal transplantation patients. Artif Organs 8(3):355–358
Wu LZ, Massof RW, Starr SJ (1985) Electroretinographic intensity-response function in retinal disease. Chin Med J 98(4):250–256
Weleber RG, Denman ST, Hanifin JM, Cunningham WJ (1986) Abnormal retinal function associated with isotretinoin therapy for acne. Arch Ophthalmol (Chicago, Ill: 1960) 104(6):831–837
Wack MA, Peachey NS, Fishman GA (1989) Electroretinographic findings in human oculocutaneous albinism. Ophthalmology 96(12):1778–1785
Birch DG, Anderson JL (1990) Rod visual fields in cone-rod degeneration. Comparisons to retinitis pigmentosa. Investig Ophthalmol Vis Sci 31(11):2288–2299
Peachey NS, Gagliano DA, Jacobson MS, Derlacki DJ, Fishman GA, Cohen SB (1990) Correlation of electroretinographic findings and peripheral retinal nonperfusion in patients with sickle cell retinopathy. Arch Ophthalmol (Chicago, Ill: 1960) 108(8):1106–1109
Wali N, Leguire LE (1991) Dark-adapted luminance-response functions with skin and corneal electrodes. Doc Ophthalmol Adv Ophthalmol 76(4):367–375
Hood DC, Birch DG (1992) A computational model of the amplitude and implicit time of the b-wave of the human ERG. Vis Neurosci 8(2):107–126
Wali N, Leguire LE (1992) Fundus pigmentation and the dark-adapted electroretinogram. Doc Ophthalmol Adv Ophthalmol 80(1):1–11
Gagne AM, Gagne P, Hebert M (2007) Impact of light therapy on rod and cone functions in healthy subjects. Psychiatry Res 151(3):259–263
Bradshaw K, Hansen R, Fulton A (2004) Comparison of ERGs recorded with skin and corneal-contact electrodes in normal children and adults. Doc Ophthalmol Adv Ophthalmol 109(1):43–55
Holopigian K, Greenstein VC, Seiple W, Hood DC, Carr RE (2004) Rod and cone photoreceptor function in patients with cone dystrophy. Investig Ophthalmol Vis Sci 45(1):275–281
Rufiange M, Dumont M, Lachapelle P (2002) Correlating retinal function with melatonin secretion in subjects with an early or late circadian phase. Investig Ophthalmol Vis Sci 43(7):2491–2499
Hebert M, Dumont M, Lachapelle P (2002) Electrophysiological evidence suggesting a seasonal modulation of retinal sensitivity in subsyndromal winter depression. J Affect Disord 68(2–3):191–202
Gagne AM, Lavoie J, Lavoie MP, Sasseville A, Charron MC, Hebert M (2010) Assessing the impact of non-dilating the eye on full-field electroretinogram and standard flash response. Doc Ophthalmol Adv Ophthalmol 121(3):167–175
Lavoie J, Gagne AM, Lavoie MP, Sasseville A, Charron MC, Hebert M (2010) Circadian variation in the electroretinogram and the presence of central melatonin. Doc Ophthalmol Adv Ophthalmol 120(3):265–272
Lavoie MP, Lam RW, Bouchard G, Sasseville A, Charron MC, Gagne AM et al (2009) Evidence of a biological effect of light therapy on the retina of patients with seasonal affective disorder. Biol Psychiat 66(3):253–258
Schatz A, Breithaupt M, Hudemann J, Niess A, Messias A, Zrenner E et al (2014) Electroretinographic assessment of retinal function during acute exposure to normobaric hypoxia. Graefe’s Arch Clin Exp Ophthalmol 252(1):43–50
Velten IM, Horn FK, Korth M, Velten K (2001) The b-wave of the dark adapted flash electroretinogram in patients with advanced asymmetrical glaucoma and normal subjects. Br J Ophthalmol 85(4):403–409
Hebert M, Lachapelle P, Dumont M (1995) Reproducibility of electroretinograms recorded with DTL electrodes. Doc Ophthalmol Adv Ophthalmol 91(4):333–342
Evans LS, Peachey NS, Marchese AL (1993) Comparison of three methods of estimating the parameters of the Naka–Rushton equation. Doc Ophthalmol Adv Ophthalmol 84(1):19–30
Anastasi M, Brai M, Lauricella M, Geracitano R (1993) Methodological aspects of the application of the Naka–Rushton equation to clinical electroretinogram. Ophthalmic Res 25(3):145–156
Conflict of interest
None of the authors has a conflict of interest with the information presented in this manuscript.
Author information
Authors and Affiliations
Corresponding author
Additional information
Publisher's Note
Springer Nature remains neutral with regard to jurisdictional claims in published maps and institutional affiliations.
Appendix: Justification for the protocol details
Appendix: Justification for the protocol details
A literature review was performed using the Medline search engine, for human studies that used the words ERG and intensity–response or Naka–Rushton or Michaelis–Menten or luminance–response. Studies dealing with the photopic hill, photopic negative responses (PhNRs), wavelets and multifocal ERGs were excluded. Table 2 shows the results of this search.
Of the 57 studies evaluated (Table 2), 60% used a flash intensity range of 3.5 to 4.5 log units (range 2.5–7.5). Forty-seven percent used a flash step size of either 0.2 or 0.25 log, but there was a spread of data, as shown in Fig. 6. The larger step sizes could easily misidentify a second limb unless weaker flashes were used. Most studies used the “Naka–Rushton” function to analyze the data.

Flash strength step sizes (increments) used for collection of ERG “intensity–response” data
Rights and permissions
Open Access This article is distributed under the terms of the Creative Commons Attribution 4.0 International License (http://creativecommons.org/licenses/by/4.0/), which permits unrestricted use, distribution, and reproduction in any medium, provided you give appropriate credit to the original author(s) and the source, provide a link to the Creative Commons license, and indicate if changes were made.
About this article

Cite this article
Johnson, M.A., Jeffrey, B.G., Messias, A.M.V. et al. ISCEV extended protocol for the stimulus–response series for the dark-adapted full-field ERG b-wave. Doc Ophthalmol 138, 217–227 (2019). https://doi.org/10.1007/s10633-019-09687-6
Received:
Accepted:
Published:
Issue Date:
DOI: https://doi.org/10.1007/s10633-019-09687-6