
Abstract
Habitat change and fragmentation are the primary causes of biodiversity loss worldwide. Recent decades have seen a surge of funding, published papers and citations in the field as these threats to biodiversity continue to rise. However, how research directions and agenda are evolving in this field remains poorly understood. In this study, we examined the current state of research on habitat fragmentation (due to agriculture, logging, fragmentation, urbanisation and roads) pertaining to two of the most threatened vertebrate groups, reptiles and amphibians. We did so by conducting a global scale review of geographical and taxonomical trends on the habitat fragmentation types, associated sampling methods and response variables. Our analyses revealed a number of biases with existing research efforts being focused on three continents (e.g., North America, Europe and Australia) and a surplus of studies measuring species richness and abundance. However, we saw a shift in research agenda towards studies utilising technological advancements including genetic and spatial data analyses. Our findings suggest important associations between sampling methods and prevalent response variables but not with the types of habitat fragmentation. These research agendas are found homogeneously distributed across all continents. Increased research investment with appropriate sampling techniques is crucial in biodiversity hotpots such as the tropics where unprecedented threats to herpetofauna exist.
Introduction
Habitat loss and fragmentation are the predominant causes underlying widespread biodiversity changes in terrestrial ecosystems (Fahrig 2003; Newbold et al. 2015). These processes may cause population declines by disrupting processes such as dispersal, gene flow, and survival. Over the past 30 years habitat loss and fragmentation have been suggested to have reduced biodiversity by up to 75% in different biomes around the world (Haddad et al. 2015). This is mainly due to the clearing of tropical forests, the expansion of agricultural landscapes, the intensification of farmland production, and the expansion of urban areas (FAO and UNEP 2020). The rate of deforestation and corresponding land conversions of natural habitats are happening rapidly and will continue to increase in the future at an accelerated rate, particularly in biodiversity hotspots (Deikumah et al. 2014; Habel et al. 2019; FAO and UNEP 2020).
For this reason, habitat fragmentation has been a central research focus for ecologists and conservationists over the past two decades (Fardila et al. 2017). However, habitat fragmentation consists of two different processes: loss of habitat and fragmentation of existing habitat (Fahrig 2003). The former simply means the removal of habitat, and latter is the transformation of continuous areas into discontinuous patches of a given habitat. In a radical review, Fahrig (2003) suggested that fragmentation per se, i.e., the breaking up of habitat after controlling for habitat loss, has a weaker or even no effect on biodiversity compared to habitat loss. She further recommended that the effects of these two components should be measured independently (Fahrig 2017). Despite being recognised as two different processes, researchers tend not to distinguish between their effects and commonly lump the combined consequences under a single umbrella term “habitat fragmentation” (Fahrig 2003, 2017; Lindenmayer and Fischer 2007; Riva and Fahrig 2022). Nonetheless, fragmentation has been widely recognised in the literature and describes changes that occur in landscapes, including the loss of habitat (Hadley and Betts 2016). Hence, to avoid imprecise or inconsistent use of terminology and provide a holistic view of the effect of modified landscapes, we suggest the term “habitat fragmentation” to indicate any type of landscape change, both habitat loss and fragmentation throughout the current paper.
One main conundrum is that biodiversity decline does not occur homogeneously everywhere nor among all species (Blowes et al. 2019). Moreover, we should expect a global disparity in biodiversity responses to habitat fragmentation across different biomes (Newbold et al. 2020; Cordier et al. 2021). For example, tropical regions are predicted to have higher negative effects of habitat fragmentation than temperate regions. There are two possible reasons: a) higher intensification of land use change in the tropics (Barlow et al. 2018), and b) forest animals in the tropics are less likely to cross open areas (Lindell et al. 2007). Furthermore, individual species respond to landscape modification differently; some thrive whereas others decline (Fahrig 2003). Habitat specialists with broader habitat tolerance and wide-ranging distributions are most likely to benefit from increase landscape heterogeneity and more open and edge habitat (Hamer and McDonnell 2008; Newbold et al. 2014; Palmeirim et al. 2017). Therefore, appropriate response metrics should be used in measuring the effect of habitat fragmentation on biodiversity depending on the taxa group, biome and scale of study as patterns of richness can sometimes be masked by the abundance of generalist species (Riemann et al. 2015; Palmeirim et al. 2017).
Previous reviews have identified general patterns and responses of reptile and amphibian populations to habitat modification. They have been largely centred around specific types of habitat fragmentation: land use change (Newbold et al. 2020), logging (Sodhi et al. 2004), fragmentation per se (Fahrig 2017), urbanisation (Hamer and McDonnell 2008; McDonald et al. 2013), fire (Driscoll et al. 2021), and roads (Rytwinski and Fahrig 2012). Few reviews have, however, attempted a global synthesis of all types of land use changes and even fewer have addressed biases in geographical regions and taxonomical groups (but see Gardner et al. (2007) and Cordier et al. (2021)). Gardner et al. (2007) synthesised the extant literature and focused on 112 papers on the consequences of habitat fragmentation on reptiles and amphibians published between 1945 and 2006. They found substantial biases across geographic regions, biomes, types of data collected as well as sampling design and effort. However, failure to report basic statistics by many studies prevented them from performing meta-analyses on research conclusions. More recently, a review by Cordier et al. (2021) conducted a meta-analysis based on 94 primary studies on the overall effects of land use changes through time and across the globe. Yet, there has been no comprehensive synthesis on the research patterns and agenda of published literature on habitat fragmentation associated with the recent advances of novel research tools and techniques. Therefore, our review may provide new insights of the evolution and biases in the field over the last decades and provide a basis for future research directions. Knowledge gaps caused by these biases could hamper the development of habitat fragmentation research and the implementation of effective strategies for conservation.
We aim to remedy this by examining research patterns for the two vertebrate classes Amphibia and Reptilia, at a global scale. We chose amphibians and reptiles for several reasons. First, habitat fragmentation research has been dominated by birds and mammals (Fardila et al. 2017). Reptiles and amphibians, on the other hand, are under-represented; together, they constitute only 10% of the studies (Fardila et al. 2017). Second, high proportions of amphibian and reptile species are threatened globally. To date, more than one third of amphibian (40%) and one in five reptile species (21%) are threatened with extinction (Stuart et al. 2004; Cox et al. 2022). Amphibians are known to be susceptible to land transformation as a result of their cryptic nature, habitat requirements, and reduced dispersal ability (Green 2003; Sodhi et al. 2008; Ofori‐Boateng et al. 2013; Nowakowski et al. 2017). Although poorly studied (with one in five species classified as data deficient) (Böhm et al. 2013), reptiles face the same threats as those impacting amphibians (Gibbons et al. 2000; Todd et al. 2010; Cox et al. 2022). Reptiles have small distributional ranges with high endemism compared to other vertebrates and as such are likely vulnerable to habitat fragmentation (Todd et al. 2010; Meiri et al. 2018). Third, both these groups are poikilotherms whose physiology makes them highly dependent on temperature and precipitation levels. Hence, they are very sensitive to changing thermal landscapes (Nowakowski et al. 2017).
Here, we first ask how is the published literature distributed across geographic regions and taxa? Is there a bias in the geographic distribution of species studied compared to known species? It is well known that conservation and research efforts are often concentrated in wealthy and English-speaking countries (Fazey et al. 2005), but has this bias improved over the years? Second, how are researchers conducting these studies? We assess whether certain sampling methods and response variables are associated to specific types of habitat fragmentation. Over the past decades new tools and techniques are constantly being discovered or developed. Combinations of methodologies are now shedding new light on biodiversity responses and consequences of habitat fragmentation. In particular, genetic techniques are useful in detecting changes in population structure, identifying isolated genetic clusters, and in estimating dispersal (Smith et al. 2016). Similarly, habitat occupancy and modelling can also provide powerful insights into dispersal (Driscoll et al. 2014). Remote sensing data are now used in analysing effects of area, edge, and isolation (Ray et al. 2002). Finally, how are these associations or research agendas distributed across space? We expect to find geographic structure of emerging agendas across the globe. For instance, we predict genetic studies to be located in North America and Europe but also in East Asian countries such as China and Japan as a result of their advancement in genetics (Forero et al. 2016). On the other hand, simple biodiversity response indicators which do not require extensive capacity building and application of advanced technologies are likely more used in developing regions of the world (Barber et al. 2014). These findings are valuable to evaluate and update the global status of our research on the effects of habitat fragmentation on herpetofauna and to suggest recommendations for conservation plans.
Materials and methods
Data collection
We conducted the review according to the Preferred Reporting Items for Systematic Reviews and Meta-Analyses (PRISMA) guidelines (Fig. 1) (Moher et al. 2009). We conducted a comprehensive and exhaustive search using Web of Science to review published studies reporting the consequences of habitat fragmentation on amphibians and reptiles. We consulted the database in November 2019 by using two general search strings: (1) Habitat fragmentation AND (frog* OR amphib* OR salamander* OR tadpole*) (2) Habitat fragmentation AND (reptil* OR snake* OR lizard* OR turtle* OR crocodile*). This returned a total of 869 records from search (1) and 795 from search (2), with 1421 unique records remaining after duplicates were removed. We did not include “habitat loss” in our search term as it would only introduce unrelated articles focusing on biodiversity and conservation management instead of methodology and mechanistic approaches.
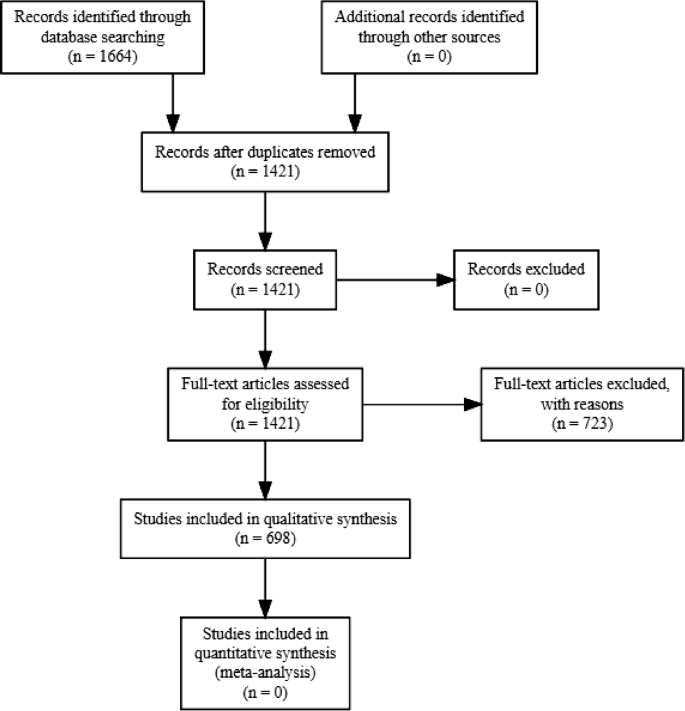
PRISMA flow-diagram of the study selection process
Throughout, we use the term papers to refer to individual journal article records. Out of the 1421 papers, we were unfortunately not able to locate seven papers from Acta Oecologica, Zoology: Analysis of Complex Systems, Israel Journal of Ecology and Evolution, Western North American Naturalist, Natural Areas Journal, Ecology, and the Herpetological Journal. We screened all articles from the title through the full text to determine whether they met our criteria for inclusion. To be included, studies needed to fulfil several criteria. First, papers needed to be peer-reviewed journal articles containing data collected on reptiles and/or amphibians at the species level (224 articles rejected because no species-specific data was available). Reviews and metastudies (n = 102) were excluded from the data analysis as they may represent duplicates as they are mainly based on data sets from other papers, but these form an integral part of our discussion. Furthermore, papers which do not provide data on contemporary time scales such as long-term (> 10, 000 years ago) changes on the paleo-spatial patterns (n = 59) were excluded. Because the effects of fragmentation per se have been measured inconsistently by many authors and have not been differentiated from habitat removal (Fahrig 2003), we consider any recent anthropogenic habitat degradation, and modification at patch or/and landscape scales during the Holocene as an effect of habitat fragmentation. Only papers which examined direct or indirect effects of habitat fragmentation were included in our analysis, regardless of the magnitude and direction. Papers which did not mention specific types of habitat fragmentation as the focus of their study (n = 338) were excluded.
Geographical and taxonomical distribution
Using the selected papers, we compiled a taxonomic and geographical database for each paper: (a) GPS or georeferenced location of the study site; (b) the focal group investigated (amphibian and/or reptile); (c) taxonomic groups (order, family, genus).
We listed the overall number of species studied covered by selected papers in each continent and compared them to the total number of currently described species. We obtained total described species of both reptiles and amphibians from the following sources: ReptileDatabase (Uetz et al. 2021) and AmphibiaWeb (AmphibiaWeb 2021). Then, we calculated the proportions of species covered by the selected papers compared to total number of described species for each continent. We did not update species nomenclature from selected papers as the mismatches from these potentially outdated taxonomies would be insignificant in our analyses.
Categorisation of papers
Each paper is classified into three main types of data collected: forms of habitat fragmentation, sampling methods, and response variables (Online Appendix 1). A paper can be classified into one or multiple categories in each type of data. The types of data and their following categories were:
Forms of habitat fragmentation
We recorded different types of habitat fragmentation from the selection of studies: (1) “Fragmentation” (includes patch isolation, edge and area effects); (2) “Agriculture” (includes any form of commercial and subsistence farming such as monocultures, plantations, and livestock farming); (3) “Logging” (e.g., agroforestry and silviculture); (4) “Mining” (presence of mining activities); (5) “Urbanisation” (includes presence of cities, towns or villages and parks created for recreational purposes); (6) “Road” (includes any vehicle roadway such as railways and highways) and (7) “Other types of habitat fragmentation” (e.g., fire, river dams, ditches, diseases, desertification etc.). Many studies deal with more than one type of habitat fragmentation. However, we made sure the selection for fragmentation forms is mainly based on the focus and wordings in the methodology section.
Sampling methods
We report trends in the design and sampling methods among the compiled studies over the last three decades. Due to the substantial variability in the level of sample design information reported by different studies, we narrowed them down into six general categories representing common sampling methods. Common methods used in estimating herpetofauna diversity (e.g., visual transect surveys, acoustic monitoring and trapping methods) were not included in the analyses due to their omnipresence in the data. The categories are:
(1) “Genetics” studies documented any use of codominant markers (i.e., allozymes and microsatellites), dominant markers [i.e., DNA sequences, random amplified polymorphic DNA (RAPDs) and amplified fragment length polymorphism (AFLPs)] to analyse genetic variability and gene diversity respectively. (2) “Direct tracking methods” studies measured potential dispersal distances or species movement patterns by means of radio telemetry, mark-recapture methods, or fluorescent powder tracking. (3) “Aerial photographs” studies reported the use of aerial photographs while (4) “GIS/Satellite image” studies described the use of satellite imagery and land cover data (i.e., Landsat) and GIS programs (e.g., QGIS and ArcGIS, etc.) in analysing spatial variables. (5) “Experimental” studies involved predictions tested through empirical studies, regardless if they occur naturally or artificially; in a natural or a captive environment. (6) “Prediction/simulation models” studies made use of techniques such as ecological niche models, habitat suitability (i.e., occurrence and occupancy models) and simulations for probability of survival and population connectivity.
Response variables
To further conceptualise how the effects of habitat fragmentation are measured, we assigned 12 biodiversity or ecological response variables. We recorded the type of data that was used in all selected studies: (1) “Species richness or diversity” which are measures of species richness, evenness or diversity (such as the Shannon–Wiener index) (Colwell 2009); (2) “Functional richness or species guilds” describes diversity indices based on functional traits (such as body size, reproductive modes, microhabitat association or taxonomic groups); (3) “Presence/absence” or species occupancy; (4) “Population” includes an estimation of population size or density (only when measured specifically in the paper). It includes genetic variation and divergence within and between populations; (5) “Abundance” or counts of individuals for comparison between habitat fragmentation type or species; (6) “Dispersal” takes into account any displacement or movement and can include indirect measurements of dispersal using genetic techniques; (7) “Breeding sites” which measures available breeding or reproduction sites; (8) “Fitness measure” are records of any physiological, ecological or behavioural changes; (9) “Interspecific interaction” depicts any interaction between species including competition and predation; (10) “Extinction or colonisation rate” counts the number of population extinctions or colonisations within a time period; (11) “Microhabitat preference” includes any direct observation made on an individual’s surrounding environmental features (substrate type, perch height, vegetation type, distance to cover etc.); (12) “Generalist or specialist comparison” involves any comparison made between generalist and specialist species. Generalists are able to thrive in various environments whereas specialists occupy a much narrower niche; (13) “Other response variables” can include road kill mortality counts, infection rate of diseases, injury, or any effect from introduced animals and a variety of other responses.
Data analysis
All statistical analyses were conducted in the open source statistical software package R 4.1.0 (R Core Team 2021). To gain a broad insight into our understanding of the complexity of habitat fragmentation we applied a Multiple Correspondence Analysis (MCA) (Roux and Rouanet 2004) and Hierarchical Clustering on Principle Components (HCPC) (Ward 1963) to investigate potential interactions between forms of habitat fragmentation, sampling methods and response variables. MCA is ideal for investigation of datasets with multiple categorical variables and exploration of unbiased relationships between these variables.
We first separate the dataset into papers concerning amphibians or reptiles. The MCA was performed using the MCA function from FactoMineR package of R version 3.1 (Lê et al. 2008). To identify subgroups (cluster) of similar papers within our dataset, we performed cluster analysis on our MCA results using HCPC. The cluster results are then visualised in factor map and dendrogram for easier interpretation using factoextra package. This allows us to identify categorical variables which have the highest effect within each cluster. Statistical analyses were considered significant at α = 0.05, while a p between 0.10 and 0.05 was considered as a tendency. The p-value is less than 5% when one category is significantly linked to other categories. The V tests show whether the category is over-expressed (positive values) or under-expressed (negative values) in the cluster (Lebart et al. 1995).
Results from the literature review were also analysed with VOSviewer, freeware for constructing and visualising bibliometric networks (http://www.vosviewer.com/). The program uses clustering techniques to analyse co-authors, co-occurrence of keywords, citations, or co-citations (van Eck and Waltman 2014). First, we analyse co-authorships of countries to provide a geographical representation of groups of authors in various countries over the past 30 years. Each circle represents an author’s country and the size represents the collaboration frequency with other countries. The lines between the nodes represent the collaboration networks between the countries while the thickness of the lines indicates the collaboration intensities between them. Lastly, to complement the MCA and HCPC, we used VOSviewer to analyse a clustering solution of categories at an aggregate level. Aggregate clustering is a meta-clustering method to improve the robustness of clustering and does not require a priori information about the number of clusters. In this case, instead of author’s keywords, we used the co-occurrence of categories associated to each selected paper as input to run the software.
Results
Geographical and taxonomical distribution
We identified a total of 698 papers published between January 1991 and November 2019 reporting consequences of habitat fragmentations corresponding to our selection criteria (Fig. 1). The complete list of studies included (hereafter termed “selected papers”) is available in Online Appendix 2. The distribution of these selected papers between focal groups and among continents was non-homogeneous (Fig. 2). Selected papers reviewed were predominantly studies which were conducted in North America 310 (44%) and Europe 131 (19%), but also from Oceania 104 (15%), South America 85 (12%), Asia 37 (5%) and Africa 31 (5%). For co-authorships between countries based on VOSviewer, the minimum document number of a country was set as 5 and a total of 21 and 14 countries met the threshold for amphibians and reptiles respectively (Fig. 3). For amphibians, countries in the American continent such as United States of America or USA (178 articles), Brazil (38 articles) and Canada (35 articles) have the largest research weight (Fig. 3a). Authors from the USA have the largest international cooperation network, followed by Brazil. Australia and other European countries such as Germany, France and England also have high collaboration relationships with other countries. In contrast, reptile studies were mainly concentrated around two countries: the USA (139 articles) and Australia (86 articles) (Fig. 3b). No other country from the rest of the world has more than 20 articles. While both the USA and Australia have the largest collaboration networks, Canada, Spain and Mexico are also highly cooperative with authors from other countries.

Map of study locations for a amphibians and b reptiles with each circle representing the study location of papers included in the review. The colour scale of the continents ranging from 0 – 0.9 indicates the proportions of amphibian and reptile species represented in the reviewed papers when compared to known species in the world (obtained from AmphibiaWeb and ReptileDatabase): a Europe (0.73), Africa (0.23), North America (0.23), South America (0.18), Oceania (0.07) and Asia (0.06) and b Europe (0.27), Oceania (0.18), Africa (0.12), North America (0.11), South America (0.09) and Asia (0.02)

Co-authorship map of countries involved in habitat fragmentation research in a amphibians and b reptiles. The colours represent the continents countries belong to. Each circle represents an author’s country and the size represents the collaboration frequency with other countries. The lines between the nodes represent the collaboration networks between the countries while the thickness of the lines indicates the collaboration intensities between them. Category co-occurrence network maps for c amphibians and d reptiles. The colour represents the different cluster groups each category belongs to. Abbreviations for the categories in forms of habitat change: fragmentation (FGM), agriculture (AGR), Logging (LOG), Mining (MIN), Urbanisation (URB), road (RD), other habitat fragmentation (OHC); sampling methods: genetics (GEN), direct tracking method (DTM), aerial photographs (APT), GIS/ Satellite images (GIS), experimental (EXP), prediction/ simulation models (PSM) and response variables: species richness/ diversity (SPR), functional richness/ species guild (FCR), presence/ absence (PAS), population (POP), abundance (ABD), dispersal (DSP), breeding sites (BRD), fitness measure (FIT), interspecific interaction (INT),extinction/ colonisation rate (ECR), microhabitat preference (MHP), comparison between generalist and specialist (CGS), other response varialbes (ORV) (see also Online Appendix 1). Maps are created in VOSviewer
Overall, over half of all selected papers included only amphibians (376 papers; 54%), whilst 276 papers (39%) included only reptiles and 46 papers (7%) assessed both reptiles and amphibians. In relation to species richness, we identified 1490 amphibian species and 1199 reptile species across all papers; among which 141 taxa were not identified to species level but were still included in our analyses as taxonomic units analogous to species (Online Appendix 2). Among these species, more than half of the studied amphibians were found in South America (537; 38%) and North America (328; 23%), followed by Africa (297; 21%), Asia (137; 10%), Europe (77; 5%), and Oceania (51; 3%). Half of the reptile species studied were from North America (302; 25%) and Africa (278; 23%), with the other half consisting of species from Oceania (276; 23%), South America (200; 17%), Europe (76; 6%), and Asia (67; 6%).
When compared to the known species richness in the world, large portions of European species are studied while species from other continents were severely under-represented (Fig. 2). The proportions of amphibian species represented in papers were the highest in Europe (73%), while the proportions are much lower for Africa (23%), North America (23%), South America (18%), Oceania (7%) and Asia (6%) (Fig. 2a). Among reptiles, Europe represents again the highest proportion of studied species (27%), followed by Oceania (18%), Africa (12%), North America (11%) and South America (8.9%) (Fig. 2b). In contrast, of all Asian reptile species, only a mere 1.73% were included in the selected papers. The species coverage in our selected papers does not seem optimistic. Amphibians and reptiles each have only six families with more than half of the species covered (including three reptilian families containing one species in total). Meanwhile, 23 and 25 families remain fully neglected for amphibians and reptiles respectively (Figs. 4–5).
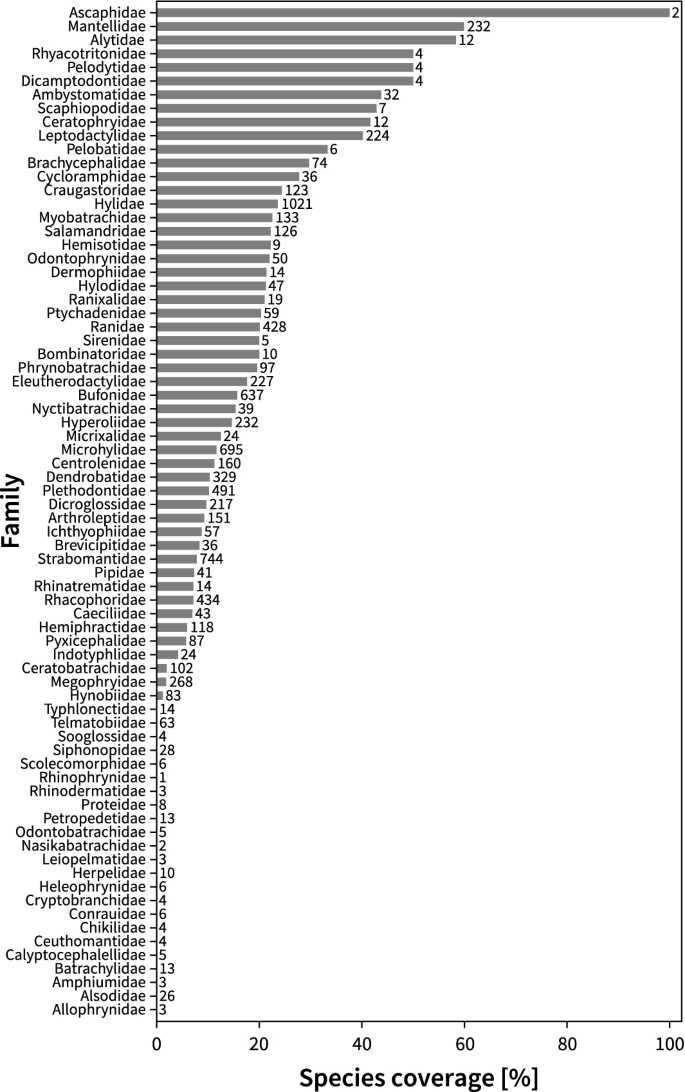
Species coverage for each taxonomic family in selected papers of amphibians. The numbers on each row indicate the total number of species known in its respective family (obtained from AmphibiaWeb 2021)
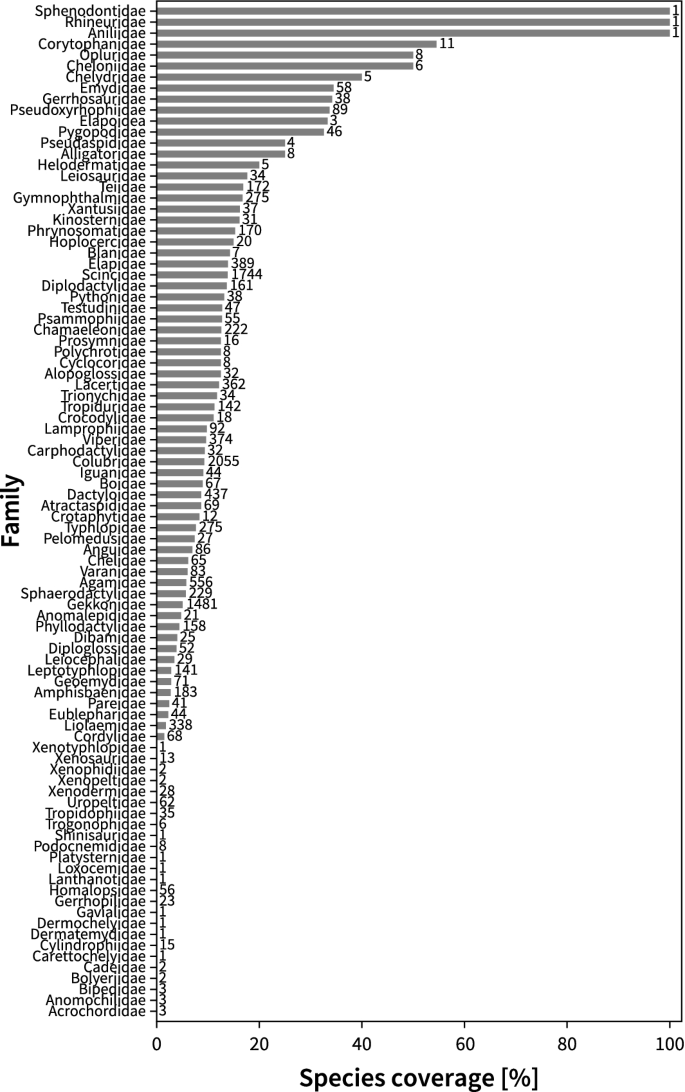
Species coverage for each taxonomic family in selected papers of reptiles. The numbers on each row indicate the total number of species known in its respective family (obtained from ReptileDatabase)
Categorisation of papers
Multiple correspondence analysis provided important insights into underlying patterns in our data allowing us to visualise the relationship between forms of habitat fragmentation (Median = 1 [1–4]), sampling methods (Median = 1 [0–5]) and response variables (Median = 2 [1–6]). Percentage of variance (or eigenvalues) from MCA output represents the contribution of each dimension in explaining the observed patterns. The top ten new dimensions identified by MCA explained a total of 61.64% and 61.16% of the total variance for amphibians and reptiles respectively. The two dimensions with the highest variance percentages explained were found in the first (Dim1, 12.55%) and second (Dim2, 9.13%) dimensions in amphibians (Online Appendix 3–4). Genetics (sampling method; 13.73%) and population (response variable; 12.39%) contributed the most to Dim1, together with species richness (response variable;10.41%) and dispersal (response variable; 9.20%). For Dim2, experimental (sampling method; 14.38%) was the dominant variable, the rest was determined by GIS/Satellite images (sampling method; 9.71%), fitness measure (response variable; 9.12%) and urbanisation (form of fragmentation; 8.94%). For reptiles, the two dimensions explaining the most variation were the first (Dim1, 11.34%) and second (Dim2, 8.28%) dimensions (Online Appendix 3–4). The variables contributing the most to Dim1 were species richness (response variable; 15.51%), abundance (response variable; 10.11%), presence/absence (response variable; 6.97%) and genetics (sampling method; 6.39%). On the other hand, Dim2 was determined by interspecific interaction (response variable; 13.49%), genetics (12.79%), experimental methods (sampling method; 11.21%) and fitness measure (response variable; 10.94%). The contribution of each category to the definition of the dimensions is reported in Online Appendix 3. The categories identified in the MCA dimensions are subsequently used for building the distance matrix in the clustering analysis.
The HCPC analysis identified three clusters of variables for amphibians and reptiles (Online Appendix 5–6). The output of the HCPC analysis is reported in Online Appendix 7. V test represent the influence of variables in the cluster composition. In general, three clusters for both amphibians and reptiles appeared to be uniquely similar by definition of categories (Fig. 6). For amphibians, cluster 1 was defined by studies on species richness (p < 0.05, V test = 14.30) and presence/absence (p < 0.05, V test = 13.42), while cluster 2 was determined by experimental studies (p < 0.05, V test = 10.95) and fitness measures (p < 0.05, V test = 9.77). Cluster 3 was defined by genetics (p < 0.05, V test = 18.44) and population studies (p < 0.05, V test = 17.73) (Online Appendix 7). Abundance and functional richness were also unique to cluster 1; other response variables and direct tracking methods were important to cluster 2 and dispersal was present in cluster 3 even though these variables are less expressed (Fig. 6a).

Percentage contribution of the categories contributing to the uniqueness of each cluster in amphibians (Dark green = 1, Bright green = 2, Bright yellow = 3) and reptiles (Dark red = 1, Orange = 2, Dark yellow = 3) based on the Cla/Mod results of HCPC (see Online Appendix 7). Abbreviations for the categories can be found in Fig. 3 and in Online Appendix 1
For reptiles, cluster 1 was represented by species richness (p < 0.05, V test = 14.26), abundance (p < 0.05, V test = 11.22) and presence absence (p < 0.05, V test = 8.55) papers, whereas cluster 2 was determined by papers on fitness measures (p < 0.05, V test = 10.99), direct tracking methods (p < 0.05, V test = 8.64) and interspecific interaction (p < 0.05, V test = 7.86), and cluster 3 was defined by genetics (p < 0.05, V test = 12.79), population (p < 0.05, V test = 9.95) and prediction/simulation models (p < 0.05, V test = 7.68) papers (Online Appendix 7). Although slightly less expressed in the clusters, papers using comparisons between generalist and specialist species and papers on functional richness were also unique to cluster 1; experimental methods and other response variables were heavily present in cluster 2, while dispersal studies were distinct to cluster 3 (Fig. 6b).
Results from VOSviewer categories of both amphibians and reptiles appear to be similar to each other (Fig. 3c, d). The clustering of the categories in the co-occurrence network maps confirms what we observed in the HCPC results (Fig. 6). In addition to geographical representation of study locations in (1), the corresponding clusters of selected papers are also mapped in Figs. 7 and 8 to investigate the spatial grouping patterns for the three clusters (see Online Appendix 8–9 for geographical representation for each category). We also plotted the temporal trend in Online Appendix 10 and 11. Overall, the three clusters are distributed homogeneously across the globe, but concentrated in the USA, Europe and south eastern Australia. Cluster 1 papers were found to be the most predominant cluster in amphibians (57% papers) across all continents (see Online Appendix 12; Fig. 7). When compared to other clusters, studies from this cluster are often conducted in Afrotropics, particularly Madagascar (100% papers), central (Costa Rica (60% papers) and Mexico (92% papers) and south America (80% papers) (Online Appendix 12, Figs. 7, 8). On the other hand, cluster 2 papers appear to be more prevalent for reptile studies compared to amphibian studies, with a higher number of studies conducted across North America (65 to 51) and Australia (22 to 2) (Figs. 7, 8). Lastly, a vast majority of cluster 3 papers were located in North America and Europe (both contributing to 79% of the papers) for amphibians and North America and Australia (both contributing to 84% of the papers) for reptiles (Online Appendix 12, Figs. 7, 8). Publications from this cluster started to gain popularity from 2005 onwards, following similar increasing trends as cluster 2 (Online Appendix 10–11). Overall, except for cluster 1 in South America, most of the clusters in Asia and Africa appear to experience very little or no increase in publications over the years (Online Appendix 10–11).

Map of the individual selected papers belonging to each cluster groups (Dark green = 1, Bright green = 2, Bright yellow = 3) for amphibians, with each circle representing the study location. The colour scale of the continents ranging from 0 to 0.9 indicates the proportions of amphibian species represented in the reviewed papers when compared to known species in the world (obtained from AmphibiaWeb)

Map of the individual selected papers belonging to each cluster groups (Dark red=1, Orange=2, Dark yellow=3) for reptiles, with each circle representing the study location. The colour scale of the continents ranging from 0.0 – 0.9 indicates the proportions of reptile species represented in the reviewed papers when compared to known species in the world (obtained from ReptileDatabase).
Discussion
Our review found no improvement in the geographical and taxonomic bias in habitat fragmentation studies for both reptiles and amphibians compared to earlier studies (Fardila et al. 2017). Yet, our study has made an effective contribution towards identifying major spatial gaps in habitat fragmentation studies over the past three decades (updating reviews such as Cushman 2006; Gardner et al. 2007)). In particular, we found an overall increase in the number of studies measuring species richness and abundance throughout the years while population-level and genetics studies are still lacking in developing countries. Here, we discuss the issues of (1) biogeographical bias, (2) the extent and focus of habitat fragmentation research and (3) the limitations and knowledge gaps in habitat fragmentation research in herpetology and provide recommendations for future research.
Biogeographical bias
Geographic bias in research papers
Given the research effort in relatively wealthy countries (Holmgren and Schnitzer 2004; Fazey et al. 2005) it is not surprising that more than half the papers concern North America and Europe, where there is strong prevalence of herpetological research. This pattern is also evident in other taxonomic groups and biological areas including invasion biology (Pyšek et al. 2008), biodiversity conservation (Trimble and Aarde 2012; Christie et al. 2020), and habitat fragmentation (Fardila et al. 2017). The USA alone contributed more than a third of the publications in terms of both authors and location of study (Fazey et al. 2005; Melles et al. 2019). English speaking countries including the USA, the United Kingdom, and Australia have dominated research output over the last 30 years (Melles et al. 2019). These patterns were reflected in the collaboration network maps generated by VOSviewer (Fig. 3). Similar hotspots found between who does the research (Fig. 3) and the study locations (Fig. 2) suggest that authors tend not to move much and only to study ecosystems near to where they are based (Meyer et al. 2015). One reason for this bias is the distance to field sites accentuated by the costs and time of travelling.
However, the near absence of studies from many parts of the world that are currently under extreme pressures of habitat loss and degradation are of great concern (Habel et al. 2019). We feel that the level of threat associated with habitat fragmentation in these continents is not proportional to the level of research attention required. Naturally biodiverse but less economically developed Southeast Asian and sub-Saharan countries will suffer greatest diversity losses in the next century (Newbold et al. 2015). If this persists at the current rate, biodiverse areas will likely disappear before new discoveries in those hotspots are made (Moura and Jetz 2021). Although conversely our study found that among other developing countries Brazil is currently conducting relatively more in-country amphibian studies and collaboration with other countries. However, how much of this information reaches decision makers and practitioners remains unknown. This is largely due to the lack of intermediary evidence bridges (Kadykalo et al. 2021). These intermediaries identify evidence summaries based on research and priorities and distribute them to practitioners, facilitating exchange of knowledge between and among researchers and practitioners (Holderegger et al. 2019; Kadykalo et al. 2021).
Geographic bias in focal groups
Congruent to results reported in Gardner et al. (2007), studies on amphibians were more abundant than studies on reptiles. Over the past years, there has been a strong focus on amphibian population declines. This was catalysed by the emergence of chytridiomycosis and global decline of amphibians (Fisher and Garner 2020). Amphibians, and predominantly frogs, are the principal focus of herpetological research, with the highest allocation of resources and the highest publication rates (Ferronato 2019). Another reason for this bias may be that amphibians serve as valuable indicators of environmental stress and degradation owing to their aquatic and terrestrial lifestyle and permeable skin (Green 2003). These attributes make them extremely sensitive to changes in temperature and precipitation as well as pollution (Sodhi et al. 2008). Lizards, also susceptible to temperature changes, however, are characterised by a high degree of endemism, restricted geographic ranges, late maturity, a long life-span and are thus very susceptible to population declines (Todd et al. 2010; Meiri et al. 2018). Certain groups of reptiles, such as worm lizards and blind snakes lead cryptic and solitary lives in contrast to the large breeding aggregations and choruses of, for example, frogs. Such characteristics make them difficult for researchers to study as they require large amount of search effort for little data (Thompson 2013).
Taxonomic bias
We found a heightened geographical bias in the taxonomic coverage of studies. Given the sheer number of selected papers investigated, it is not surprising that the continents of North and South America cover more than half of the amphibian species studied whereas North America and Africa cover almost half of the reptile species studied. This trend broadly mirrors the geographic distribution pattern of the global described species in both these taxa (AmphibiaWeb 2021; Uetz et al. 2021). While a large proportion of the known European and North American families such as Alytidae and Ambystomatidae have been investigated (Fig. 4), species from other continents remain severely under-represented. Yet, the European continent represents only 2% of the described species globally. This high research intensity bias in low biodiverse regions of the world has been noted previously (Fazey et al. 2005). In general, reptiles and amphibians have been disproportionately poorly studied in the tropics and in developing areas despite that these areas show among the highest rates of deforestation and a corresponding rise in the number of threatened species (Böhm et al. 2013; Deikumah et al. 2014). These biodiverse areas largely consist of threatened species having restricted home ranges (Meiri et al. 2018). Even though we observed a great fraction of the species investigated in the Afrotropics (Vallan 2002; Hillers et al. 2008; Ofori‐Boateng et al. 2013; Riemann et al. 2015; Blumgart et al. 2017), especially Madagascar (see Mantellidae and Opluridae in Fig. 4), it seems insufficient when considering that an estimated 3.94 million hectares of forest area of the continent was cleared yearly over the last century (FAO and UNEP 2020). Further, biodiverse hotspots such as the neotropical regions and Indo-Malayan tropics have the highest chances of new species of amphibians and reptiles being discovered (Moura and Jetz 2021).
Being herpetofauna diversity hotspots, countries in South America and Asia are indeed understudied. Although Brazil has a high number of amphibian studies, less than one percent of known reptile species was studied in both continents (Fig. 2). A number of factors contribute to this lack of representation. First, there is an overwhelming number of new species being discovered every year in these hotspots (Moura et al. 2018; Moura and Jetz 2021). Furthermore, newly discovered species tend to belong to more secretive groups such as burrowing snakes, worm lizards and caecilians (Colli et al. 2016). Yet, these fossorial organisms are clearly neglected in fragmentation studies (see Fig. 4–5) with researchers focusing on well-known taxonomic groups (Böhm et al. 2013). On a positive note, despite having the country (Australia) with the highest reptile diversity (Uetz et al. 2021), Oceania represented a fair coverage of reptile diversity compared to other continents. Since 2001, there has been an increase of fragmentation studies in Australia (e.g., Brown 2001; Mac Nally and Brown 2001; Hazell et al. 2001) and there is a continuing increase in research output (Melles et al. 2019), contributing 85 out of 89 reviewed studies in Oceania over the last 30 years.
Extent and focus of research
Our findings showed important associations between methods and response metrics but not different forms of habitat fragmentation. This either suggests that researchers were not favouring any sampling method and response variable for evaluating the effects of certain habitat fragmentation or this pattern may occur due to a relatively even split of papers dealing with different forms or combinations of habitat fragmentation in the clusters. In general, species richness or diversity appears to explain most of the variation in our data (see Online Appendix 4). While species richness remains a popular diversity metric employed in conservation biology (Online Appendix 12; also see Gardner et al. 2007), we also found an increasing trend in the use of genetic techniques for habitat fragmentation studies. More specifically in recent years, molecular genetics have become popular and are often studied together with population connectivity to capture species responses to habitat fragmentation (see Online Appendix 4) (Keyghobadi 2007). The HCPC approach identified three main clusters of research fields which will be referred to as research agendas from here onwards. Contrary to our expectation, we did not find a global spatial pattern of research agendas, but instead a rather homogeneous distribution of papers, possibly due to the lack of selected studies which are found in developing countries outside USA, Europe and Australia (Figs. 7, 8). This nevertheless indicates that different sampling methods are shared and used between leading herpetological experts from different countries and that there are continuing collaborations between countries, particularly in North America and Europe.
Below, we describe the research agendas and their corresponding categories (Fig. 6) that have contributed significantly to the study of habitat fragmentation for the past 30 years: (a) Agenda 1: Measures of direct individual species responses, (b) Agenda 2: Physiological and movement ecology, and (c) Agenda 3: Technology advancement in conservation research.
Agenda 1: Measures of direct individual species responses
We found that the majority of studies around the globe evaluated patterns of assemblage richness, species presence/absence, and abundance (Figs. 7, 8). These simple patterns of richness, diversity and abundance are the most common responses measured because they provide a good indication of species response to habitat fragmentation and are easy to calculate (Colwell 2009). Although species richness does not consider abundance or biomass but treats each species as of equal importance to diversity, species evenness weighs each species by its relative abundance (Hill 1972). Further, composite measures like species diversity indices (e.g., Simpson’s 1/D or Shannon’s H) combine both richness and evenness in a single measure (Colwell 2009), preventing biases in results. However, directly measuring these species responses might not be ecologically relevant as they fail to account for patterns in species assemblage turnover. In fact, few selected papers (38 out of 697) in our study have attempted to categorise species into meaningful functional groups or guilds, despite that the categorisation of ecological functions such as habitat preference, taxonomic family, reproductive mode, and body size can be easily done (but see Knutson et al. 1999; Peltzer et al. 2006; Moreira and Maltchik 2014). Knutson et al.(1999) was the first in our selected papers to group species with similar life-history characteristics into guilds and to examine their responses to landscape features. They observed negative associations between urban land use and anuran guilds. Analyses of guilds or functional groups can reveal contradictory results (but not always, see Moreira and Maltchik 2014). For example, the species richness of anurans in logged areas of West Africa is found to be as high as in primary habitat (Ernst et al. 2006). Yet, analyses of functional groups indicated significantly higher diversity in primary forest communities (Ernst et al. 2006). Similar differences were also observed for species with varying degrees of niche overlaps, habitat specialists, and for different continents (Ernst et al. 2006; Seshadri 2014). These results underline that species richness alone is a poor indicator of the functional value of species in the ecosystem as the relationships between functional diversity and species richness are inconsistent and can sometimes be redundant (functional diversity remains constant if assemblages are functionally similar; Riemann et al. 2017; Palmeirim et al. 2017; Silva et al. 2022). The results of some species richness studies may consequently provide misleading inferences regarding consequences of habitat fragmentation and conservation management (Gardner et al. 2007).
Although not substantially greater than the agendas 2 and 3, the measure of individual species responses has always been popular across the globe but also increasingly popular in the tropical and subtropical regions (e.g., South America and Africa; Online Appendix 10–11). For example, a research team led by Mark-Oliver Roedel from Germany has conducted numerous studies on Afrotropical amphibian communities (Hillers et al. 2008; Ofori‐Boateng et al. 2013; Riemann et al. 2017). Due to the higher biodiversity and species rarity in these regions compared to temperate areas, it is reasonable to expect a greater level of sampling effort in patterns of species richness, abundance, and guild assemblage to obtain comparisons of diversity with sufficient statistical power across different land use changes (Gardner et al. 2007). Access to highly specific expertise and most up to date methods and technology may not be available in these regions, and as such, study designs are limited to multispecies survey addressing simple patterns of diversity and species assemblages (Hetu et al. 2019). Unfortunately at the same time, these forest biomes holding the highest richness and abundance of amphibians and reptiles have showed consistent negative responses to land use changes (Cordier et al. 2021).
Agenda 2: physiological and movement ecology
We did not observe a strong association between occupancy and dispersal in our study. Perhaps this is because only a few papers investigated dispersal via habitat occupancy compared to the overwhelming proportions of papers examining the presence of species in response to habitat fragmentation in research agenda 1. Similarly, few studies measure dispersal with direct tracking methods, with the majority that discussed dispersal being based on indirect inferences, such as genetic divergence (see Fig. 3c, d; Driscoll et al. 2014). Genetic approaches can be effective in situations where more direct approaches are not possible (Lowe and Allendorf 2010). For instance, using microsatellites and mitochondrial DNA, Buckland et al. (2014) found no migration occurring between isolated subpopulations of a forest day gecko (Phelsuma guimbeaui) in a fragmented forest and predicted a dramatic decrease in survival and allelic diversity in the next 50 years if no migration occurs (Buckland et al. 2014). In some cases, molecular markers also allow direct dispersal studies by assigning individuals to their parents or population of origin (Manel et al. 2005). However, there are limitations on when these techniques can be applied. Assignment tests require appropriate choices of molecular markers and sampling design to permit quantification of indices of dispersal (Broquet and Petit 2009; Lowe and Allendorf 2010). Parent–offspring analysis is constrained by the uncertainty in assessing whether offspring dispersal is completed at the time of sampling and sample size (Broquet and Petit 2009). Genetic tools may thus be best applied in combination with direct approaches because they contain complementary information (Lowe and Allendorf 2010; Safner et al. 2011; Smith et al. 2016).
Traditional approaches in habitat fragmentation research like radiotracking or capture-mark-recapture of animals can be effective in evaluating dispersal and ecological connectivity between populations. For example, based on mark-recapture data over a nine year period, facultative dispersal rates in an endangered amphibian (Bombina variegata) were found to be sex biased and relatively low from resulting patch loss (Cayuela et al. 2018). In our case, direct tracking methods are more commonly and effectively used in examining the impacts of habitat modification on changes in ecology directly relating to fitness (Fig. 6): home ranges (Price-Rees et al. 2013), foraging grounds (MacDonald et al. 2012) and survival rates (Breininger et al. 2012). Yet, such routine movements associated with resource exploitation do not reflect the biological reality and evolutionary consequences of how organisms change as landscape changes (Van Dyck and Baguette 2005). Instead, directed behavioural movements affecting dispersal processes (emigration, displacement or immigration) are crucial in determining the functional connectivity between populations in a fragmented landscape (Bonte et al. 2012). In one study, spotted salamanders Ambystoma maculatum tracked with fluorescent powder exhibited strong edge mediated behaviour when dispersing across borders between forest and field habitats and can perceive forest habitats from some distance (Pittman and Semlitsch 2013). Knowing such behaviour rules can improve predictions of the effects of habitat configuration on survival and dispersal. However, ongoing conversion of natural ecosystems to human modified land cover increases the need to consider various cover types that may be permeable to animal movements. As such, experimental approaches can be effective in examining the effect of matrix type on species movements as seen in our results (Fig. 6) (Rothermel and Semlitsch 2002; Mazerolle and Desrochers 2005). For example, researchers conducted experimental releases of post-metamorphic individuals of forest amphibians into different substrates and mapped the movements of paths and performance (Cline and Hunter Jr 2016). They showed that non-forest matrices with lower structural complexity influence the ability of frogs to travel across open cover and to orient themselves towards the forest from distances greater than 40–55 m. Therefore, it is inaccurate to assume matrix permeability to be uniform across all open-matrix types, particularly in amphibians (Cline and Hunter 2014, 2016).
In addition, the ability to move and disperse is highly dependent on the range of external environments and internal physiological limits (Bonte et al. 2012), especially in reptiles and amphibians (Nowakowski et al. 2017). The study of physiological effects on movement was seen throughout our selected studies (Fig. 6). For example, higher temperatures and lower soil moisture in open habitats could increase evaporative water loss in salamanders (Rothermel and Semlitsch 2002). Other tests including interaction effects between landscape configuration and physiological constraints (e.g., dehydration rate Rothermel and Semlitsch 2002; Watling and Braga 2015); body size (Doherty et al. 2019) can be useful to better understand fitness and population persistence. We argue here that multidisciplinary projects examining movement physiology, behaviour and environmental constraints in addition to measuring distance moved are needed to progress this field.
Our results indicate a high bias of agenda 2 papers represented among developed countries, with a strong focus on reptiles compared to amphibians (Price-Rees et al. 2013; Doherty et al. 2019) (Online Appendix 12, Figs. 7, 8). The adoption of direct tracking as well as genetic methods can be cost prohibitive in developing and poorer regions. However, cheaper and simpler methods to track individuals are increasing (Mennill et al. 2012; Cline and Hunter 2014, 2016). Although existing application might not be ideal for reptiles and amphibians, new technologies for tagging and tracking small vertebrates are being developed including acoustic surveys and improved genetic methods (Broquet and Petit 2009; Mennill et al. 2012; Marques et al. 2013). While there are many improvements needed to obtain better quality dispersal data studies on movement ecology, reptiles and amphibians still only account for a mere 2.2% of the studies on dispersal when compared to plants and invertebrates which comprised over half of the studies based on a systematic review (Driscoll et al. 2014). Thus, we urge more studies to be conducted on these lesser-known taxa, especially in biodiverse regions. Given the limited dispersal in amphibians and reptiles, having a deeper understanding on their dispersal can be critical for the effective management and conservation of populations and metapopulations (Smith and Green 2005).
Agenda 3: technology advancement in conservation research
While community level approaches such as responses in species richness, occupancy, and abundance measure biodiversity response to habitat fragmentation, they are limited in inference because they do not reflect patterns of fitness across environmental gradients and landscape patterns. Instead, genetic structure at the population level can offer a higher resolution of species responses (Manel and Holderegger 2013). For instance, genetic erosion heavily affects the rate of species loss in many amphibian species (Allentoft and O’Brien 2010; Rivera‐Ortíz et al. 2015). Over the past decades we have seen a rapid increase in studies applying genetic analysis to assess the effects of habitat fragmentation (Keyghobadi 2007), reflecting the strength of these approaches. This growth is mostly evident in North America and Europe (but also Oceania for reptiles) (Online Appendix 10–11). The availability of different genetic markers has been increasing, from microsatellites in the 1990s then shifting towards genotyping by sequencing (NGS) technologies that enable rapid genome-wide development (Allendorf et al. 2010; Monteiro et al. 2019). However, the study of population structure alone can lead to misleading results as environmental changes to species dynamics are not considered. The resistance imposed by landscape features on the dispersal of animals can ultimately shape gene flow and genetic structure (Bani et al. 2015; Pilliod et al. 2015; Monteiro et al. 2019).
To understand this, researchers combine genetic, land cover and climate variables to study the gene flow patterns across heterogeneous and fragmented landscapes (Manel and Holderegger 2013). Spatial analyses can be a powerful tool for monitoring biodiversity by quantifying environmental and landscape parameters. The growing interest in both landcover data and the rapid development of computer processing power prompted the development of new prediction methods, primarily in spatial models (Ray et al. 2002), ecological niche modelling (Urbina-Cardona and Loyola 2008; Tan et al. 2021), and landscape connectivity (Cushman et al. 2013; Ashrafzadeh et al. 2019). In some cases, niche models are useful in assessing the effectiveness of protected areas for endangered species (Urbina-Cardona and Loyola 2008; Tan et al. 2021).
The integration of genetic data in ecological niche models for recognising possible dispersal movements between populations were observed in our study (Fig. 3c, d), especially in reptiles (Fig. 6b). The hallmark of landscape genetics is the ability to estimate functional connectivity among populations and offer empirical approach of adaptive genetic variation in real landscapes to detect environmental factors driving evolutionary adaptation. The most common approach of landscape genetics is determining whether effective distances as determined by the presence of suitable habitat between populations, better predict genetic distances than do Euclidean distances (assuming spatially homogeneous landscape). However, straight-line geographic distance does not normally reflect true patterns of dispersal as landscape barriers or facilitators in a heterogeneous landscape could strongly affect gene flow (Emel and Storfer 2012; Fenderson et al. 2020). Therefore, in these cases, ecological distances or landscape resistance can often explain a greater deal of genetic variation between fragmented populations (Cushman 2006; Bani et al. 2015). Using a combination of habitat suitability modelling (e.g., Maxent, Phillips et al. 2017), multiple least-cost paths (LCPs) (Adriaensen et al. 2003) and the more recent circuit theory analysis (McRae et al. 2008) to investigate landscape resistance can be highly effective predicting potential pathways along which dispersal may occur, hence informing conservation management (Emel and Storfer 2012; Bani et al. 2015; Pilliod et al. 2015). To date, landscape genetics has been shown to be particularly useful in studying organisms with complex life histories (Emel and Storfer 2012; Shaffer et al. 2015). Yet, the applications of landscape genetics have been limited to contemporary patterns using modern genetic data. Few studies have benefitted from the inclusion of temporal genetic data (Fenderson et al. 2020). For example, historical DNA samples and heterochronous analyses could allow us to explore how anthropogenic impacts have affected past genetic diversity and population dynamics (Pacioni et al. 2015) and identify areas of future suitability of endangered animals in face of climate change (Nogués-Bravo et al. 2016). The possibility to investigate migration through spatiotemporal population connectivity can greatly improve the prediction of species responses under future landscape and climate change scenarios (Fenderson et al. 2020).
Population genetic and niche modelling studies for both taxa are rarely found in developing regions of the world, especially in Asia and Africa (Figs. 7, 8). Even though conservation priorities are concentrated in these biodiverse regions, invaluable highly specific expertise such as conservation genetics and other contemporary methodologies might not be readily available due to lack of funding and infrastructure (Hetu et al. 2019). Thus, we encourage collaborations with the poorer countries initiated by foreign service providers from developed countries. Contrary to expectations, very few studies on conservation genetics were found in China and Japan despite their vast advances in genetic techniques. Fortunately, China has made substantial progress in the last 20 years in understanding human genetic history and interpreting genetic studies of human diseases (Forero et al. 2016) as well as biodiversity conservation (Wang et al. 2020), yet the same cannot be said for conservation genetics on reptiles and amphibians (Figs. 7, 8), but see Fan et al. (2018) and Hu et al. (2021).
Limitations and knowledge gaps
-
(1)
The forms of habitat fragmentation which we categorised may not reflect the ecological impact in the real world as interactions between different habitat fragmentation forms were not accounted for. Although each of these forms of habitat fragmentation possesses serious environmental consequences, their combination could have severe synergistic impacts (Blaustein and Kiesecker 2002). For example, a fragmented landscape is not just reduced and isolated, but subject to other anthropogenic disturbances such as hunting, fire, invasive species, and pollution (Laurance and Useche 2009; Lazzari et al. 2022). Altered climatic conditions and emerging pathogens such as batrachochytrids can also interact with each other, and other threats (Fisher and Garner 2020). The use of habitat suitability models based on climatic scenarios, combined with hydrological and urbanisation models, are effective in detecting best to worst case scenarios and local extinctions, as shown for the spotted marsh frog (Limnodynastes tasmaniensis) (Wilson et al. 2013).
-
(2)
We acknowledge the bias of scientific research introduced from the limitation of search term to English-speaking literature on the geographic distribution of the papers we sampled (Konno et al. 2020; Angulo et al. 2021). In Latin American journals for example, we found a number of papers published in Spanish, but unfortunately, they did not fit the criteria of our selection (see Online Appendix 2). Conservation studies written in languages other than English are often published in local journals which do not normally go through international peer review.
-
(3)
The homogeneous distribution of the research agendas across geographical regions in our study may be explained by the lack of studies found in South America, Asia and Africa, preventing us to see a potentially dichotomous spatial pattern among the clusters. However, this reflects the current state of research and the challenges faced in less developed countries.
(4) Our study did not investigate whether habitat fragmentation has led to an improved or decreased biotic response. Predicting species response to habitat modification has been reviewed countless times (Rytwinski and Fahrig 2012; Driscoll et al. 2014; Doherty et al. 2020; Newbold et al. 2020; Cordier et al. 2021). Yet, these reviews often yield little or no general patterns (Doherty et al. 2020; Cordier et al. 2021). Response variables or traits measured are often found to be poor predictors of the impacts of habitat fragmentation. There are two possible explanations for this discrepancy. First, the strength and direction of the responses differs between species, ecophysiological groups (Rothermel and Semlitsch 2002), and phylogenetic or functional groups (Mazerolle and Desrochers 2005; Nowakowski et al. 2017). Second, responses in animals to different types of disturbance may be specific to the ecosystem where they live. Different biogeographic regions or biomes have different characteristics affecting local species (Lindell et al. 2007; Blowes et al. 2019; Newbold et al. 2020; Cordier et al. 2021).
Conclusions and recommendations
-
(1)
Our results underline promising research fields and geographic areas and may serve as a guideline or starting point for future habitat fragmentation studies. We suspect similar paradigms of geographic and thematic patterns to occur in other taxonomic groups.
-
(2)
Although studies dealing with habitat fragmentation impacts on mammals and birds are already widely recognised (Fardila et al. 2017), research on reptiles and amphibians has been lacking. We argue that amphibians and reptiles need more attention as they are equally or more threatened but highly neglected (Rytwinski and Fahrig 2012; Ferronato 2019; Cox et al. 2022).
-
(3)
Greater investment is required for studies in tropical and subtropical areas (Segovia et al. 2020), especially within the Asian continent. These areas are currently experiencing the highest rates of habitat loss (McDonald et al. 2013). Tropical specialists are further restricted to smaller geographic range sizes according to Rapoport’s rule which states that there is a positive latitudinal correlation with range size (Stevens 1989) (at least for amphibians in the Northern hemisphere where there is higher temperature and precipitation seasonality; Whitton et al. 2012). Having a small range size is often associated with negative responses to habitat modification (Doherty et al. 2020). Thus, more effort is needed in developing countries where the crisis is greatest and there is lack of funding and strong language barriers (Fazey et al. 2005). There is an urgent need to better integrate studies published in languages other than English with the broader international literature. Useful integration actions include training of local conservation biologists and promoting partnerships and research visits in these regions may have greater conservation consequences to understand global patterns of habitat modification (Meyer et al. 2015). Doing so will help remediate the sampling bias towards temperate generalists and will shed light on the fate of tropical specialists.
-
(4)
We encourage improved access to intermediary evidence-based conservation data (Kadykalo et al. 2021). Even when well-established genetic and genomic analyses have been proven to be promising area in herpetological conservation (Shaffer et al. 2015), there is a general lack of the transfer of knowledge between scientists and practitioners (Holderegger et al. 2019). As practitioners are generally interested in species monitoring and the evaluation of success of connectivity measures, an establishment of scientist-practitioner community to facilitate a platform for international exchange would help tremendously in future conservation planning and management (Holderegger et al. 2019).
-
(5)
Although different study designs and landscape measures have different strengths and limitations depending on the study objectives, we suggest reporting basic data to describe the effect of habitat fragmentation using standardised sampling methods, indices, and design (Holderegger et al. 2019). The results will allow future meta-analyses to be performed.
-
(6)
Incorporate remote sensing data, whenever possible, in studies involving habitat change and fragmentation. The use of niche modelling techniques combined with high resolution remote sensing has been instrumental in detecting potentially fragmented populations. With advances in landscape genomics, we are now able to examine the correlation between environmental factors and genomic data in natural populations (Manel and Holderegger 2013; Shaffer et al. 2015). Adopting such tools would be valuable in understanding how habitat amounts and configurations affect dispersal, survival, and population dynamics as well as the impacts of anthropogenic changes such as climate change (Shaffer et al. 2015).
Data availability
The datasets generated during the current study are available in Online Appendix 1. Codes used in the analyses are available from corresponding author on request.
References
Adriaensen F, Chardon JP, De Blust G et al (2003) The application of ‘least-cost’ modelling as a functional landscape model. Landsc Urban Plan 64:233–247. https://doi.org/10.1016/S0169-2046(02)00242-6
Allendorf FW, Hohenlohe PA, Luikart G (2010) Genomics and the future of conservation genetics. Nat Rev Genet 11:697–709. https://doi.org/10.1038/nrg2844
Allentoft ME, O’Brien J (2010) Global amphibian declines, loss of genetic diversity and fitness: a review. Diversity 2:47–71. https://doi.org/10.3390/d2010047
AmphibiaWeb (2021) AmphibiaWeb. https://amphibiaweb.org/. Accessed 22 Feb 2021
Angulo E, Diagne C, Ballesteros-Mejia L et al (2021) Non-English languages enrich scientific knowledge: the example of economic costs of biological invasions. Sci Total Environ 775:144441. https://doi.org/10.1016/j.scitotenv.2020.144441
Ashrafzadeh MR, Naghipour AA, Haidarian M et al (2019) Effects of climate change on habitat and connectivity for populations of a vulnerable, endemic salamander in Iran. Glob Ecol Conserv 19:e00637. https://doi.org/10.1016/j.gecco.2019.e00637
Bani L, Pisa G, Luppi M et al (2015) Ecological connectivity assessment in a strongly structured fire salamander (Salamandra salamandra) population. Ecol Evol 5:3472–3485. https://doi.org/10.1002/ece3.1617
Barber PH, Ablan-Lagman MCA, Ambariyanto, et al (2014) Advancing biodiversity research in developing countries: the need for changing paradigms. Bull Mar Sci 90:187–210. https://doi.org/10.5343/bms.2012.1108
Barlow J, França F, Gardner TA et al (2018) The future of hyperdiverse tropical ecosystems. Nature 559:517–526. https://doi.org/10.1038/s41586-018-0301-1
Blaustein AR, Kiesecker JM (2002) Complexity in conservation: lessons from the global decline of amphibian populations. Ecol Lett 5:597–608. https://doi.org/10.1046/j.1461-0248.2002.00352.x
Blowes SA, Supp SR, Antão LH et al (2019) The geography of biodiversity change in marine and terrestrial assemblages. Science 366:339–345. https://doi.org/10.1126/science.aaw1620
Blumgart D, Dolhem J, Raxworthy CJ (2017) Herpetological diversity across intact and modified habitats of Nosy Komba Island, Madagascar. J Nat Hist 51:625–642. https://doi.org/10.1080/00222933.2017.1287312
Böhm M, Collen B, Baillie JEM et al (2013) The conservation status of the world’s reptiles. Biol Conserv 157:372–385. https://doi.org/10.1016/j.biocon.2012.07.015
Bonte D, Van Dyck H, Bullock JM et al (2012) Costs of dispersal. Biol Rev 87:290–312. https://doi.org/10.1111/j.1469-185X.2011.00201.x
Breininger DR, Mazerolle MJ, Bolt MR et al (2012) Habitat fragmentation effects on annual survival of the federally protected eastern indigo snake: indigo snake survival. Anim Conserv 15:361–368. https://doi.org/10.1111/j.1469-1795.2012.00524.x
Broquet T, Petit EJ (2009) Molecular estimation of dispersal for ecology and population genetics. Annu Rev Ecol Evol Syst 40:193–216. https://doi.org/10.1146/annurev.ecolsys.110308.120324
Brown GW (2001) The influence of habitat disturbance on reptiles in a Box-Ironbark eucalypt forest of south-eastern Australia. Biodivers Conserv 10:161–176. https://doi.org/10.1023/A:1008919521638
Buckland S, Cole NC, Groombridge JJ et al (2014) High risks of losing genetic diversity in an endemic Mauritian gecko: implications for conservation. PLoS ONE 9:e93387. https://doi.org/10.1371/journal.pone.0093387
Cayuela H, Besnard A, Quay L et al (2018) Demographic response to patch destruction in a spatially structured amphibian population. J Appl Ecol 55:2204–2215. https://doi.org/10.1111/1365-2664.13198
Christie AP, Amano T, Martin PA et al (2020) The challenge of biased evidence in conservation. Conserv Biol 35:249–262. https://doi.org/10.1111/cobi.13577
Cline BB, Hunter ML Jr (2014) Different open-canopy vegetation types affect matrix permeability for a dispersing forest amphibian. J Appl Ecol 51:319–329. https://doi.org/10.1111/1365-2664.12197
Cline BB, Hunter ML Jr (2016) Movement in the matrix: substrates and distance-to-forest edge affect postmetamorphic movements of a forest amphibian. Ecosphere 7:e01202. https://doi.org/10.1002/ecs2.1202
Colli GR, Fenker J, Tedeschi LG et al (2016) In the depths of obscurity: Knowledge gaps and extinction risk of Brazilian worm lizards (Squamata, Amphisbaenidae). Biol Conserv 204:51–62. https://doi.org/10.1016/j.biocon.2016.07.033
Colwell R (2009) Biodiversity: concepts, patterns, and measurement. The Princeton guide to ecology. Princeton, Princeton University Press, pp 257–263
Cordier JM, Aguilar R, Lescano JN et al (2021) A global assessment of amphibian and reptile responses to land-use changes. Biol Conserv 253:108863. https://doi.org/10.1016/j.biocon.2020.108863
Cox N, Young BE, Bowles P et al (2022) A global reptile assessment highlights shared conservation needs of tetrapods. Nature 605:285–290. https://doi.org/10.1038/s41586-022-04664-7
Cushman SA (2006) Effects of habitat loss and fragmentation on amphibians: a review and prospectus. Biol Conserv 128:231–240. https://doi.org/10.1016/j.biocon.2005.09.031
Cushman SA, Shirk AJ, Landguth EL (2013) Landscape genetics and limiting factors. Conserv Genet 14:263–274. https://doi.org/10.1007/s10592-012-0396-0
Deikumah JP, McAlpine CA, Maron M (2014) Biogeographical and taxonomic biases in tropical forest fragmentation research. Conserv Biol J Soc Conserv Biol 28:1522–1531. https://doi.org/10.1111/cobi.12348
Doherty TS, Fist CN, Driscoll DA (2019) Animal movement varies with resource availability, landscape configuration and body size: a conceptual model and empirical example. Landsc Ecol 34:603–614. https://doi.org/10.1007/s10980-019-00795-x
Doherty TS, Balouch S, Bell K et al (2020) Reptile responses to anthropogenic habitat modification: a global meta-analysis. Glob Ecol Biogeogr 29:1265–1279. https://doi.org/10.1111/geb.13091
Driscoll DA, Banks SC, Barton PS et al (2014) The trajectory of dispersal research in conservation biology. Syst Rev PLOS ONE 9:e95053. https://doi.org/10.1371/journal.pone.0095053
Driscoll DA, Armenteras D, Bennett AF et al (2021) How fire interacts with habitat loss and fragmentation. Biol Rev 96:976–998. https://doi.org/10.1111/brv.12687
Emel SL, Storfer A (2012) A decade of amphibian population genetic studies: synthesis and recommendations. Conserv Genet 13:1685–1689. https://doi.org/10.1007/s10592-012-0407-1
Ernst R, Linsenmair KE, Rödel M-O (2006) Diversity erosion beyond the species level: dramatic loss of functional diversity after selective logging in two tropical amphibian communities. Biol Conserv 133:143–155. https://doi.org/10.1016/j.biocon.2006.05.028
Fahrig L (2003) Effects of habitat fragmentation on biodiversity. Annu Rev Ecol Evol Syst 34:487–515. https://doi.org/10.1146/annurev.ecolsys.34.011802.132419
Fahrig L (2017) Ecological responses to habitat fragmentation per se. Annu Rev Ecol Evol Syst 48:1–23. https://doi.org/10.1146/annurev-ecolsys-110316-022612
Fan H, Hu Y, Wu Q et al (2018) Conservation genetics and genomics of threatened vertebrates in China. J Genet Genomics 45:593–601. https://doi.org/10.1016/j.jgg.2018.09.005
FAO and UNEP (2020) The State of the World’s Forests 2020: Forests, biodiversity and people. FAO and UNEP,
Fardila D, Kelly LT, Moore JL, McCarthy MA (2017) A systematic review reveals changes in where and how we have studied habitat loss and fragmentation over 20years. Biol Conserv 212:130–138. https://doi.org/10.1016/j.biocon.2017.04.031
Fazey I, Fischer J, Lindenmayer DB (2005) Who does all the research in conservation biology? Biodivers Conserv 14:917–934. https://doi.org/10.1007/s10531-004-7849-9
Fenderson LE, Kovach AI, Llamas B (2020) Spatiotemporal landscape genetics: investigating ecology and evolution through space and time. Mol Ecol 29:218–246. https://doi.org/10.1111/mec.15315
Ferronato B (2019) An assessment of funding and publication rates in herpetology. Herpetol J. https://doi.org/10.33256/hj29.4.264273
Fisher MC, Garner TWJ (2020) Chytrid fungi and global amphibian declines. Nat Rev Microbiol 18:332–343. https://doi.org/10.1038/s41579-020-0335-x
Forero DA, Wonkam A, Wang W et al (2016) Current needs for human and medical genomics research infrastructure in low and middle income countries. J Med Genet 53:438–440. https://doi.org/10.1136/jmedgenet-2015-103631
Gardner TA, Barlow J, Peres CA (2007) Paradox, presumption and pitfalls in conservation biology: the importance of habitat change for amphibians and reptiles. Biol Conserv 138:166–179. https://doi.org/10.1016/j.biocon.2007.04.017
Gibbons JW, Scott DE, Ryan TJ et al (2000) The Global Decline of Reptiles, Déjà Vu Amphibians: reptile species are declining on a global scale. Six significant threats to reptile populations are habitat loss and degradation, introduced invasive species, environmental pollution, disease, unsustainable use, and global climate change. Bioscience 50:653–666. https://doi.org/10.1641/0006-3568(2000)050[0653:TGDORD]2.0.CO;2
Green DM (2003) The ecology of extinction: population fluctuation and decline in amphibians. Biol Conserv 111:331–343. https://doi.org/10.1016/S0006-3207(02)00302-6
Habel JC, Rasche L, Schneider UA et al (2019) Final countdown for biodiversity hotspots. Conserv Lett 12:e12668. https://doi.org/10.1111/conl.12668
Haddad NM, Brudvig LA, Clobert J et al (2015) Habitat fragmentation and its lasting impact on Earth’s ecosystems. Sci Adv 1:e1500052. https://doi.org/10.1126/sciadv.1500052
Hadley AS, Betts MG (2016) Refocusing habitat fragmentation research using lessons from the last decade. Curr Landsc Ecol Rep 1:55–66. https://doi.org/10.1007/s40823-016-0007-8
Hamer AJ, McDonnell MJ (2008) Amphibian ecology and conservation in the urbanising world: a review. Biol Conserv 141:2432–2449. https://doi.org/10.1016/j.biocon.2008.07.020
Hazell D, Cunnningham R, Lindenmayer D et al (2001) Use of farm dams as frog habitat in an Australian agricultural landscape: factors affecting species richness and distribution. Biol Conserv 102:155–169. https://doi.org/10.1016/S0006-3207(01)00096-9
Hetu M, Koutouki K, Joly Y (2019) Genomics for All: International Open Science Genomics Projects and Capacity Building in the Developing World. Front Genet. https://doi.org/10.3389/fgene.2019.00095
Hillers A, Veith M, Rödel M-O (2008) Effects of forest fragmentation and habitat degradation on West African leaf-litter frogs. Conserv Biol 22:762–772. https://doi.org/10.1111/j.1523-1739.2008.00920.x
Holderegger R, Balkenhol N, Bolliger J et al (2019) Conservation genetics: linking science with practice. Mol Ecol 28:3848–3856. https://doi.org/10.1111/mec.15202
Holmgren M, Schnitzer SA (2004) Science on the rise in developing countries. PLOS Biol 2:e1. https://doi.org/10.1371/journal.pbio.0020001
Hu Y, Fan H, Chen Y et al (2021) Spatial patterns and conservation of genetic and phylogenetic diversity of wildlife in China. Sci Adv 7:eabd5725. https://doi.org/10.1126/sciadv.abd5725
Kadykalo AN, Buxton RT, Morrison P et al (2021) Bridging research and practice in conservation. Conserv Biol 35:1725–1737. https://doi.org/10.1111/cobi.13732
Keyghobadi NK (2007) The genetic implications of habitat fragmentation for animals. Can J Zool. https://doi.org/10.1139/Z07-095
Knutson MG, Sauer JR, Olsen DA et al (1999) Effects of Landscape Composition and Wetland Fragmentation on Frog and Toad Abundance and Species Richness in Iowa and Wisconsin, U.S.A. Conserv Biol 13:1437–1446. https://doi.org/10.1046/j.1523-1739.1999.98445.x
Konno K, Akasaka M, Koshida C et al (2020) Ignoring non-English-language studies may bias ecological meta-analyses. Ecol Evol 10:6373–6384. https://doi.org/10.1002/ece3.6368
Laurance WF, Useche DC (2009) Environmental synergisms and extinctions of tropical species. Conserv Biol 23:1427–1437. https://doi.org/10.1111/j.1523-1739.2009.01336.x
Lazzari J, Sato CF, Driscoll DA (2022) Traits influence reptile responses to fire in a fragmented agricultural landscape. Landsc Ecol 37:2363–2382. https://doi.org/10.1007/s10980-022-01417-9
Lê S, Josse J, Husson F (2008) FactoMineR: an R package for multivariate analysis. J Stat Softw 25:1–18. https://doi.org/10.18637/jss.v025.i01
Lebart L, Morineau A, Piron M (1995) Statistique exploratoire multidimensionnelle. Dunod Paris
Lindell CA, Riffell SK, Kaiser SA et al (2007) Edge responses of tropical and temperate birds. Wilson J Ornithol 119:205–220. https://doi.org/10.1676/05-133.1
Lindenmayer DB, Fischer J (2007) Tackling the habitat fragmentation panchreston. Trends Ecol Evol 22:127–132. https://doi.org/10.1016/j.tree.2006.11.006
Lowe WH, Allendorf FW (2010) What can genetics tell us about population connectivity? Mol Ecol 19:3038–3051. https://doi.org/10.1111/j.1365-294X.2010.04688.x
Mac Nally R, Brown GW (2001) Reptiles and habitat fragmentation in the box-ironbark forests of central Victoria, Australia: predictions, compositional change and faunal nestedness. Oecologia 128:116–125. https://doi.org/10.1007/s004420100632
MacDonald B, Lewison R, Madrak S et al (2012) Home ranges of East Pacific green turtles Chelonia mydas in a highly urbanized temperate foraging ground. Mar Ecol Prog Ser 461:211–221. https://doi.org/10.3354/meps09820
Manel S, Gaggiotti OE, Waples RS (2005) Assignment methods: matching biological questions with appropriate techniques. Trends Ecol Evol 20:136–142. https://doi.org/10.1016/j.tree.2004.12.004
Manel S, Holderegger R (2013) Ten years of landscape genetics. Trends Ecol Evol 28:614–621. https://doi.org/10.1016/j.tree.2013.05.012
Marques TA, Thomas L, Martin SW et al (2013) Estimating animal population density using passive acoustics. Biol Rev 88:287–309. https://doi.org/10.1111/brv.12001
Mazerolle MJ, Desrochers A (2005) Landscape resistance to frog movements. Can J Zool. https://doi.org/10.1139/z05-032
McDonald RI, Marcotullio PJ, Güneralp B (2013) Urbanization and Global Trends in Biodiversity and Ecosystem Services. In: Elmqvist T, Fragkias M, Goodness J et al (eds) Urbanization, Biodiversity and Ecosystem Services: Challenges and Opportunities: A Global Assessment. Springer, Dordrecht, pp 31–52
McRae BH, Dickson BG, Keitt TH, Shah VB (2008) Using circuit theory to model connectivity in ecology, evolution, and conservation. Ecology 89:2712–2724. https://doi.org/10.1890/07-1861.1
Meiri S, Bauer AM, Allison A et al (2018) Extinct, obscure or imaginary: the lizard species with the smallest ranges. Divers Distrib 24:262–273. https://doi.org/10.1111/ddi.12678
Melles SJ, Scarpone C, Julien A et al (2019) Diversity of practitioners publishing in five leading international journals of applied ecology and conservation biology, 1987–2015 relative to global biodiversity hotspots. Écoscience 26:323–340. https://doi.org/10.1080/11956860.2019.1645565
Mennill DJ, Battiston M, Wilson DR et al (2012) Field test of an affordable, portable, wireless microphone array for spatial monitoring of animal ecology and behaviour. Methods Ecol Evol 3:704–712. https://doi.org/10.1111/j.2041-210X.2012.00209.x
Meyer C, Kreft H, Guralnick R, Jetz W (2015) Global priorities for an effective information basis of biodiversity distributions. Nat Commun 6:8221. https://doi.org/10.1038/ncomms9221
Moher D, Liberati A, Tetzlaff J et al (2009) Preferred reporting items for systematic reviews and meta-analyses: the PRISMA statement. PLoS Med 6:e1000097. https://doi.org/10.1371/journal.pmed.1000097
Monteiro WP, Veiga JC, Silva AR et al (2019) Everything you always wanted to know about gene flow in tropical landscapes (but were afraid to ask). PeerJ 7:e6446. https://doi.org/10.7717/peerj.6446
Moreira LFB, Maltchik L (2014) Does organic agriculture benefit anuran diversity in rice fields? Wetlands 34:725–733. https://doi.org/10.1007/s13157-014-0537-y
Moura MR, Jetz W (2021) Shortfalls and opportunities in terrestrial vertebrate species discovery. Nat Ecol Evol 5:631–639. https://doi.org/10.1038/s41559-021-01411-5
Moura MR, Costa HC, Peixoto MA et al (2018) Geographical and socioeconomic determinants of species discovery trends in a biodiversity hotspot. Biol Conserv 220:237–244. https://doi.org/10.1016/j.biocon.2018.01.024
Newbold T, Hudson LN, Phillips HRP et al (2014) A global model of the response of tropical and sub-tropical forest biodiversity to anthropogenic pressures. Proc R Soc B Biol Sci 281:20141371. https://doi.org/10.1098/rspb.2014.1371
Newbold T, Hudson LN, Hill SLL et al (2015) Global effects of land use on local terrestrial biodiversity. Nature 520:45–50. https://doi.org/10.1038/nature14324
Newbold T, Oppenheimer P, Etard A, Williams JJ (2020) Tropical and Mediterranean biodiversity is disproportionately sensitive to land-use and climate change. Nat Ecol Evol 4:1630–1638. https://doi.org/10.1038/s41559-020-01303-0
Nogués-Bravo D, Veloz S, Holt BG et al (2016) Amplified plant turnover in response to climate change forecast by Late Quaternary records. Nat Clim Change 6:1115–1119. https://doi.org/10.1038/nclimate3146
Nowakowski AJ, Watling JI, Whitfield SM et al (2017) Tropical amphibians in shifting thermal landscapes under land-use and climate change. Conserv Biol 31:96–105. https://doi.org/10.1111/cobi.12769
Ofori-Boateng C, Oduro W, Hillers A et al (2013) Differences in the Effects of Selective Logging on Amphibian Assemblages in Three West African Forest Types. Biotropica 45:94–101. https://doi.org/10.1111/j.1744-7429.2012.00887.x
Pacioni C, Hunt H, Allentoft ME et al (2015) Genetic diversity loss in a biodiversity hotspot: ancient DNA quantifies genetic decline and former connectivity in a critically endangered marsupial. Mol Ecol 24:5813–5828. https://doi.org/10.1111/mec.13430
Palmeirim AF, Vieira MV, Peres CA (2017) Herpetofaunal responses to anthropogenic forest habitat modification across the neotropics: insights from partitioning β-diversity. Biodivers Conserv 26:2877–2891. https://doi.org/10.1007/s10531-017-1394-9
Peltzer PM, Lajmanovich RC, Attademo AM, Beltzer AH (2006) Diversity of anurans across agricultural ponds in Argentina. In: Hawksworth DL, Bull AT (eds) Marine, Freshwater, and Wetlands Biodiversity Conservation. Springer, Dordrecht, pp 131–145
Phillips SJ, Anderson RP, Dudík M et al (2017) Opening the black box: an open-source release of Maxent. Ecography 40:887–893. https://doi.org/10.1111/ecog.03049
Pilliod DS, Arkle RS, Robertson JM et al (2015) Effects of changing climate on aquatic habitat and connectivity for remnant populations of a wide-ranging frog species in an arid landscape. Ecol Evol 5:3979–3994. https://doi.org/10.1002/ece3.1634
Pittman SE, Semlitsch RD (2013) Habitat type and distance to edge affect movement behavior of juvenile pond-breeding salamanders. J Zool 291:154–162. https://doi.org/10.1111/jzo.12055
Price-Rees SJ, Brown GP, Shine R (2013) Spatial ecology of bluetongue lizards (Tiliqua spp.) in the Australian wet–dry tropics. Austral Ecol 38:493–503. https://doi.org/10.1111/j.1442-9993.2012.02439.x
Pyšek P, Richardson DM, Pergl J et al (2008) Geographical and taxonomic biases in invasion ecology. Trends Ecol Evol 23:237–244. https://doi.org/10.1016/j.tree.2008.02.002
R Core Team (2021) R: A language and environment for statistical computing
Ray N, Lehmann A, Joly P (2002) Modeling spatial distribution of amphibian populations: a GIS approach based on habitat matrix permeability. Biodivers Conserv 11:2143–2165. https://doi.org/10.1023/A:1021390527698
Riemann JC, Ndriantsoa SH, Raminosoa NR et al (2015) The value of forest fragments for maintaining amphibian diversity in Madagascar. Biol Conserv 191:707–715. https://doi.org/10.1016/j.biocon.2015.08.020
Riemann JC, Ndriantsoa SH, Rödel M-O, Glos J (2017) Functional diversity in a fragmented landscape — Habitat alterations affect functional trait composition of frog assemblages in Madagascar. Glob Ecol Conserv 10:173–183. https://doi.org/10.1016/j.gecco.2017.03.005
Riva F, Fahrig L (2022) Protecting many small patches will maximize biodiversity conservation for most taxa: the SS > SL principle. Preprints
Rivera-Ortíz FA, Aguilar R, Arizmendi MDC et al (2015) Habitat fragmentation and genetic variability of tetrapod populations. Anim Conserv 18:249–258. https://doi.org/10.1111/acv.12165
Rothermel BB, Semlitsch RD (2002) An Experimental investigation of landscape resistance of forest versus old-field habitats to emigrating juvenile amphibians. Conserv Biol 16:1324–1332. https://doi.org/10.1046/j.1523-1739.2002.01085.x
Roux BL, Rouanet H (2004) Geometric Data Analysis: From Correspondence Analysis to Structured Data Analysis. Springer Science, Dordrecht
Rytwinski T, Fahrig L (2012) Do species life history traits explain population responses to roads? A meta-analysis. Biol Conserv 147:87–98. https://doi.org/10.1016/j.biocon.2011.11.023
Safner T, Miaud C, Gaggiotti O et al (2011) Combining demography and genetic analysis to assess the population structure of an amphibian in a human-dominated landscape. Conserv Genet 12:161–173. https://doi.org/10.1007/s10592-010-0129-1
Segovia ALR, Romano D, Armsworth PR (2020) Who studies where? Boosting tropical conservation research where it is most needed. Front Ecol Environ 18:159–166. https://doi.org/10.1002/fee.2146
Seshadri KS (2014) Effects of Historical Selective Logging on Anuran Communities in a Wet Evergreen Forest, South India. Biotropica 46:615–623. https://doi.org/10.1111/btp.12141
Shaffer HB, Gidiş M, McCartney-Melstad E et al (2015) Conservation genetics and genomics of amphibians and reptiles. Annu Rev Anim Biosci 3:113–138. https://doi.org/10.1146/annurev-animal-022114-110920
Silva DJ, Palmeirim AF, Santos-Filho M et al (2022) Habitat Quality, Not Patch Size, Modulates Lizard Responses to Habitat Loss and Fragmentation in the Southwestern Amazon. J Herpetol 56:75–83. https://doi.org/10.1670/20-145
Smith MA, Green DM (2005) Dispersal and the metapopulation paradigm in amphibian ecology and conservation: are all amphibian populations metapopulations? Ecography 28:110–128. https://doi.org/10.1111/j.0906-7590.2005.04042.x
Smith AL, Landguth EL, Bull CM et al (2016) Dispersal responses override density effects on genetic diversity during post-disturbance succession. Proc R Soc B Biol Sci 283:20152934. https://doi.org/10.1098/rspb.2015.2934
Sodhi NS, Koh LP, Brook BW, Ng PKL (2004) Southeast Asian biodiversity: an impending disaster. Trends Ecol Evol 19:654–660. https://doi.org/10.1016/j.tree.2004.09.006
Sodhi NS, Bickford D, Diesmos AC et al (2008) Measuring the meltdown: drivers of global amphibian extinction and decline. PLoS ONE 3:e1636. https://doi.org/10.1371/journal.pone.0001636
Stevens GC (1989) The latitudinal gradient in geographical range: how so many species coexist in the tropics. Am Nat 133:240–256
Stuart SN, Chanson JS, Cox NA et al (2004) Status and trends of amphibian declines and extinctions worldwide. Science 306:1783–1786. https://doi.org/10.1126/science.1103538
Tan WC, Ginal P, Rhodin AGJ et al (2021) A present and future assessment of the effectiveness of existing reserves in preserving three critically endangered freshwater turtles in Southeast Asia and South Asia. Front Biogeogr. https://doi.org/10.21425/F5FBG50928
Thompson W (2013) Sampling Rare or Elusive Species: Concepts, Designs, and Techniques for Estimating Population Parameters. Island Press, Washington
Todd B, Willson J, Gibbons J (2010) The Global Status of Reptiles and Causes of Their Decline. Ecotoxicology of Amphibians and Reptiles. CRC Press, Boca Raton, pp 47–67
Trimble MJ, van Aarde RJ (2012) Geographical and taxonomic biases in research on biodiversity in human-modified landscapes. Ecosphere 3:art119. https://doi.org/10.1890/ES12-00299.1
Uetz P, Freed P, Aguilar R, Hošek J (2021) The Reptile Database. http://www.reptile-database.org/. Accessed 6 Mar 2021
Urbina-Cardona JN, Loyola RD (2008) Applying niche-based models to predict endangered-hylid potential distributions: are neotropical protected areas effective enough? Trop Conserv Sci 1:417–445. https://doi.org/10.1177/194008290800100408
Vallan D (2002) Effects of anthropogenic environmental changes on amphibian diversity in the rain forests of Eastern Madagascar. J Trop Ecol 18:725–742
Van Dyck H, Baguette M (2005) Dispersal behaviour in fragmented landscapes: routine or special movements? Basic Appl Ecol 6:535–545. https://doi.org/10.1016/j.baae.2005.03.005
van Eck NJ, Waltman L (2014) Visualizing Bibliometric Networks. In: Ding Y, Rousseau R, Wolfram D (eds) Measuring Scholarly Impact: Methods and Practice. Springer International Publishing, Cham, pp 285–320
Wang W, Feng C, Liu F, Li J (2020) Biodiversity conservation in China: a review of recent studies and practices. Environ Sci Ecotechnology 2:100025. https://doi.org/10.1016/j.ese.2020.100025
Ward JH (1963) Hierarchical grouping to optimize an objective function. J Am Stat Assoc 58:236–244. https://doi.org/10.1080/01621459.1963.10500845
Watling JI, Braga L (2015) Desiccation resistance explains amphibian distributions in a fragmented tropical forest landscape. Landsc Ecol 30:1449–1459. https://doi.org/10.1007/s10980-015-0198-0
Whitton FJS, Purvis A, Orme CDL, Olalla-Tárraga MÁ (2012) Understanding global patterns in amphibian geographic range size: does Rapoport rule? Glob Ecol Biogeogr 21:179–190. https://doi.org/10.1111/j.1466-8238.2011.00660.x
Wilson JN, Bekessy S, Parris KM et al (2013) Impacts of climate change and urban development on the spotted marsh frog (Limnodynastes tasmaniensis). Austral Ecol 38:11–22. https://doi.org/10.1111/j.1442-9993.2012.02365.x
Acknowledgements
W.C. Tan was supported financially through a scholarship by the German Academic Exchange Service (DAAD). This work would not be possible without M. Flecks for his invaluable technical assistance with the figures.
Funding
Open Access funding enabled and organized by Projekt DEAL.
Author information
Authors and Affiliations
Contributions
WCT, AH, and DR contributed to the study idea and conception. Literature search and data collection were performed by WCT and data analysis by DR and WCT. The first draft of the manuscript was written by WCT and all authors critically revised on later versions. All authors read and approved the final manuscript.
Corresponding author
Ethics declarations
Competing Interests
The authors declare no conflicts of interest.
Additional information
Communicated by Ricardo Correia.
Publisher's Note
Springer Nature remains neutral with regard to jurisdictional claims in published maps and institutional affiliations.
Online appendices
Below is the link to the electronic supplementary material.
Rights and permissions
Open Access This article is licensed under a Creative Commons Attribution 4.0 International License, which permits use, sharing, adaptation, distribution and reproduction in any medium or format, as long as you give appropriate credit to the original author(s) and the source, provide a link to the Creative Commons licence, and indicate if changes were made. The images or other third party material in this article are included in the article's Creative Commons licence, unless indicated otherwise in a credit line to the material. If material is not included in the article's Creative Commons licence and your intended use is not permitted by statutory regulation or exceeds the permitted use, you will need to obtain permission directly from the copyright holder. To view a copy of this licence, visit http://creativecommons.org/licenses/by/4.0/.
About this article

Cite this article
Tan, W.C., Herrel, A. & Rödder, D. A global analysis of habitat fragmentation research in reptiles and amphibians: what have we done so far?. Biodivers Conserv 32, 439–468 (2023). https://doi.org/10.1007/s10531-022-02530-6
Received:
Revised:
Accepted:
Published:
Issue Date:
DOI: https://doi.org/10.1007/s10531-022-02530-6