
Abstract
Accurate estimation of species richness is often complex as genetic divergence is not always accompanied by appreciable morphological differentiation. In consequence, cryptic lineages or species evolve. Cryptic speciation is common especially in taxa characterized by small and simplified bodies, what makes their proper identification challenging. The cereal rust mite, Abacarus hystrix, was regarded for a long time as a species associated with a wide range of grass hosts, whereas wide host ranges are rather rare in eriophyoid mites. Therefore, the generalist status of A. hystrix was questioned. In this paper we demonstrate that the diversity within Abacarus species associated with grasses is more complex than it was previously thought. The 78 Abacarus mtDNA COI sequences used in this study formed 10 highly supported clades (bootstrap value 99%) and four more distinct genetic lineages were represented by unique sequences. The genetic distances between them ranged from 6.6 to 26.5%. Moreover, morphological study and genetic approach based on the combination of the Poisson Tree Processes model for species delimitation (PTP) and a Bayesian implementation of PTP (bPTP), and Neighbour Joining analyses led to delimitation of a new species within the Abacarus complex: Abacarus plumiger, specialized on smooth brome (Bromus inermis). Furthermore, our analyses demonstrated a pattern of host-associated differentiation within the complex. Overall, our study indicates that cryptic speciation occurs in the grass-associated Abacarus genus, and suggests the need for more extensive sampling using integrative methods.
Introduction
The genetic divergence leading to speciation is not always accompanied by appreciable morphological differentiation. In consequence, cryptic lineages or species evolve and their occurrence, being often overlooked, contributes to the underestimation of species richness (Gerhardt 2005; Stuart et al. 2006; Bickford et al. 2007; Pfenninger and Schwenk 2007; Ceballos and Ehrlich 2009; Wan et al. 2014) and although cryptic species are widespread and common, the magnitude of cryptic diversity remains unknown (Bickford et al. 2007; Pfenninger and Schwenk 2007; Stork 2018). Recognition of the extent of hidden diversity within any taxonomic group is essential to assess its overall diversity and to understand the complexity of its ecological interactions and evolutionary histories (Bickford et al. 2007; Skoracka et al. 2015). Furthermore, evaluation of cryptic diversity is of special importance for conservation biology, as well as for research on parasites and agricultural pests (Liu et al. 2012; Poulin 2014).
Over the last 30 years, there has been an exponential increase in the number of studies that demonstrated the existence of cryptic diversity (Bickford et al. 2007; Poulin 2014; Espíndola et al. 2016; Živković et al. 2017). This rising trend is linked to increasing access to wide array of technologies that enable effective species delimitation. For example, employing super-resolution microscopy, such as electron or confocal microscopy, resulted in the deeper examination of morphology and ultrastructure details that could not be done with classical light microscopy (Chetverikov et al. 2013). Furthermore, increased access to molecular biology techniques had led to the development of barcoding procedures, which allowed fast species delimitation and discrimination on the genetic basis. As a result, many species that were initially described with traditional morphology-based methods as single taxonomic units, were later revealed to be complexes of cryptic species (Knowlton 1993; Funk et al. 2012; Skoracka et al. 2015). However, many of them, before correct identification with aid of genetic methods, had been suspected to be species complexes on the basis of their biological and ecological features (Henry and Wells 2010; Nygren et al. 2010; Skoracka and Dabert 2010).
Cryptic species are prevalent in taxa which are microscopic in size and have simplified bodies (Skoracka et al. 2015), and these characteristics may hinder their proper identification based on morphological techniques that are prevalent in taxonomy (de Lillo et al. 2010; Zhao et al. 2013; Stork 2018). Eriophyoid mites are characterized by their minute size and simplified body structure, and their accurate identification by morphological traits is demanding (Lindquist 1996). However, nowadays taxonomist are integrating the traditional morphology approach with molecular tools to discriminate between species and to describe new species (e.g., Chetverikov et al. 2013; de Lillo et al. 2018). This is especially important in basic and applied studies of economically important cryptic species, which may differ, for example, in capacity for pathogen transmission or pesticide resistance (Pan et al. 2011; Miller et al. 2012). Eriophyoid mites are obligatory phytophagous arthropods and are highly specialized to their hosts. They are known as significant plant pests worldwide, that cause either direct damage to their host plant or transmit plant viruses. Recent research suggests that cryptic diversity may be very common in eriophyoid mites. It was demonstrated that the grass-associated wheat curl mite (WCM), Aceria tosichella Keifer, Brassicaceae-associated Aceria mites, and coniferous-associated Trisetacus mites are complexes that consist of divergent lineages which probably are cryptic species (Skoracka et al. 2012; Lewandowski et al. 2014; Živković et al. 2017).
An intensively studied example of cryptic diversity in eriophyoid mites is the cereal rust mite, Abacarus hystrix Nalepa, that long has been regarded as a single species adapted to numerous Poaceae species, with a wide host range including both cultivated and wild grasses—e.g., Triticum aestivum L. (wheat), Secale cereale L. (rye), Oryza sativa L. (rice), Cynodon dactylon L. (Bermuda grass), Lolium perenne L. (perennial ryegrass), Bromus inermis Leyss. (smooth brome), Bromus hordeaceus L. (soft brome), Bromus erectus Huds. (meadow brome), Dactylis glomerata L. (cocksfoot grass) (Frost and Ridland 1996). Abacarus hystrix has been recognized as a common pest of cereal fields and grasslands in Eurasia, North America, temperate regions of Africa, Australia and New Zealand. Moreover, A. hystrix is known for its ability to transmit Ryegrass mosaic virus (RgMV) and Agropyron mosaic virus (AgMV) (Oldfield and Proeseler 1996, de Lillo and Skoracka 2010). Additionally, the mite has a capacity for rapid population growth and can build up to very high densities (Skoracka and Kuczyński 2004), what may boost mites’ dispersal and infestation of new grass hosts (Sabelis and Bruin 1996). Morphological examination of the cereal rust mite populations originating from three grass species (quackgrass, ryegrass and smooth brome) demonstrated that there is an apparent and discontinuous variation of body shape, length of setae and overall body size among host-associated mite populations (Skoracka et al. 2002), which could be explained by a phenotypic adaptation to the local host environment (Pegler et al. 2005), or might indicate partial or total genetic separation (host races or species) (Drès and Mallet 2002). Further studies revealed that quackgrass- and ryegrass-associated populations differ significantly in performance and acceptance of each other’s hosts. Specifically, reciprocal transfer of mite specimens between host species resulted in unsuccessful settlement on the novel host plant (Skoracka and Kuczyński 2006). Moreover, mites from different host populations quickly distinguished between their familiar host and unfamiliar hosts used by conspecific populations (Skoracka et al. 2007). All these findings suggested the narrow host specialization of studied host-populations of this putative generalist. Subsequently, pre- and post-zygotic barriers between these two populations were found, indicating the existence of reproductive isolation between them (Skoracka 2008). This pattern of sterility between ryegrass- and quackgrass-associated mites was confirmed by the differences in the mitochondrial DNA sequence of cytochrome oxidase subunit I (COI) gene and the nuclear sequence of D2 region of 28S rDNA (Skoracka and Dabert 2010). As the result of this integrative approach, which included genetic and morphometric analyses, host performance and preference tests, and reciprocal crosses, the population associated with ryegrass has been described as a new species Abacarus lolii Skoracka, a cryptic species of A. hystrix sensu lato (Skoracka 2009). Apart from the quackgrass and ryegrass populations of the cereal rust mite complex, morphometric and genetic studies included also the third population, which inhabited smooth brome (Skoracka et al. 2002; Skoracka and Dabert 2010). The analyses revealed significant discontinuous morphological variation between these three host-associated populations (Skoracka et al. 2002), which corresponded to an interspecific level of genetic variation in mtDNA COI (> 22%) (Skoracka and Dabert 2010). Moreover, the divergence in nuclear D2 region of 28S rDNA between smooth brome associated population and two other populations was > 2.5%, whereas the D2 distance of 0.2% had been experimentally designated as interspecific for A. hystrix sensu lato and A. lolii (Skoracka 2008, 2009; Skoracka and Dabert 2010). Therefore, the population from smooth brome was recognized as a new species awaiting a formal description (Skoracka and Dabert 2010).
In addition, Skoracka and Dabert (2010) observed further delineation within quackgrass- and brome-associated populations in both mitochondrial and nuclear gene fragments, wherein a well-supported split on COI gene within the brome population was supported by differences in their amino acid sequences. Moreover, some sequences of brome-associated mites clustered on the D2 28S rDNA tree together with Abacarus acutatus Sukhareva, another grass-inhabiting eriophyoid species. This unresolved relationship between A. hystrix and A. acutatus led to the conclusion that the whole grass-associated Abacarus genus complex needs revision (Skoracka and Dabert 2010). Overall, these analyses showed that A. hystrix does not exist as a monophyletic taxon and the diversity of the whole grass-associated Abacarus genus complex may be higher than it was thought to be, whereas DNA barcoding based on mtDNA COI is a valuable tool for identification of morphologically similar eriophyoid species. Mitochondrial genes, especially COI gene, are known to be, in general, good indicators of recent diversification events, as well as a useful tool for identification at species-level resolution (Hebert et al. 2003a, b). Mitochondrial barcodes, along with variety of nuclear markers, became important supplement for animal species descriptions and taxonomic workflow (Hubert and Hanner 2015).
In this study, we continue the exploration of hidden diversity within the grass-associated Abacarus genus members, based on additional genetic information. Specifically, we ask what the extent of putative species boundaries within grass-associated Abacarus complex is and whether there is a host-associated genetic differentiation within the complex. We reveal high cryptic diversity within Abacarus spp. and discuss their host associations. We also proceed the story by describing the new species associated with smooth brome, on the basis of standard morphological characters and DNA barcode data (mtDNA COI and 28S rDNA D2) obtained from the type material of the new species.
Materials and methods
Sampling
Plant samples were collected mostly in Poland, but also in Finland, Lithuania and Turkey, from 18 grass species (Table 1). Plants were transported to the laboratory, where they were inspected for the presence of mites directly with a stereo-microscope. Mite specimens from the inspected leaves were transferred using an eyelash or thin insect pin glued to a dissecting needle to (1) Eppendorf tubes with 180 µL of ATL buffer (extraction buffer) (Qiagen, Hilden, Germany) for molecular analysis, and (2) microscope slides, mounted in modified Berlese medium (Monfreda et al. 2010) in dorsoventral orientation. After DNA extractions, the mite exoskeletons were also mounted on slides for additional identification.
DNA analyses
DNA was extracted according to method described by Dabert et al. (2008). The cytochrome oxidase subunit I (COI) gene fragment was amplified by PCR with the degenerate primers: bcdF01 (5′-CATTTTCHACTAAYCATAARGATATTGG-3′) and bcdR04 (5′-TATAAACYTCDGGATGNCCAAAAAA-3′). PCRs were carried out in 10 µL reaction volumes containing 5 µL of Type-it Multiplex PCR Master Mix (2 × MM) (Qiagen), 0.5 µM of each primer and 4 µL of DNA template using a thermocycling profile of one cycle of 5 min at 95 °C followed by 35 steps of 30 s at 95 °C, 90 s at 50 °C, 60 s at 72 °C, with a final step of 15 min at 72 °C. After amplification, reaction product was diluted twofold and 5 µL were analyzed by electrophoresis on a 1% agarose gel stained with ethidium bromide or with addition of GelRed (Biotum, Hayward, CA, USA) to assess the product size and concentration. Then, the sample was either sequenced directly in both directions using 1–5 µL of the PCR product and 50 pmol of PCR primer, or after an enzymatic clean-up, using 15 pmol of primer and approximately 30 ng of PCR product. Amplification of the ca. 600 bp D2 region in 28S rDNA was performed using the primers D1D2fw2 (Sonnenberg et al. 2007) and 28SR0990 (Mironov et al. 2012) and followed the same protocol as COI amplification reaction, except for primers amount, which was 0.25 µM each. Products were sequenced in both directions with PCR primers and with specific sequencing primers Er28SF05 and Er28SR05 (Szydło et al. 2015). Sequencing was performed using BigDye Terminator v.3.1 chemistry (Applied Biosystems, Foster City, CA, USA) and analyzed on an ABI Prism 3130xl Genetic Analyzer (Applied Biosystems). Trace files were checked and edited using MEGA6 (Tamura et al. 2013).
Newly generated 59 mitochondrial Abacarus COI sequences were combined with 23 previously published in NCBI GenBank database (till August 2017) COI sequences of grass-associated Abacarus (Skoracka and Dabert 2010; Szydło et al. 2015; Xue et al. 2017) and outgroup Trisetacus silvestris Castagnoli data (GenBank Acc. No. KC776553.1; Lewandowski et al. 2014) for analysis (Table 1). Sequences were aligned using the ClustalW algorithm (Higgins et al. 1996) implemented in MEGA6, and the final datasets contained 82 Abacarus COI sequences (603 bp) of mites from 18 identified grass species, one unknown grass species and five countries (Table 1).
Alignment reliability and product authenticity of COI sequences was validated by translating aligned DNA sequences into amino acids and assessing the alignments for premature stop codons. For COI dataset, neighbor-joining (NJ) tree with 1000 bootstrap replicates was constructed using the Kimura 2-parameter model (Kimura 1980). Additionally, maximum likelihood (ML) analysis was done using GTR + G + I model as selected by Modeltest v.2.1.3 (Guindon and Gascuel 2003; Darriba et al. 2012) according to the Akaike and Bayesian information criteria (AIC, BIC).
The D2 sequence of the new species was aligned with corresponding sequences from the study by Skoracka and Dabert (2010) that fell into to the clade investigated as a putative species of Abacarus complex from smooth brome, and with Abacarus longilobus Skoracka, a sister species of the new species. These sequences were downloaded from Genbank (FJ392672, FJ392673, FJ392674, KC776553, respectively).
Pairwise mean genetic distances between clades were calculated for COI and D2 datasets with the Kimura 2-parameter model (K2P) (Kimura 1980). Mean K2P genetic distances within clades were calculated for COI dataset, and standard error estimates were obtained by a bootstrap procedure (1000 replicates). All above analyses were done in MEGA6. To confirm the presence of Abacarus species we applied the combination of the Poisson Tree Processes model for species delimitation (PTP) and a Bayesian implementation of PTP (bPTP). This approach allows to infer putative species boundaries on a given phylogenetic input tree (Zhang et al. 2013). The analysis was done with bPTP server (bPTP server: a Bayesian implementation of the PTP model for species delimitation, http://species.h-its.org/ptp/). The input tree for bPTP model was obtained by Bayesian inference approach with codon partitioning. The Hasegawa-Kishino-Yano (Hasegawa et al. 1985) substitution model with proportion of invariable sites (I) (Shoemaker and Fitch 1989) and gamma distributed rate of variation among sites (G) (Yang 1994) (HKY + I + G) was applied to the first and second codon positions in sequences, and General Time Reversible model (Tavaré 1986) with I and G (GTR + I + G) was applied to the third position of each codon. The analysis was run with MrBayes v.3.2 software (Ronquist et al. 2012) as two parallel runs with four chains (three heated and one cold chain), with G and I estimated during the analysis for each model. The analysis was run for 560,000 generations, until the average standard deviation of split frequencies value for runs was less than 0.01. When the convergence was reached, the analysis was stopped, 25% of first trees were discarded from results, and consensus tree with posterior probabilities was generated. The Monte Carlo sampler for the PTP model was applied to the tree with following parameters: 200,000 generations; thinning: 100; burnin: 0.1 and seed: 123.
Morphological analyses
Mites were studied with a phase-contrast microscope Olympus BX41. All specimens were taxonomically identified on the basis on apparent morphological characteristics as belonging to Abacarus genus complex (Sukhareva 1985; Nalepa 1896; Skoracka et al. 2002). Specimens of a newly described species were measured. Morphological nomenclature follows Lindquist (1996), data measurements follow Amrine and Manson (1996), and systematic classification follows Amrine et al. (2003). Measurements are given in micrometers. Measurements refer to the lengths of each structure unless otherwise stated. Positions of leg setae were measured from the proximal margin of the seta-bearing segment. Locations of ventral setae c2, d, e, and f on ventral annuli were measured from the posterior margin of coxae II. The length of prodorsal shield was measured from the anterior margin of frontal lobe to the posterior margin of shield. The distance between setae was measured as the distance between the center of tubercles. The holotype female measurement precedes the corresponding range for paratypes (given in parentheses). For adult males and nymph instar only the ranges are given. The means of the measurements are given in Table 3. Scanning electron micrographs (SEM) were taken in the Institute of Plant Protection, Poznań, Poland using Hitachi S3000N, uncoated specimen photographed at − 20 °C and 60 Pa.
Results
Genetic differentiation within the Abacarus complex
The final COI dataset consisted of 83 aligned sequences which represented 82 ingroup populations of grass-associated Abacarus mites (Table 1), and one outgroup. The 78 sequences of Abacarus formed 10 highly supported clades (bootstrap value: 99%) and four remaining sequences represented distinct genetic lineages (Fig. 1). Relationships between lineages were not fully resolved. The genetic distances between lineages ranged from 6.6 to 26.5% (Table 2). The PTP/bPTP analyses’ results were consistent with NJ structuring and identified 14 lineages as putative species (Fig. 2).

Neighbor-joining tree constructed using the Kimura 2-parameter model for mtDNA COI sequences of the Abacarus complex and outgroup species. Values above the branches represent bootstrap-measured support (1000 replicates) equal to or higher than 60. Maximum likelihood analysis resulted in concordant topology in defining species groups. Colors represent different genetic lineages/species: yellow—Abacarus acutatus; azure—Abacarus sp. collected in Turkey; blue—Abacarus hystrix complex 1 and 2; brown—Abacarus sp. 1; burgundy—Abacarus sp. 2; red—Abacarus plumiger n. sp.; green—Abacarus longilobus; pink—Abacarus sp. 3; lilac—Abacarus sp. 4; light brown—Abacarus sp. 5; dark yellow—Abacarus sp. 6; navy blue—Abacarus lolii; purple—Abacarus sp. 7. Symbols on the tips of branches correspond to host plant species. (Color figure online)

Combined Poisson Tree Processes model for species delimitation (PTP) and a Bayesian implementation of PTP (bPTP) confirming putative species groups within the Abacarus complex and identifying additional putative species groups within A. hystrix complex 2 and A. acutatus. Blue lines indicate the unique species groups and red clades indicate species groups containing more than one haplotypes. Numbers above the branches are Bayesian posterior probabilities; only values > 0.8 are shown. Vertical lines are marked to species: yellow—Abacarus acutatus; azure—Abacarus sp. collected in Turkey; blue—Abacarus hystrix complex 1 and 2; brown—Abacarus sp. 1; burgundy—Abacarus sp. 2; red—Abacarus plumiger n. sp.; green—Abacarus longilobus; pink—Abacarus sp. 3; lilac—Abacarus sp. 4; light brown—Abacarus sp. 5; dark yellow—Abacarus sp. 6; navy blue—Abacarus lolii; purple—Abacarus sp. 7. Genbank accession numbers are shown on the branches. (Color figure online)
The NJ analysis of partial COI gene confirmed the monophyly of four already described species within the complex: A. lolii, A. longilobus, A. hystrix and A. acutatus. Additionally, high genetic differentiation was detected within A. hystrix and A. acutatus, with the mean (± SE) level of intra-clade genetic variation at 6.1 ± 0.7% and 6.7 ± 0.6%, and additional delineation detected within these taxa by PTP/bPTP analysis (Fig. 2). Within A. hystrix, two clades are apparent (Abacarus hystrix 1 and Abacarus hystrix 2, each with the support of 99%) with the COI distance between them of 18.1 ± 1.9%. Maximum likelihood analysis resulted in concordant topology in defining species groups. The PTP/bPTP analysis revealed one additional clade (putative species) within Abacarus hystrix 2 and seven clades within A. acutatus (Fig. 2).
All analyses (genetic trees and distances) confirmed the divergence of five other clades (Abacarus sp. collected in Turkey, Abacarus sp. 4, 6, and 7, and A. plumiger, described during this study) and four lineages represented by single sequences (Abacarus sp. 1, 2, 3, and 5).
The pattern of host-associated differentiation was observed within the complex (Fig. 1). Abacarus acutatus was associated predominantly with plants from Calamagrostis genus, and one population was found on Echinochloa crus-galli (L.) P.Beauv. Abacarus hystrix group (both Abacarus hystrix 1 and Abacarus hystrix 2) was the most polyphagous taxon, found on quackgrass, wall barley, wheat and triticale. It was the only lineage associated with cereals. Abacarus sp. 1 was represented by the sequence from a mite population collected from an unknown host plant in China, which had been identified by the authors as A. hystrix (GenBank Acc. No. KM111087). However, it is highly divergent from other Abacarus sequences, including A. hystrix sensu lato (> 21%). Abacarus sp. 2, found on Bromus hordeaceus (soft brome), also represented a divergent lineage (> 20%). The new Abacarus species (plumiger) collected from Bromus inermis (smooth brome) was a sister clade (99% bootstrap support) to A. longilobus clade, a species associated with Dactylis glomerata (cocksfoot grass) and Bromus erectus (meadow brome). Interestingly, smooth brome was also host to another species, highly diverged from A. plumiger (mean ± SE = 23.9 ± 2.3%). Abacarus lolii was associated exclusively with Lolium perenne (perennial ryegrass), and its sequences formed a highly supported clade. The analyses pointed out four more distinct Abacarus lineages that were associated with plants of the genera Festuca, Brachypodium, Phleum, and Anthoxantum (Fig. 1).
New species within the Abacarus complex
-
Superfamily ERIOPHYOIDEA Nalepa, 1898.
-
Family ERIOPHYIDAE Nalepa, 1898.
-
Subfamily PHYLLOCOPTINAE Nalepa, 1892.
-
Tribe ANTHOCOPTINI Amrine and Stasny, 1994.
-
Genus Abacarus Keifer, 1944.
-
Abacarus plumiger n. sp. Laska, Majer, Szydło & Skoracka (Figs. 3, 4; Table 3).
Fig. 3 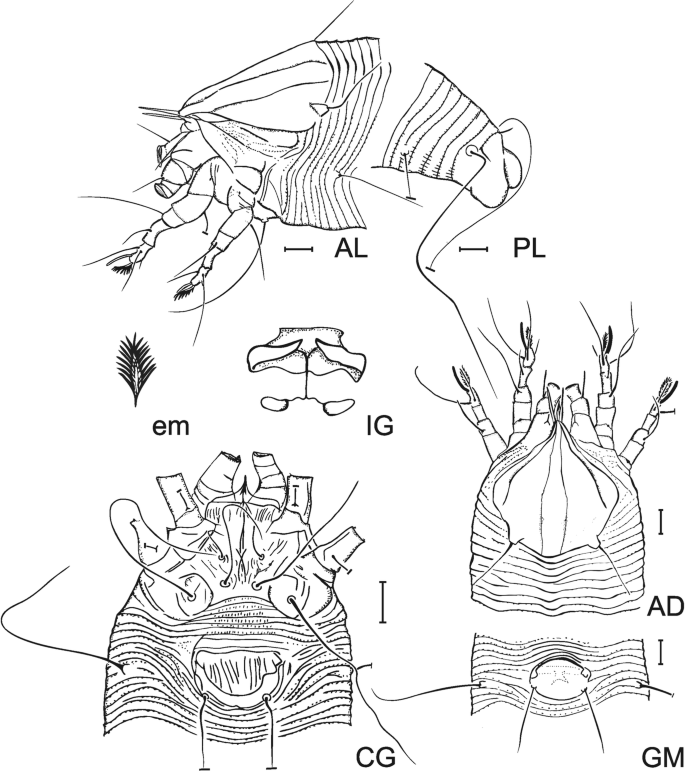
Abacarus plumiger n. sp. female: AL—antero-lateral view; PL—postero-lateral view; em—empodium (enlarged); IG—internal genitalia (enlarged); AD—antero-dorsal view; CG—coxisternal and genital region; male: GM—genital region. Scale bars are 10 μm
Fig. 4 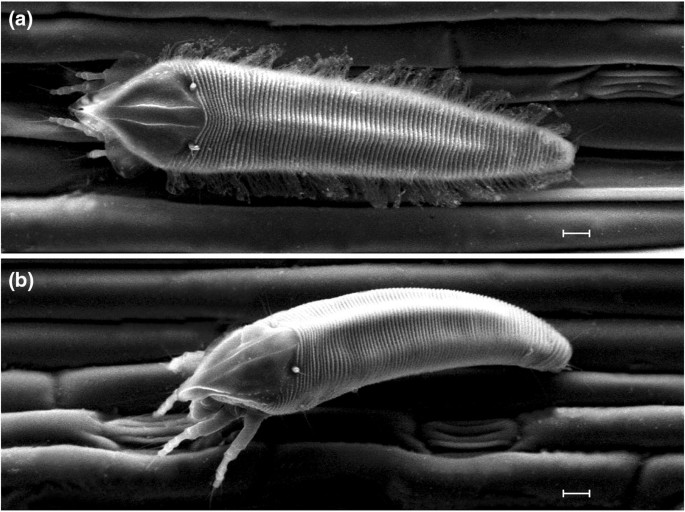
Abacarus plumiger n. sp. scanning electron micrographs. Scale bars are 10 μm. a Female, dorsal view; b male, latero-dorsal view
Table 3 Morphological measurements (μm) of females, males, and nymphs of Abacarus pulmiger n. sp


Female (holotype and 29 paratypes)—Body spindleform with narrow middle dorsal ridge in opisthosoma, reaching ¾ part of the body. Body 257 (209–329); width 56 (52–59). Gnathosoma curved downward, 27 (26–29), dorsal pedipalpal genual setae d 12 (11–13), setae ep 3 (3), cheliceral stylets 21 (17–22). Prodorsal shield subtriangular, 56 (51–60), 48 (43–53) wide, with frontal lobe over base of chelicerae. Shield pattern: median line absent; admedian lines entire, reach submedian lines anteriorly; submedian subparallel to lateral margin of shield. Tubercles of setae sc at rear shield margin, basal axes transverse, setae sc 27 (21–36), 31 (26–35) apart. Legs with all usual segments and setae present. Leg I 39 (37–40); femur 12 (10–12), setae bv 18 (16–19); genu 7 (6–7), setae l″ 35 (35–39); tibia 10 (10), setae l′ 12 (10–12); tarsus 8 (7–10), setae: ft″ 23 (2–27), ft′ 21 (19–22), u′ 7 (6–8); solenidion w 11 (10–12); empodium 12 (10–12), simple, bilaterally symmetrical, with 8 (8–9) paired rays. Leg II 33 (33–36); femur 10 (10–11), setae bv 19 (14–24); genu 6 (5–7), setae l″ 16 (13–19); tibia 8 (7–9); tarsus 9 (8–10), setae ft″ 33 (26–32), ft′ 12 (10–13), u′ 7 (6–8); solenidion w 12 (10–12); empodium 11 (10–12), simple, bilaterally symmetrical, with 8 (8–9) paired rays. Coxal plates with irregular dashes. Setae 1b 9 (8–10), 12 (10–14) apart; setae 1a 41 (38–42), 10 (8–10) apart; setae 2a 57 (46–65), 29 (26–29) apart; distance between setae 1b and 1a 7 (7–8), distance between setae 1a and 2a 9 (8–10). Genital opening 17 (14–18), 25 (22–28) wide, genital coverflap semicircular, 17 (14–18) long, 25 (22–28) wide, with 13 (13–14) longitudinal ridges. Internal genitalia: oval spermathecae, filamentous spermathecal tubes, and trapezoidal anterior genital apodeme with 13 (13–14) longitudinal ridges; setae 3a 48 (46–64), 19 (16–22) apart. Opisthosoma with 60th (60th–74th) dorsal annuli with minute conical microtubercles, pointed on the posterior annuli; 76 (70–90) ventral annuli with minute microtubercles, 7 (6–7) semiannuli between coxae and genital coverflap. Setae c2 48 (43–59), 55 (50–57) apart, on 8th (7th–9th) annulus; setae d 50 (40–72), 31 (32–36) apart, on 20th (19th–21st) annulus; setae e 48 (36–61), 13 (13–15) apart, on 40th (40th–44th) annulus; setae f 35 (27–45), 22 (20–23) apart, on 71st (65th–84th) annulus, 5th (5th–6th) annulus from rear. Setae h1 8 (6–9), 10 (6–10) apart; setae h2 102 (78–110), 12 (10–12) apart; distance between h1 and h2 2 (2).
Male (n = 11)—Body (180–228) spindleform with narrow middle dorsal ridge in opisthosoma, reaching ¾ part of the body; width (53–59). Gnathosoma curved downward, (23–27), dorsal pedipalpal genual setae d (10–12), setae ep 3 (2–3), cheliceral stylets (11–17). Prodorsal shield subtriangular, (44–50), (40–46) wide, with frontal lobe over base of chelicerae. Shield pattern: median line absent; admedian lines entire, reach submedian lines anteriorly; submedian subparallel to lateral margin of shield. Tubercles of setae sc at rear shield margin, basal axes transverse, (24–29) apart, setae sc (15–25). Legs with all usual segments and setae present. Leg I (31–36); femur (9–11), setae bv (11–15); genu (5–7), setae l″ (26–32); tibia (6–8), setae l′ (9–13); tarsus (7–8), setae ft″ (25–30), ft′ (20–28), u′ (6–8); solenidion w (8–11); empodium (7–10), simple, bilaterally symmetrical, with 8 (8–9) paired rays. Leg II (28–33); femur (9–11), setae bv (19–25); genu (5–7), setae l″ (12–16); tibia (5–7); tarsus (6–8), setae ft″ (24–30), ft′ (9–12), u′ (6–8); solenidion w (9–11); empodium (7–11), simple, bilaterally symmetrical, with 8 (8–9) paired rays. Coxal plates with irregular dashes. Setae 1b (8–10), (10–13) apart; setae 1a (18–27), (7–13) apart; setae 2a (33–47), (21–26) apart; distance between setae 1b and 1a (6–9), distance between setae 1a and 2a (8–9). Genital opening (11–14), (20–22) wide; setae 3a (25–32), (17–19) apart. Opisthosoma with (52nd–73rd) dorsal annuli with minute conical microtubercles, pointed on the posterior annuli; (57–74) ventral annuli with minute microtubercles. Setae c2 (40–51), (50–56) apart, on (8th–10th) annulus; setae d (41–52), (32–37) apart, on (18th–23rd) annulus; setae e (25–33), (12–16) apart, on (31st–40th) annulus; setae f (32–41), (21–26) apart, on (52nd–68th) annulus, (5th–6th) annulus from rear. Setae h1 (5–7), (5–8) apart; setae h2 (62–102), (7–12) apart; distance between h1 and h2 (2–4).
Nymph (n = 5)—Body (167–204); width (47–53). Gnathosoma curved downward, (17–23), dorsal pedipalpal genual setae d (8–9), setae ep 2 (2), cheliceral stylets (11–19). Prodorsal shield subtriangular, (38–44), (36–40) wide, with frontal lobe over base of chelicerae. Shield pattern: median line absent; admedian lines entire, reach submedian lines anteriorly; submedian subparallel to lateral margin of shield. Tubercles of setae sc at rear shield margin, basal axes transverse, (19–22) apart, setae sc (9–11). Legs with all usual segments and setae present. Leg I (24–26); femur (7–10), setae bv (7–10); genu (4–5), setae l″ (23–27); tibia (4–5), setae l′ (7–8); tarsus (6–7), setae ft″ (17–21), ft′ (15–20), u′ (5–7); solenidion w (9); empodium (6–7), simple, bilaterally symmetrical, with 8 (8–9) paired rays. Leg II (23–26); femur (7–8), setae bv (12–15); genu (4–5), setae l″ (11–15); tibia (4–5); tarsus (5–6), setae ft″ (18–22), ft′ (6–8), u′ (4–5); solenidion w (8–9); empodium (6), simple, bilaterally symmetrical, with 8 (8–9) paired rays. Coxal plates with irregular dashes. Setae 1b (5–8), (10) apart; setae 1a (12–14), (7–9) apart; setae 2a (30–40), (22–26) apart; distance between setae 1b and 1a (7–8), distance between setae 1a and 2a (8–10). Setae 3a (10–17), (9–10) apart. Opisthosoma with (68th–73th) dorsal annuli with minute conical microtubercles, pointed on the posterior annuli; (65) ventral annuli with pointed microtubercles. Setae c2 (25–35), (45–52) apart, on (9th–10th) annulus; setae d (23–30), (24–30) apart, on (23rd–24th) annulus; setae e (11–13), (12–14) apart, on (37th–38th) annulus; setae f (22–25), (17–22) apart, on (60th–61st) annulus, (5th–6th) annulus from rear. Setae h1 (3–4), (6) apart; setae h2 (55–70), (9–10) apart; distance between h1 and h2 (2).
Type material—Holotype female and paratypes: 29 females, 11 males, 5 nymphs, collected from Bromus inermis (Leyss) (Poaceae) in Poznań, Poland (52.46 N, 16.93E). Leg. A. Skoracka, M. Hornyák. DNA barcode: 603-bp fragment of the cytochrome oxidase subunit I (COI) gene (Genbank Acc. No. MG267341), 509-bp fragment of the 28S rDNA D2 fragment (Genbank Acc. No. MG773120). Material is deposited in the collection of the Faculty of Biology, Adam Mickiewicz University in Poznań, Poland.
Etymology—Plumiger: feathered, covered with feathers, feather-bearing; the specific name (adjective in the nominative case, masculine) is derived from characteristic feather-like wax structures on both sides of the opisthosoma and on the lateral margins of the prodorsal shield in adult females (Fig. 4).
Relation to host—Mites are vagrants, living in the furrows of the upper leaf surface.
Differential diagnosis—The new species is similar to other grass-associated Abacarus species, with similarity of spindleform body, dorsomedian ridge on opisthosoma, triangular prodorsal shield with a pattern of the lack of median line and two parallel admedian lines present, and 8–9 empodial rays. The new species can be differentiated from its sister species A. longilobus (distance in mtDNA COI: mean ± SE = 6.9 ± 1.1%; distance in 28S rDNA D2: 1.8 ± 0.6%) by the complete admedian lines (in A. longilobus, admedian lines are incomplete in rear half of prodorsal shield), longer sc setae (21–36 in A. plumiger, 8–12 in A. longilobus), and dorsal microtubercles present on the whole annuli, whereas in A. longilobus they are present only on ridges. In addition, both species differ in the shape of prodorsal shield lobe (it is triangular in its anterior part in A. longilobus and spike-like in A. plumiger). Suboral plate is semicircular and irregularly dashed in A. longilobus, whereas it is picked in A. plumiger with dashes parallel vertically. New species is also unique among other species from Abacarus complex by producing long feather-like wax structures at the margins of prodorsal shield. It also produces long wax filaments at the lateral parts of opisthosoma (Fig. 4a), much longer than A. hystrix, which also produces wax on its middle ridge (Skoracka 2009).
Discussion
Cryptic speciation is a common phenomenon in all mite taxa (Skoracka et al. 2015; Coimbra-Dores et al. 2016; García-Jiménez et al. 2017; de Rojas et al. 2018; Stork 2018), including obligatory phytophagous eriophyoid mites (Lewandowski et al. 2014; Cvrković et al. 2016). Our study also contributed to disclosing mites’ cryptic diversity by demonstrating the existence of highly diverse lineages within the formerly described eriophyoid A. hystrix complex, that exhibit genetic variation along with variation in host use. Therefore, further consideration of A. hystrix status as a generalist species can be questioned. Additionally, the results presented here identified another member of the complex, A. plumiger, and at least seven additional genetic lineages within the complex that are putative separate species (Abacarus sp. 1–7; Fig. 2).
Members of the Abacarus genus are worldwide distributed and, so far, 65 species have been described. Among them, 37 species are specialized to monocotyledons, mainly grasses, and 29 to dicotyledonous plants (Amrine and Stasny 1994; J. Amrine unpublished eriophyoid database). Our analysis revealed that the genetic variation of grass-associated Abacarus members is much higher than anticipated, and suggests that the whole genus may need further integrative taxonomic research.
Accurate identification of cryptic species within eriophyoid mites is important especially in those taxa that are under scrutiny because of their virus transmission capacity, invasive potential and host range that involves economically important plants, such us, for example, cereals. Their proper identification helps to understand their potential environmental impact (Skoracka et al. 2012, 2014a, b, 2017; Miller et al. 2013) and mitochondrial COI DNA barcoding is a valuable tool assisting in such biodiversity and applied research (Hebert et al. 2003a, b). Previous barcoding studies on Eriophyoidea delineated the genetic distances in COI genes as good estimators of interspecific variation. For example, the K2P distance in COI gene between morphologically similar grass-associated A. tosichella (WCM) and Amaryllidaceae-associated Aceria tulipae (Keifer) was estimated to be ca. 14% (Skoracka et al. 2014a), whereas the distances among lineages of the WCM species complex were ca. 16% (Skoracka et al. 2014b; Szydło et al. 2015). The study investigating various coniferous-associated eriophyoid species of the Trisetacus genus revealed a similar range of interspecific variation at 17–20% uncorrected distance (Lewandowski et al. 2014). The extensive research on 73 species from all three eriophyoid families (Diptilomiopidae, Eriophyidae and Phytoptidae) demonstrated the COI genetic distance between species at the range 11.8–36.6% (Chetverikov et al. 2015). Results obtained in this study showed that divergence between Abacarus lineages in COI gene ranged from 6.6 to 26.5% (Table 2), with the distance between the newly described species A. plumiger and A. lolii, A. hystrix, A. acutatus ranging from ca. 20 to 26%. Such a distance corresponds with interspecific genetic levels pointed out by the above-mentioned studies in eriophyoid mites and by studies on other mite taxa in the same gene, e.g., 7.3–18.3% K2P distance in an Oligonychus spider mite (Tetranychidae) (Matsuda et al. 2012), ca. 19% uncorrected distance in a Panonychus spider mite (Toda et al. 2000), ca. 11–27% K2P in some water mites (Hydrachnidia) (Stålstedt et al. 2013), ca. 14–27% K2P distance in astigmatid mites (Yang et al. 2011), and a mean 14.8% K2P distance between two Glaucales feather mite species (Analgoidea) (Dabert et al. 2008).
In addition to genetic differentiation within the grass-associated Abacarus complex, the lineages within the complex differ in their host range width. Some of the Abacarus lineages in this study were specialized toward one or few closely related plant species (e.g., A. plumiger, A. lolii, Abacarus sp. 6, Abacarus sp. collected in Turkey), whereas others were associated with several host plant species (A. acutatus, A. longilobus). A similar situation, in which some genetic lineages within a species complex are specialists and others seem to be rather generalists, has already been noticed in eriophyoid mites, specifically in WCM (Skoracka et al. 2013). WCM is a grass-associated eriophyoid mite that was for a long time considered as a generalist species hosted by about 100 species of grasses, including cereals (Navia et al. 2013). This unusually wide host range of a mite that belongs to a taxon generally reported to be highly host-specialized, was then questioned (Skoracka et al. 2010; Navia et al. 2013). Recent studies revealed that WCM is in fact a species complex that consists of several genetic lineages (probably cryptic species). Indeed, some of the lineages seem to be specialized to one or few closely related host plant species, whereas several lineages turned out to be generalists. Overall, the WCM complex lineages differ in their host specificity, invasive potential and capacity to transmit viruses (Miller et al. 2012; Skoracka et al. 2012, 2013, 2014a, b, 2017; Kuczyński et al. 2016; Wosula et al. 2016). Analogously, we can suspect that such different host-use strategies (narrow and broad specialization) are present within grass-associated Abacarus complex. Such differential host specialization can be expected based on the variation in life-history strategies of host plant species. Some of the hosts are annual (e.g., wheat, Triticosecale Wittm. ex A.Camus) and others are perennial (e.g., Elymus repens (L.) Gould, Bromus inermis Leyss.) (Hubbard et al. 1992). The difference in life-history strategy between plant species can be crucial for the evolution of eriophyoid mites’ host specificity. Annual grasses, such as cereals, which are harvested (semi-)annually, create less stable and less constant environments when compared to perennials. In consequence, mites which feed on annual grasses may be adapted to a broader host range, because in some seasons their annual and primary host is unavailable. This strategy might allow mites to find a suitable host through the whole year, without the necessity to produce an overwintering deutogynous stage, as is known for many eriophyoid species inhabiting deciduous plants (Manson and Oldfield 1996). In this way, annuality can be a driver for host generalization. Our results lend some support for this hypothesis: A. hystrix sensu lato (specifically Abacarus species collected in Turkey, Abacarus complex 1, and Abacarus complex 2; Fig. 1) feed on both short- and long-lived plants that give them opportunity for population persistence all over the year. The opposite strategy was observed in other lineages within the Abacarus complex (specifically A. longilobus, A. plumiger. A. lolii and Abacarus sp. 1–7; Fig. 1) which were associated exclusively with perennials. These species may be highly specific to their host due to its availability during the year.
In our study, dealing with diversity within the grass-infesting Abacarus species complex, we were able to distinguish several lineages within sampled populations. However, relationships between them remain unresolved. Future phylogenetic study should employ several more nuclear and mitochondrial markers, or preferably the whole genomes, and more extensive sampling within the genus complex to address the phylogenetic story of this taxon. Moreover, we recommend to include Abacarus species that are associated with dicotyledonous host plants to test the monophyly of the genus and relationships between Abacarus spp. hosted by mono- and dicotyledonous plants. Furthermore, the occurrence on the same host plant species (smooth brome) of two lineages in this study—A. plumiger and Abacarus sp. 7—warrants deeper investigation. According to the competitive exclusion principle, species competing for the same limited resource (host plant in this case) cannot coexist at constant population values (Hardin 1960). It is striking that such potentially close species (in terms of their genetic variation and ecology) inhabit the same environment, hence their phylogenetic relatedness, possibility of hybridization, and competitive behavior should be examined.
Scientists suggest that cryptic speciation is common among formerly described species and extensive sampling, using integrative approach, may help to reveal cryptic speciation and report biodiversity (Skoracka et al. 2015; Stork, 2018). Extensive sampling and examination of the Abacarus complex genetic diversity, as an effort of our study, pointed out nine new putative species, including the description of one of them—Abacarus plumiger—and set the path for further studies of Abacarus genus.
Data availability
The nucleotide sequences analyzed during the current study are available in GenBank repository (Accession Numbers MG267316-MG267374, MG773120).
References
Amrine JW, Manson DCM (1996) Preparation, mounting and descriptive study of eriophyoid mites. In: Lindquist EE, Sabelis MW, Bruin J (eds) Eriophyoid mites—their biology, natural enemies and control. Elsevier, Amsterdam, pp 383–396
Amrine JW, Stasny TAH (1994) Catalog of the Eriophyoidea (Acarina: Prostigmata) of the world. Indira Pub. House, West Bloomfield Mich
Amrine JW, Stasny TAH, Flechtmann CHW (2003) Revised keys to world genera of Eriophyoidea (Acari: Prostigmata). Indira Pub. House, West Bloomfield Mich
Bickford D, Lohman DJ, Sodhi NS et al (2007) Cryptic species as a window on diversity and conservation. Trends Ecol Evol 22:148–155. https://doi.org/10.1016/j.tree.2006.11.004
Ceballos G, Ehrlich PR (2009) Discoveries of new mammal species and their implications for conservation and ecosystem services. Proc Natl Acad Sci USA 106:3841–3846. https://doi.org/10.1073/pnas.0812419106
Chetverikov PE, Cvrković T, Vidović B, Petanović RU (2013) Description of a new relict eriophyoid mite, Loboquintus subsquamatus n. gen. & n. sp. (Eriophyoidea, Phytoptidae, Pentasetacini) based on confocal microscopy, SEM, COI barcoding and novel CLSM anatomy of internal genitalia. Exp Appl Acarol 61:1–30. https://doi.org/10.1007/s10493-013-9685-7
Chetverikov PE, Cvrković T, Makunin A et al (2015) Basal divergence of Eriophyoidea (Acariformes, Eupodina) inferred from combined partial COI and 28S gene sequences and CLSM genital anatomy. Exp Appl Acarol 67:219–245. https://doi.org/10.1007/s10493-015-9945-9
Coimbra-Dores MJ, Nunes T, Dias D, Rosa F (2016) Rhipicephalus sanguineus (Acari: Ixodidae) species complex: morphometric and ultrastructural analyses. Exp Appl Acarol 70:455–468. https://doi.org/10.1007/s10493-016-0095-5
Cvrković T, Chetverikov P, Vidović B, Petanović R (2016) Cryptic speciation within Phytoptus avellanae s.l. (Eriophyoidea: Phytoptidae) revealed by molecular data and observations on molting Tegonotus-like nymphs. Exp Appl Acarol 68:83–96. https://doi.org/10.1007/s10493-015-9981-5
Dabert J, Ehrnsberger R, Dabert M (2008) Glaucalges tytonis sp. n. (Analgoidea, Xolalgidae) from the barn owl Tyto alba (Strigiformes, Tytonidae): compiling morphology with DNA barcode data for taxon descriptions in mites (Acari). Zootaxa 1719:41–52. https://doi.org/10.5281/zenodo.181058
Darriba D, Taboada GL, Doallo R, Posada D (2012) JModelTest 2: more models, new heuristics and parallel computing. Nat Methods 9:772. https://doi.org/10.1038/nmeth.2109
de Lillo E, Skoracka A (2010) What’s “cool” on eriophyoid mites? Exp Appl Acarol 51:3–30. https://doi.org/10.1007/s10493-009-9297-4
de Lillo E, Craemer C, Amrine JW, Nuzzaci G (2010) Recommended procedures and techniques for morphological studies of Eriophyoidea (Acari: Prostigmata). Exp Appl Acarol 51:283–307. https://doi.org/10.1007/s10493-009-9311-x
de Lillo E, Vidovic B, Petanović P, Cristofaro M, Marini F, Augé M, Cvrkovic T, Babić E, Mattia C, Lotfollahi P, Rector B (2018) A new Aculodes species (Prostigmata: Eriophyoidea: Eriophyidae) associated with medusahead, Taeniatherum caput-medusae (L.) Nevski (Poaceae). Syst Appl Acarol UK 23:1217. https://doi.org/10.11158/saa.23.7.1
de Rojas M, Doña J, Jovani R, Dimov I, Zurita A, Callejón R, Rodríguez-Plá M (2018) Evidence of cryptic species in the genus Tinaminyssus (Acari: Rhinonyssidae) based on morphometrical and molecular data. Exp Appl Acarol 75:355–368. https://doi.org/10.1007/s10493-018-0271-x
Drès M, Mallet J (2002) Host races in plant-feeding insects and their importance in sympatric speciation. Philos Trans R Soc Lond B Biol Sci 357:471–492. https://doi.org/10.1098/rstb.2002.1059
Espíndola A, Ruffley M, Smith ML et al (2016) Identifying cryptic diversity with predictive phylogeography. Proc Biol Sci 283:20161529. https://doi.org/10.1098/rspb.2016.1529
Frost WE, Ridland PM (1996) Grasses. In: Lindquist EE, Sabelis MW, Bruin J (eds) Eriophyoid mites—their biology, natural enemies and control. Elsevier, Amsterdam, pp 619–629
Funk WC, Caminer M, Ron SR (2012) High levels of cryptic species diversity uncovered in Amazonian frogs. Proc Biol Sci 279:1806–1814. https://doi.org/10.1098/rspb.2011.1653
García-Jiménez R, Horreo JL, Valdecasas AG (2017) Minimal barcode distance between two water mite species from Madeira Island: a cautionary tale. Exp Appl Acarol 72:133–143. https://doi.org/10.1007/s10493-017-0147-5
Gerhardt HC (2005) Acoustic spectral preferences in two cryptic species of grey treefrogs: implications for mate choice and sensory mechanisms. Anim Behav 70:39–48. https://doi.org/10.1016/j.anbehav.2004.09.021
Guindon S, Gascuel O (2003) A simple, fast, and accurate algorithm to estimate large phylogenies by maximum likelihood. Syst Biol 52:696–704. https://doi.org/10.1080/10635150390235520
Hardin G (1960) The competitive exclusion principle. Science 131:1292–1297
Hasegawa M, Kishino H, Yano T (1985) Dating of the human-ape splitting by a molecular clock of mitochondrial DNA. J Mol Evol 22:160–174
Hebert PDN, Cywinska A, Ball SL, deWaard JR (2003a) Biological identifications through DNA barcodes. Proc Biol Sci 270:313–321. https://doi.org/10.1098/rspb.2002.2218
Hebert PDN, Ratnasingham S, de Waard JR (2003b) Barcoding animal life: cytochrome c oxidase subunit 1 divergences among closely related species. Proc R Soc B Biol Sci 270:S96–S99. https://doi.org/10.1098/rsbl.2003.0025
Henry SC, Wells MM (2010) Acoustic niche partitioning in two cryptic sibling species of Chrysoperla green lacewings that must duet before mating. Anim Behav 80:991–1003. https://doi.org/10.1016/j.anbehav.2010.08.021
Higgins DG, Thompson JD, Gibson TJ (1996) Using CLUSTAL for multiple sequence alignments. Methods Enzymol 266:383–402
Hubbard CE, Charles E, Hubbard JCE, Sampson J (1992) Grasses: a guide to their structure, identification, uses, and distribution in the British Isles. Penguin
Hubert N, Hanner R (2015) DNA barcoding, species delineation and taxonomy: a historical perspective. DNA Barcodes 3:44–58. https://doi.org/10.1515/dna-2015-0006
Kimura M (1980) A simple method for estimating evolutionary rates of base substitutions through comparative studies of nucleotide sequences. J Mol Evol 16:111–120
Knowlton N (1993) Sibling species in the sea. Annu Rev Ecol Syst 24:189–216. https://doi.org/10.1146/annurev.es.24.110193.001201
Kuczyński L, Rector BG, Kiedrowicz A et al (2016) Thermal niches of two invasive genotypes of the wheat curl mite Aceria tosichella: congruence between physiological and geographical distribution data. PLoS ONE. https://doi.org/10.1371/journal.pone.0154600
Lewandowski M, Skoracka A, Szydło W et al (2014) Genetic and morphological diversity of Trisetacus species (Eriophyoidea: Phytoptidae) associated with coniferous trees in Poland: phylogeny, barcoding, host and habitat specialization. Exp Appl Acarol 63:497–520. https://doi.org/10.1007/s10493-014-9805-z
Lindquist EE (1996) External anatomy and notation of structures. In: Lindquist EE, Sabelis MW, Bruin J (eds) Eriophyoid mites—their biology, natural enemies and control. Elsevier, Amsterdam, pp 3–31
Liu S, Walling LL, Wang X (2012) Special issue introduction—the whitefly Bemisia tabaci species complex and begomoviruses: research progress and future prospects. J Integr Agr 11:171–175. https://doi.org/10.1016/S2095-3119(12)60001-X
Manson DCM, Oldfield GN (1996) Life forms, deuterogyny, diapause and seasonal development. In: Lindquist EE, Sabelis MW, Bruin J (eds) Eriophyoid mites—their biology, natural enemies and control. Elsevier, Amsterdam, pp 173–183
Matsuda T, Hinomoto N, Singh RN, Gotoh T (2012) Molecular-based identification and phylogeny of Oligonychus species (Acari: Tetranychidae). J Econ Entomol 105:1043–1050. https://doi.org/10.1603/EC11404
Miller A, Umina P, Weeks A (2012) Population genetics of the wheat curl mite (Aceria tosichella Keifer) in Australia: implications for the management of wheat pathogens. Bull Entomol Res 102:199–212
Miller AD, Skoracka A, Navia D et al (2013) Phylogenetic analyses reveal extensive cryptic speciation and host specialization in an economically important mite taxon. Mol Phylogenet Evol 66:928–940. https://doi.org/10.1016/j.ympev.2012.11.021
Mironov SV, Dabert J, Dabert M (2012) A new feather mite species of the genus Proctophyllodes Robin, 1877 (Astigmata: Proctophyllodidae) from the long-tailed Tit Aegithalos caudatus (Passeriformes: Aegithalidae)—morphological description with DNA barcode data. Magnolia Press, Oakland
Monfreda R, Lekveishvili M, Petanovic R, Amrine JW (2010) Collection and detection of eriophyoid mites. In: Eriophyoid mites: progress and prognoses, pp 273–282
Nalepa (1896) Callytrotus hystrix n. sp. Neue Gallmilben. Anz. Akad. Wiss. Mat. Klas., Wien 33:110
Navia D, de Mendonça RS, Skoracka A et al (2013) Wheat curl mite, Aceria tosichella, and transmitted viruses: an expanding pest complex affecting cereal crops. Exp Appl Acarol 59:95–143. https://doi.org/10.1007/s10493-012-9633-y
Nygren A, Eklöf J, Pleijel F (2010) Cryptic species of Notophyllum (Polychaeta: Phyllodocidae) in Scandinavian waters. Org Divers Evol 10:193–204. https://doi.org/10.1007/s13127-010-0014-2
Oldfield GN, Proeseler G (1996) Eriophyoid mites as vectors of plant pathogens. In: Lindquist EE, Sabelis MW, Bruin J (eds) Eriophyoid mites—their biology, natural enemies and control. Elsevier, Amsterdam, pp 259–275
Pan H, Chu D, Ge D et al (2011) Further spread of and domination by Bemisia tabaci (Hemiptera: Aleyrodidae) biotype Q on field crops in China. J Econ Entomol 104:978–985. https://doi.org/10.1603/EC11009
Pegler KR, Evans L, Stevens JR, Wall R (2005) Morphological and molecular comparison of host-derived populations of parasitic Psoroptes mites. Med Vet Entomol 19:392–403. https://doi.org/10.1111/j.1365-2915.2005.00586.x
Pfenninger M, Schwenk K (2007) Cryptic animal species are homogeneously distributed among taxa and biogeographical regions. BMC Evol Biol 7:121. https://doi.org/10.1186/1471-2148-7-121
Poulin R (2014) Parasite biodiversity revisited: frontiers and constraints. Int J Parasitol 44:581–589. https://doi.org/10.1016/J.IJPARA.2014.02.003
Ronquist F, Teslenko M, van der Mark P et al (2012) MrBayes 3.2: efficient Bayesian phylogenetic inference and model choice across a large model space. Syst Biol 61:539–542. https://doi.org/10.1093/sysbio/sys029
Sabelis MW, Bruin J (1996) Evolutionary ecology: life history patterns, food plant choice and dispersal. In: Lindquist EE, Sabelis MW, Bruin J (eds) Eriophyoid mites—their biology, natural enemies and control. Elsevier, Amsterdam, pp 329–366
Shoemaker JS, Fitch WM (1989) Evidence from nuclear sequences that invariable sites should be considered when sequence divergence is calculated. Mol Biol Evol 6:270–289. https://doi.org/10.1093/oxfordjournals.molbev.a040550
Skoracka A (2008) Reproductive barriers between populations of the cereal rust mite Abacarus hystrix confirm their host specialization. Evol Ecol 22:607. https://doi.org/10.1007/s10682-007-9185-5
Skoracka A (2009) Description of Abacarus lolii n. sp. (Prostigmata: Eriophyoidea: Eriophyidae), a cryptic species within a grass-feeding Abacarus complex. Int J Acarol 35:405–417. https://doi.org/10.1080/01647950903292764
Skoracka A, Dabert M (2010) The cereal rust mite Abacarus hystrix (Acari: Eriophyoidea) is a complex of species: evidence from mitochondrial and nuclear DNA sequences. Bull Entomol Res 100:263–272. https://doi.org/10.1017/S0007485309990216
Skoracka A, Kuczyński L (2004) Demography of the cereal rust mite Abacarus hystrix (Acari: Eriophyoidea) on quack grass. Exp Appl Acarol 32:231–242. https://doi.org/10.1023/B:APPA.0000023237.70549.20
Skoracka A, Kuczyński L (2006) Is the cereal rust mite, Abacarus Hystrix really a generalist? Testing colonization performance on novel hosts. Exp Appl Acarol 38:1–13. https://doi.org/10.1007/s10493-005-6077-7
Skoracka A, Kuczynski L, Magowski W (2002) Morphological variation in different host populations of Abacarus hystrix (Acari: Prostigmata: Eriophyoidea). Exp Appl Acarol 26:187–193. https://doi.org/10.1023/A:1021144729837
Skoracka A, Kuczyński L, Rector BG (2007) Divergent host acceptance behavior suggests host specialization in populations of the polyphagous mite Abacarus hystrix (Acari: Prostigmata: Eriophyidae). Environ Entomol 36:899–909. https://doi.org/10.1093/ee/36.4.899
Skoracka A, Smith L, Oldfield G, Cristofaro M (2010) Host-plant specificity and specialization in eriophyoid mites and their importance for the use of eriophyoid mites as biocontrol agents of weeds. Exp Appl Acarol 51:93–113. https://doi.org/10.1007/s10493-009-9323-6
Skoracka A, Kuczyński L, de Mendonça RS, Dabert M, Szydło W, Knihinicki D, Truol G, Navia D (2012) Cryptic species within the wheat curl mite Aceria tosichella (Keifer) (Acari: Eriophyoidea), revealed by mitochondrial, nuclear and morphometric data. Invertebr Sys 26:417–433. https://doi.org/10.1071/IS11037
Skoracka A, Kuczyński L, Szydło W, Rector BG (2013) The wheat curl mite Aceria tosichella (Acari: Eriophyoidea) is a complex of cryptic lineages with divergent host ranges: evidence from molecular and plant bioassay. Biol J Linn Soc 109:165–180. https://doi.org/10.1111/bij.12024
Skoracka A, Kuczyński L, Rector B, Amrine JW (2014a) Wheat curl mite and dry bulb mite: untangling a taxonomic conundrum through a multidisciplinary approach. Biol J Linn Soc 111:421–436. https://doi.org/10.1111/bij.12213
Skoracka A, Rector B, Kuczyński L, Szydło W, Hein G, French R (2014b) Global spread of wheat curl mite by its most polyphagous and pestiferous lineages. Ann Appl Biol 165:222–235. https://doi.org/10.1111/aab.12130
Skoracka A, Magalhães S, Rector BG, Kuczyński L (2015) Cryptic speciation in the Acari: a function of species lifestyles or our ability to separate species? Exp Appl Acarol 67:165–182. https://doi.org/10.1007/s10493-015-9954-8
Skoracka A, Lewandowski M, Rector BG et al (2017) Spatial and host-related variation in prevalence and population density of wheat curl mite (Aceria tosichella) cryptic genotypes in agricultural landscapes. PLoS ONE. https://doi.org/10.1371/journal.pone.0169874
Sonnenberg R, Nolte AW, Tautz D (2007) An evaluation of LSU rDNA D1-D2 sequences for their use in species identification. Front Zool 4:6. https://doi.org/10.1186/1742-9994-4-6
Stålstedt J, Bergsten J, Ronquist F (2013) “Forms” of water mites (Acari: Hydrachnidia): intraspecific variation or valid species? Ecol Evol 3:3415–3435. https://doi.org/10.1002/ece3.704
Stork NE (2018) how many species of insects and other terrestrial arthropods are there on Earth? Annu Rev Entomol 63:31–45. https://doi.org/10.1146/annurev-ento-020117-043348
Stuart BL, Inger RF, Voris HK (2006) High level of cryptic species diversity revealed by sympatric lineages of Southeast Asian forest frogs. Biol Lett 2:470–474. https://doi.org/10.1098/rsbl.2006.0505
Sukhareva SI (1985) New species of mites (Acarina: Eriophyidae, Phyllocoptidae) living on graminaceous plants in the Maritime Territory. Entomol Obozr 64:227–234
Szydło W, Hein G, Denizhan E, Skoracka A (2015) Exceptionally high levels of genetic diversity in wheat curl mite (Acari: Eriophyidae) populations from Turkey. J Econ Entomol 108:2030–2039. https://doi.org/10.1093/jee/tov180
Tamura K, Stecher G, Peterson D, Filipski A, Kumar S (2013) MEGA6: molecular evolutionary genetics analysis version 6.0. Mol Biol Evol 30:2725–2729. https://doi.org/10.1093/molbev/mst197
Tavaré S (1986) Some probabilistic and statistical problems in the analysis of DNA sequences. Lectures on mathematics in the life sciences, vol 17. American Mathematical Society, New York, pp 57–86
Toda S, Osakabe M, Komazaki S (2000) Interspecific diversity of mitochondrial COI sequences in Japanese Panonychus species (Acari: Tetranychidae). Exp Appl Acarol 24:821–829. https://doi.org/10.1023/A:1006484018547
Wan X, Liu Y, Luo L, Feng C, Wang S, Ma L (2014) Influence of host shift on genetic differentiation of the oriental fruit fly, Bactrocera dorsalis. J Integr Agric 13:2701–2708. https://doi.org/10.1016/S2095-3119(14)60749-8
Wosula EN, McMechan AJ, Oliveira-Hofman C, Wegulo SN, Hein GL (2016) Differential transmission of two isolates of Wheat streak mosaic virus by five wheat curl mite populations. Plant Dis 100:154–158. https://doi.org/10.1094/PDIS-03-15-0342-RE
Xue X-F, Dong Y, Deng W et al (2017) The phylogenetic position of eriophyoid mites (superfamily Eriophyoidea) in Acariformes inferred from the sequences of mitochondrial genomes and nuclear small subunit (18S) rRNA gene. Mol Phylogenet Evol 109:271–282. https://doi.org/10.1016/j.ympev.2017.01.009
Yang Z (1994) Maximum likelihood phylogenetic estimation from DNA sequences with variable rates over sites: approximate methods. J Mol Evol 39:306–314. https://doi.org/10.1007/BF00160154
Yang B, Cai J, Cheng X (2011) Identification of astigmatid mites using ITS2 and COI regions. Parasitol Res 108:497–503. https://doi.org/10.1007/s00436-010-2153-y
Zhang J, Kapli P, Pavlidis P, Stamatakis A (2013) A general species delimitation method with applications to phylogenetic placements. Bioinformatics 29:2869–2876. https://doi.org/10.1093/bioinformatics/btt499
Zhao Y-E, Hu L, Ma J-X (2013) Molecular identification of four phenotypes of human Demodex mites (Acari: Demodicidae) based on mitochondrial 16S rDNA. Parasitol Res 112:3703–3711. https://doi.org/10.1007/s00436-013-3558-1
Živković Z, Vidović B, Jojić V et al (2017) Phenetic and phylogenetic relationships among Aceria spp. (Acari: Eriophyoidea) inhabiting species within the family Brassicaceae in Serbia. Exp Appl Acarol 71:329–343. https://doi.org/10.1007/s10493-017-0128-8
Acknowledgements
The authors thank Jędrzej Kuczyński for consultation regarding the Latin name of the new species, Jarosław Raubic for help in the laboratory, Evsel Denizhan for collecting grass samples in Turkey, James W. Amrine for information about Abacarus species, and the three reviewers: Radmila Petanović, Philipp Chetverikov and Enrico de Lillo for their valuable remarks, which improved the manuscript. The study was financially supported by the Polish Scientific Research Committee (Grant No. 6 P04 C0 5418) and National Science Centre (Grant No. 2011/03/B/NZ8/00129).
Author information
Authors and Affiliations
Contributions
AS, AL, WS designed the study, MH, WS, AS collected the material, AS, WS, AL, KKI, AM, AL analyzed the data, all authors wrote the manuscript and accepted its final version.
Corresponding author
Ethics declarations
Conflict of interest
The authors declare that they have no conflict of interest.
Rights and permissions
Open Access This article is distributed under the terms of the Creative Commons Attribution 4.0 International License (http://creativecommons.org/licenses/by/4.0/), which permits unrestricted use, distribution, and reproduction in any medium, provided you give appropriate credit to the original author(s) and the source, provide a link to the Creative Commons license, and indicate if changes were made.
About this article

Cite this article
Laska, A., Majer, A., Szydło, W. et al. Cryptic diversity within grass-associated Abacarus species complex (Acariformes: Eriophyidae), with the description of a new species, Abacarus plumiger n. sp.. Exp Appl Acarol 76, 1–28 (2018). https://doi.org/10.1007/s10493-018-0291-6
Received:
Accepted:
Published:
Issue Date:
DOI: https://doi.org/10.1007/s10493-018-0291-6