
Abstract
At present, nitrogen production from air by pressure swing adsorption (PSA) is simulated almost exclusively at low product purity levels (< 99% N2). However, with increasing global demand for highly purified gases provided by energy-efficient separation processes the requirement for either extensive experimental research in the high-purity range or predictive computer simulations arises. This paper presents a mathematical model of a twin-bed PSA plant equipped with a carbon molecular sieve (Shirasagi MSC CT-350) for the generation of high-purity nitrogen (99.9–99.999% N2). The model is implemented in the process simulator Aspen Adsorption™. The influence of operating conditions as well as the cycle organisation on the process performance is validated, especially the influence of pressure, temperature, half-cycle time, purge flow rate, and cutting time. The precision of the performance prediction by numerical simulations is critically discussed. Based on the new insights efficiency improvement strategies with a focus on reduced energy consumption are introduced and discussed by means of radar charts.
1 Introduction
Nitrogen, which is primarily generated by the separation of air, remains an indispensable medium in many different industrial businesses. Depending on the specific application, its acceptable contamination threshold of oxygen varies significantly. For instance, the requirement of the nitrogen purity level for fire-prevention systems is about 13 vol.-% O2 [1], for electronics assembly 0.1 vol.-% O2 [2], and for stainless-steel manufacturing 10 ppm O2 [3]. Thus, taking into consideration the individually requested gas purity with respect to the needed production rate, the most economical method of nitrogen generation is prospected.
The PSA technology is widely introduced and commercially established at flow rates up to several thousand Nm3/h (at 0 °C, 1 bar abs) and purity levels up to 99.999 % N2. The kinetic separation of air is possible due to a significantly faster adsorption of oxygen over nitrogen in PSA-plants equipped with carbon molecular sieves (CMS) [4]. High selectivity is attainable due to the sieving effect in intentionally narrowed micropore mouths of the adsorbent [5]. Because of relatively low capital costs, simplicity of functioning, and the possibility of operation in remote locations, the PSA technology gains a big advantage on the nitrogen-market over traditional Air Separation Units (ASUs). Moreover, multiple process variables and cycle organisation strategies give an opportunity for customising the system to specific requirements, which allow a prospect of minimised operating costs.
The introduction of a mathematical model that quantitively predicts the performance of PSA-plants at different operating conditions would eliminate the necessity of performing extensive experimental research and allows investigating new methods of process intensification. In case of nitrogen generation, the crucial aspect regarding modelling of kinetically-controlled air separation is the correct representation of the mass transfer kinetics in highly microporous CMS adsorbent. The commonly known linear driving force (LDF) model is frequently applied due to its simplicity and physical consistency [6]. However, the N2-PSA process simulations involving LDF models present the results almost exclusively at low product purity levels (< 99% N2) [7,8,9,10,11,12]. Solely, Shirley and Lemcoff published predicted and experimental data in the range of higher nitrogen purity (> 99.9% N2), describing the mass transfer kinetics through the Langmuir adsorption rate expression as an approximation of the slit-potential-rate model introduced by LaCava [13,14,15]. While the influence of cycle time on the PSA process performance was investigated and confirmed by the model qualitatively, the accuracy values were completely omitted.
Various process intensification strategies were meanwhile developed and successfully implemented by engineers in commercial N2-PSA plants. However, both empirical data and process simulation results presenting those methods, are still not acknowledged in literature. This motivates the authors of this study to develop and to validate a new mathematical model of a twin-bed PSA for the production of high-purity nitrogen, covering multiple process conditions and operating strategies of technical relevance. A critical discussion of the simulation accuracy is supplemented. Finally, performance intensification strategies with a focus on reduced energy consumption are introduced based on the outcome of the demonstrated model.
2 Mathematical model
Dynamic process simulators, specially dedicated to solving general cyclic adsorption problems, are accessible and well established [16]. In this work, the dynamic simulation of the nitrogen production in the twin-bed PSA system was performed using the process simulator Aspen Adsorption™.
2.1 Model premises
The mathematical model was developed based on the following premises:
-
(1)
the feed gas is considered to be a two-component mixture of 20.9 vol.-% O2 and 79.1 vol.-% N2,
-
(2)
the equation of state is expressed by the Peng-Robinson model,
-
(3)
the flow pattern is described by the axially dispersed plug-flow model; the dispersion coefficient varies along the length of the adsorber,
-
(4)
the pressure drop along the packed bed is approximated by the Ergun equation,
-
(5)
the adsorption process is non-isothermal,
-
(6)
the system is non-adiabatic; however, the conduction along the adsorber wall as well as heat accumulation in the wall are neglected,
-
(7)
the porosity along the packed bed is considered constant and homogeneous,
-
(8)
the single-component adsorption equilibrium is described by the temperature-dependent Sips isotherm,
-
(9)
the multi-component adsorption equilibrium is estimated with the IAST approach, and
-
(10)
mass transfer resistance at the CMS micropore-mouth dominates.
The quadratic differencing scheme (QDS) was used in order to solve the set of differential equations. The adsorbent packed bed was discretised into 70 vertical nodes along its length.
2.2 Equations and parameters
The overall and component mass balances are presented in Eqs. 1–2.
The axial dispersion coefficient Ez is estimated according to Eq. 3, recognising the effects of molecular diffusion as well as of the gas turbulent mixing around the adsorbent pellets [17, 18]. The variation of molecular diffusion coefficient Dm with temperature and pressure is considered and calculated according to the Chapman-Enskog theory [19].
It is assumed that the mass transfer resistance at the CMS micropore-mouth dominates since the diameter of micropore entrances is the smallest within the entire pore system. Therefore, the potential energy of molecules is most likely to increase rapidly at that place which is associated with the occurrence of repulsion forces; consequently, further micropore penetration and transport to adsorbent active sites are significantly inhibited. Hence, the rate-limiting step of mass transport is the micropore diffusion which applies to both micropore-mouths of predominant resistances, and micropores themselves of minor resistances. This statement is in agreement with the vast majority of publications which confirm that in the case of kinetically-controlled air separation on CMS adsorbents the rate-controlling step obeys mechanisms of the surface barrier, the diffusional molecular transport within micropores, or superposition of both [20,21,22,23]. The concentration dependence of the diffusivity is considered, following the Darken relation. Since micropore diffusion is an activated process, an Arrhenius term is adopted in order to describe the temperature dependence [24]. The approach of a lumped resistance of the mass transfer was selected; thus, the rate of sorption is expressed as the quadratic function of the solid film loading, as presented in Eqs. 4–5. It was confirmed that the quadratic driving force (QDF) model provides a better approximation of mass transfer of pure gases within the microporous adsorbents than the linear driving force (LDF) approach at low adsorbate concentration [6, 25]. For this reason, the QDF is the model of choice in this work since the generation of high-purity nitrogen is considered; therefore, the oxygen concentration is very low at the front of mass transfer zone in the adsorber column. Factors of sorption frequency Ak and sorption activation energy Eak were considered as model fitting parameters which equal 1.208 × 10− 6 m2/s and 1622.33 kJ/kmol for oxygen, and 8.186 × 10− 5 m2/s and 25098.55 kJ/kmol for nitrogen, respectively. These values were obtained based on PSA experimental results, by fitting the performance indicators. The diffusion process of oxygen in CMS adsorbent is much faster in comparison to the nitrogen, as was previously confirmed in many publications [22, 26, 27]. Since the kinetic diameters of oxygen (3.46 Å) and nitrogen (3.64 Å) are relatively similar, the large discrepancy in kinetic parameters can only be explained by the acentric factor which characterises a molecule with respect to both the geometry and polarity. It was suggested that the paramagnetic properties of oxygen give rise to strong attraction force to carbon atoms on the inter-surface of the CMS adsorbent, thus the mass transport proceeds rapidly [28]. Nitrogen, however, is supposed to dimerise in the CMS pores and create large van der Waals molecules, thus its mass transfer rate is inhibited [28].
The energy balances of gas and solid phases are presented in Eqs. 6–7, respectively. The heat conduction in both phases is considered. The heat exchange between gas in the column and the environment is included in the gas phase energy balance. The variation of gas thermal conductivity kg as well as of adsorbed phase heat capacity Cpa with the temperature is considered and calculated by empirical equations [29]. The heat transfer coefficient between gas and solid phases h is implemented as a function of Reynolds and Prandtl numbers, according to the method presented in the supplementary information.
The thermodynamic equilibrium was measured gravimetrically on the IsoSORP magnetic suspension balance from Rubotherm. At first, a sample of the CMS adsorbent was pretreated, i.e. subjected to vacuum and heating in order to remove preadsorbed gases and moisture. Ahead of the measurement of the isotherm, the exact sample volume was determined by a buoyancy analysis in helium at the respective temperature. The equilibrium data were collected in the pressure range of 0–20 bar abs at temperature levels of 20, 40, and 60 °C. The adsorption of pure oxygen and pure nitrogen on the CMS adsorbent was tested. The experimental results were fitted to the temperature-dependent Sips isotherm model [28, 30] presented in Eqs. 8–11.
Parameters of isotherms were found by the method of least squares and are listed in Table 1. The experimental equilibrium curves described by the Sips isotherm model are shown in Fig. 1. No significant difference in the course of oxygen and nitrogen isotherms was observed; however, a slightly enhanced equilibrium affinity of oxygen to the adsorbent was detected.

Experimental adsorption isotherms of (a) oxygen and (b) nitrogen on the CMS represented by Sips model
The isosteric heat of adsorption was estimated based on the isotherm data with the Clausius-Clapeyron method displayed in Eq. 12 [24, 31, 32]. The effect of loading and temperature on adsorption enthalpy was considered as presented in Fig. 2. Details of the applied method and the calculation procedure are given in the supplementary information. Adsorption enthalpy decreases with loading, pointing out the heterogeneous surface of the CMS adsorbent. A polynomial function was implemented in the process simulator to calculate the heat of adsorption. The resulting equation and fitting parameters are given in Table 2. Since the heat of adsorption of oxygen on CMS is larger than its sorption activation energy, jumps between active sites on the surface of adsorbent can be admitted as the controlling process of the mass transfer [33]. On the other hand, the heat of adsorption of nitrogen on CMS is smaller than its sorption activation energy, indicating the dominance of repulsive forces at the micropore entrance, recognised as the controlling step [33]. These considerations may acknowledge precedent discussion about the nature of oxygen and nitrogen kinetics in micropores of CMS.

Heat of adsorption of (a) oxygen and (b) nitrogen evaluated by the Clausius-Clapeyron method; represented by polynomial functions
Additionally, the adsorption of a synthetic air mixture (20 vol.-% O2 and 80 vol.-% N2) was examined in order to validate the correctness of the multi-component calculation by the IAST approach. The equilibrium data were collected in the pressure range of 0–20 bar abs at temperature levels of 20, 40, and 60 °C. The results are plotted in Fig. 3a. The IAST calculation underestimates the experimental multi-component adsorption equilibrium data in the whole pressure range at 20 and 40 °C. At 60 °C, the experimental data are overestimated up to about 5 bar abs and underestimated posteriorly. However, the accuracy of equilibrium prediction is acceptable. As presented in Fig. 3b, in the pressure range of practical application of the PSA system i.e. 1–10 bar abs, the maximal relative error of IAST estimation equals 11.2 % at 20 °C, 1.84 % at 40 °C, and 5.07 % at 60 °C. Moreover, considering the PSA operation, increased deviations in the equilibrium loading are observed during the desorption rather than the adsorption since the relative error at atmospheric pressure level is significantly higher than at adsorption pressure levels at 20 and 60 °C. At 40 °C, the estimation error is rather insensitive to the variation of system pressure.

(a) Experimental adsorption isotherms of synthetic air mixture on the CMS represented by the IAST model; (b) Relative error of the equilibrium loading with the IAST model; measured by TA Instruments [34]
The pressure drop along the packed bed was studied empirically and parameters of the Ergun equation, presented in Eq. 13, were adjusted. It was proved that the steady-state momentum equations can be safely used in modelling of PSA processes [35]. Since the interparticle voidage εi as well as the adsorbent particle radius rp were determined experimentally by a statistical analysis with 100 adsorbent pellets, the adsorbent shape factor ψ was considered here as the sole fitting parameter. The results are shown in Fig. 4.
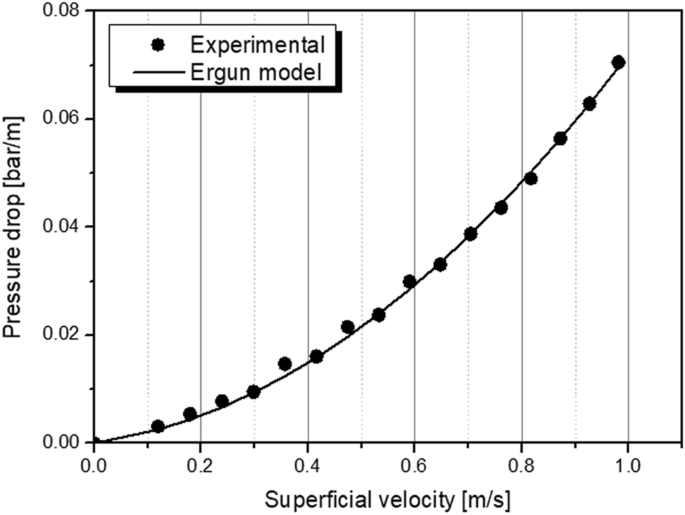
Experimental pressure drop along the CMS packed bed represented by the Ergun model
Other parameters of the dynamic model are listed in Table 3.
3 Experimental
A scheme of the twin-bed PSA experimental set-up is presented in Fig. 5. Details of the plant, the adsorber column, and the properties of the adsorbent are described in the supplementary information and elsewhere [36]. The test rig is fed with dry compressed air. To control the nitrogen purity level, the product flow rate is always adjusted in the experiments. In the N2-PSA technology it is accepted that the product purity comprises the content of both nitrogen and argon since many industrial applications do not require an additional separation of inert gas mixtures. Consequently, the determination of the product purity is performed by assuming a binary gas mixture, where the difference to the oxygen concentration results in the nitrogen purity. The PSA performance indicators (PIs), productivity and air demand, are defined, determined, and verified according to the strategy described elsewhere [36].

Scheme of the PSA experimental set-up [36]
The process comprises a six-step PSA cycle, which consists of (1) co- and counter-current bed pressure equalisation; (2) co-current pressurisation by feed with (3) counter-current backflow of product; (4) production; (1) co- and counter-current bed pressure equalisation; (5) counter-current blow-down; and (6) counter-current purge by the product gas. The scheme of a six-step cycle design is presented in the supplementary information. Details of the process organisation are described elsewhere [36].
4 Results and discussion
4.1 Adjustment of flow resistances in the system
Since the rate of pressure build-up and fall-off is the main driving force of adsorption and desorption in the PSA system, a correct representation of pressure profiles in the adsorber column during production, equalisation, and regeneration steps is crucial for a rational estimation of both adsorption equilibrium behaviour and mass transfer kinetics. Consequently, the issue of flow resistances in the system comes to the fore while validation of the mathematical model, and should be considered as an exceptionally important criterion when confirming empirical results [37].
In order to signify particular flow resistances occurring in the PSA test rig, the valve models V are implemented in the process simulator, as shown in Fig. 6. Depending on the function of objects assembled in the PSA plant, the Aspen Adsorption™ valve model V simulates the action of either a mass flow controller, a ball valve, or a control valve.

Flow sheet of the twin-bed PSA created in the simulation software Aspen Adsorption™
When simulating the action of the mass flow controller, the gas flow rate downstream of the valve V is kept constant. In the case of simulating the action of the ball valve, the gas flow across the valve V is not associated with a pressure drop. Once the valve model V simulates the action of the control valve, the gas flow rate is expressed as a linear function of the pressure drop across the orifice, as shown in Eq. 14. Adjustment of the flow coefficient Cv allows the simulation of a specific pressure drop caused by the gas flowing through particular elements creating the flow resistance, e.g. pipe connectors, in-line filters, flow meters, manual needle valves, or adsorber column armature like perforated plates, sieves, etc. In this study, individual flow coefficients were found by fitting of simulated pressure curves to corresponding experimental pressure curves measured at the top of two adsorbers columns in process conditions of 8 bar abs and 20 °C. Sensitivity studies have confirmed that the pressure build-up and fall-off during the PSA process are independent from the product flow rate in the investigated nitrogen purity range.
Individual functions of valve models V together with fitted Cv values representing the flow resistances in the PSA piping system are listed in Table 4, followed by the comparison of experimental and simulated pressure profiles shown in Fig. 7.

Experimental and simulated pressure profiles at the top of adsorber columns: (a) during the entire PSA half-cycle, (b) during the initial phase of the PSA half-cycle
4.2 Validation of the mathematical model
Generally, nitrogen purity, productivity, and air demand are the three main performance indicators used for the evaluation of the N2-PSA effectiveness. When operating the adsorber, the product purity at the outlet of the system is the consequence of the gas flow rate through the column. This would suggest that a representation of process performance data should consider productivity as an independent variable, while the product purity as well as the air demand are dependent variables. This approach is consistent with the conventional demonstration of PSA performance results in the literature. However, in commercial applications, values for productivity and air demand are listed for a certain purity class separately since the nitrogen quality, not quantity, firstly indicates go/no-go decisions for a specific gas application.
In this work, experimental results of PSA performance indicators, i.e. productivity and air demand, are compared with the outcome of the mathematical model at fixed product purity levels, which is consistent with commercial conventions. The difference between simulated and empirical results is expressed as the relative error of the simulation δ according to Eq. 15. Thus, the performance indicator value is underestimated by the mathematical model when δ is positive; reversely, it is overestimated when δ is negative.
Selected operating temperature and pressure levels are in agreement with the vast majority of relevant industrial applications. The influence of the half-cycle time on the process performance is verified. In experiments, the flow rate of the purge stream is adjusted according to Eq. 16:
where: Qpurge is the flow rate of the purge stream [Nm3/h], Vadsorber is the volume of the packed bed [m3], tpurge is time of the purge step [h], and X is a proportionality factor [-]. Detailed PSA operating conditions are presented in Table 5, followed by the scheme of cycle design shown in Fig. 8. Further, the purge proportionality factor is varied and the influence of a possible cutting step is investigated.
The physical explanation of several observed effects was already discussed in detail in a previous publication of the authors [37]. Therefore, this work focuses on the validation of the mathematical model and exposing its ability to predict the PSA performance at multiple process conditions.

Scheme of the six-step cycle design (1 s/59 s/1 s/59 s)
4.2.1 Effect of the operating temperature
Since PSA plants are commonly exploited in both cold and warm environments, the influence of ambient temperature on the PSA performance indicators is investigated in the range of 5–45 °C while other process conditions follow the reference state. The results are presented in Tables 6 and 7; Fig. 9.

PSA performance at different operating temperatures: (a, b) productivity; (c, d) air demand; (a, c) in function of product purity; (b, d) in function of operating temperature
Independent from the purity level, Fig. 9 shows that productivity and air demand in the temperature range between 12 and 36 °C fit well to the simulation with the model premises listed in Chap. 2.1.
At investigated conditions, the productivity reaches its maximum at 28 and 20 °C at a purity level of 1000 and 10 ppm O2, respectively. The effect is evident taking into consideration a competition of both adsorption thermodynamic and kinetic factors, which is especially relevant for kinetically-controlled separations. Therefore, the equilibrium loading in the adsorbent is elevated and the mass transfer rate is inhibited at the same time at low process temperatures. The opposite relationship is observed at high operating temperatures. Consequently, the maximum nitrogen productivity is detected at moderate ambient temperatures providing a trade-off between the equilibrium and kinetics factors. At the product purity of 1000 ppm O2, the productivity is underestimated with the highest simulation error at 5 °C. It is most likely the consequence of the IAST prediction, which is comparably weak at low temperatures as presented in Fig. 3. However, at 10 ppm O2, the highest relative error of the simulated productivity is detected at 45 °C, which indicates that probably inaccuracies of other effects superimposing the relative error.
The lowest air demand was measured at 5 and 12 °C at purity levels of 10 and 1000 ppm O2, respectively; however, the mathematical model predicts a minimum at about 20 °C regardless the product purity. It comes as no surprise since both determined performance indicators, productivity and air demand, are not independent from each other. They are a function of the required nitrogen purity as well as of applied process conditions. Therefore, the highest relative error of the simulated productivity results also in the highest relative error of the simulated air demand at the same measurement point. Nevertheless, based on inaccuracies in the model prediction at low and high temperatures, it is advised to narrow the usability range of the mathematical model to 12–36 °C.
During the experimental research presented in this section, no significant difference between ambient temperature (TIR 2) and feed stream temperature (TIR 3) was detected.
4.2.2 Effect of the adsorption pressure
Because compression of air is a dominating factor of PSA operating costs, the adsorption pressure is mainly determined by economical constraints defined by the plant operator. Therefore, the influence of adsorption pressure on PSA performance indicators is investigated in the range of 6–10 bar abs while other process conditions follow the reference state. The results are presented in Tables 8 and 9; Fig. 10.
Figure 10 shows that the process simulation is capable to predict the influence of the operating pressure very satisfying in the whole investigated pressure range.
The effect of operating pressure on the experimentally determined PSA performance differs remarkably depending on the required product purity level. At 1000 ppm O2, the nitrogen productivity increases with increasing adsorption pressure. The trend is evident since the driving force of mass transfer from bulk to the adsorbent is elevated, resulting in a raised oxygen loading in the CMS and thus in a more efficient separation. The air demand remains rather insensitive to the change of adsorption pressure.
The opposite effect is detected at 10 ppm O2. The nitrogen productivity initially increases slightly with the adsorption pressure up to about 8 bar abs in order to decrease again posteriorly. This very distinct behaviour can be explained with respect to the conditions in the adsorber column. Since the product flow rate is reduced in order to generate nitrogen of higher purity standard, the MTZ in the column during adsorption is situated mainly at the bottom of the adsorber while the mass axial dispersion becomes less significant. Therefore, the top part of the packed bed is occupied almost exclusively by purified nitrogen. Moreover, as the superficial gas velocity along the column decreases, the contact time between gas and solid phases extends, hence the system approaches the thermodynamic equilibrium state. As presented in Fig. 1, CMS adsorbs nitrogen likewise oxygen; therefore, the overly excessive adsorption of the nitrogen occurs in the top part of the packed bed. Consequently, the flow rate of nitrogen which leaves the system as a product stream is reduced.
As an interim conclusion it can be already noted, that the variation of productivity with the adsorption pressure is not significant at 10 ppm O2. Thus, it is recommended to operate a PSA plant equipped with Shirasagi MSC CT-350 at lower pressure levels due to a notably reduced air demand. In this way, high-purity nitrogen can be generated with remarkably lower operating costs.

PSA performance at different adsorption pressures: (a, b) productivity; (c, d) air demand; (a, c) in function of product purity; (b, d) in function of adsorption pressure
Since the effectiveness of air separation with CMS depends on both equilibrium and kinetic factors, the adsorption pressure should be adjusted to reinforce the effective oxygen adsorption, but to diminish the nitrogen adsorption at the same time. Moreover, because the mass transfer coefficients of oxygen and nitrogen increase with their partial pressures, as presented in Eq. 5, the thermodynamic equilibrium state is approached faster in the system as the adsorption pressure increases. In face of this situation, Fig. 11a plots the fractional uptake as a function of time for oxygen and nitrogen. The highest selectivity in the system is expected when the difference of fractional uptake rates attains the maximum. In the case of PSA operation, the contact time of phases is controlled indirectly by the adjustment of the product flow rate and therefore depends on the required product purity level. Furthermore, the occurrence of the peak selectivity at a specific contact time depends on system pressure as well as on temperature. Because slopes of kinetic curves would be higher at elevated pressure and temperature due to the faster sorption of gases, the selectivity peak shifts towards shorter contact times, as represented in Fig. 11b. Therefore, when the high-purity nitrogen is generated, the productivity decreases because the system operates in the conditions of prolonged contact time of phases, which is located on the right-hand side of the selectivity peak.
However, the presented effect of the PSA dynamic behaviour during the generation of a high-purity product will depend considerably on the utilised CMS material and may not occur in every system due to different structure parameters and thus mass transfer conditions in other adsorbents.

Graphical representation of fractional uptake rates of oxygen and nitrogen together with their difference Δ: (a) at lower operating pressure/temperature, (b) at higher operating pressure/temperature; green arrow indicates the maximum selectivity [38]
Referring to Fig. 3b, the relative error of simulated performance indicators should decrease at higher pressure levels. However, at investigated conditions the trend of the simulation accuracy is not clearly visible, which probably suggests that inaccuracies of other effects are compensated within computed values of the relative error.
4.2.3 Effect of the half-cycle time
The proper determination of the cycle time in the PSA process is a relevant factor while aiming for a performance improvement, especially in the case of kinetically-controlled separations. Because the shape of the mass transfer zone (MTZ) is sensitive to the adsorption duration at high product purities [13], the influence of the half-cycle time on PSA performance indicators is investigated in the range of 40–60 s while other process conditions follow the reference state. The results are presented in Tables 10 and 11; Fig. 12.
Table 10 shows that model predictions at investigated half-cycle time agree very well with the experimental data at 1000 ppm; however, at 10 ppm, the relative error increases with decreasing half-cycle time, as stated in Table 11.

PSA performance at different half-cycle times: (a, b) productivity; (c, d) air demand; (a, c) in function of product purity; (b, d) in function of half-cycle time
The experimental findings suggest that below about 100 ppm O2, a PSA operation with prolonged half-cycle time is recommended due to elevated productivity and reduced air demand values. Above 100 ppm, however, the shortened half-cycle time elevates the productivity; nevertheless, a slightly higher air demand must be accepted. Mostly, the simulated performance indicators exhibit higher relative errors as the half-cycle time shortens. In the PSA process, the variation of the half-cycle time changes the time span proportion of pressurisation and production steps. Therefore, as the half-cycle time is reduced, the consequences of a slightly imprecise estimation of the pressure curves during the initial phase of the PSA half-cycle are more pronounced. Especially within the first few seconds, the interchange of gas in the system is very rapid. The precise quantitative representation of pressure in the adsorber column is therefore very challenging, as already discussed by means of Fig. 7b. For that reason, the highest errors of the simulated performance indicators are indicated at the half-cycle time of 40 s.
4.2.4 Effect of the purge flow rate
The counter-current purge step is performed at atmospheric pressure level, simultaneously to the counter-current blow-down. During purge of the column, a specific amount of product gas accumulated in the N2-receiver tank is reversed into the adsorber and evacuated from the system as part of the tail-gas. An implementation of this step into the PSA cycle supports the bed regeneration since the interparticle voids are filled with purified nitrogen gas; thereby the amount of oxygen in the column is reduced before the following production step. Consequently, the application of the purge stream affects the concentration profiles along the adsorber column during both adsorption and desorption phases. Accordingly, the influence of the purge proportionality factor on the PSA performance indicators is investigated in the range of 30–60% while other process conditions follow the reference state. The results are presented in Tables 12 and 13; Fig. 13.
Figure 13 verifies that the model predicts the influence of purge flow rate in a very precise matter. Trends are correctly identified; however, the model accuracy shows different tendencies at different purities.
At investigated conditions, the experimental productivity values increase with the purge flow rate; however, the effect is more significant as the gas purity requirement declines. The air demand remains rather insensitive to the variation of the purge flow rate.
At the lower product purity level of 1000 ppm O2, the relative error of simulated PSA performance parameters increase with a rising purge flow rate. This outcome can be explained since the elevated purge flow rate results in a reinforcement of the non-uniform distribution of the counter-current gas flow through the column in the experimental set-up, particularly at the top of the adsorber. Thus, the fixed bed regeneration in the existing PSA plant is not accomplished as efficiently as it is predicted by the process simulation, which does not fully account for those effects. The point is especially valid when low-purity nitrogen is required since the MTZ in the column during adsorption becomes more extended due to the intensified mass axial dispersion at the elevated product flow rate; therefore, an efficient bed regeneration comes to the fore while aiming for PSA performance enhancement. Consequently, the PSA performance simulation is more accurate as a purge flow rate in the system decreases.

PSA performance at different purge proportionality factor: (a, b) productivity; (c, d) air demand; (a, c) in function of product purity; (b, d) in function of purge proportionality factor
Oppositely, at a higher product purity level of 10 ppm O2, the relative error of simulated PSA performance parameters decrease with increasing purge flow rate. While the generation of high-purity nitrogen is required, the product flow rate is lowered, so the MTZ in the column during the adsorption is situated mainly at the bottom of the adsorber. Therefore, an efficient adsorbent fixed bed regeneration is primarily required in the bottom section of the column. However, since the counter-current purge is provided at the top of the adsorber column, its velocity decreases progressively and reaches a minimum at the bottom due to pressure drop on the fixed bed. Consequently, as the purge flow rate is decreased in the process simulation, the minimum required gas velocity could perhaps not be achieved for the proper adsorbent regeneration since the mathematical model does not account for any grade of gas channelling, which is evident and inevitable in every PSA experimental set-up. Accordingly, the accuracy of performance prediction increases with a purge flow rate in the system.
4.2.5 Effect of the cutting time
The cutting is an additional step implemented at the end of the PSA cycle, which terminates the blow-down and purge steps. During cutting, both tail-gas and purge streams are disconnected, so the adsorber does not exchange any gas with the ambient. However, the desorption of gases could still proceed in the column, as shown in Fig. 14, which is particularly relevant for slow-diffusing components due to insufficient time provided for a complete CMS regeneration. Implementation of cutting can bring benefits to system performance especially in the case of kinetically-controlled separations since it allows to amplify the selectivity based on the difference in sorption rates of gases. However, the effect is highly dependent on the utilised CMS-type. Thus, the influence of the cutting time on the PSA performance indicators is investigated in the range of 0–15 s while other process conditions follow the reference state with the purge proportionality factor equals 40 %. The results are presented in Tables 14 and 15; Fig. 15.
Tables 14 and 15 show that the model predicts the influence of the cutting time very sufficiently regardless of the cutting time and purity level.
At experimentally investigated conditions, the application of a cutting step is particularly advantageous for the generation of product at the higher purity level of 10 ppm O2 since the air demand can be reduced whereas the productivity remains rather unaffected. When nitrogen of a lower purity is required, cutting should not be considered in the PSA cycle as a slight decline in productivity occurs.
At the lower product purity level of 1000 ppm O2, the relative error of the PSA simulation increases slightly with the cutting time; however, this effect is statistically not significant. Surprisingly, the opposite and much more pronounced trend is detected at the higher product purity level of 10 ppm O2. Since the precision of the calculated equilibrium loading at 20 °C increases with the system pressure, as shown in Fig. 3b, the elevated pressure at the end of the half-cycle could be a reason for an overall decrease in the relative error of the PSA simulation.
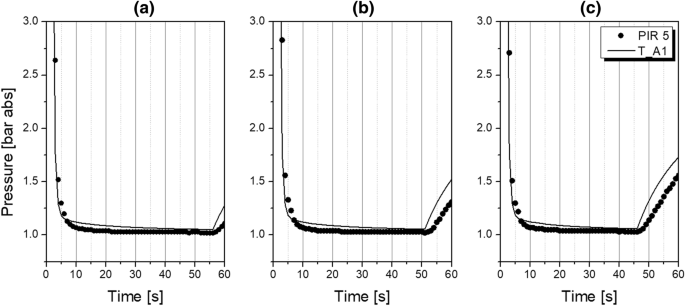
Experimental and simulated pressure profiles during the blow-down step at different cutting times: (a) 5 s, (b) 10 s, (c) 15 s

PSA performance at different cutting time: (a, b) productivity; (c, d) air demand; (a, c) in function of product purity; (b, d) in function of cutting time
4.3 Accuracy evaluation of the mathematical model
The relative error of simulated PSA performance indicators increases significantly with increased nitrogen purity. At the investigated product purity of 10 ppm O2, the largest deviation equals 42.93 % in case of productivity and − 69.58% in case of air demand, which was detected at the operating temperature of 45 °C. In contrast, at product purity of 1000 ppm O2, the largest deviation in productivity prediction equals 8.28% and was identified at the operating temperature of 5 °C; although the highest relative error of simulated air demand values of 4.06% was recognised at the half-cycle time of 40 s. Because the slopes of presented performance indicators curves become significantly larger at increased purity requirement, every minor inaccuracy in oxygen concentration measurement, even in the range of observational error, has a substantial impact on the determined productivity and air demand values. For instance, if simulating the PSA process at fixed productivity, the highest relative errors obtained at product purity of 10 ppm O2 would correspond to an absolute error of merely 7.57 ppm O2 in purity prediction – which is not much – and 0.071 Nm3/h air / Nm3/h N2 in air demand prediction – which is also not much in an absolute scale. The deliberated issue probably would not occur with CMS adsorbent of improved separation efficiency particularly for high-purity applications, which strongly encourages further research. Those materials show in the high-purity area less pronounced gradients for productivity and air demand dependencies. These kinds of materials would be probably much better represented by the developed model as the originally selected Shirasagi MSC CT 350 grade.
However, a few general conclusions can be stated. At almost every investigated process condition, the mathematical model underestimates the productivity and thus consequently overestimates the air demand at product purity level of 10 ppm O2. The possible explanation of this effect includes little inaccuracies originating both in PSA experimental set-up and in the mathematical description of the process, e.g.
-
underestimation of the adsorbent equilibrium loading by the IAST approach as presented in Fig. 3, most likely due to coarse IAST theory assumptions as neglecting adsorbate-adsorbate and adsorbate-surface interactions as well as omitting heterogeneous surface of CMS;
-
lack of experimental equilibrium data of pure oxygen adsorption at very low pressure (< 0.01 bar abs) as presented in Fig. 1a, as well as deviations in the amount adsorbed prediction by Sips isotherm model at low pressures;
-
inhomogeneous gas distribution along the adsorber column in the pilot-plant and therefore channelling effects;
-
adsorption/desorption of other air components, especially carbon dioxide and moisture, which cause superimposing effects on the gas temperature along the adsorber column, as presented in Fig. 16; or
-
imprecise evaluation of the multi-component diffusion process in the pore system of the CMS adsorbent.
Moreover, it is highly possible that different inaccuracies are overlapping, therefore increasing the simulation error of the performance indicators. It is most likely, that – in combination with a modified IAST approach – the biggest improvement of the model is possible by introducing an additional gaseous key component combining the effects of moisture and carbon dioxide adsorption for a better simulation of their thermal influences. However, the measurement of pure oxygen isotherm at very low pressure (1 × 10− 5 bar abs) could also bring a certain improvement in simulation accuracy.

Experimental (dotted line) and simulated (solid line) temperature profiles at selected positions of the adsorber during the PSA cycle: (a) at product purity of 1000 ppm O2, (b) at product purity of 10 ppm O2
4.4 Performance intensification strategies
In order to distinguish the most significant process conditions and cycle organisation strategies that should be considered towards PSA process intensification, performance indicators at product purity levels of 1000, 100, and 10 ppm O2 were designated based on the outcome of the dynamic simulation. Subsequently, the highest productivity and lowest air demand values were selected among the results in the studied parameters ranges, which correspond to those presented in Chaps. 4.2.1–4.2.5. The findings are presented in Table 16; Figs. 17 and 18.
Depending on the required product purity level, particular process conditions or cycle organisation strategies come to the fore while implementing PSA performance intensification strategies. When high nitrogen productivity is the priority, the most advantage would bring: (1) increasing of the adsorption pressure to 10 bar abs at a product purity of 1000 ppm O2; (2) increasing of the purge proportionality factor to 60 % at a purity of 100 ppm O2; or (3) increasing of the cutting time to 15 s at a purity of 10 ppm O2. However, in accordance with a current global focus on the energy conservation issue, a minimised air demand, rather than maximised productivity designates the preferable process outcome. Therefore, it is of advantage to (1) operate the PSA plant at moderate temperature of about 20 °C for the nitrogen generation at a purity of 1000 ppm O2; (2) decrease the adsorption pressure to 6 bar abs at the product purity of 100 ppm O2; or, in the same manner, (3) to decrease the adsorption pressure to 6 bar abs at a product purity of 10 ppm O2.

Highest productivity [Nm3/h N2 / m3 CMS] at individual process intensification strategies at different product purity levels: (1) operating temperature; (2) adsorption pressure; (3) half-cycle time; (4) purge flow rate; (5) cutting time

Lowest air demand [Nm3/h air / Nm3/h N2] at individual process intensification strategies at different product purity levels: (1) operating temperature; (2) adsorption pressure; (3) half-cycle time; (4) purge flow rate; (5) cutting time
It should be highlighted that these presented performance intensification measures were studied separately, while all other process conditions were following the reference state. Since the PSA dynamic behaviour is practically responsive to every variation of process conditions and cycle organisation strategy, a multi-parameter optimisation should be executed to demonstrate the overall optimum of PSA performance indicators. Nevertheless, such an approach can be executed with the validated mathematical model of the PSA plant, and therefore depends only on computation time and capacity.
4.5 Column dynamics in the N2-PSA process
After validation of the mathematical model, a brief discussion of column dynamics can follow. The analysis of the system’s dynamic behaviour presented in this section was performed at cyclic-steady-state (CSS) conditions; namely, when the gas composition in the product stream does not vary in time. The number of cycles necessary to reach the CSS state depends on the required product purity level as well as the composition of gas accumulated in the N2-receiver tank at the starting point of the process.
Breakthrough curves of the adsorber column during PSA cycle at product purity levels of 1000, 100, and 10 ppm O2 are presented in Fig. 19. The product gas is generated with inconstant composition; therefore, the integral average of oxygen concentration within the production step should be adapted to the value which corresponds to the required nitrogen purity level. During the blow-down and purge steps, the oxygen concentration at the top of the column refers to the product gas accumulated in the N2-receiver tank. At the time of co- and counter-current equalisation steps, oxygen concentration in the gas phase rapidly increases as a consequence of either oxygen desorption whereas the total pressure in the adsorber is reduced or the transfer of oxygen-enriched gas from the adjacent column while the total pressure in the adsorber is increased.

Oxygen breakthrough curves during the PSA cycle at different product purity levels
The MTC of oxygen and nitrogen during the PSA cycle at the product purity of 1000 O2 are presented in Fig. 20. It is evident that the MTC of oxygen is remarkably higher than of nitrogen due to the elevated mass transfer rate in the CMS pore system. According to the Darken relation implemented in the definition of mass transfer coefficient presented in Eq. 5, the MTC increases with adsorbent loading, therefore increases during adsorption in the column accordingly. In contrast, the MTC decreases during regeneration since adsorbent loading decreases. Surprisingly, a larger value of the MTC is detected during desorption than during adsorption. Because the blow-down step is performed at atmospheric pressure level, values of oxygen and nitrogen partial pressure are lower than 1, which consequently affects the MTC increase for both components, as stated in Eq. 5. No significant dissimilarity in the course of MTC curves was detected at different nitrogen purity levels.

Mass transfer coefficients during the PSA cycle at selected positions of adsorber length : (a) MTC of oxygen; (b) MTC of nitrogen; here nodes 1, 35, and 70 indicate the bottom, the middle, and the top of the column, respectively
The oxygen MTZ during production and regeneration steps are presented in Fig. 21 at product purity levels of 1000 and 10 ppm O2. The wave-front of oxygen concentration is self-sharpening during adsorption and self-flattering during desorption, which is a result of the favourable-type isotherm. The roll-up effect can be spotted at the time of production step, indicating the replacement of nitrogen molecules by oxygen inside the CMS; most likely due to much faster oxygen kinetics as well as due to its slightly enhanced equilibrium affinity to the adsorbent, as shown in Fig. 1. An extended MTZ along the adsorber occurs in case of lower purity level, which indicates an enhanced mass dispersion caused by the elevated gas superficial velocity. In contrast, at a high nitrogen purity level the MTZ is situated mostly in the bottom part of the bed, so the top part is occupied almost exclusively by purified nitrogen gas.

Oxygen MTZ along the adsorber length at a different time of the PSA cycle: (a, c) at product purity of 1000 ppm O2; (b, d) at product purity of 10 ppm O2; (a, b) during the production; (c, d) during the regeneration; here nodes 1 and 70 indicate the bottom and the top of the column, respectively
5 Conclusions
A mathematical model for the simulation of high-purity twin-bed N2-PSA was implemented in Aspen Adsorption™ and validated at multiple process conditions and cycle organisation strategies. The influence of operating temperature, adsorption pressure, half-cycle time, purge proportionality factor, and cutting time on productivity and air demand was always predicted qualitatively and mostly quantitatively correctly at two different product purity levels. Relative errors of simulated performance indicators were presented and their possible origin was discussed. It was clearly shown that a precise forecast of the PSA operation depends on the accurate representation of many factors, e.g. adsorption isotherms, mass transfer kinetics, pressure and temperature profiles along the adsorber, flow resistances in the piping system, etc. When fitted to modern high-purity CMS, simulation errors at high-purity levels are also expected to decline. A further improvement of the model is possible by introducing an additional gaseous key component combining the effects of moisture and carbon dioxide adsorption for a better simulation of thermal phenomena. The plausible discussion of the adsorber column dynamics was conducted based on the validated mathematical model. The model is particularly capable to propose tailor-made process optimisation strategies. Recommendations for performance improvement with a particular focus on the reduction of energy consumption were given based on the simulation outcome at three product purity levels.
Abbreviations
- Ak :
-
Sorption frequency factor of component k [m2/s]
- ap :
-
Specific particle surface area per unit volume of bed [m2(particle area)/m3(bed)]
- cg :
-
Gas phase molar density [kmol/m3]
- ck :
-
Molar concentration of component k [kmol/m3]
- Cpak :
-
Specific adsorbed phase heat capacity at constant pressure of component k [MJ/kmol/K]
- Cpg :
-
Specific gas phase heat capacity at constant pressure [MJ/kmol/K]
- Cps :
-
Specific solid phase heat capacity at constant pressure [MJ/kg/K]
- Cvg :
-
Specific gas phase heat capacity at constant volume [MJ/kmol/K]
- Cv :
-
Valve flow coefficient [kmol/s/bar]
- D0k :
-
Corrected diffusion coefficient of component k [m2/s]
- DB :
-
Bed diameter [m]
- Dek :
-
Effective diffusion coefficient of component k [m2/s]
- Eak :
-
Sorption activation energy of component k [kJ/kmol]
- EXP:
-
Experimental value
- Ezk :
-
Axial dispersion coefficient of component k [m2/s]
- h:
-
Gas–solid heat transfer coefficient [MW/m2/K]
- hw :
-
Gas-wall heat transfer coefficient [MW/m2/K]
- kg :
-
Gas phase thermal conductivity [MW/m/K]
- kgz :
-
Effective axial gas phase thermal conductivity [MW/m/K]
- ksz :
-
Effective axial solid phase thermal conductivity [MW/m/K]
- M:
-
Molecular weight [kg/kmol]
- MTCk :
-
Mass transfer coefficient of component k [1/s]
- P:
-
Pressure [bar]
- PI:
-
Performance indicator (here: either productivity or air demand)
- pk :
-
Partial pressure of component k [bar]
- rp :
-
Adsorbent particle radius [m]
- SIM:
-
Simulated value
- Ta :
-
Ambient temperature [K]
- Tg :
-
Gas phase temperature [K]
- Ts :
-
Solid phase temperature [K]
- vg :
-
Gas phase superficial velocity [m/s]
- wk :
-
Loading of component k [kmol/kg]
- wk * :
-
Equilibrium loading of component k [kmol/kg]
- wsk * :
-
Saturation equilibrium loading of component k [kmol/kg]
- ΔHk :
-
Heat of adsorption of component k [MJ/kmol]
- εB :
-
Total bed voidage [m3(void + pore)/m3(bed)]
- εi :
-
Interparticle voidage [m3(void)/m3(bed)]
- μ:
-
Dynamic viscosity [Ns/m2]
- θ:
-
Adsorbent surface coverage [-]
- ρs :
-
Solid phase bulk density [kg/m3]
References
Chiti, S.: A Pilot Study on Hypoxic Air Performance in Fire Prevention. Fire Technol 51, 393–407 (2015)
Dong, M., et al.: Effects of nitrogen on wettability and reliability of lead-free solder in reflow soldering. In: 2009 International Conference on Electronic Packaging Technology & High Density Packaging, pp. 147–151 (2009)
Pauzon, C., Hryha, E., Forêt, P., Nyborg, L.: Effect of argon and nitrogen atmospheres on the properties of stainless steel 316 L parts produced by laser-powder bed fusion. Materials & Design 179, 1–10 (2019)
Patel, S.V., Patel, J.M.: Separation of high purity nitrogen from air by pressure swing adsorption on carbon molecular sieves. International Journal of Engineering & Research Technology (IJERT) 3, 450–454 (2014)
Möller, A., Guderian, J., Möllmer, J., Lange, M., Hofmann, J., Gläser, R.: Kinetische Untersuchungen der adsorptiven Luftzerlegung an Kohlenstoffmolekularsieben. Chem. Ing. Tec. 85, 1680–1685 (2013)
Sircar, S., Hufton, J.R.: Why Does the Linear Driving Force Model for Adsorption Kinetics Work? Adsorption 6, 137–147 (2000)
Abdel-Rahman, Z.A., Mhdi, A.H., Auob, H.S.: Parametric study for nitrogen separation from air by pressure swing adsorption using carbon molecular sieve. Tikrit Journal of Engineering Sciences (TJES) 23, 1–9 (2016)
Ehsan, J.S., Masoud, M.: Pilot-Scale Experiments for Nitrogen Separation from Air by Pressure Swing Adsorption. S. Afr. J. Chem. Eng. 19, 42–56 (2014)
Ahari, J.S., Pakseresht, S.: Determination effects of process variables on Nitrogen production PSA system by mathematical modeling. Petroleum & Coal 50, 52–59 (2008)
Mahdi, A.H., Ahmed, A.M.R., Salih, S.S., Ayuob, H.S.: Simulation study of two units of pressure swing adsorption for producing oxygen and nitrogen simultaneously. AIP Conference Proceedings 2213(020166), 1–12 (2020)
Shokroo, E.J., Shahcheraghi, M., Farniaei, M.: Study of feed temperature effects on performance of a domestic industrial PSA plant. Appl Petrochem Res 4, 317–323 (2014)
Chinh, P.V., Hieu, N.T., Tien, V.D., et al.: Simulation and Experimental Study of a Single Fixed-Bed Model of Nitrogen Gas Generator Working by Pressure Swing Adsorption. Processes 7(10), 654 (2019) 1–21.
Shirley, A.I., Lemcoff, N.O.: High-purity Nitrogen by Pressure-Swing Adsorption. AIChE J. 43, 419–424 (1997)
Shirley, A.I., Lemcoff, N.O.: Air Separation by Carbon Molecular Sieves, Adsorption 8, 147–155 (2002)
Lemcoff, N.O.: Nitrogen separation from air by pressure swing adsorption. In: Studies in Surface Science and Catalysis, vol. 120, Part A, pp. 347–370 (1999)
Da Silva, F.A., Silva, J.A., Rodrigues, A.E.: A General Package for the Simulation of Cyclic Adsorption Processes. Adsorption 5, 229–244 (1999)
Kast, W.: Adsorption aus der Gasphase: Ingenieurwissenschaftliche Grundlagen und technische Verfahren. VCH (1988)
Delgado, J.M.P.Q.: A critical review of dispersion in packed beds. Heat Mass Transfer 42, 279–310 (2006)
Cussler, E.L.: DIFFUSION Mass Transfer in Fluid Systems: Third Edition, Chapter. 5.1.1, Eq. 5.1–1, 5.1–2, 5.1–3. Cambridge University Press (2009)
Shen, D., Bülow, M., Lemcoff, N.O.: Mechanisms of Molecular Mobility of Oxygen and Nitrogen in Carbon Molecular Sieves. Adsorption 9, 295–302 (2003)
Chagger, H.K., Ndaji, F.E., Sykes, M.L., Thomas, K.M.: Kinetics of adsorption and diffusional characteristics of carbon molecular sieves. Carbon 33, 1405–1411 (1995)
Qinglin, H., Farooq, S., Karimi, I.A.: Prediction of binary gas diffusion in carbon molecular sieves at high pressure. AIChE J. 50, 351–367 (2004)
Koresh, J., Soffer, A., Carbons, M.S.: Part 3.-Adsorption Kinetics According to a Surface-barrier Model. J. Cham. Soc., Faraday Trans. 1 77, 3005–3018 (1981)
Ruthven, D.M., Farooq, S., Knaebel, K.S., Pressure Swing Adsorption, Chapter 2.3.2, Eq. 2.32, 2.34; Chapter 2.2.4, Eq. 2.4. VCH Publishers (1994)
Gluekauf, E.: Theory of chromatography, Part 10, Formula for diffusion into spheres and their application to chromatography. Trans. Faraday Soc. 51, 1540–1551 (1955)
Chen, Y.D., Yang, R.T., Uawithya, P.: Diffusion of oxygen, nitrogen and their mixtures in carbon molecular sieve. AIChE J. 40, 577–585 (1994)
Bae, Y.-S., Moon, J.-H., Ahn, H., Lee, C.-H.: Effects of adsorbate properties on adsorption mechanism in a carbon molecular sieve. Korean J. Chem. Eng 21, 712–720 (2004)
Bae, C.-H.L.Y.-S.: Sorption kinetics of eight gases on a carbon molecular sieve at elevated pressure. Carbon 43, 95–107 (2005)
Kayode Coker, A.: Ludwig’s Applied Process Design for Chemical and Petrochemical Plants (Fourth Edition) Appendix C: Physical Properties of Liquids and Gases, Table C–4, C–6, pp. 827–862. Elsevier Inc (2007)
Duong, D.D.: Adsorption Analysis: Equilibria and Kinetics. Imperial College Press (1998)
Bathen, D., Breitbach, M.: Adsorptionstechnik, Springer-Verlag Berlin Heidelberg, 2001
Stegmaier, M.: Nonideal gas modelling of pressure swing adsorption processes. Adsorption 23, 455–464 (2017)
Ruthven, D.M., Principles of Adsorption and Adsorption Processes. John Wiley & Sons, Inc. (1984)
Dreisbach, F., Paschke, T.: Personal communication (2020)
Sereno, C., Rodrigues, A.: Can steady-state momentum equations be used in modelling pressurization of adsorption beds? Gas Separation & Purification 7, 167–174 (1993)
Marcinek, A., Guderian, J., Bathen, D.: Performance determination of high-purity N2-PSA-plants. Adsorption 93, 135 (2020)
Marcinek, A., Guderian, J., Bathen, D.: Process intensification of the high-purity nitrogen production in twin-bed Pressure. Swing Adsorption plants (2021). https://doi.org/10.1007/s10450-020-00291-8
Crittenden, B., Thomas, W.J.: Adsorption Technology and Design (1st Edition). Elsevier Ltd. (1998)
Acknowledgements
The authors thank CarboTech AC GmbH, Essen, for provisioning of CMS in any requested grade and quantity. Particularly Mr. Carsten Schledorn has supported the work with valuable comments and by his friendly fostering. Adsorption isotherm measurements were performed by 3P Instruments, Leipzig, Germany, and TA Instruments, Bochum, Germany. We are especially grateful to Dr. Frieder Dreisbach and Dr. Thomas Paschke for their espousal. We also thank Prof. Andreas Seidel-Morgenstern from the Max Planck Institute for Dynamics of Complex Technical Systems, Magdeburg, for his wise guidance to our mission even though he might not remember our informal talks at various scientific events. FH Münster University of Applied Sciences is thanked for respectable project grants.
Funding
Open Access funding enabled and organized by Projekt DEAL.
Author information
Authors and Affiliations
Corresponding author
Additional information
Publisher’s Note
Springer Nature remains neutral with regard to jurisdictional claims in published maps and institutional affiliations.
Electronic Supplementary Material
Below is the link to the electronic supplementary material.
Rights and permissions
Open Access This article is licensed under a Creative Commons Attribution 4.0 International License, which permits use, sharing, adaptation, distribution and reproduction in any medium or format, as long as you give appropriate credit to the original author(s) and the source, provide a link to the Creative Commons licence, and indicate if changes were made. The images or other third party material in this article are included in the article's Creative Commons licence, unless indicated otherwise in a credit line to the material. If material is not included in the article's Creative Commons licence and your intended use is not permitted by statutory regulation or exceeds the permitted use, you will need to obtain permission directly from the copyright holder. To view a copy of this licence, visit http://creativecommons.org/licenses/by/4.0/.
About this article

Cite this article
Marcinek, A., Möller, A., Guderian, J. et al. Dynamic simulation of high-purity twin-bed N2-PSA plants. Adsorption 27, 1149–1173 (2021). https://doi.org/10.1007/s10450-021-00320-0
Received:
Revised:
Accepted:
Published:
Issue Date:
DOI: https://doi.org/10.1007/s10450-021-00320-0