
1 Introduction
Groundwater inflow is one of the key issues impacting on the process of design and construction for tunnel projects, particularly for open face excavation methods. During tunnelling, extensive water inflow may cause unpredictable down time for the construction and may also introduce secondary effects of groundwater drawdown to the above ground, leading to ground movement or settlement impacts to sensitive buildings and utilities.
The predominant factor controlling groundwater flow towards the tunnel will, therefore, be the presence of weaknesses and jointing and the connectivity of these features to the aquifers within the rock mass. The major pathways for such flows are the geological faults that may occur at various points along the length of the tunnel route, and their associated sheared/shattered zones. Within the remaining rock mass any movement of groundwater will only occur as a result of fracture flow between interconnected discontinuities. The high strength of the rock mass and the local in situ stress state of the rock is likely to allow the presence of open jointing within the rock mass. These features, when encountered in the tunnel, may result in high groundwater inflows which need to be carefully controlled.
Knowledge in understanding and providing controls, including the designation of allowable limits of ingress, to the likely groundwater ingress that may occur during tunnelling is important. Whilst the occurrence of water is difficult to predict accurately, it is important to be prepared for large variations, both with respect to locations and volumes. Early planning to tackle the potential risks associated with water ingress is very important in order to set up appropriate mitigation measures ensuring the excavation work to be conducted in safe and controllable manners. With respect to estimating groundwater inflow into tunnels, several analytical methods can be used at the risk planning stage.
2 Analytical Methods For Estimating Water Inflow
Conventionally, there are four classical analytical methods being used to estimate water inflow into tunnels. These are: (1) Goodman method; (2) Heuer and Raymer method; (3) Heuer Analytical method; and (4) IMS method, and are discussed in the following sections.
2.1 Goodman Method
Estimations of groundwater inflow into tunnels are often carried out based on the equations proposed by Goodman et al. (1965). The relevant equation for deep tunnels states that the steady state radial groundwater inflow into a tunnel that is overlain by a column of water much larger than the tunnel radius can be approximated using the following formula:
where:q s = steady state inflow per unit length of tunnel (m3/s); k = equivalent hydraulic conductivity of rock mass (m/s); z = thickness of ground cover above the tunnel centre line (m); h1 = depth of standing water above ground surface, if present (m); and r = tunnel radius (m).
It is noted that the equation presented above, which is based on the paper by Goodman et al. (1965), appears slightly erroneous in the lower part, which would commonly result in a negative divisor. Later citations of this equation (Heuer 1995, 2005; Raymer 2001; McFeat-Smith et al. 1998) appear to have corrected for this fact and have amended the divisor to ln(2z/r).
Additionally, it should be noted that the Goodman function is not able to predict the water table drawdown, i.e. the transient phase. This equation is limited to steady state (long-term) inflow, supposing that the perturbed water level is known, fact that is rarely true, and does not address the short-term higher rates of heading inflow that are typically encountered during tunnel excavation. This method also takes no account of local variations in the geological conditions within each respective unit, and assumes the spread and distribution of the data already account for such features.
2.2 Heuer and Raymer Method
Based on Heuer (1995) study, an equation is proposed by Raymer (2001) for estimating tunnel water inflow from vertical recharge comprising a modified version of the Goodman equation, where a reduction factor is applied. The Goodman equation was found to overestimate tunnel inflows when reviewed against a number of tunnelling case studies. The equation proposed, using the same symbols as in Sect. 2.1, is as follows:
Similar to Goodman Method, this equation is limited to estimate steady state inflow as well as taking no account of local variations in the geological conditions, and is, therefore, unable to predict the water table draw-down.
2.3 Heuer Analytical Method
Heuer (1995, 2005) proposes a statistical method for predicting tunnel groundwater inflows based on an assessment of the frequency distribution of the rock mass hydraulic conductivity, as evaluated through water absorption packer tests within a respective geological unit. The methodology considers three possible models, based on the tunnel depth and ground conditions, in order to assess the statistical distribution of potential water inflows into the excavation. These three models comprise:
Vertical recharge. Applicable for tunnels where a recharge source of large water volume at constant head is close to the tunnel, such as beneath a large water body or within a highly permeable aquifer.
Radial flow. Comprises the standard equation for a fully penetrating well in a confined aquifer and is applicable to tunnels where water flows from all directions and the recharge source is far away.
Lateral flow. Applicable for tunnels where the predominant direction of water flow towards the tunnel is along lateral features such as weathered profiles or bedding. In this case the groundwater table is usually sufficiently close to the tunnel, and the water recharge sufficiently limited, such that tunnelling could result in notable drawdown of piezometric levels above the tunnel alignment.
Graphical presentations of typical conditions for each assessment model are presented in Fig. 1.

Graphical presentations of Heuer analytical method
Whilst this technique is relatively sound in theory, it is purely statistical in the sense that estimation parameters are considered and taken from Fig. 2. Similar to the above two methods, this method takes no account of local variations in the geological conditions.

Relationship between steady state inflow and equivalent permeability based on statistical data (Heuer 2005)
Based on Fig. 2, the distribution of equivalent rockmass permeability (k e, m/s) may be divided into various ranges: ≤3×10⁻⁸, 3 × 10⁻⁸ to 1 × 10⁻⁷, 1 × 10⁻⁷ to 3 × 10⁻⁷, 3 × 10⁻⁷ to 1 × 10⁻⁶, 1 × 10⁻⁶ to 3 × 10⁻⁶, 3 × 10⁻⁶ to 1 × 10⁻⁵, 1 × 10⁻⁵ to 3 × 10⁻⁵, 3 × 10⁻⁵ to 1 × 10⁻⁴, ≥1 × 10⁻⁴, and so on. However, the ranges selected for the water ingress assessment depend upon the site specific rockmass characters and the availability of field permeability testing records. Then, a histogram plot (equivalent rockmass permeability vs. frequency of test data) of field permeability data can be produced using these ranges. Based on the range of permeability the value of F h (heading inflow factor, as shown in the upper axis of Fig. 2), and the maximum value of normalised steady state inflow intensity (q s /H, where H = water head above the tunnel in terms of metre and q s = total water inflow, as shown in the right axis of Fig. 2) can be determined by selecting the appropriate analytical model (e.g. vertical recharge or radial/lateral flow, as shown in Fig. 2).
For water ingress assessment, the whole length of tunnel may be divided into number of reaches based on water head (H). The q s can be calculated as of normalised steady state inflow intensity multiplied by water head. Total water inflow rate per reach will then be calculated by summation across the permeability ranges of the product of “the percentage of distribution frequency of the range of permeability” and “the length of reach”.
2.4 IMS Method
The IMS Method (McFeat-Smith et al. 1998) is an empirical approach based on selected Hong Kong cases mainly in granitic and volcanic strata. The methodology makes predictions of water inflow based on a number of local factors including ground conditions, which should be assessed using the IMS classification system (McFeat-Smith et al. 1985), the tunnel depth and the tunnel distance from potential groundwater/water sources. The prediction of the initial inflow (Ii) and final inflow (Fi) are proposed:
where, IF is the rate of inflow of different geological conditions in l/min/m.
A detailed summary of the various input parameters required for inflow assessment using notable the IMS method is provided below:
IMS classification system. The IMS classification system (McFeat-Smith et al. 1985) is based on a simple relationship between weathering grade (based on BS5930: 1999) of rock mass and fracture index (i.e. rock joint spacing), thus called “initial classification” as summarised in the left-hand side of Fig. 3. The initial rock classes could be modified by the possibility of the rate of water inflow and sub-parallel jointing (SPJ) to the tunnel.

Summary chart of IMS rock mass classification (McFeat-Smith et al. 1985)
As noted, the rock classes may be modified after calculation of the water inflow using initial rock classes. The rate of water inflow is defined as: None (N, <0.1 l/min/m); Moderate (Mo, 0.1 < flow rate < 2 l/min/m); Major (Mi; 2 < flow rate < 4 l/min/m); and Large (L, >4 l/min/m), as shown in the right-hand side of Fig. 3.
Water source size factor (Sf). This parameter describes the nature of the potential groundwater source and is summarised in Table 1:
Head factor (Hf). The head factor is a measure of the water head above the tunnel and is summarised in Table 2:
Horizontal separation factor (df). The horizontal separation factor (as summarised in Table 3) is a measure of the plan distance between the tunnel and the water source, also “df” can be expressed as [1 − √(s/400)]:
As discussed above, the IF values for IMS rock classes (l/min/m) are summarised in Table 4:
Once the IMS rock class is determined, the IF value will be easy to obtain. Of particular note is that due to the relative tightness of zones of rock Class 5, being partly sealed by decomposed clayey/silty soils without open joints, is well illustrated. Therefore, the potential inflow rate of Class 5 is relatively smaller compared to Classes 3 and 4, as shown in Table 4.
3 Procedures of Water Inflow Assessment
Having reviewed the above analytical methods and references, the author’s proposed procedures of the water inflow assessment for hard rock tunnels are outlined as follows:
Step 1. Collecting geological data, ground and groundwater information, and permeability data along and in the vicinity of the tunnel alignment in order to prepare a geological longitudinal section together with a rock quality assessment along the tunnel.
Step 2. Preparing rockmass permeability histogram chart, rock mass quality versus permeability chart, etc. In this step, all available field and laboratory permeability testing data are reviewed in relation to rock mass quality. In addition, groundwater monitoring records as well as seasonal effects should be assessed in order to determine design groundwater level for the tunnel. Once the generalised design groundwater level is determined, the tunnel is divided into a number of reaches for the estimation of water inflow. For the rock mass quality assessment, several classification systems may be used based on the Q-system (Barton et al. 1974), RMR (Bienawski 1973, 1984) and IMS classification system (McFeat-Smith et al. 1985). As discussed in Sect. 2.4, IMS method uses its classification system to estimate water inflow. The IMS rock class can be correlated to Q (Barton et al. 1974; Barton 2000) as shown in Table 5.
Step 3. Estimating water inflow to the tunnel using the above methods together with the available information of geology, rock quality, rockmass permeability and water table. To have appropriate reasoning, at least two analytical methods should be used to compare the estimation results to each other in the risk planning stage. In addition, the assumptions of water inflow calculation have been based on:
-
Class of rock mass quality distribution against rock mass permeability;
-
statistical mean value of rock mass permeability in each rockmass quality class;
-
as Goodman and Heuer and Raymer methods are adopted, the equivalent circular section area of tunnel opening may be used.
Step 4. Identifying potential high water inflow zone (criteria refer to Step 5) of the tunnel to propose additional ground investigation works and probe drill during tunnel construction. Based on the estimation results from Step 3, it may identify numbers of high water inflow sections that may impact on the tunnel driving and surface sensitivity buildings. These potential high water inflow sections should be reported in connection with proposing appropriate measures to deal with it.
Step 5. Setting up grouting and ground treatment requirements in order to control groundwater inflow to the tunnel during tunnel construction. When tunnel construction is by means of open type excavation (e.g. drill and blast method, open mode tunnel boring machine, etc.), groundwater inflow will impact on tunnel driving, and grouting works is often necessary. The allowable water inflow limits and grouting requirements for the tunnel construction depend on the ultimate function of the tunnel, and the water-draw down (or settlement) limits agreed with the owner or operator of the existing structures and utilities; and should be designed to ensure the tunnel is being excavated in safe manners and to minimise the impact on environment above the tunnel. The grouting criteria and specified high water inflow zones play a key role of risk planning for tunnel projects, and should be documented in the construction contract of the Project Performance Requirements (or Project’s Particular Specification).
Step 6. Monitoring and reviewing updated tunnelling record during construction. In addition to mitigating against the effects of inflow within the tunnel, it is required to establish a comprehensive groundwater level and settlement monitoring programme during the construction phase. The monitoring programme should include continuous long-term monitoring of piezometers, settlement markers and tilt monitoring of sensitive structures, associated with contingency plan.
3.1 Case Example
For one of the tunnel projects in Hong Kong (HKG 2006), two horizontal directional drillholes (HDD) were drilled along two proposed tunnel alignments as shown in Figs. 4 and 5. The hole size of the HDD was 76 mm in diameter, and the total drill length of the holes, HDD-1 and HDD-2, were 240 and 310 m, respectively, and drilled upward at about 3°. A total of 14 and 25 permeability tests [i.e. water absorption (packer) tests] were conducted along HDD-1 and HDD-2 respectively.

Alignment of HDD holes

Topography setting of the site
With reference to the above procedure (Step 1): initial exercise to gather all available ground information was conducted.
-
The borehole logs of HDD-1 and HDD-2 indicated the first 52 and 20 m, respectively, were completely driven within soft ground (i.e. completely to highly decomposed Tuff), with localised corestones encountered. For the rest of the drill length, moderately to slightly decomposed tuff was identified.
-
The laboratory rock testing results identified that the tuff is very to extremely strong with strength ranging from 100 to 280 MPa.
-
Based on the borehole log descriptions: rock mass jointing is generally rough planar, widely spaced, occasionally close to medium spaced, extremely narrow to tight, iron–manganese stained or kaolin infilled, locally with narrow soil seams.
-
The groundwater monitoring records from vertical drillholes in the area indicated groundwater levels along the HDD alignments varied between 6 and 15 m.
-
The site measurement recorded that the total water outflow from HDD-1 and HDD-2 was 9 and 15 l/min, respectively.
-
The geological sections of the proposed tunnels (based on HDD holes information) are shown in Figs. 6 and 7.
Fig. 6 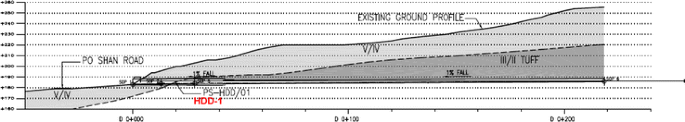
Geological section of low tunnel (based on HDD-1 borehole log)
Fig. 7 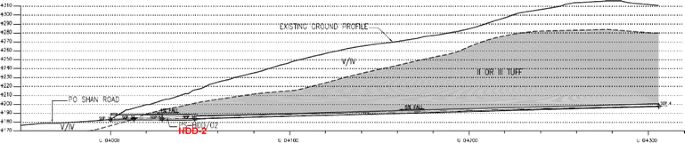
Geological section of high tunnel (based on HDD-2 borehole log)


(Step 2): Rock quality assessment to horizontal holes HDD-1 and HDD-2 had also been carried out based on borehole logs and examination to the rock core. The estimated Q values (Barton et al. 1974) along HDD-1 and HDD-2 varied from 0.13 and 33.8, respectively, in hard rock (moderately weathered rock or better) sections. Further review to permeability tests against rockmass quality to the test sections, the distribution of permeability tests and rockmass quality summaries are shown in Tables 6 and 7.
(Step 3): For this project, two analytical methods: Heuer and Raymer and IMS methods, were used to compare the estimation results to each other as presented in Tables 9 and 10 of Appendix for HDD-1 and HDD-2, respectively. In the calculation, mean values of rockmass permeability and IF values were used for Heuer and Raymer method and for IMS method, respectively.
(Step 4): As shown in Tables 9 and 10, the water inflow estimation identified several localised borehole sections with water inflow rate greater than 0.2 l/min/m, along the boreholes HDD-1 and HDD-2. The total length of these high water inflow sections was about 10% of the total tunnel lengths. The result of findings is summarised in Table 8.
(Step 5): Having considered the construction method by means of open type TBM and the operational function of the tunnel, it was decided to set up grouting criteria ensuring the excavation work to be conducted in safe and controllable manners and to minimise the impact on the surrounding environment. Finally three criteria were bound in Project Performance Requirements (or Project’s Particular Specification) of the construction contract:
-
A total discharge of greater than 10 l/min of water which persists 24 h after the completion of a 25-m length of probe hole.
-
A general inflow of greater than 20 l/min which persists after a period of 24 h for the excavated section within 25 m of the current face.
-
Prior to the installation of the permanent support lining, inflows of greater than 20 l/min on any 100 m length of tunnel.
(Step 6): Other than grouting criteria, a series of instrumentation including observation wells, inclinometers, building markers and settlement markers were required to be installed in the construction stage. These instrumentation schedule and requirements were also included in the Project Performance Requirements (or Project’s Particular Specification) of the construction contract document.
4 Conclusions
Analytical predictions of groundwater inflow into a drained hard rock tunnel have to be based on several simplifying assumptions:
-
homogeneous and isotropic rock mass permeability;
-
steady state flow conditions are in effect;
-
the tunnel has a perfectly circular cross-section that is held at constant hydraulic potential.
Whilst these assumptions clearly do not accurately represent the actual in situ conditions, especially in the case of the rock mass acting as a homogenous isotropic body, they are necessary in order to allow Darcy’s Law to be applied in the calculations. Due to the assumptions, the predicted water inflows into a tunnel are only approximate. However, the water inflow assessment produces data useful for the identification of potentially problematic portions of the alignment where extremely close attention should be paid to the pre-excavation probing and grouting works.
Based on the assessment results, early risk planning should be carried out to ensure that the tunnel construction works are proceed in a safe manner, particularly for high water inflow sections of the tunnel, and thus minimising the impact on the environment above the tunnel. The allowable water ingress rate and grouting criteria should be documented in the project’s performance requirements of the construction contract.
References
Barton N (2000) TBM tunnelling in jointed and fractured rock. AA Balkema, Rotterdam, Netherlands
Barton N, Lien R, Lunde J (1974) Engineering classification of rock masses for the design of tunnel support. Rock Mech Rock Eng 6(4):189–236
Bienawski ZT (1973) Engineering Classifications of jointed rock masses. Civ Eng S Afr 15:335–344
Bienawski ZT (1984) Rock mechanics design in mining and tunnelling. AA Balkema, Rotterdam, Netherlands
British Standards Institution (1999) BS 5930:1999 Code of practice for site investigations
Goodman R, Moye D, Schalkwyk A, Javendel I (1965) Ground-water inflow during tunnel driving. Eng Geol Bull IAEG 2(1):39–56
Heuer R (1995) Estimating rock tunnel water inflow. In: Proceedings of Rapid Excavation and Tunnelling Conference 1995, pp 41–60
Heuer R (2005) Estimating rock tunnel water inflow—II. In: Proceedings of Rapid Excavation and Tunnelling Conference 2005, pp 394–407
Hong Kong Government (2006) Landslide Preventive Works at Po Shan Road, Mid-levels for Contract No. GE/2005/45. Geotechnical Engineering Office, Civil and Development Engineering Department, Hong Kong Government
McFeat-Smith I, Turner VD, Bracegirdle DR (1985) Tunnelling conditions in Hong Kong. Hong Kong Engineer 13(6):13–25
McFeat-Smith I, MacKean R, Waldmo O (1998) Water inflows in bored rock tunnels in Hong Kong: prediction, construction issues and control measures. ICE Conference on Urban Ground Engineering, Hong Kong
Raymer JH (2001) Predicting groundwater inflow into hard-rock tunnels: estimating the high-end of the permeability distribution. In: Proceedings of Rapid Excavation and Tunnelling Conference 2001, pp 1027–1038
Open Access
This article is distributed under the terms of the Creative Commons Attribution Noncommercial License which permits any noncommercial use, distribution, and reproduction in any medium, provided the original author(s) and source are credited.
Author information
Authors and Affiliations
Corresponding author
Rights and permissions
Open Access This is an open access article distributed under the terms of the Creative Commons Attribution Noncommercial License (https://creativecommons.org/licenses/by-nc/2.0), which permits any noncommercial use, distribution, and reproduction in any medium, provided the original author(s) and source are credited.
About this article
Cite this article
Kong, W.K. Water Ingress Assessment for Rock Tunnels: A Tool for Risk Planning. Rock Mech Rock Eng 44, 755–765 (2011). https://doi.org/10.1007/s00603-011-0163-4
Received:
Accepted:
Published:
Issue Date:
DOI: https://doi.org/10.1007/s00603-011-0163-4