
Abstract
This paper proposes a hybrid Modified Coronavirus Herd Immunity Aquila Optimization Algorithm (MCHIAO) that compiles the Enhanced Coronavirus Herd Immunity Optimizer (ECHIO) algorithm and Aquila Optimizer (AO). As one of the competitive human-based optimization algorithms, the Coronavirus Herd Immunity Optimizer (CHIO) exceeds some other biological-inspired algorithms. Compared to other optimization algorithms, CHIO showed good results. However, CHIO gets confined to local optima, and the accuracy of large-scale global optimization problems is decreased. On the other hand, although AO has significant local exploitation capabilities, its global exploration capabilities are insufficient. Subsequently, a novel metaheuristic optimizer, Modified Coronavirus Herd Immunity Aquila Optimizer (MCHIAO), is presented to overcome these restrictions and adapt it to solve feature selection challenges. In this paper, MCHIAO is proposed with three main enhancements to overcome these issues and reach higher optimal results which are cases categorizing, enhancing the new genes’ value equation using the chaotic system as inspired by the chaotic behavior of the coronavirus and generating a new formula to switch between expanded and narrowed exploitation. MCHIAO demonstrates it’s worth contra ten well-known state-of-the-art optimization algorithms (GOA, MFO, MPA, GWO, HHO, SSA, WOA, IAO, NOA, NGO) in addition to AO and CHIO. Friedman average rank and Wilcoxon statistical analysis (p-value) are conducted on all state-of-the-art algorithms testing 23 benchmark functions. Wilcoxon test and Friedman are conducted as well on the 29 CEC2017 functions. Moreover, some statistical tests are conducted on the 10 CEC2019 benchmark functions. Six real-world problems are used to validate the proposed MCHIAO against the same twelve state-of-the-art algorithms. On classical functions, including 24 unimodal and 44 multimodal functions, respectively, the exploitative and explorative behavior of the hybrid algorithm MCHIAO is evaluated. The statistical significance of the proposed technique for all functions is demonstrated by the p-values calculated using the Wilcoxon rank-sum test, as these p-values are found to be less than 0.05.
1 Introduction
We face a large number of optimization challenges in engineering, for which optimization methods are required [1]. Optimization algorithms help us in a variety of ways in our daily lives. Optimization algorithms can be used to reduce expenses and faults in any system or to increase profits in a financial firm. Optimization algorithms can be classified into two main categories: deterministic algorithms and stochastic algorithms.
Deterministic algorithms pursue a firm procedure where for the starting point the deterministic algorithm will follow up the same path whenever we run the program. On the other hand, stochastic algorithms are random in finding the optimum values. So, every time we run the program the solutions will be different [2]. Traditionally, deterministic algorithms are used to deal with optimization problems that are characterized as small dimensions and less complex problems. Despite their capability to reach an exact and specific solution to optimization problems, they experience some serious impasses, and they can easily fall into the local optimal solution [3]. We can say that stochastic algorithms can overcome deterministic algorithms’ impasses. Heuristic optimization algorithms are methods that improve the efficiency of a search process by sacrificing completeness, examples of these methods are Nearest Neighbor (Greedy Algorithm) and local search algorithms. Although they can reach a “near-optimal” solution in a short time and consume a small memory space, they cannot guarantee to reach the optimal solution or reach a solution that is "good enough" [4]. As a result, meta-heuristic algorithms emerged that combine heuristic techniques in an upper-level framework to explore a search space efficiently. Metaheuristic-based algorithms provide a framework for optimization that employs stochastic features that are controlled by tunable parameters with knowledge acquisition operators to improve the current solution until the best possible solution is found [5]. Interestingly enough, nature-inspired phenomena helped in generating the most meta-heuristic algorithms, which can be divided into categories as listed in Fig. 1 [6].

Optimization methods
Nevertheless, there is not a single optimization algorithm that can operate efficiently with all classes of optimization issues “according to the No Free Lunch (NFL) Theorem” [7]. The community-based behavior of animal flocks is often an inspiration for swarm-based algorithms. The ability to work together to survive is the main asset of such a class. Particle swarm optimization (PSO), which imitates the social behavior of flocking birds, is one of the first swarm-based algorithms [8]. The particles (solutions) search for the best position in their surroundings (search space) “global best”. Throughout the flight, the first-rate places (local best) on the road to the optimum locations are noted. The grasshopper optimization algorithm (GOA) is a novel swarm intelligence algorithm inspired by grasshoppers' natural foraging and swarming behavior [9]. Saremi et al. presented the GOA algorithm in [9], which is a fascinating new swarm intelligence system that simulates grasshopper foraging and swarming behaviors. Grasshoppers are insects that are well-known as pests that wreak havoc on agricultural production and agriculture [9]. Their life cycle is divided into two stages: nymph and adulthood. Small steps and gradual movements describe the nymph phase, but long-range and rapid movements represent the maturity phase. The intensification and diversification phases of GOA are defined by nymph and adult movements. Moth-Flame Optimization (MFO) algorithm is a new nature-inspired algorithm inspired by moths' transverse orientation mechanism [10]. MFO uses a set of moths to search the decision space, reporting fitness functions at each time step and tagging the best solution with a flame. The movement of moths is based on their flames spiraling around them in a spiral direction. The Marine Predators Algorithm (MPA) is another well-known nature-inspired optimization algorithm that follows the rules that regulate optimal foraging strategy and predator–prey encounter rates in marine ecosystems [11].
The main inspiration for MPA is a widely used foraging strategy in ocean predators, specifically Lévy and Brownian movements, as well as an optimal encounter rate policy in predator–prey biological interactions. While seeking food in a prey-scarce environment, marine predators (such as sharks, tunas, and marlines) use the Lévy strategy, but when foraging in a prey-abundant environment, the pattern is frequently shifted to Brownian motion [12]. In a biological interaction between predator and prey, the optimum encounter rate policy is also determined by the sort of movement that each predator/prey makes and the velocity ratio of prey to predator [13]. Grey Wolf Optimizer (GWO) is a new type of optimization approach for swarm intelligence inspired by grey wolves (Canis lupus) [14]. The GWO algorithm is simulated after the natural hierarchy of authority and hunting mechanism of grey wolves. For mimicking the leadership hierarchy, four types of grey wolves are used: alpha, beta, delta, and omega. Furthermore, the three basic processes of hunting are implemented: seeking prey, encircling prey, and attacking prey. Heidari et al. established Harris Hawks Optimization (HHO), a novel optimization algorithm inspired by the simulation of the behavior of Harris Hawks [15]. The algorithm's base is the simultaneous attack method of Harris Hawks from numerous directions. For the time being, comparing nature-inspired human-based algorithms such as HSA to other nature-inspired algorithms gives more pleasing results. The Salp swarm algorithm (SSA) is a newly developed bio-inspired optimization algorithm based on the swarming mechanism of salps, which was first presented in 2017 [16]. SSA is an evolutionary algorithm that mimics the natural swarming mechanism of salps. In 2016, the whale optimization algorithm (WOA) was proposed by Mirjalili and Lewis [17]. It's a swarm intelligence optimization system that mimics the hunting behavior of humpback whales. Metaheuristics solve intractable optimization problems. Since the initial metaheuristic was proposed, several new algorithms have been created [18,19,20,21,22,23,24,25]. The algorithm's main goal is to solve the objective problem by mimicking the predatory behavior of a whale. In this paper, a modification in the nature-inspired and human-based optimization technique which is known as “Coronavirus Herd Immunity Optimizer” is proposed. In the year 2019 in China, an evolution of a severe acute respiratory syndrome which is called coronavirus disease (COVID-19) caused a considerable global outbreak that gave rise to a major public health issue [26]. The coronavirus pandemic and specifically the herd immunity against COVID-19 gave the main concepts to the Coronavirus Herd Immunity Optimizer (CHIO) algorithm. Outperforming several other biologically inspired algorithms, the Coronavirus Herd Immunity Optimizer (CHIO) is a competitive human-based optimisation tool. Compared to other optimization approaches, CHIO performed efficiently. Nevertheless, CHIO can only handle local optima, which limits its accuracy in solving intricate global optimization problems. Consequently, the Coronavirus Herd Immunity Optimizer (CHIO) algorithm has a poor rate of convergence during the iterative process and is easily prone to falling into a local optimum in high-dimensional space, which is why we propose Enhanced Coronavirus Herd Immunity Optimizer (ECHIO). However, considering that AO has great local exploitation capabilities, its global exploration skills are restricted. The AO algorithm may exhibit early convergence and poor global exploration when used to optimize difficult, high-dimensional engineering problems. When optimizing complex multidimensional problems, the AO runs into challenges, such as poor exploration efficiency and poor convergence behavior. Then, in order to overcome these drawbacks, such as CHIO's poor exploitation skills and the AO algorithm's insufficient exploration capabilities, the Modified Coronavirus Herd Immunity Aquila Optimizer (MCHIAO), a novel metaheuristic optimizer, is presented. It is modified to handle feature selection issues. Three different contributions have been applied to the CHIO algorithm to increase exploration efficiency by keeping the ideal balance between it and the search's exploitation of an optimal solution. The main contributions of the current work can be summarized as:
-
Cases categorizing according to the status vector.
-
Enhancement of the gene's equations for new genes applying chaotic maps.
-
Generating a new formula for switching between narrowed and expanded exploitation.
-
Validate the proposed MCHIAO through testing against 12 state-of-the-art algorithms.
-
Wilcoxon statistical analysis and Friedman average rank are conducted to validate the proposed MCHIAO.
-
On 130 benchmark functions, the proposed hybrid algorithm's performance is evaluated. The benchmarks comprise 23 standard benchmark functions, 29 CEC-2017 test functions, 10 CEC-2019 test functions, 24 unimodal functions, and 44 multimodal functions.
-
Test the proposed MCHIAO algorithm on six real-world engineering problems.
The sections of this paper are organized in the following order:
Section 2 presents the CHIO algorithm, the inspiration beyond it, and its main concepts. The Aquila algorithm, its origins of inspiration, and its core perspectives are all presented in Sect. 3. Section 4 outlines the proposed hybrid algorithm MCHIAO and the details of the contributions. Section 5 presents the results of a comparison between the MCHIAO algorithm, CHIO algorithm, Aquila algorithm, and other state-of-the-art algorithms applied to different benchmark functions with different dimensions and as well as 6 common real-world problems. Section 6 shows the conclusion and direction for future work.
2 Corona virus herd immunity optimization algorithm
2.1 Inspiration
The COVID-19 pandemic has been a global threat. Herd immunity is a highly effective method to tackle the COVID-19 pandemic [27]. The resistance to the spread of an infectious illness within a community or herd is known as “Herd Immunity.” On March 13th, the British Government’s chief scientific adviser, Sir Patrick Vallance pointed out that waiting for herd immunity would result in getting 60% of the population being infected with COVID-19. Herd immunity occurs when a considerable section of a community gets immune to a disease stopping its spread from one person to another. There are two ways to achieve herd immunity for COVID-19:
-
I.
Vaccines
-
II.
Infection
Without causing suffering or illness, vaccines create immunity and protect people against pandemics. Despite the effectiveness of the concept of vaccination, it has a serious drawback, some people may reject taking vaccines because of fear of the possible side effects and risks. Another drawback of the vaccine is that it may fade over time and requires revaccination. Natural infection is an effective path to obtaining herd immunity. It can be achieved when an appropriate portion of people in the community has recovered from a specific disease and have evolved antibodies that would work against future infection [28]. Herd immunity is suggested to be one of the mechanisms to control and slow down the COVID-19 widespread disease. Bear in mind that the CHIO algorithm put in an application “the survival of the fittest” principle from the Darwinian Theory. Herd immunity can be described as the indirect protection from contagion given to susceptible human beings when an appropriate proportion of immune persons exist in a population. The population-level effect is frequently considered in the vaccination programs which target to establish herd immunity for those who cannot be vaccinated and still be protected against contra disease. The susceptible-infectious-recovered (SIR) model has been widely utilized to survey the dynamic growth of COVID-19 in a large population [29]. The SIR model classifies the population into three categories:
-
I.
Susceptible individuals: The virus has not yet infected these participants, but when a susceptible individual and an infectious individual come into infectious contact without following the recommended social distancing rules, they can be infected.
-
II.
Infected individuals: Participants in this category have been verified to be infected, and they can spread the virus to others who are susceptible.
-
III.
Recovered (immune) individuals: These are the individuals who are protected against the virus either because they have taken the vaccine or because they have been infected with the virus and recovered.
2.2 Mathematical model of CHIO [30]
In this section, the mathematical model of the CHIO algorithm is illustrated in steps
2.2.1 Initializing CHIO parameters
where \(f(x)\) is the objective function (immunity rate) and it is calculated for each case (individual).
where \({x}_{i}\) represents the gene (decision variable) indexed by \(i\), while \(n\) represents the overall amount of decision variables in every case.
where \({lb}_{i}\) is the lower bound of the gene \({x}_{i}\) and \({ub}_{i}\) is the upper bound of it.
The CHIO algorithm has two control parameters:
-
Basic reproduction Rate (\({BR}_{r}\)): By spreading the virus among individuals, it controls the CHIO operators.
-
Maximum infected case age (\({Max}_{Age}\)): Determine the infected cases’ status when a case reaches \({Max}_{Age}\), it is either recovered or died.
The CHIO algorithm has another four parameters:
-
\(Max\_Itr\): Represents the maximum number of iterations.
-
\({C}_{0}\): This value represents the number of primary infected cases, which is typically one.
-
\(HIS:\) Represents the population size.
-
\(n:\) Represents the problem dimensionality.
2.2.2 Generating herd immunity population:
Randomly CHIO generates a set of individuals (cases) as many as \(HIS\). The set of the generated individuals is stored as a two-dimensional matrix of size \(n \times HIS\) in the herd immunity population (\(HIP\)) as follows:
where each row represents a case \({x}^{j}\), which is calculated as follows:
For each case, the objective function is calculated using Eq. (1.1).
The fitness for each search agent is set as follows:
where \(S\) is the status vector of length \(HIS\) in the \(HIP\) for every case initiating from zero which means a case that is susceptible or rather one that represents an infected case.
2.2.3 Coronavirus herd immunity evolution
In this section, the main improvement loop of CHIO is presented. The gene (\({x}_{i}^{j}\)) of the case (\({x}^{j}\)) either remains the same or becomes classified as an infected, susceptible, or immune case according to the percentage of the basic reproduction rate (\({BR}_{r}\)) as follows:
where \(r\) is a random value between 0 and 1.
-
For infected cases:
where \({x}_{i}^{j}(t+1)\) is the new gene and the value \({x}_{i}^{c}(t)\) is chosen randomly based on the status vector (\(S\)) from any infected case \({x}^{c}\) as \(c= \left\{i|{S}_{i}=1\right\}\) and \(r\) is the random number between \(0\) and \(1\).
-
For susceptible cases:
where \({x}_{i}^{j}(t+1)\) is the new gene and the value \({x}_{i}^{m}(t)\) is chosen randomly based on the status vector (\(S\)) from any susceptible case \({x}^{m}\) as \(m= \left\{i|{S}_{i}=0\right\}\) and \(r\) is the random number between \(0\) and \(1\).
-
For immune cases:
where \({x}_{i}^{j}(t+1)\) is the new gene and the value \({x}_{i}^{v}(t)\) is chosen randomly based on the status vector (\(S\)) from any immuned case \({x}^{v}\) as \(f\left({x}^{v}\right)=arg {min}_{j\left\{k|{S}_{k}=2\right\}}f({x}^{j})\).
2.2.4 Update the herd immunity population:
For each generated case \({x}^{j}\left(t+1\right)\), the immunity rate \({f(x}_{i}^{j}\left(t+1\right))\) is calculated and if the generated case \({x}^{j}\left(t+1\right)\) is better than the present case \({x}^{j}\left(t\right)\) such as\(f\left({x}^{j}\left(t+1\right)\right)<f({x}^{j}(t))\), the current case is replaced by the generated case.
If the status vector (\({S}_{j}=1\)), the age vector \(({A}_{j})\) is increased by one.
Based on the herd immunity threshold, for each case \({x}^{j}\left(t\right)\) the status vector (\({S}^{j})\) is updated which employs the following equation:
where, \(\vartriangle f\left( x \right) = \frac{{\mathop \sum \nolimits_{i = 1}^{HIS} f\left( {x_{i} } \right)}}{HIS}\).
Where \(is\_Corona({x}^{j}(t+1))\) represents a binary value that equals one in case of the new case \({x}^{j}(t+1)\) gained a value from the infected case and \(\Delta f(x)\) represents the mean value of the population immune rates.
2.2.5 Fatality cases
When the immunity rate \((f\left({x}^{j}\left(t+1\right)\right))\) of the current infected case does not improve for a specific time of iterations which is specified by the parameter \(Max\_Age\) such as \({A}_{j}\ge Max\_Age\) then this case is considered dead. Then, it is regenerated from scratch using the following equation:
where \(\forall i=\mathrm{1,2}, \dots , n\)
Over and above, \({A}_{j}\) and \({S}_{j}\) are set to zero.
2.2.6 Stop criterion
CHIO repeats the main loop until the maximum number of iterations is achieved. The entire number of immune cases in addition to the susceptible cases command the population and the infected individuals disappear. Figure 2 represents the flowchart of CHIO. The pseudo-code of the CHIO is described in algorithm 1.

CHIO flowchart [30]
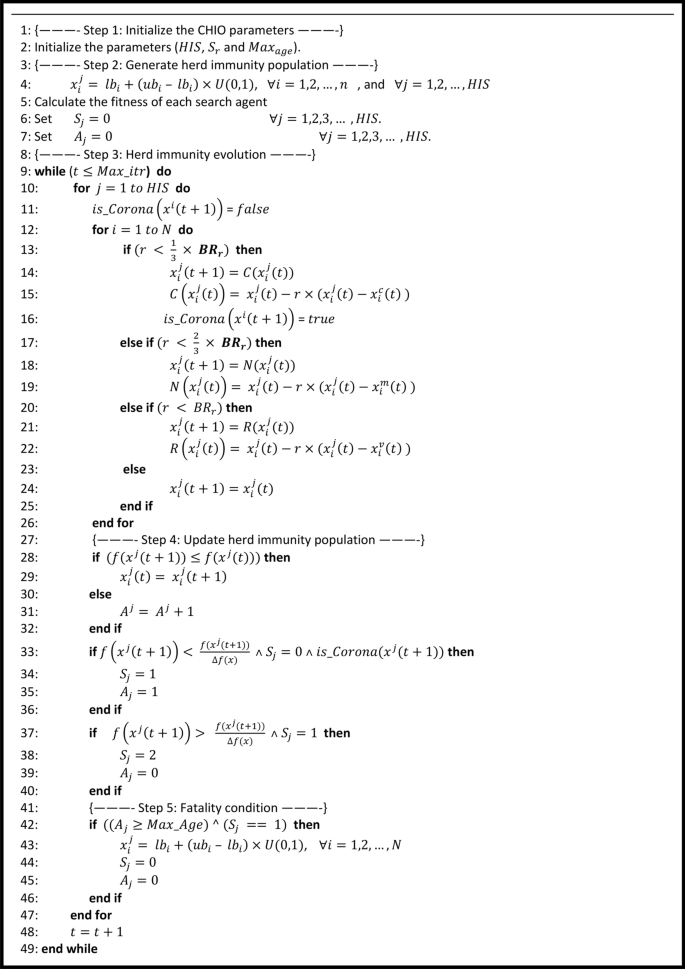
CHIO pseudo-code [30].
3 Aquila optimization algorithm [31]
3.1 Inspiration
One of the most well-known raptors in the Northern Hemisphere is the Aquila. Aquila catches a variety of prey, primarily rabbits, hares, deeps, marmots, squirrels, and other ground animals, using its speed, agility, strong feet, and long, pointed talons. Aquila may be seen in nature, along with their peculiar behaviors.
Aquila may maintain 200 km2 or larger holdings. They build large nests on mountains and other high areas. They reproduce in the spring, and because they are monogamous, they are likely to remain together for the rest of their lives. Aquila is one of the most researched birds in the world because of its bold hunting behavior. Aquila hunt squirrels, rabbits, and many other creatures with their speed and razor-sharp talons. Even mature deer have been known to be attacked by them.
The Aquila is known to primarily employ four different hunting techniques, each of which has several notable variations. Depending on the circumstances, most Aquila can deftly and swiftly switch between different hunting techniques. The following statements describe Aquila's hunting techniques.
-
In the first method, the Aquila hunts birds in flight using the first technique, high soar with a vertical stoop, in which it soars far above the ground.
-
The Aquila undertakes a lengthy, low-angled glide after exploring its prey, increasing its speed as the wings continue to shut. The Aquila must have a height advantage over its prey for this strategy to be effective. To simulate a thunderclap just before the encounter, the wings and tail are opened, and the feet are propelled forward to seize the prey.
-
Aquila is known for using the second technique, contour flying with brief glide attack, the most frequently. In this technique, the Aquila climbs at a low height above the ground. The target is then pursued relentlessly, whether it is flying or running. This strategy is advantageous for pursuing seabirds, nesting grouse, or ground squirrels.
-
A low flight and a gradual descending assault are the third strategies. In this, the Aquila descends to the ground and then advances on the victim. The Aquila chooses its victim and attempts to enter by landing on the neck and back of the animal. For sluggish prey, such as rattlesnakes, hedgehogs, foxes, and tortoises, as well as any species lacking an escape reaction, this hunting technique is used.
-
The Aquila walks on the ground while attempting to draw its prey in the fourth technique, known as walking and grabbing prey. It is used to remove the young of big prey, such as sheep or deer, from the coverage area.
As a whole, Aquila is one of the most knowledgeable and proficient hunters—possibly second only to humans. The methods mentioned above formed the primary sources of inspiration for the suggested AO algorithm. These processes are modeled in the AO in the next subsections.
3.2 Mathematical model of AO
3.2.1 Generating AO population
The population of candidate solutions (X) as shown in Eq. (2.1), which is created stochastically between the upper limit (UB) and lower bound (LB) of the given problem, serves as the starting point for the optimization procedure in the population-based approach known as AO. In each iteration, the best answer so far is roughly decided to be the best candidate.
where N is the total number of candidate solutions (population), \({X}_{i}\) indicates the decision values (positions) of the \({i}^{th}\) solution, X is the set of current candidate solutions, which are generated randomly by applying Eq. (2.2), and Dim denotes the problem's dimension size.
When a rand is a random number, \({LB}_{j}\) refers to the \({j}^{th}\) lower bound, and \({UB}_{j}\) represents to the \({j}^{th}\) upper limit of the given issue.
3.2.2 Aquila algorithm evolution
In this section, the Aquila optimization algorithm's main steps are presented. The AO algorithm mimics Aquila's behavior during hunting by displaying the activities taken at each stage of the hunt. Thus, the four methods used in the proposed AO algorithm's optimization processes are high soar with a vertical stoop to select the search space; contour flight with a short glide attack to explore within a diverged search space; low flight with a slow descent attack to exploit within a converge search space; and walk and grab prey to swoop.
Based on this condition, if \(t\le (\frac{2}{3})\times T\), the exploration steps will be thrilled; otherwise, the exploitation steps will be carried out, and the AO algorithm can switch from exploration steps to exploitation steps utilizing different behaviors.
Aquila behaviors are modeled as a mathematical optimization paradigm that chooses the optimum solution while taking into account several restrictions. The following is the mathematical representation of the AO.
3.2.2.1 Step 1: Expanded exploration (\({{\varvec{X}}}_{1}\))
In the initial method (\({X}_{1}\)), the Aquila determines the ideal hunting location by high-flying with a vertical stoop after identifying the prey region. Here, the AO extensively explores from a high altitude to pinpoint the location of the prey in the search space. The mathematical representation of this behavior is given in Eq. (2.3).
where \({{\varvec{X}}}_{1}({\varvec{t}}+1)\) is the result of the first search technique (\({X}_{1}\)) for the answer to the next iteration of the problem t. The best answer up until the \({t}^{th}\) iteration, \({{\varvec{X}}}_{{\varvec{b}}{\varvec{e}}{\varvec{s}}{\varvec{t}}}\left({\varvec{t}}\right)\), represents the approximate location of the prey. The enlarged search (exploration) is managed through the number of iterations using the equation (\(\frac{1 - t}{T}\)). The location means the value of the connected current solutions at the \({t}^{th}\) iteration, or \({{\varvec{X}}}_{{\varvec{M}}}\left({\varvec{t}}\right),\) is determined using Eq. (2.4). A random number between 0 and 1 is called rand. The current iteration and the maximum number of iterations are represented, respectively, by t and T.
where N is the number of potential solutions (population size) and Dim is the problem's dimension size.
3.2.2.2 Step 2: Narrowed exploration (\({{\varvec{X}}}_{2}\))
In the second technique (\({X}_{2}\)), the Aquila circles over the intended prey, prepares the terrain, and then strikes after being spotted from a great height. Contour flying with a short glide attack is this technique.
Here, AO prepares for the attack by closely examining the chosen location of the intended victim. This behavior is represented quantitatively in Eq. (2.5).
where \({X}_{2}(t+1)\) is the result of the second search technique (\({X}_{2}\)) and represents the answer of the subsequent iteration of the problem t. Levy(D) is the levy flight distribution function that is determined using Eq. (2.6), where D is the dimension space.
At the \({i}^{th}\) iteration, \({X}_{R}(t)\) is a random solution selected from the interval [1 N].
where u and \(\upsilon\) are random numbers between 0 and 1, and s is a constant value set to 0.01. \(\sigma\) is determined by applying Eq. (2.7).
where \(\beta\) is a constant with the value 1.5.
The spiral form in the search is presented in Eq. (3.5) using the variables y and x, which are computed as follows.
where,
For a set number of search cycles, \({{\varvec{r}}}_{1}\) takes a value between 1 and 20, and \({\varvec{U}}\) is an insignificant value fixed at 0.00565. \({D}_{1}\) Consists of integers from 1 to the search space's length (Dim), and \(\omega\) is a tiny value fixed at 0.005.
3.2.2.3 Step 3: Expanded exploitation (\({{\varvec{X}}}_{3}\))
In the third approach (\({X}_{3}\)), the Aquila descends vertically with an initial attack to ascertain the prey reaction after the prey region has been precisely designated and the Aquila is prepared for landing and attacking. Low flying with gradual descending assault is the name given to this tactic. Here, AO takes advantage of the target's chosen location to approach its victim and attack. The mathematical representation of this behavior is given in Eq. (2.13).
where \({X}_{3}(t+1)\) represents the result of the third search technique (\({X}_{3}\)) for the solution of the subsequent iteration of the constant t. The best-obtained solution,\({X}_{best}(t)\), reflects the approximate position of the prey up until the \({i}^{th}\) iteration, and the mean value of the current solution at the \({t}^{th}\) iteration, \({X}_{M}(t),\) is determined using Eq. (2.4). A random number between 0 and 1 is called \(rand\). The exploitation adjustment parameters \(\alpha\) and \(\delta\), are set in this study at a low value (0.1). The given problem's \(LB\) and \(UB\) abbreviations stand for lower and upper bounds, respectively.
3.2.2.4 Step 4: Narrowed exploitation (\({{\varvec{X}}}_{4}\))
In the fourth technique (\({X}_{4}\)), the Aquila approaches the target and then assaults it over the land in accordance with its stochastic motions. This strategy is known as "walk and grab prey." Finally, AO engages the prey at the last position. The mathematical representation of this behavior is given in Eq. (2.14).
where \({X}_{4}(t+1)\) is the result of the fourth search technique (\({X}_{4}\)), which is created for the following iteration of t. The term "QF" refers to a quality function that is derived using Eq. (2.15) and is used to balance the search techniques. \({G}_{1}\), which is produced using Eq. (2.16), stands for multiple AO movements that are employed to follow the prey during the hunt. The flight slope of the AO used to follow the prey during the journey from the starting position (1) to the last site (t), which is created using Eq. (2.17), is represented by \({G}_{2}\) by decreasing values from 2 to 0. The solution as of the \({t}^{th}\) iteration is X(t).
The quality function value at the \({t}^{th}\) iteration is denoted by \(QF(t)\), and the random value, rand, is a number between 0 and 1. The current iteration and the maximum number of iterations are represented, respectively, by t and T. Using Eq. (2.6), we can derive the levy flight distribution function, \(Levy(D)\).
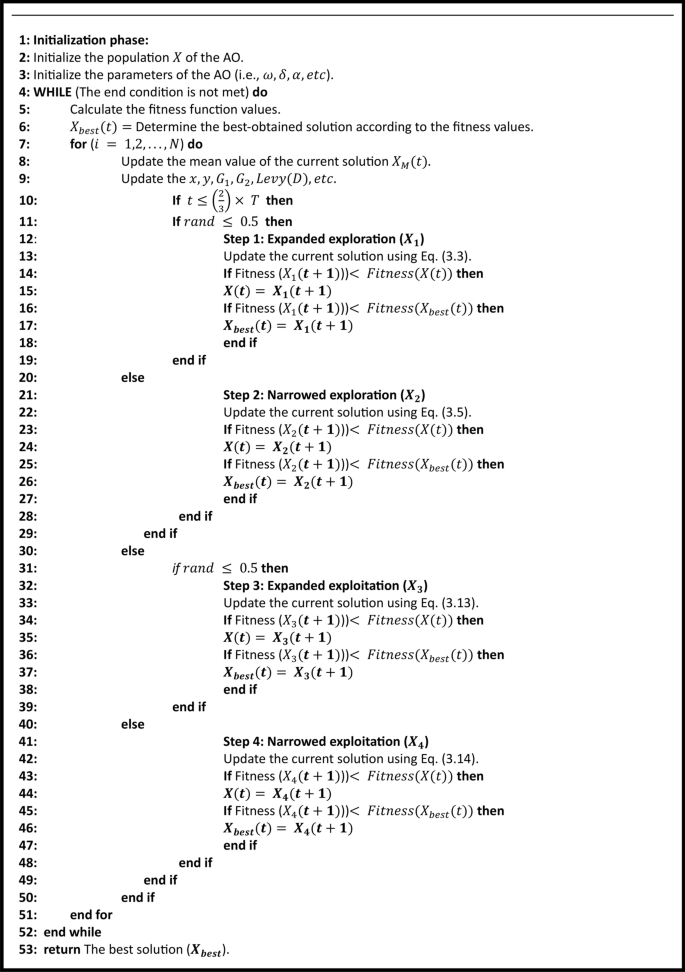
Algorithm 2 explains the pseudo-code of the AO. The flowchart of the AO is presented in Fig. 3.

Aquila flowchart [31]
Aquila Optimizer [31].
4 The proposed modified coronavirus herd immunity aquila optimization algorithm (MCHIAO)
This section outlines the hybrid algorithm that we developed by enhancing and fusing CHIO and AO, two distinct optimization algorithms. As AO is a population-based algorithm and CHIO is a human-based algorithm, they are both metaheuristic optimization algorithms. The suggested method comprises two phases: exploration and exploitation, with the exploration phase performed by ECHIO and the exploitation phase by the AO. The first of two modifications to CHIO is the categorization of cases, followed by applying chaotic maps to improve the equation values for the new genes. Based on this condition, if \(t\le (\frac{2}{3}) T\), the exploration steps will be excited; otherwise, the exploitation steps will be carried out, and the MCHIAO algorithm can switch from exploration steps to exploitation steps utilizing this behavior. Finally, the two scenarios of exploitation using AO are used in the proposed algorithm in addition to an enhancement to the random value used to switch between narrowed and expanded exploitation. In the subsections that follow, the specifics of the proposed MCHIAO algorithm are covered.
4.1 Enhanced coronavirus herd immunity optimization algorithm (ECHIO)
4.1.1 Cases categorizing
For every search and optimization algorithm, exploration and exploitation exemplify influential characteristics. The inability to achieve the balance between both exploration and exploitation leads the optimization algorithms to fall into local optimum in optimization problems.
Supporting optimal “exploitation” of the existing results and promoting “exploration” for new ones is our main goal in this proposed contribution.
Instead of categorizing the cases (individuals) according to the basic reproduction rate (\({BR}_{r}\)) parameter which leads the CHIO algorithm to be trapped in the local optima, we use the status vector (\(S\)) in classifying the cases (individuals) that caused a local optima avoidance and a faster convergence curve as follows:
4.1.2 New genes’ value equation enhancement:
In the coronavirus herd immunity evolution for infected, susceptible, and immune cases instead of adding the current gene’s value to the dissimilarity among the existing gene’s value and a random gene adapted from infected, susceptible, and immune cases as shown in Eqs. 1.6, 1.7, and 1.8, respectively, we use subtraction in Eqs. 3.2, 3.3, and 3.4.
In addition, chaotic maps are used instead of random parameters due to their expected ability to increase the speed of convergence. Equations 3.2, 3.3, and 3.4 are modified to clarify the proposed claim. Chaotic systems or simply chaos can be described as behavior that falls between rigid regularity and randomness. One of the most essential characteristics of the chaotic system is that it exhibits extreme sensitivity to initial conditions. Many studies suggested that the spread of COVID-19 can be categorized as a chaotic system.
The chaotic behavior of the coronavirus inspired us to use the chaotic system by replacing the random parameter (\(r\)) with the parameter (\(m\)).
Local minima avoidance and rapid convergence rate are the main reasons for us to use chaos optimization. Chaos theory plays an important and effective role in overcoming these problems.
The main three important dynamic properties of chaos can be described as quasi-stochastic, ergodicity, and sensitive dependence on the initial conditions.
Quasi-stochastic can be described as the ability to replace random variables with the values of a chaotic map. Ergodicity expresses the ability of chaotic variables to search the non-recurrently of all states in a specified range.
Replacing the random parameter “\(r\)” with the chaotic value “\(m\)” allows an enormous effect on enhancing the exploration phase of the proposed ECHIO algorithm which assists in finding a new promising search region hopefully for the optimum solution.
The new enhanced equations for Eqs. 1.6, 1.7, and 1.8 respectively will be as follows:
where the m vector can be calculated as shown in Eq. 3.5.
This chaotic behavior in the final stage aids in alleviating the two issues of entrapment in local optima and slow convergence rate while solving high-dimensional problems. In this article, 10 chaotic maps have been used to improve the performance of the CHIO algorithm as illustrated in Table 1 [31].
Figure 4 illustrates the flowchart of the proposed optimization algorithm ECHIO. Figure 5 presents the graphical description of the proposed ECHIO algorithm. The pseudo-code of the proposed algorithm ECHIO is illustrated in Algorithm 3.

ECHIO flowchart

Description of the proposed ECHIO
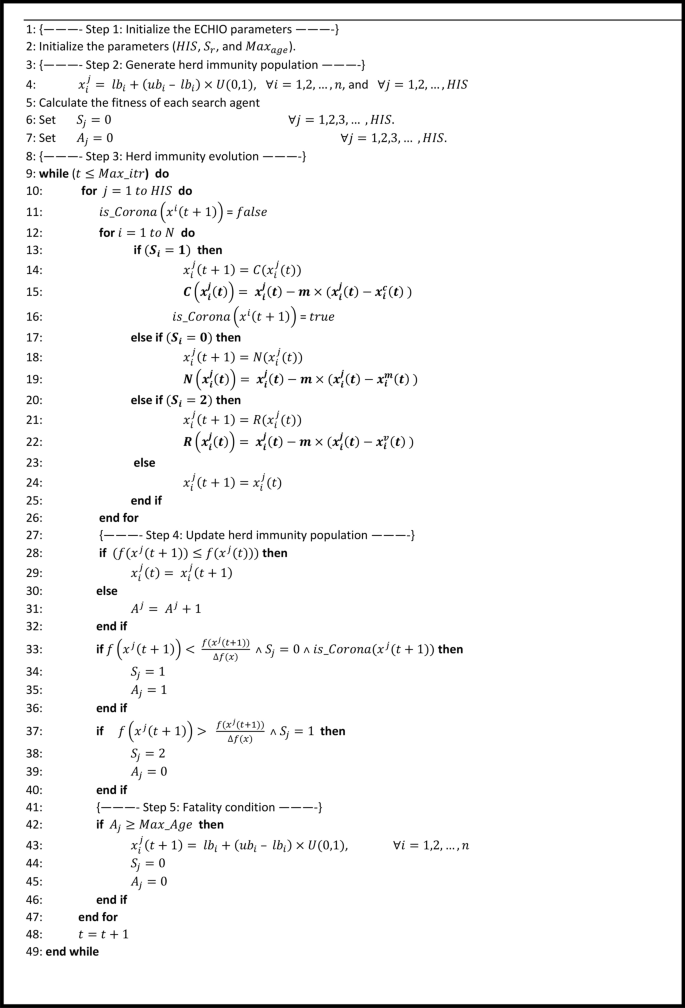
The proposed ECHIO pseudo-code.
4.2 Selection between the narrowed and expanded exploitation in the AO algorithm
In the AO algorithm, a random value \(rand\) is used to switch between the Narrowed and Expanded exploitation cases, as \(rand\) is a random number between 0 and 1.
To improve the algorithm's performance, we modified \(rand\) value as shown in Eq. 3.6.
As t represents the current iteration and T is the maximum number of iterations, respectively.
4.3 Hybrid ECHIO with AO algorithms (MCHIAO)
The Coronavirus Herd Immunity Optimizer (CHIO) outperforms certain other biologically-inspired algorithms as one of the competitive human-based optimisation techniques. CHIO performed well in comparison to other optimisation techniques. However, CHIO is limited to local optima, which reduces the precision of complex global optimisation issues. Therefore, in high-dimensional space, it is simple to fall into a local optimum, and the Coronavirus Herd Immunity Optimizer (CHIO) algorithm has a low rate of convergence during the iterative process. However, AO's global exploration skills are limited, despite the fact that it possesses strong local exploitation capabilities. When AO algorithm is applied to optimize challenging, high-dimensional engineering problems, it may experience early convergence and poor global exploration. The AO encounters issues while optimizing challenging multidimensional problems, including subpar convergence behavior and subpar exploration efficiency. The Modified Coronavirus Herd Immunity Aquila Optimizer (MCHIAO), a novel metaheuristic optimizer, is then introduced to get over these limitations such as the low exploitation skills in CHIO and the insufficient exploration abilities of the AO algorithm and modify it to address feature selection problems.
Figure 6 below illustrates the flowchart of the proposed optimization algorithm MCHIAO and the pseudo-code of the proposed algorithm MCHIAO is illustrated in Algorithm 4.

MCHIAO flowchart
The algorithm starts by initializing the MCHIAO parameters \({\varvec{H}}{\varvec{I}}{\varvec{S}}\), \({{\varvec{S}}}_{{\varvec{r}}}\), \({\varvec{\delta}}\), \(\boldsymbol{\alpha },\) and \({{\varvec{M}}{\varvec{a}}{\varvec{x}}}_{{\varvec{a}}{\varvec{g}}{\varvec{e}}}\). Herd immunity population is generated, and the fitness function of each search agent is calculated. Herd immunity evolution is initialized and the exploitation parameters \({G}_{1}, {G}_{2}, Levy(D)\) are updated. The selection between the exploration and the exploitation cases is based on the condition \(t \le \left(\frac{2}{3}\right)\times T\). The exploration phase is handled by the proposed ECHIO algorithm, as the cases are categorized as infected, susceptible, and immune cases based on the status vector. The exploitation phase consists of two categories, expanded exploitation and narrowed exploitation. The selection between the two exploitation cases is based on the generated formula \(R.\) The herd immunity population is updated, and the new positions of the agents are calculated. After the fatality condition is met, the best solution is obtained.
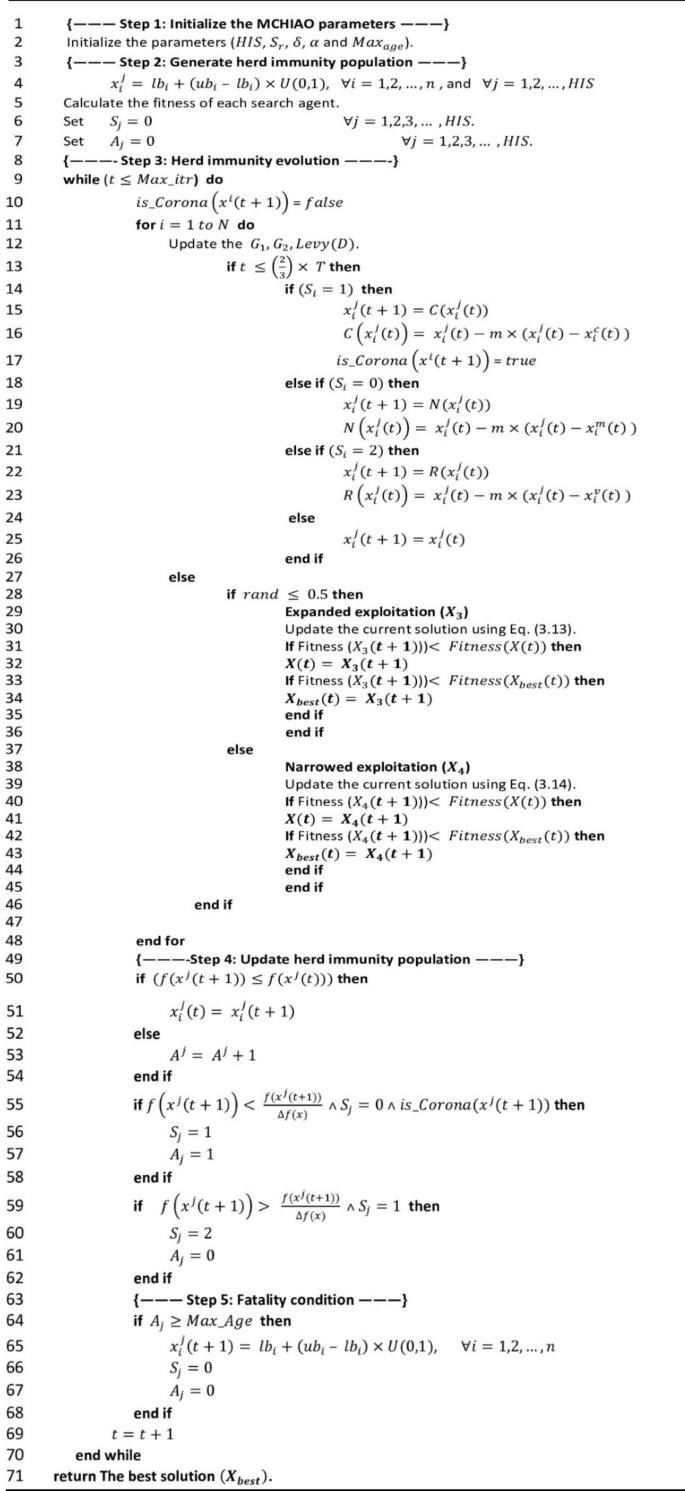
The proposed MCHIAO pseudo-code.
5 Experimental results & analysis
The performance of the proposed MCHIAO is evaluated for variants benchmark functions including 23 CEC 2005, 29 CEC 2017, 10 CEC 2019, 24 unimodal, 44 multimodal test functions, and six different real-world problems. The proposed MCHIAO is compared as well against twelve state-of-the-art algorithms (GOA, MFO, MPA, GWO, HHO, SSA, WOA, IAO, NOA, NGO, AO, and CHIO), conducting Wilcoxon statistical analysis to statistically validate all outcomes. MATLAB/SIMULINK® 2018b is used to accomplish all simulations. The metrics used to define the performance of the algorithm against the twelve competitive state-of-the-art algorithms are mean, standard deviation, rank, percentage, and total rank. The experimental results include the mean value (Mean), standard deviation (Std), and rank order (Rank). In the case of the minimum problem, the algorithm's discovery of the optimal solution is more likely the smaller the best value; similarly, the algorithm's comprehensive optimization capabilities are enhanced by the lower the mean value; and the algorithm's stability is improved by the smaller standard deviation. The algorithms are ranked using a ranking based on the mean value, which allows for a more intuitive comparison based on the magnitude of the mean value. The algorithm with the highest ranking among those ranked equally is shown.
The Wilcoxon signed-rank test (also called the Wilcoxon signed-rank sum test) is a nonparametric test used to compare data. For within-group comparison of algorithms generally Wilcoxon signed-rank test can be applied to analyze each algorithm within-group. We have calculated the mean result for each algorithm as all of the algorithms are executed with a maximum of 500 iterations and 51 runs. The Friedman average rank test is used for evaluating the performance of the various optimization algorithms, with the best result of each measure in each function highlighted in bold in the result tables.
5.1 Case1: MCHIAO performance through 23 CEC 2005 benchmark
In this section, 23 benchmark functions are considered to evaluate the proposed MCHIAO’s performance. Each of these test functions is a minimization problem of varying size and difficulty. Table 2 shows the benchmark functions, where Dim represents the function's dimension, Range represents the function's search space boundaries, and \({f}_{min}\) is optimum.
5.1.1 MCHIAO Vs AO and CHIO
MCHIAO is run against the original CHIO and AO algorithms on the different functions of 23 benchmark. Numerical results in Table 3 demonstrate the mean, standard deviation, and rank of the used algorithms on every function, as it ranked first in all of the 23 benchmark functions (from Table 2) except for F_13 (x) where AO ranked the first. MCHIAO achieved total rank 1.
5.1.2 MCHIAO vs other algorithms
The proposed MCHIAO algorithm is compared against twelve different algorithms in a simulated experiment. These algorithms are GOA, MFO, MPA, GWO, HHO, WOA, SSA, IAO, NOA, NGO, AO, and CHIO. All of the algorithms are executed with a maximum of 500 iterations and 51 runs. In Fig. 7 and Table 4, simulation results for all methods are presented. Table 4 presents the metrics calculated such as mean, standard deviation (Std), and Friedman average rank test for evaluating the performance of the various optimization techniques, with the best result of each measure in each function highlighted in bold.


The 23 CEC2005 benchmark functions and convergence plots
These data show that the suggested algorithm MCHIAO performed well in both the multimodal functions from \({F}_{8}(x)\) to \({F}_{13}(x)\) and the unimodal functions from \({F}_{1}(x)\) to \({F}_{7}(x)\), demonstrating the first rank except for \({F}_{6}(x)\) and \({F}_{13}(x)\) where NGO and MPA ranked the first, respectively. However, MCHIAO showed the greatest rate and placed first in all the fixed-dimension multimodal functions from \({F}_{14}(x)\) to \({F}_{23}(x)\), except \({F}_{20}(x)\) where MPA ranked first. With a total rank of one, the findings showed that the suggested algorithm MCHIAO performed the best on the Standard benchmark functions. In Fig. 7, the vertical axis shows the optimal solution to the function, while the horizontal axis shows the total number of iterations. It implies a comparison of the convergence curves of MCHIAO and other algorithms on common benchmark functions, demonstrating that MCHIAO has a favorable rate of convergence and the ability to find a more compact solution across all the benchmark functions, demonstrating one of its key strengths. In the majority of the twenty-three benchmark functions, it is seen that using the MCHIAO approach beats the other twelve evaluated algorithms. The Wilcoxon rank-sum test [32] is also applied in order to statically prove the efficiency of our proposed algorithm. Statistical study of the discrepancy results between two algorithms frequently makes use of the p-value of the Wilcoxon rank-sum test, which is useful in establishing if the two sets of data are significantly different. When p is less than 0.05, it indicates a substantial difference between the two methods in this test function, indicating the rejection of the null hypothesis. The comprehensive p-values in Table 5 were acquired by applying the Wilcoxon test with each of the twelve algorithms to the MCHIAO solution findings, 51 times separately on the 23 benchmark functions test. This was necessary because the test necessitates two independent data sets. These results prove the significance of the proposed algorithm for all functions because the p-values are less than 0.05.
From the previous table, the proposed algorithm MCHIAO outperforms or produces similar solutions in all functions except for \({F}_{6}(x), {F}_{13}(x)\) and \({F}_{20}(x)\) where the best algorithms are NGO and MPA respectively.
The convergence curves for all thirteen algorithms on the 23 standard benchmark functions are shown in Fig. 7, where the vertical axis shows the optimal solution to the problem and the horizontal axis shows the total number of iterations. One of MCHIAO's assets is its remarkable convergence abilities, which are demonstrated by the algorithm's rate of convergence on CEC2005 benchmark functions and the ability to produce a more compact solution for all benchmark functions.
5.2 Case 2: MCHIAO performance on CEC2017 benchmark functions
The 29 CEC2017 benchmark functions are used to evaluate the proposed MCHIAO against all the same twelve state-of-the-art algorithms. The minimization problems in CEC2017 are divided into four categories: The first has three unimodal functions (F1–F3), the second has seven simple multimodal functions (F4–F10), the third has ten hybrid functions (F11–F20), and the fourth has ten composition functions (F21–F30). Table 6 shows how these functions operate. The objective function minimizes the difference between the optimal value of the \(i\) th function \({f}_{i}({x}^{*})\) and the best solution determined by the method \({f}_{i}(x)\); this function can be written as Eq. (4.1).
5.2.1 MCHIAO Vs AO and CHIO
Table 7 demonstrates the performance of the proposed MCHIAO against CHIO and AO as it ranked the first in all of the 29 functions except for \({F}_{28}(x),\) as it ranked second and CHIO ranked the first. MCHIAO scored a total rank 1.
5.2.2 MCHIAO vs other algorithms
Table 8 presents the experimental study findings of the suggested MCHIAO algorithm as well as the other comparator techniques in terms of mean results and standard derivation after 51 separate runs of each algorithm. The best outcomes are displayed in bold font in Tables 7 and 8. Optimization results presented in Table 8 indicate that the proposed MCHIAO algorithm outperforms the other twelve algorithms in 17 out of the 29 CEC2017 benchmark functions and scored a total first rank against other optimization algorithms. Our proposed algorithm MCHIAO ranked first in the unimodal functions \({F}_{1}(x)\) and \({F}_{3}(x)\). For the multimodal functions \({F}_{4}(x)\) to \({F}_{10}(x)\), MCHIAO ranked first in \({F}_{4}(x), {F}_{5}(x),\,and\,{F}_{8}(x)\). MPA ranked first in \({F}_{6}(x), {F}_{9}(x),\,and\,{F}_{10}(x)\), and GOA ranked first in \({F}_{7}(x).\) In the hybrid functions \({F}_{11}(x)\) to \({F}_{20}(x)\), MCHIAO ranked first in all functions except \({F}_{11}(x), {F}_{12}(x), {F}_{14}(x),\,and\,{F}_{17}(x)\), where it ranked the second and MPA ranked first in \({F}_{11}(x), {F}_{14}(x),\,and\,{F}_{17}(x)\), and NGO ranked first in \({F}_{12}(x).\) However, in the composition functions \({F}_{21}(x)\) to \({F}_{30}(x)\), MCHIAO ranked first in all functions except \({F}_{25}(x), {F}_{26}(x), {F}_{28}(x),\,and\,{F}_{30}(x)\) where GOA, MPA, CHIO, and NGO ranked first, respectively. Therefore, with a total rank of 1, our suggested algorithm MCHIAO showed the greatest performance on the CEC2017 benchmark functions. Table 9 presents the p-values of MCHIAO which was acquired by applying the Wilcoxon test against all the other twelve algorithms for 29 CEC2017 benchmark functions. These results prove the significance of the proposed algorithm for all functions because the p-values are less than 0.05.
Figure 8 presents the convergence plots of the proposed MCHIAO algorithm against the same twelve algorithms for the 29 CEC2017 benchmark functions. The MCHIAO algorithm outperforms the other twelve evaluated algorithms in the majority of the 29 benchmark functions.


The 29 CEC2017 functions and convergence plots
5.3 Case 3: MCHIAO performance on CEC2019 benchmark functions
We chose one of the most relevant and challenging test suites from the numerical optimization competitions, CEC-2019 (which has ten functions) to further demonstrate the effectiveness of the proposed technique. Table 10 illustrates the ten CEC2019 benchmark functions.
5.3.1 MCHIAO Vs AO and CHIO
Table 11 shows that MCHIAO is ranked first against CHIO and AO in all the 10 CEC-2019 benchmark functions. For the total rank, MCHIAO scored 1.
5.3.2 MCHIAO vs other algorithms
Table 12 shows the performance of the proposed MCHIAO against the same twelve algorithms conducted on the ten CEC2019 functions after 500 iterations and 51 runs of each algorithm. The data analyzed for the mean value, standard deviation, and rank produced by the twelve unique state-of-the-art optimization methods are shown in Table 12. With a high rate, our suggested algorithm MCHIAO placed first in CEC01, CEC02, CEC03, and CEC09, second in CEC08, fourth in CEC05, and fifth in CEC06, CEC07, and CEC10, and sixth in CEC04. With a total rank of 2, MCHIAO showed a promising overall performance on the CEC2019 benchmark functions. Table 13 presents the p-values of MCHIAO which was acquired by applying the Wilcoxon test against all the other twelve algorithms for ten CEC2019 benchmark functions. These results prove the significance of the proposed algorithm for all functions because the p-values are less than 0.05.
Figure 9 shows the convergence behavior of the proposed MCHIAO on CEC2019 functions.


Convergence curves of CEC2019 functions and convergence plots
5.4 Case 4: performance of MCHIAO on Unimodal fixed-dimension problems
Table 14 represents the details of the unimodal fixed-dimension problems. Range specifies the lower and upper boundaries of the design variables, whereas \({{\varvec{f}}}_{{\varvec{m}}{\varvec{i}}{\varvec{n}}}\) signifies the overall minimum of the functions. Vars identifies the number of dimensions (design variables) of the functions.
5.4.1 MCHIAO Vs AO and CHIO
In Table 15, MCHIAO is ranked the first in all 8 functions with a total rank 1, while CHIO ranked second and AO ranked third.
5.4.2 MCHIAO vs other algorithms
Tables 15 and 16 show the mean value, standard deviation, and rank attained by the proposed MCHIAO algorithm against CHIO and AO, and the other twelve unique state-of-the-art optimization algorithms, respectively. Table 16 shows that MCHIAO demonstrated the first rank in all unimodal fixed-dimension problems except for F6 in which it ranked second. With a total rank of 1, MCHIAO had the greatest overall performance on the unimodal fixed-dimension functions. The convergence curves of the various methods are shown in Fig. 10, where the vertical axis shows the optimal solution to the function and the horizontal axis shows the total number of iterations. Table 17 presents the p-values of MCHIAO which was acquired by applying the Wilcoxon test against all the other twelve algorithms for the 8 Unimodal fixed-dimension functions. These results prove the significance of the proposed algorithm for all functions because the p-values are less than 0.05.


The 8 Unimodal fixed-dimension and convergence plots
5.5 Case 5: performance of MCHIAO on Unimodal variable-dimension problems
Table 18 represents the details of the unimodal variable-dimension functions.
5.5.1 MCHIAO Vs AO and CHIO
Table 19 demonstrates that MCHIAO obtained the first rank in all unimodal variable-dimension problems. For the total rank, MCHIAO ranked first, AO ranked second, and CHIO ranked third.
5.5.2 MCHIAO vs other algorithms
In comparison to the 12 existing meta-heuristics algorithms, Table 20 demonstrates that the novel hybrid MCHIAO algorithm offers the best attainable optimum values of the functions in terms of mean and standard values of the functions. Figure 11 addresses the convergence performance of the twelve competitive algorithms and MCHIAO variations in solving unimodal benchmark functions; the convergence solutions encountered show that the MCHIAO is better capable of finding the most optimum solution in the fewest iterations. Based on the results of variable and fixed dimension unimodal problems, we can say that MCHIAO has excellent exploitation capabilities and can produce superior results in difficult situations. Table 21 presents the p-values of MCHIAO which was acquired by applying the Wilcoxon test against all the other twelve algorithms for the 15 Unimodal variable-dimension functions. These results prove the significance of the proposed algorithm for all functions because the p-values are less than 0.05.


The Unimodal variable-dimension functions and convergence plots
5.6 Case 6: performance of MCHIAO on Multimodal fixed-dimension problems
The details of the multimodal fixed-dimension functions are presented in Table 22.
5.6.1 MCHIAO Vs AO and CHIO
Table 23 presents the MCHIAO against CHIO and AO where it ranked first in all functions except \({F}_{14}(x)\) where AO ranked first. For the total rank, MCHIAO scored rank 1, AO rank 2, and CHIO rank 3.
5.6.2 MCHIAO vs other algorithms
Table 24 illustrates the outcomes of MCHIAO and the other algorithms for the fixed-dimension multimodal benchmarks. The results show that MCHIAO generally reaches the globally optimal values. If the results are compared, MCHIAO possesses first place for all functions other than f9, f14, and f15. An important feature that should be explored is the convergence of the MCHAIO for the optimal solutions throughout the iteration numbers, hence Fig. 12 demonstrates the best solutions so far across the iteration numbers. The acceleration convergence curves of the suggested MCHIAO have a discernible declining rate for the multimodal fixed-dimension functions. Table 25 presents the p-values of MCHIAO which was acquired by applying the Wilcoxon test against all the other twelve algorithms for the 27 multimodal fixed-dimension functions. These results prove the significance of the proposed algorithm for all functions because the p-values are less than 0.05.


The Multimodal fixed-dimension functions and convergence plots
5.7 Case 7: performance of MCHIAO on Multimodal variable-dimension problems
The dimensionality of the variable-dimension multimodal benchmark functions, in addition to the local optima, increases the complexity and difficulty of optimization.
Table 26 presents the details of the multimodal variable-dimension problems. Vars specifies the number of dimensions (design variables) of the functions. Range identifies the lower and upper boundaries of the design variables, whereas \({{\varvec{f}}}_{{\varvec{m}}{\varvec{i}}{\varvec{n}}}\) signifies the overall minimum of the functions.
5.7.1 MCHIAO Vs AO and CHIO
MCHIAO is ranked first in all functions against CHIO and AO except for \({F}_{8}(x)\) and \({F}_{14}(x)\) where AO ranked the first, as shown in Table 27. MCHIAO scored 1 for the total rank, while AO scored 2 and CHIO ranked rank 3.
5.7.2 MCHIAO vs other algorithms
In Table 28, MCHIAO's ability to solve multimodal functions with variable dimensions is compared with the performance of other algorithms.
The results show that MCHAIO can fully explore the search space. Except for \({F}_{8}(x)\), \({F}_{14}(x)\), and \({F}_{17}(x)\), MCHAIO consistently exceeds competitors; nonetheless, the results for these three functions are equally competitive. Table 29 presents the p-values of MCHIAO which was acquired by applying the Wilcoxon test against all the other twelve algorithms for the 17 multimodal variable-dimension functions. These results prove the significance of the proposed algorithm for all functions because the p-values are less than 0.05.
In Fig. 13, MCHIAO's convergence curves for 17 multimodal variable-dimension functions are presented and compared with the twelve algorithms to demonstrate the convergence capabilities of MCHIAO.


The Multimodal variable-dimension functions and convergence plots
5.8 Case 8: performance of MCHIAO on real-world problems
The majority of the search spaces for real-world issues are unknown and provide several challenges. Such challenges drastically reduce the performance of optimization algorithms in the sector, which previously excelled at benchmark functions or simple case studies [36].
Scientists and practitioners must recognize the obstacles and include the appropriate adjustments, alterations, and enhancements in the algorithms to address them in order to guarantee the quality of solutions to optimisation problems [37].
This section evaluates the performance of MCHIAO in real-world problems, this optimizer has been used to solve six engineering problems: welded beam design, pressure vessel design, tension/compression spring design, weight minimization of a speed reducer, three-bar truss design problem, and gear train design problem.
5.8.1 Tension/compression spring design
The goal is to obtain the least fabrication cost for spring. It is a weight minimization problem of a spring with three structural parameters: wire diameter (d or \({x}_{1}\)), mean coil diameter (D or \({x}_{2}\)), and the number of active coils (P or \({x}_{3}\)). Figure 14 presents the spring and its parameters [38].

Tension/compression spring design problem
This problem has the following mathematical model:
With
The performance of the proposed MCHIAO is evaluated by solving the tension/compression spring design problem and compared against the same twelve state-of-the-art algorithms as shown in Table 30. The performance of the MCHIAO algorithm is better than the twelve state-of-the-art algorithms.
For 500 iterations and 51 runs, MCHIAO outperforms the other twelve algorithms as proved in Table 31. Table 31 presents the p-values of MCHIAO which was acquired by applying the Wilcoxon test against all the other twelve algorithms for the tension/compression spring design problem. These results prove the significance of the proposed algorithm for all functions because the p-values are less than 0.05.
Figure 15 presents the convergence curve of the MCHIAO optimization algorithm against the other twelve algorithms in the tension/compression spring design problem.

Convergence curves of the 13 algorithms on the tension/compression spring design
5.8.2 Pressure vessel design
The objective is to obtain a pressure vessel design with the minimum fabrication cost. Figure 16 demonstrates the pressure vessel and the design parameters [38].

Schematic of pressure vessel design
The four decision variables in this problem are head Thickness (\({T}_{h}\)), shell thickness (\({T}_{s}\)), length of the cylindrical section neglecting head(L), and Inner radius (R). This problem's mathematical formulation is as follows:
\({x}_{1} \,and\, {x}_{2}\) are discrete while \({x}_{3}\, and\, {x}_{4}\) are continuous.
The fitness function is nonlinear with linear and nonlinear inequality constraints.
With
Table 32 provides the results of this problem for the proposed MCHIAO against the same twelve algorithms. Table 33 presents the p-values of MCHIAO which was acquired by applying the Wilcoxon test against all the other twelve algorithms for the pressure vessel design problem. These results prove the significance of the proposed algorithm for all functions because the p-values are less than 0.05.
Figure 17 represents the convergence curves of the MCHIAO against the other twelve optimization algorithms in the pressure vessel problem.

Convergence curves of the 13 algorithms on the pressure vessel design problem
5.8.3 Welded beam design
Another example used to assess MCHIAO performance in the engineering domain is a well-known welded beam design, as shown in Fig. 18 [22].

Schematic of welded beam design
In this problem, the aim is to establish the best design variables to minimize the overall manufacturing cost of a welded beam is subject to Shear stress (τ), Bending stress (θ), the bar’s buckling load (Pc), the beam end deflection (δ), and other constraints. The four variables in this problem are the bar length (l), the thickness of the weld (h), height (t), and thickness (b). The mathematical formulation of this problem is as follows:
where \({\uptau }\left( x \right) = \sqrt {{{\tau^{\prime}}} + \left( {2{{\tau \tau^{\prime}}}} \right)\frac{{x_{2} }}{2R} + \left( {{{\tau^{\prime\prime}}}} \right)^{2} } ,\)
With
Table 34 presents the optimization results of the welded beam design problem for the proposed MCHIAO against the same twelve algorithms. Table 35 presents the p-values of MCHIAO which was acquired by applying the Wilcoxon test against all the other twelve algorithms for the welded beam design problem. These results prove the significance of the proposed algorithm for all functions because the p-values are less than 0.05.
Figure 19 below illustrates the MCHIAO plot against the competitive optimization results in the welded beam design problem.

Convergence curves of the 13 algorithms on the welded beam design problem
5.8.4 Speed Reducer problem
It is a weight minimization problem that involves the design of a speed reducer for a small aircraft’s internal combustion engine. It is a challenging benchmark because it has seven design variables (\({x}_{1}\, to\, {x}_{7}\)). Figure 20 illustrates the problem's schematic [39].

Speed reducer design
This problem's mathematical model is as follows:
With
Table 36 shows the results of this problem for the proposed MCHIAO against the same twelve algorithms. Table 37 presents the p-values of MCHIAO which was acquired by applying the Wilcoxon test against all the other twelve algorithms for the speed reducer design problem. These results prove the significance of the proposed algorithm for all functions because the p-values are less than 0.05.
Figure 21 illustrates the same 12 optimization algorithms’ convergence curves against the MCHIAO on the speed reducer problem.

Convergence curves of the 13 algorithms on the speed reducer problem
5.8.5 Gear train design problem
The main goal of this problem is to minimize the gear ratio for preparing the compound gear train, as shown in Fig. 22 [39].

Gear train design
The objective is to achieve the optimal number of teeth for four train gears to minimize the gear ratio. The gear ratio is defined as:
The decision variables (\({n}_{j}\)) are discrete. Where \({n}_{j}\) stands for the number of gearwheel teeth \(j\), with \(j=A, B, D, F.\)
Table 38 illustrates the results of this problem for the proposed MCHIAO against the same twelve algorithms. Table 39 presents the p-values of MCHIAO which was acquired by applying the Wilcoxon test against all the other twelve algorithms for the gear train design problem. These results prove the significance of the proposed algorithm for all functions because the p-values are less than 0.05.
Figure 23 demonstrates the diverse algorithms’ convergence curves against the proposed MCHIAO algorithm.

Convergence curves of the 13 algorithms on the gear train design problem
5.8.6 Three-bar truss design problem
The primary purpose of truss design is to reduce the weight of the bar structures. As a result, three bars should be placed as shown in Fig. 24. As the goal is to reduce the weight of the bars in this position. This is an optimization problem with constraints. This problem has two design parameters \(({x}_{1},{x}_{2})\) and three restrictive functions: deflection constraints of each bar, buckling, and stress [22].

Three-bar truss design
The problem is mathematically expressed as follows:
where:
The constants are as follows: \(L=100\, cm, P=2\frac{KN}{{cm}^{2}}.\) \(\mathrm{and}\,\sigma =2 KN/{cm}^{2}\).
Table 40 presents the results of various algorithms on this problem for the proposed MCHIAO against the same twelve algorithms. Table 41 presents the p-values of MCHIAO which was acquired by applying the Wilcoxon test against all the other twelve algorithms for the three-bar truss design problem. These results prove the significance of the proposed algorithm for all functions because the p-values are less than 0.05.
Figure 25 below presents the various competitive optimization algorithms’ convergence curves.

Three-bar truss design plots
6 Conclusions
In this study, Modified Coronavirus Herd Immunity Aquila Optimizer (MCHIAO) is an improved hybrid algorithm proposed as a contribution to a novel nature-inspired human-based metaheuristic optimization algorithm (CHIO) with Aquila optimization algorithm for global optimization problems. The proposed algorithm presents three main modifications that lead to better outcomes. The first modification is applying an improved case categorizing technique that implements a balance between the exploitation and exploration stages. The second enhancement is improving the equation of the new genes’ value which leads to more optimal values. Additionally, as many studies show that the COVID-19 pandemic possesses chaotic system characteristics, we applied the chaotic system in the case categorizing phase which leads to avoiding local minima and rapid convergence rate. The third enhancement is generating a new formula for the selection between the expanded exploitation and narrowed exploitation phases. The results reveal that the proposed MCHIAO can find optimal solutions and converge faster on most issues due to its strong exploration and exploitation capabilities. The proposed MCHIAO's effectiveness is evaluated using Wilcoxon statistical analyses and Friedman average rank through 23 well-known benchmark functions of various dimensions and complexity: seven unimodal, six multimodal with adjustable dimensions, and 10 multimodal with fixed dimensions. These functions have been widely used to evaluate newly proposed optimization methods in the literature. The MCHIAO is also compared to the performance of other well-known and most recent optimization techniques. The algorithms used in the comparison are GWO, GOA, MFO, MPA, HHO, SSA, WOA, IAO, NOA, NGO, AO, and the original CHIO. The comparative analysis reveals that MCHIAO is conspicuously competitive since it can acquire 21 out of the 23 benchmark functions. Further, to prove the efficiency of the proposed MCHIAO algorithm, both CEC 2017 and CEC 2019 benchmark functions are tested in which MCHIAO achieves the overall best results in 17 out of 29 CEC 2017 and 4 out of 10 CEC19 benchmark functions. The exploitative and explorative behavior of the hybrid algorithm MCHIAO is assessed on a variety of classical functions, including 24 unimodal and 44 multimodal functions, respectively. The proposed MCHIAO ranked top in all 15 functions for unimodal variable-dimension issues and first in 7 out of 8 functions for unimodal fixed-dimension problems. On the other hand, MCHIAO succeeds in 24 out of 27 functions for the multimodal fixed-dimension challenges and is placed top in 14 out of 17 functions for the multimodal variable-dimension problems. As well, the proposed MCHIAO defeats the competitive optimization algorithms in five out of six real-world application problems gear train design problem, speed reducer problem, welded beam design problem, pressure vessel design problem, and welded beam design problem and ranked second in the pressure vessel problem. MCHIAO has several limitations, much like any other suggested algorithm. First, the sensitivity to parameter issue in the original CHIO and AO has been resolved by MCHIAO. Results with the mentioned issues are encouraging. This might not work, though, for other issues. Second, convergence time grows with complexity, providing a new avenue for future study to address this problem. Finally, new algorithms with improved performance may be created as this field of study continues to advance.
Data availability
Data sharing not applicable to this article as no datasets were generated or analyzed during the current study.
References
Shabani A, Asgarian B, Gharebaghi SA, Salido MA, Giret A (2019) A new optimization algorithm based on search and rescue operations. Math Probl Eng 2019:1–23
Yang X (2021) Nature-inspired optimization algorithms: second edition, Mara Conner.
Wang FS, Chen LH (2013) Heuristic Optimization. In: Dubitzky W, Wolkenhauer O, Cho KH, Yokota H (eds) Encyclopedia of Systems Biology. Springer, New York, NY. https://doi.org/10.1007/978-1-4419-9863-7_411.
Osman IH, Laporte G (1996) Metaheuristics: A bibliography. Ann Ope Res 63(5):511–623
Fausto F, Reyna-Orta A, Cuevas E, Andrade AG, Perez-Cisneros M (2019) From ants to whales: metaheuristics for all tastes. Artif Intell Rev 1–58
Saafan MM, El-Gendy EM (2021) IWOSSA: An improved whale optimization salp swarm algorithm for solving optimization problems. Exp Syst Appl 176: 114901. ISSN 0957–4174, https://doi.org/10.1016/j.eswa.2021.114901.
Wolpert DH, Macready WG (1997) No free lunch theorems for optimization. IEEE Trans Evolut Comput 1(1):67–82.
Kennedy J, Eberhart R (1995) Particle swarm optimization. In: Proceedings of ICNN’95-International Conference on Neural Networks 4: 1942–1948. IEEE.
Saremi S, Mirjalili S, Lewis A (2017) Grasshopper optimisation algorithm: theory and application. Adv Eng Softw 105:30–47
Mirjalili S (2015) Moth-flame optimization algorithm: A novel nature-inspired heuristic paradigm. Knowl-Based Syst 89.
Faramarzi A, Heidarinejad M, Mirjalili S, Gandomi AH (2020) Marine predators algorithm: a nature-inspired metaheuristic. Exp Syst Appl 152: 113377, ISSN 0957–4174.
Humphries NE, Queiroz N, Dyer JRM, Pade NG, Musyl MK, Schaefer KM, Fuller DW, Brunnschweiler JM, Doyle TK, Houghton JDR, Hays GC, Jones CS, Noble LR, Wearmouth VJ, Southall EJ, Sims DW (2010) Environmental context explains Lévy and Brownian movement patterns of marine predators. Nature 465(7301):1066
Bartumeus F, Catalan J, Fulco UL, Lyra ML, Viswanathan GM (2002) Optimizing the encounter rate in biological interactions: Lévy versus Brownian strategies. Phys Rev Lett 88(9):097901
Mirjalili S, Mirjalili SM, Lewis A (2014) Grey wolf optimizer. J Adv Eng Softw 69:46–61
Heidari AA, Mirjalili S, Faris H, Aljarah I, Mafarja M, Chen H (2019) Harris hawks optimization: algorithm and applications. Future Gener Comput Syst 97:849–872
Mirjalili S, Gandomi AH, Mirjalili SZ, Saremi S, Faris H, Mirjalili SM (2017) Salp Swarm Algorithm: a bio-inspired optimizer for engineering design problems. Adv Eng Softw 114:163–191
Seyedali M, Andrew L (2016) The whale optimization algorithm. Adv Eng Softw 95:51–67
Balaha HM, El-Gendy EM, Saafan MM (2021) Covh2sd: A covid-19 detection approach based on harris hawks optimization and stacked deep learning. Expert Syst Appl 186:115805
Balaha HM, Saafan MM (2021) Automatic exam correction framework (aecf) for the mcqs, essays, and equations matching. IEEE Access 9:32368–33238
Balaha HM, El-Gendy EM, Saafan MM (2022) A complete framework for accurate recognition and prognosis of covid-19 patients based on deep transfer learning and feature classification approach. Artif Intell Rev 1–46.
Balaha HM, Shaban AO, El-Gendy EM, Saafan MM (2022) A multi-variate heart disease optimization and recognition framework. Neural Comput Appl 1–38.
Fahmy H, El-Gendy EM, Mohamed MA, Saafan MM (2023) ECH3OA: An Enhanced Chimp-Harris Hawks Optimization Algorithm for copyright protection in Color Images using watermarking techniques. Knowl-Based Syst 269: 110494, ISSN 0950–7051. https://doi.org/10.1016/j.knosys.2023.110494.
Badr AA, Saafan MM, Abdelsalam MM et al (2023) Novel variants of grasshopper optimization algorithm to solve numerical problems and demand side management in smart grids. Artif Intell Rev. https://doi.org/10.1007/s10462-023-10431-5
Balaha MM, El-Kady S, Balaha HM et al (2023) A vision-based deep learning approach for independent-users Arabic sign language interpretation. Multimed Tools Appl 82:6807–6826. https://doi.org/10.1007/s11042-022-13423-9
Balaha HM, Antar ER, Saafan MM et al (2023) A comprehensive framework towards segmenting and classifying breast cancer patients using deep learning and Aquila optimizer. J Ambient Intell Human Comput. https://doi.org/10.1007/s12652-023-04600-1
Kwok KO, Lai F, Wei WI, Wong SYS, Tang JW (2020) Herd immunity–estimating the level required to halt the covid-19 epidemics in affected countries. J Infect 80(6):e32–e33
Tzanetos A, Dounias G (2021) Nature inspired optimization algorithms or simply variations of metaheuristics? Artif Intell Rev 54:1841–1862. https://doi.org/10.1007/s10462-020-09893-8
Xia Y, Zhong L, Tan J, Zhang Z, Lyu J, Chen Y, Zhao A, Huang L, Long Z, Liu NN, Wang H (2020) How to understand “Herd Immunity” in COVID-19 Pandemic. Front Cell Dev Biol 8:547314
Zhuang L, Cressie N (2014) Bayesian hierarchical statistical SIRS models. Stat Methods Appl 23:601–646. https://doi.org/10.1007/s10260-014-0280-9
Al-Betar MA, Alyasseri ZAA, Awadallah MA et al (2021) Coronavirus herd immunity optimizer (CHIO). Neural Comput & Applic 33:5011–5042. https://doi.org/10.1007/s00521-020-05296-6
Abualigah L, Yousri D, Abd Elaziz ME, Ewees AA, Al-qaness MAA, Gandomi AH (2021) Aquila optimizer: A novel meta-heuristic optimization algorithm. Comput Ind Eng 157: 107250, ISSN 0360–8352, https://doi.org/10.1016/j.cie.2021.107250.
Salawudeen AT, Mu’azu MB, Sha’aban YA, Adedokun AE (2021) A novel smell agent optimization (SAO): An extensive CEC study and engineering application. Knowl-Based Syst. 232: 107486 (2021).
Ewees AA, Algamal ZY, Abualigah L, Al-qaness MAA, Yousri D, Ghoniem RM, AbdElaziz M (2022) Cox proportional-hazardsmodel based on improved aquilaoptimizer with whale optimizationalgorithm operators. Mathematics 10:1273. https://doi.org/10.3390/math10081273
Abdel-Basset M,Mohamed R, Jameel M, Abouhawwash M (2023) Nutcracker optimizer: A novel nature-inspired metaheuristic algorithm for global optimization and engineering design problems. Knowl-Based Syst, 262: 110248, ISSN 0950–7051, https://doi.org/10.1016/j.knosys.2022.110248.
Dehghani M, Hubalovsky S, Trojovsky P (2021) Northern goshawk optimization: a new swarm-based algorithm for solving optimization problems. IEEE Access. 1–1. https://doi.org/10.1109/ACCESS.2021.3133286.
Recioui A (2018) Application of teaching learning-based optimization to the optimal placement of phasor measurement units. Book chapter in: Handbook of Research on Emergent Applications of Optimization Algorithms, IGI Global.
Recioui A (2021) Home load-side management in smart grids using global optimization. Book chapter in: Research Anthology on Multi-Industry Uses of Genetic Programming and Algorithms, IGI Global.
El-Sherbiny A, Elhosseini MA, Haikal AY (2018) A new ABC variant for solving inverse kinematics problem in 5 DOF robot arm. Appl Soft Comput 73:24–38. https://doi.org/10.1016/j.asoc.2018.08.028
Guedria NB (2016) Improved accelerated PSO algorithm for mechanical engineering optimization problems. Appl Soft Comput 40: 455–467, ISSN 1568–4946, https://doi.org/10.1016/j.asoc.2015.10.048.
Funding
Open access funding provided by The Science, Technology & Innovation Funding Authority (STDF) in cooperation with The Egyptian Knowledge Bank (EKB). Open access funding is provided by The Science, Technology, and Innovation Funding Authority (STDF) in cooperation with The Egyptian Knowledge Bank (EKB). No funding was received for this work.
Author information
Authors and Affiliations
Contributions
HS, AYH, LML, and MMS contributed to the design and implementation of the research and, the analysis of the results. All the authors have participated in writing the manuscript and have revised the final version. All authors read and approved the final manuscript.
Corresponding author
Ethics declarations
Conflict of interest
The authors declare that they have no known competing financial interests or personal relationships that could have appeared to influence the work reported in this paper. There are no conflicts of interest. I would like to confirm that there were no known conflicts of interest associated with this publication and that there was no significant financial support for this work that could affect its outcome.
Additional information
Publisher's Note
Springer Nature remains neutral with regard to jurisdictional claims in published maps and institutional affiliations.
Appendix
Rights and permissions
Open Access This article is licensed under a Creative Commons Attribution 4.0 International License, which permits use, sharing, adaptation, distribution and reproduction in any medium or format, as long as you give appropriate credit to the original author(s) and the source, provide a link to the Creative Commons licence, and indicate if changes were made. The images or other third party material in this article are included in the article's Creative Commons licence, unless indicated otherwise in a credit line to the material. If material is not included in the article's Creative Commons licence and your intended use is not permitted by statutory regulation or exceeds the permitted use, you will need to obtain permission directly from the copyright holder. To view a copy of this licence, visit http://creativecommons.org/licenses/by/4.0/.
About this article

Cite this article
Selim, H., Haikal, A.Y., Labib, L.M. et al. MCHIAO: a modified coronavirus herd immunity-Aquila optimization algorithm based on chaotic behavior for solving engineering problems. Neural Comput & Applic (2024). https://doi.org/10.1007/s00521-024-09533-0
Received:
Accepted:
Published:
DOI: https://doi.org/10.1007/s00521-024-09533-0