
Abstract
More than 560 genes are annotated as proteases in the human genome. About half of the genes are not or are only marginally characterized. Over the past decade, mass spectrometry has become the basis for proteomics, especially for protein identification, performed in a high-throughput manner. This development was also very fruitful for exploring the complex systems associated with protease functions, as briefly reviewed here. Mass spectrometry is an ideal tool for monitoring protease reactions, as will be highlighted in this review.
Introduction
Proteases occur in all living organisms and take part in a multitude of physiological processes from simple digestion of food proteins to highly regulated cascades. Their action varies from the very broad and indiscriminate (proteases in digestion), to the exceptionally specific, cleaving single peptide bonds in a single target protein. Proteases are remarkably heterogeneous in both catalytic and structural terms, explaining the huge diversity of biological roles. After the discovery of proteolytic enzymes, going back to the nineteenth century with the description of pepsin by Schwann in 1836 [1], they were thought to be associated with protein catabolism in food digestion exclusively. Today, our view of the functions of proteases has significantly changed after finding that they are implicated in regulating a wide range of fundamental biological processes such as blood coagulation [2], cell-cycle progression [3], development [4], wound healing [5] and apoptosis [6].
Proteases account for around 2% of the genes of the genomes of almost all species. In the human genome, more than 560 genes are annotated as proteases [7]. An analysis of the knowledge database PubMed (http://www.ncbi.nlm.nih.gov/PubMed/) revealed that no experimental data are available on the gene products from approximately 27% of these genes—more than 150 genes (Fig. 1). A further 28% of the human protease genes have only undergone preliminary characterization (1–10 publications per gene).

Distribution (in percent) of the number of publications published per gene annotated as protease according to Puente et al. [34]. For this overview, the main protein name mentioned in SwissProt was fed into the PubMed database (in March 2008)
This rises the question of how much effort is needed to explore the physiological role of a gene coding a protease? An overall answer may not be available, since the complexity of the tasks involved for different proteases varies widely. However, the history of deciphering the functions of thrombin—a serine protease that has multiple actions in the coagulation cascade—gives an impressive insight into the numerous efforts required to acquire our current knowledge about this protease. These efforts are mirrored in the enormous number of publications about thrombin. In PubMed in April 2008, the number of hits obtained when using “thrombin” and “human” as a search term was about 26,200. Briefly, thrombin is released from its inactive precursor prothrombin by factor Xa, as a result of initiating coagulation as part of the response to injury. During the coagulation process thrombin plays multiple roles that are strictly controlled spatially and temporally. The way in which thrombin converts its many substrates has been studied in detail over the past few decades. Any understanding of how thrombin is directed during the coagulation process requires knowledge of its exact chemical structure and the role of any cofactors in its interactions with substrates [8].
The case of thrombin clearly demonstrates that a deeper understanding of the roles of a protease in health and disease requires the identification of all of the elements of the protease system (Fig. 2) and its integration into the spatial and temporal coordinate system of the organism, resulting in the following questions after the amino acid sequence of the protease has been identified. 1. Which posttranslational processing converts the protease into its active form? 2. Which cofactors are necessary for its activity and its substrate specificity? 3. Which are the endogenous substrates of the protease? 4. Where (organ, cell, subcellular compartment) and when does the protease occur? 5. Where and when is the protease activated? 6. Where and when does a cofactor bind to the protease? 7. Is the activity of the protease additionally regulated by an inhibitor? 8. In which physiological context is the protease system integrated?

Principles of the regulation of the proteolytic activities of a protease. In many cases a protease is activated either by a proteolytic processing step (1) or by binding a cofactor (2), or even by both steps. Binding to a cofactor can cause a change in substrate specificity (3), resulting in the hydrolysis (5) of a different protein. Furthermore, the active protease may be inhibited by an endogenous protease inhibitor (6). Additional regulations (not shown in the scheme) appear at the temporal and spatial levels, including the control of the concentrations of the protease, the protease-activating enzyme, the cofactors and the inhibitors
Strategies for investigating proteases
The discovery of new proteases has often arisen through the identification of their reaction products. For example, many peptide hormones like endothelin, a 21-residue vasoactive peptide [9] produced in vascular endothelial cells from the 38-residue inactive intermediate big endothelin-1, were identified many years prior to the identification of the protease responsible for generating the active peptide hormone. Human endothelin-converting enzyme [10] was identified seven years after the discovery of endothelin. Using the knowledge of the amino acid sequence of the peptide hormone and its precursor, the cleavage site was identified, which provided the basis for the development of assays for detecting the defined protease activity. Therefore, the main classical approach to the identification of an unknown protease with a defined catalytic activity starts with the development of an assay that makes use of knowledge of the identity of the substrate and the resulting reaction products (1 in Fig. 3). The assay enables the purification (2) of the active protease from a protein extract. The purified active protease is then identified (3), either by Edman sequencing via a cDNA library followed by DNA sequencing, or nowadays by enzymatic digestion and subsequent mass spectrometric analysis (3). Once identified, a recombinant protease is then required to check (4) that the proteolytic activity was not caused by a contaminant protease in the purified active fraction [11].

Main classical approach for the investigation of an unknown protease with a defined catalytic activity. MS indicates the steps where mass spectrometry is integrated into the workflow
The investigation of the biochemical and physiological roles of the protease (step 5 in Fig. 3) is the most time-consuming step. Here, overexpression [12, 13] and knockout [14] experiments targeting the different elements of the protease system including the protease itself, its substrate(s), cofactor(s) and inhibitor(s) (Fig. 2) should be performed (reviewed in [15]).
Aside from the classical workflow summarized in Fig. 3, new approaches based on transcriptomic and proteomic techniques have been developed in the past few years, based on the idea of identifying either proteases or substrates on a global scale (reviewed in [16, 17]). In many of these “omics” approaches, mass spectrometry usually plays a central role, especially for the identification of the proteins. The breakthrough associated with the use of mass spectrometry for the identification of proteins is associated with the development of soft ionization techniques, namely electrospray ionization (ESI) [18] and matrix-assisted laser desorption ionization (MALDI) [19]. Both ionization techniques provide the basis for proteomics, as reviewed in, e.g., [20], thus enabling the identification of proteins in a high-throughput manner. Identification of the proteins in proteomics studies is achieved by digesting the proteins of a sample with, e.g., trypsin, and then performing a two (or more) dimensional separation of the tryptic peptides prior to mass spectrometric analysis (the “bottom-up” or “shotgun approach” [21]), or by separating the proteins first (for example by liquid chromatography) and analyzing the intact proteins by mass spectrometry afterwards (the “top-down approach” [22]), or with two-dimensional electrophoresis (2DE) followed by tryptic digestion of single protein spots picked from the 2DE gel and subsequent mass spectrometric analysis of the desalted peptides [23]. The proteins are then identified from the mass spectrometric data by comparing these data with databases using bioinformatic search tools such as MASCOT. Both strategies (the bottom-up and the top-down approaches) have been used to identify proteases in purified active fractions according to Fig. 3 [24]. Since the identification of proteins by mass spectrometry is well established, this application field will not be reviewed here.
The search for the proteases involved in a defined physiological process was performed through parallel quantitative analysis of the mRNA expression of 715 human proteases, inactive homologs and inhibitors with a DNA microarray chip (CLIP-CHIP) [25], which is one of the few techniques not based on mass spectrometry. By applying a CLIP-CHIP to invasive ductal cell carcinoma, elevated expressions of a number of proteases were detected, including ADAMTS17, carboxypeptidases A5 and M, tryptase-gamma and matriptase-2. The advantage of using a microarray chip technology is that new protease or inhibitor oligonucleotides can be investigated. The CLIP-CHIP shows whether the mRNA of a defined protease gene is up- or down-regulated in association with a defined process. However, this approach does not provide any information about the status of the activity and about how the activities of the protease gene products are regulated.
A second class of approaches to the identification of proteases comprises activity-based probes, which target proteases with defined catalytic properties in proteomes and differentiate these from inhibited forms or inactive precursors (reviewed in [26, 27]). These probes are derived from protease inhibitors and consist of a specific functional group for covalent binding to a targeted enzyme, as well as further detection elements that utilize techniques such as fluorescence or radiolabeling.
Zymography—an electrophoretic technique based on one- and two-dimensional electrophoresis that includes a substrate that is copolymerized with the polyacrylamide gel—also allows the detection of enzyme activity on a more or less global scale. Thimon et al. described a direct zymographic method for the detection of proteases using quenched fluorescent substrates [28]. The authors separated the proteases using one- and two-dimensional electrophoresis, and the gel was subsequently incubated with the quenched fluorescent substrate. The fluorescence emitted permitted the localization of the proteases using UV light.
Strategies for the identification of protease substrates
Substrate phage display libraries [29] or synthetic combinatorial peptide libraries [30, 31] were used to determine protease cleavage sequences. However, a small number of these approaches have resulted in the identification of considerable numbers of new substrates after database searches. The major reason for this is that substrates are usually not denatured in vivo; they are folded proteins that restrict protease susceptibility because of the protein conformation and posttranslational modification [32]. Furthermore, the peptide library approach does not consider the interaction of the substrate with exosites, which are substrate binding sites that are outside the active site cleft [33], since these interacting domains of substrates are some distance from the cleavage sites.
One strategy that is used to identify substrates system-wide in cells or in vivo is to analyze the cleaved substrate, i.e., the protease degradome [34], which can then be used as evidence of proteolytic activity. By labeling proteins with stable isotope or isobaric reagents, such as isotope-coded affinity tags (ICAT) [35], isobaric tags for relative and absolute quantitation (iTRAQ) [36] or by using metabolic labeling like SILAC [37], comparative quantitations of protein levels and protein identification by MS/MS can be achieved between experimental and control samples. Figure 4 presents a scheme for the generalized simplified workflow of labeling approaches to identify substrates of proteases. In the first step, a protein mixture is incubated in the absence (control) or in the presence of an overexpressed protease. In the latter case larger amounts of the cleavage products C and D are hydrolyzed from protein A compared to the control. After the incubation, the proteins of both mixtures are derivatized with labels I and II. After labeling, both samples are mixed together. The combined sample can be analyzed by either the bottom-up or the top-down approaches. In the bottom-up approach, the proteins are enzymatically digested directly. The resulting peptides are then fractionated by multidimensional chromatography. The top-down approach starts with the fractionation of the intact proteins. The proteins in the resulting fractions are enzymatically digested and the peptide hydrolysates are chromatographed. In both approaches, the fractionated peptides are analyzed by mass spectrometry (MS) and tandem mass spectrometry (MS/MS). Using the MS spectra in the case of ICAT and SILAC, the peptides of the proteins which differ in their concentrations in the control sample and the sample with the overexpressed protease because of the increased action of the overexpressed protease (Fig. 4, MS spectrum) are identified. The relative differences in the quantities of the proteins affected by the protease are reflected in the signal intensities of the pairs of peptide signals. A pair of peptide signals resulting from two peptides with an identical amino acid sequence but which differ by the label are observed, with a mass difference between the signals which is identical to the difference in the molecular masses of the labeling group I and labeling group II. In the case of the iTRAQ label, the difference between the signal intensities of the labeling groups becomes obvious in the MS/MS spectra (not shown in Fig. 4). Independently of the labeling chemistry, the peptides of interest are identified by tandem mass spectrometry followed by a comparison of the MS/MS spectral data with those from a protein database. A protease substrate of the overexpressed protease can be detected through either a decrease in the signal intensity of its tryptic peptide (a in Fig. 4, signal with the open circle) in relation to the intensity of its sibling signal from the control (a in Fig. 4, signal with the black dot), which reflects the decrease in the concentration of the substrate as a result of the action of the overexpressed protease, or by an increase in the signal intensity of a tryptic peptide from the reaction product of the overexpressed protease (c and d in Fig. 4, signal with the open circle) in relation to the signal from the control (c and d in Fig. 4, signal with the black dot), reflecting the increase in the concentration of the reaction product of the overexpressed protease. The comparative labeling approaches require the overexpression or transfection of a defined protease and its inactive mutant as control. Tam et al. [38] have successfully applied ICAT to identify previously unknown substrates, including the neutrophil chemokine IL-8, secretory leukocyte protease inhibitor, pro-tumor necrosis factor alpha, death receptor-6, and connective tissue growth factor of human membrane type 1 matrix metalloproteinases (MT1-MMP) in cell-conditioned medium from breast carcinoma cells transfected for stable expression of either MT1-MMP or an inactive MT1-MMP mutant or the vector alone. Dean and Overall [39] have used iTRAQ to identify many new cytokines and other substrates of matrix metalloproteinase 2 (MMP-2) by applying murine MMP-2−/− cells transfected with human MMP-2 in multiplex time course experiments. Proteolytic cleavage sites of natural substrates were identified via iTRAQ by Enoksson et al. [40]. SILAC has been used to characterize the substrate profile of the ClpXP protease, a bacterial protease [41].

Scheme of the generalized workflow of labeling approaches for the identification of substrates of proteases. A, B: proteins; C, D: proteolysis products of the protein A. a, b, c, d: Peptides resulting from enzymatic digestion of the proteins A, B, C, D. Label I (black dots, heavy label) and label II (open circles, light label) belong to the same group of label reagents (e.g., ICAT, ITRAQ or SILAC) but differ in their molecular masses because of the application of stable isotopes (ICAT, SILAC), or in the case of ITRAQ because of the integration of reporter groups, which differ in their molecular masses because of their different chemical compositions. MS, mass spectrometry; MS/MS, tandem mass spectrometry
The group of Vandekerckhove has developed a LC-MS-based proteomics technique named COFRADIC [42]. With COFRADIC, tryptic peptides can be sorted for defined properties, e.g., N-terminal peptides of digested proteins [43]. Analysis of isolated N-terminal peptides by COFRADIC combined with isotope-labeling strategies enables the discovery of induced actions of proteases, as shown in a study performed by Van Damme et al. [44] which led to the identification of approximately 100 different proteolytic events in Fas-induced apoptotic Jurkat T-cells, the majority reflecting the action of caspases.
Further insights into current biochemical, genetic and proteomic methods for the global analysis of substrates of proteases are given in the reviews of Van Damme [45] and Overall [15]. Though powerful, the majority of proteomic approaches lack information about the exact chemical compositions of the identified proteins. The exact chemical composition of a protein determines the functional status of a protein. Many proteases are activated by the proteolytic removal of a part of their peptide chain. However, 100% sequence coverage in proteomic investigations is not obtained very often, thus leaving the functional statuses of these proteins unclear. Other posttranslational modifications which may determine the functional status are also more or less ignored. Therefore, additional strategies that are complementary to global approaches are still needed in protease research. This brief overview of the complexity of proteases and the steps that are necessary to decipher the physiological roles of human proteases clearly shows that an enormous amount of work must still be done in this area. This is underlined by the fact that only about 1% of the human genes encoding proteases (Fig. 1) have been investigated to a similar degree as thrombin, which is required to obtain the necessary depth of information about the complex system associated with each protease gene.
Mass spectrometry for monitoring protease reactions
In contrast to protein identification, described above, the application of mass spectrometry to monitor enzymatic reactions is much less common. In his review of mass spectrometry for enzyme assays, Greis reported an exponential growth in published works that cite enzymes and mass spectrometry as major descriptors in their abstracts over the past 20 years [46]. However, the first comprehensive review of the topic of using mass spectrometry to monitor enzymatic activity was published by Liesner and Karst in 2005 [47]. Most enzyme assays are based on the change in spectroscopic properties during the conversion of a substrate to a product. Thus enzymatic reactions are detected using fluorescence spectroscopy or UV absorbance [48]. Since most naturally occurring substrates do not possess any optical properties that change significantly during the enzymatic reaction, it is obligatory to introduce synthetically chromophoric or fluorophoric chemical groups into the molecular structure. These functionalities might change the recognition of the substrate, therefore possibly altering kinetic properties [47]. Alternatively, substrates with unstable isotopes are often preferred because they are chemically identical to the natural substrates and can be detected sensitively. Unfortunately, radiometric assays require the separation of the radioactive products by thin-layer chromatography or some other chromatographic methods and subsequent liquid scintillation counting. Radiometric as well as optical methods both contribute an ambiguity regarding the fate of the chemical structure of the substrate after the enzymatic conversion. Thus false positive results cannot be excluded. Furthermore, the availability of unstable isotope-labeled compounds is often restricted. In this case, additional synthetic work with radioactive compounds is required to obtain the desired compounds, therefore leading to problems with handling radioactive waste [47, 49].
Since enzymatic reactions change the chemical structure of the reactants, in most cases this change is accompanied by a change in the molecular weight. Consequently, mass spectrometric techniques are rapid, sensitive, reproducible and unambiguous alternatives for the detection of enzymatic activities. Monitoring the reactions catalyzed by proteases using mass spectrometric techniques is a particularly valuable approach for several reasons:
-
1.
Endogenous substrates can be used. This is especially simple in the case of peptidase-catalyzed reactions, since here synthetic peptides representing the amino acid sequence of the endogenous peptide can be used. Figure 5 gives an example of the conversion of angiotensin I into angiotensin II by the peptidyl-dipeptidase angiotensin-converting enzyme (ACE). Ahmed et al. used urotensin for the detection of a urotensin-metabolizing enzyme [50]. Using angiotensin I, Rykl et al. screened for angiotensin II-generating enzymes. Hermant et al. [51] investigated the proteolytic cleavage of the protein vascular endothelium cadherin by MALDI mass spectrometry. The cleavage of immunoglobulins by the streptococcal cysteine protease IdeS was detected using protein G capture and mass spectrometry [52].
-
2.
The fate of the substrate can be followed. The identities of the peptidic reaction products of an incubation experiment indicate the presence and activities of different proteases. In Fig. 5 (left graph), the activities of several proteases in a crude protein extract of porcine renal tissue are obvious, because in the MALDI mass spectrum of the reaction mixture from the incubation of angiotensin I with renal proteins, signals from different angiotensin peptides are present. Renal tissue is known to synthesize a number of different angiotensin I-converting enzymes such as ACE or cathepsin G [24].
Fig. 5 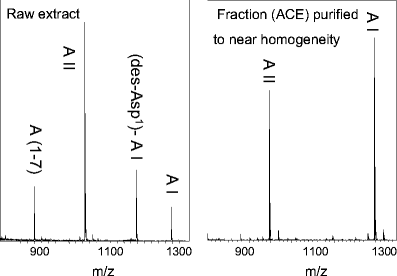
MALDI mass spectra of the proteolytic reaction products of the incubation of angiotensin I with an immobilized complex protein fraction (raw extract of porcine renal tissue; left) and an immobilized purified angiotensin II-generating fraction (right). AI, Angiotensin-I; AII, angiotensin-II; A(1–7), angiotensin (1–7); (des-Asp1)-A-I, des-asparaginic acid angiotensin I. All experiments were performed using the MES method [75]
Monitoring the fate of a defined substrate after incubation with proteases by mass spectrometry has become an established technique in proteasome research (as reviewed in [53]). This approach, which first found application in the 1990s, comprises the following steps. First, 15–40-residue-long synthetic precursor peptides are incubated with purified proteasomes for periods of typically 30 min to 8 h. Short digestion times (10–30 min) permits the characterization of initial cleavage products and intermediates. Extended incubation times (up to 48 h) can result in an increase in the final proteolysis products and help with the identification of epitopes produced in low abundance. Second, the molecular masses of the proteolytic peptides are determined, usually after separating the generated peptides by reversed-phase HPLC. The separation step is required because of the complexity of the digests obtained. MS analyses are then performed off-line using a MALDI mass spectrometer [54] or on-line by applying an electrospray source coupled to a tandem mass analyzer [55, 56]. With the amino acid sequence of the peptidic substrate known, a measurement of the molecular mass is often sufficient to determine the sequences of the generated peptides [57].
The analysis of the posttranslational processing of peptide hormones is comparable to the characterization of the proteolytical processing of a defined peptide by mass spectrometry in proteasome research. A few early reports on the processing of neuropeptides appeared in the 1980s [58], and the first reviews were published in the 1990s [59, 60].
-
3.
Mass spectrometry helps to characterize the cleavage sites of proteolytic reactions, as demonstrated in Fig. 6. The MALDI mass spectrum in Fig. 6(I) shows the reaction products of the incubation of a peptidic substrate representing a partial sequence of bovine pro-urotensin (RIKKPYKKRGPPSECFWKYCV; urotensin-converting enzyme substrate) with a fraction purified from bovine renal tissue possessing urotensin-generating activity. Aside from the signal from urotensin (GPPSECFWKYCV), two further signals appear in the mass spectrum, representing the urotensin peptides RGPPSECFWKYCV and KRGPPSECFWKYCV. Because the active fraction was purified to near-homogeneity, it is quite clear that the three different cuts were performed by one protease. The substrate specificity is similar to that of trypsin, since the urotensin-generating enzyme prefers arginine and lysine as cleavage sites.
Fig. 6 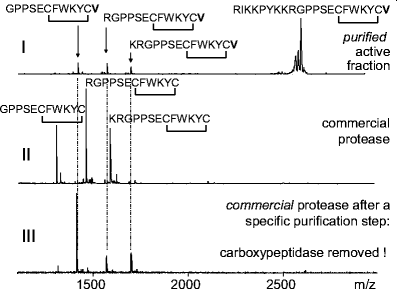
(I) Determination of the cleavage sites of a protease with urotensin-generating activity purified from bovine renal tissue. (II, III) Detection of the presence of a proteolytic impurity within a commercial protease. MALDI mass spectra of the reaction mixtures from three different incubation experiments are shown. All experiments were performed using the MES method [75]. Briefly, the immobilized proteins of a fraction with urotensin-converting activity purified from bovine renal tissue (I) and the commercial protease before (II) and after (III) purification were incubated for 2 h with the urotensin-converting enzyme substrate RIKKPYKKRGPPSECFWKYCV, which contains a disulfide bridge between the cysteines
Other groups have investigated the substrate specificities of proteases by mass spectrometry. Hermant et al. [51] determined the proteolytic cleavage sites of vascular endothelium cadherin, while Chu et al. [61] used peptide-based screening to analyze the substrate specificity of severe acute respiratory syndrome (SARS) coronavirus 3C-like protease; both groups therefore used MALDI mass spectrometry.
-
4.
The presence of different proteolytical activities or impurities with proteolytic activities in protein fractions can be controlled. Figure 6(II and III) gives an example showing the mass spectrometric detection of an impurity with carboxypeptidase activity by monitoring the reaction products of a commercial protease incubated with urotensin-converting enzyme substrate. Here the presence of a carboxypeptidase became obvious because valine was cleaved from the C-termini of all three reaction products. A chromatographic purification step, which was also used for the purification of the urotensin-generating fraction (Fig. 6(I)), was applied to the commercial protease to remove the carboxypeptidase. Incubation of the purified protease with urotensin-converting enzyme substrate yielded the same reaction products (Fig. 6(III)) as incubation with the purified urotensin-generating fraction (Fig. 6(I)). Dahlmann et al. [62] used mass spectrometric monitoring of protease reactions to show that different proteasome subtypes in a single tissue exhibit different enzymatic properties.
-
5.
The monitoring of reaction products of proteolytic conversions can be used as protease assay system, e.g., for guiding the purification of a protease from a protein extract, as shown in Fig. 3. In these approaches a mass spectrometry-based assay is especially useful since the control over the identities of the reaction products reduces the risk of false-positive results. Figure 7 shows typical results of a mass spectrometry-based enzyme assay, which was performed to determine the angiotensin II-generating activities of two different chromatographic fractions by measuring the reaction products of the incubation of angiotensin I with the immobilized proteins from the two fractions. Aliquots from several different incubation times were analyzed. Fraction I has a significantly higher angiotensin II-generating activity than fraction II because the signal intensity of angiotensin II increases much more rapidly with increasing incubation time.
Fig. 7 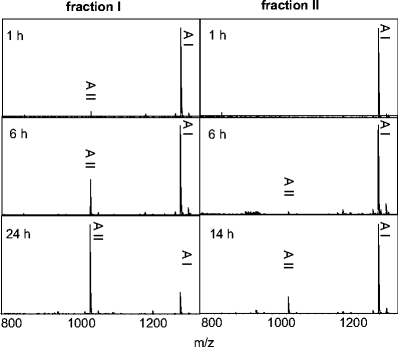
Determination of angiotensin II-generating activities of different chromatographic fractions by mass spectrometry. MALDI-MS spectra of the reaction products of immobilized proteins (following the MES method) of fraction I and fraction II derived from porcine renal tissue after 1 h, 6 h and 24 h of incubation time are shown. AI, Angiotensin-I; AII, angiotensin-II
To measure enzymatic activities as shown in Fig. 7, quantitative information about the increase in the amount of the reaction product within a defined time period is needed. Mass spectrometry of the reaction products of proteases using either ESI or MALDI is not well suited to quantification without the application of internal standards, because the signal intensities are not strictly related to the concentration of the analyte but are critically dependent on the complexity of the sample mixture. Therefore, quantification with mass spectrometry only yields very reliable results if stable isotopes are added as internal standards. In the case of MALDI-MS-based enzyme assays, relative quantifications are possible because the signal of the substrate can be used as an “internal” standard, and thus the ratio of the signal intensity of the reaction product to that of the substrate is calculated. This kind of relative quantification is adequate for many protease assay applications. The group of Heinzle has investigated MALDI-MS-based quantification for monitoring enzymatic reactions in depth [63, 64]. John et al. applied MALDI-MS for the quantification of the angiotensin-converting enzyme-mediated degradation of human chemerin 145–154 in plasma [65].
As an alternative to MALDI-MS measurements, multiple reaction monitoring (MRM), routinely performed with electrospray-ionization triple-quadrupole instruments [66], can be used for the quantification of the reaction products. Again, if internal standards labeled with stable isotopes are not used, absolute quantification is not possible. However, the MRM method is robust and sensitive, yielding data that correspond directly to the concentrations of the analytes, and it covers a dynamic range in the order of 3–5 magnitudes [67–69]. Barr et al. [70] used the MRM method for the detection and differentiation of botulinum neurotoxins (BoNTs), which are proteases that cleave specific cellular proteins essential for neurotransmitter release.
Sample preparation in mass spectrometry-based enzyme assays plays the same important role as in every other application of mass spectrometry for the analysis of biomolecules (reviewed in, e.g., [71, 72]). The investigation of proteolytic reactions often requires control over pH and ionic strength. Therefore, samples from experiments with proteases often contain salts that negatively interfere with the analysis of peptides and proteins using MALDI or ESI mass spectrometers, resulting in a significant decrease in their signal intensities. Peptides, the reaction products of peptidases, can easily be desalted by reversed-phase chromatography using either a simple ZipTip preparation or by column chromatography. Therefore, LC-MS setups are well suited to the analysis of proteolytic reactions [57, 73].
Villanueva [74] stated that the quantitation of enzymatic activities in a complex biological matrix, either individually or in aggregate form, is clearly within the realm of proteomics, but, regrettably, this is a largely unpracticed subspecialty at the moment. However, it is possible to monitor enzymatic activities in a complex biological matrix by applying mass spectrometry-based enzyme screening (MES) [75]. The proteolytic reactions in complex samples can be detected with MES, because the proteins are covalently immobilized and are then washed prior to incubation, thus removing all substances that may otherwise negatively interfere with mass spectrometry. As a result, the spectra are easy to interpret (Figs. 5–7). Furthermore, aliquots of the incubation reaction mixtures can be applied directly onto the MALDI target or sprayed via nanospray without any further sample preparation, because the reactions can be performed in HPLC-grade water. MES has also been applied for protease-substrate screening [76].


Application of mass-spectrometric monitoring of proteolytic reactions in clinical proteomics
Peptidomics represents an approach to biomarker research that has the potential to add significant clinical value [77, 78]. Identification-oriented peptidomics can be interpreted as a global form of reaction monitoring of proteases, since most of the peptides in body fluids are products of extracellular proteases [79]. When the identity of a peptide is identified, the precursor protein can usually be determined, thus yielding the cleavage site [74]. This knowledge of the cleavage site can then be used to search for the protease in silico or through biochemical approaches, as shown in Fig. 3.
Following comparative peptidomic screens, it has been postulated that serum peptide patterns, as surrogates for proteolytic activities, reflect the important physiological changes in cancer patients and may therefore contain diagnostic information [79]. Consequently, Villanueva et al. developed a test to compare defined exoprotease activities within individual proteomes by tracking the degradation of artificial substrates using semi-automated MALDI-MS analysis of the resulting proteolytic patterns [74]. A similar approach was reported by Findeisen et al. [80, 81], who investigated the use of defined exogenous reporter peptides as substrates for disease-specific proteases by MALDI-MS profiling.
References
Müller J, Schwann T (1836) Arch Anat Physiol Med 90–138
Mackman N, Tilley RE, Key NS (2007) Arterioscler Thromb Vasc Biol 27:1687–1693
Alao JP (2007) Mol Cancer 6:24
Bowerman B, Kurz T (2006) Development 133:773–784
Rushton I (2007) Nurs Stand 21:68–72
Siegel RM (2006) Nat Rev Immunol 6:308–317
Lopez-Otin C, Matrisian LM (2007) Nat Rev Cancer 7:800–808
Lane DA, Philippou H, Huntington JA (2005) Blood 106:2605–2612
Yanagisawa M, Kurihara H, Kimura S, Tomobe Y, Kobayashi M, Mitsui Y, Yazaki Y, Goto K, Masaki T (1988) Nature 332:411–415
Yorimitsu K, Moroi K, Inagaki N, Saito T, Masuda Y, Masaki T, Seino S, Kimura S (1995) Biochem Biophys Res Commun 208:721–727
Schlüter H (2007) In: Hicks MG, Kettner C (eds) Experimental standard conditions of enzyme characterizations. Logos, Berlin
Cohen N, Kudryashova E, Kramerova I, Anderson LV, Beckmann JS, Bushby K, Spencer MJ (2006) Proteomics 6:6075–6084
Lleo A (2008) Curr Top Med Chem 8:9–16
Carragher NO, Frame MC (2002) Int J Biochem Cell Biol 34:1539–1543
Overall CM, Blobel CP (2007) Nat Rev Mol Cell Biol 8:245–257
Schilling O, Overall CM (2007) Curr Opin Chem Biol 11:36–45
auf dem Keller U, Doucet A, Overall CM (2007) Biol Chem 388:1159–1162
Fenn JB, Mann M, Meng CK, Wong SF, Whitehouse CM (1989) Science 246:64–71
Karas M, Hillenkamp F (1988) Anal Chem 60:2299–2301
Aebersold R, Mann M (2003) Nature 422:198–207
Link AJ, Eng J, Schieltz DM, Carmack E, Mize GJ, Morris DR, Garvik BM, Yates JRI (1999) Nat Biotechnol 17:676–682
Swanson S, Washburn M (2005) Drug Discov Today 10:719–725
Gevaert K, Vandekerckhove J (2000) Electrophoresis 21:1145–1154
Rykl J, Thiemann J, Kurzawski S, Pohl T, Gobom J, Zidek W, Schluter H (2006) J Hypertens 24:1797–1807
Overall CM, Tam EM, Kappelhoff R, Connor A, Ewart T, Morrison CJ, Puente X, Lopez-Otin C, Seth A (2004) Biol Chem 385:493–504
Jeffery DA, Bogyo M (2003) Curr Opin Biotechnol 14:87–95
Cravatt BF, Wright AT, Kozarich JW (2008) Annu Rev Biochem 77:383–414
Thimon V, Belghazi M, Labas V, Dacheux JL, Gatti JL (2008) Anal Biochem 375:382–384
Matthews DJ, Wells JA (1993) Science 260:1113–1117
Deng SJ, Bickett DM, Mitchell JL, Lambert MH, Blackburn RK, Carter HL 3rd, Neugebauer J, Pahel G, Weiner MP, Moss ML (2000) J Biol Chem 275:31422–31427
Turk BE, Huang LL, Piro ET, Cantley LC (2001) Nat Biotechnol 19:661–667
Lopez-Otin C, Overall CM (2002) Nat Rev Mol Cell Biol 3:509–519
Overall CM (2001) Methods Mol Biol 151:79–120
Puente XS, Sanchez LM, Overall CM, Lopez-Otin C (2003) Nat Rev Genet 4:544–558
Gygi SP, Rist B, Gerber SA, Turecek F, Gelb MH, Aebersold R (1999) Nat Biotechnol 17:994–999
DeSouza L, Diehl G, Rodrigues MJ, Guo J, Romaschin AD, Colgan TJ, Siu KW (2005) J Proteome Res 4:377–386
Ong SE, Blagoev B, Kratchmarova I, Kristensen DB, Steen H, Pandey A, Mann M (2002) Mol Cell Proteomics 1:376–386
Tam EM, Morrison CJ, Wu YI, Stack MS, Overall CM (2004) Proc Natl Acad Sci USA 101:6917–6922
Dean RA, Overall CM (2007) Mol Cell Proteomics 6:611–623
Enoksson M, Li J, Ivancic MM, Timmer JC, Wildfang E, Eroshkin A, Salvesen GS, Tao WA (2007) J Proteome Res 6:2850–2858
Neher SB, Villen J, Oakes EC, Bakalarski CE, Sauer RT, Gygi SP, Baker TA (2006) Mol Cell 22:193–204
Gevaert K, Van Damme J, Goethals M, Thomas GR, Hoorelbeke B, Demol H, Martens L, Puype M, Staes A, Vandekerckhove J (2002) Mol Cell Proteomics 1:896–903
Gevaert K, Goethals M, Martens L, Van Damme J, Staes A, Thomas GR, Vandekerckhove J (2003) Nat Biotechnol 21:566–569
Van Damme P, Martens L, Van Damme J, Hugelier K, Staes A, Vandekerckhove J, Gevaert K (2005) Nat Methods 2:771–777
Van Damme P, Vandekerckhove J, Gevaert K (2008) Biol Chem 389(4):371–381
Greis KD (2007) Mass Spectrom Rev 26:324–339
Liesener A, Karst U (2005) Anal Bioanal Chem 382:1451–1464
Tipton KF (1992) Enzyme assays, a practical approach. IRL, Oxford
Schlüter H, Jankowski J, Thiemann J, Rykl J, Kurzawski S, Runge D (2004) Determination of enzyme activities by mass spectrometry. Logos, Berlin
Ahmed S, Thiemann J, Kurzawski S, Rykl J, Jankowski J, Wittmann-Liebold B, Pohl T, Schlüter H (2005) J Electrophoresis 49:1–6
Hermant B, Bibert S, Concord E, Dublet B, Weidenhaupt M, Vernet T, Gulino-Debrac D (2003) J Biol Chem 278:14002–14012
Hess JL, Porsch EA, Shertz CA, Boyle MD (2007) J Microbiol Methods 70:284–291
Burlet-Schiltz O, Claverol S, Gairin JE, Monsarrat B (2005) Methods Enzymol 405:264–300
Nussbaum AK, Dick TP, Keilholz W, Schirle M, Stevanovic S, Dietz K, Heinemeyer W, Groll M, Wolf DH, Huber R, Rammensee HG, Schild H (1998) Proc Natl Acad Sci USA 95:12504–12509
Wenzel T, Eckerskorn C, Lottspeich F, Baumeister W (1994) FEBS Lett 349:205–209
Ehring B, Meyer T, Eckerskorn C, Lottspeich F, Tampé R (1996) Eur J Biochem 235:404–415
Peters B, Janek K, Kuckelkorn U, Holzhutter HG (2002) J Mol Biol 318:847–862
Takeshita H, Desiderio DM, Fridland G (1986) Biomed Chromatogr 1:126–139
Nilsson CL, Karlsson G, Bergquist J, Westman A, Ekman R (1998) Peptides 19:781–789
Silberring J, Li YM, Hjerten S (1994) Biochem Soc Trans 22:136–140
Chu LH, Choy WY, Tsai SN, Rao Z, Ngai SM (2006) Protein Sci 15:699–709
Dahlmann B, Ruppert T, Kuehn L, Merforth S, Kloetzel P (2000) J Mol Biol 303:643–653
Bungert D, Heinzle E, Tholey A (2004) Anal Biochem 326:167–175
Tholey A, Zabet-Moghaddam M, Heinzle E (2006) Anal Chem 78:291–297
John H, Hierer J, Haas O, Forssmann W (2007) Anal Biochem 362:117–125
Tamvakopoulos C (2007) Mass Spectrom Rev 26:389–402
Anderson L, Hunter CL (2006) Mol Cell Proteomics 5:573–588
Barnidge DR, Goodmanson MK, Klee GG, Muddiman DC (2004) J Proteome Res 3:644–652
Kuhn E, Wu J, Karl J, Liao H, Zolg W, Guild B (2004) Proteomics 4:1175–1186
Barr JR, Moura H, Boyer AE, Woolfitt AR, Kalb SR, Pavlopoulos A, McWilliams LG, Schmidt JG, Martinez RA, Ashley DL (2005) Emerg Infect Dis 11:1578–1583
Andre M, Karas M (2007) Anal Bioanal Chem 389:1047–1053
Cañas B, Piñeiro C, Calvo E, López-Ferrer D, Gallardo J (2007) J Chromatogr A 1153:235–258
Wang Y, Zagorevski DV, Stenken JA (2008) Anal Chem 80:2050–2057
Villanueva J, Nazarian A, Lawlor K, Yi SS, Robbins RJ, Tempst P (2008) Mol Cell Proteomics 7:509–518
Schlüter H, Jankowski J, Rykl J, Thiemann J, Belgardt S, Zidek W, Wittmann B, Pohl T (2003) Anal Bioanal Chem 377:1102–1107
Schlüter H, Rykl J, Thiemann J, Kurzawski S, Gobom J, Tepel M, Zidek W, Linscheid M (2007) Anal Chem 79:1251–1255
Liotta LA, Petricoin EF (2006) J Clin Invest 116:26–30
Tammen H, Peck A, Budde P, Zucht HD (2007) Expert Rev Mol Diagn 7:605–613
Villanueva J, Shaffer DR, Philip J, Chaparro CA, Erdjument-Bromage H, Olshen AB, Fleisher M, Lilja H, Brogi E, Boyd J, Sanchez-Carbayo M, Holland EC, Cordon-Cardo C, Scher HI, Tempst P (2006) J Clin Invest 116:271–284
Findeisen P, Post S, Wenz F, Neumaier M (2007) Clin Chem 53:1864–1866
Findeisen P, Peccerella T, Post S, Wenz F, Neumaier M (2008) Rapid Commun Mass Spectrom 22:1223–1229
Acknowledgements
This work was supported by the BMBF (Bundesministerium für Forschung und Technologie. Grants: 031U216A, 0313694 A). We thank Dr. P. Henklein, Institute of Biochemistry, Charite, for the synthesis of the peptides.
Author information
Authors and Affiliations
Corresponding author
Rights and permissions
About this article
Cite this article
Schlüter, H., Hildebrand, D., Gallin, C. et al. Mass spectrometry for monitoring protease reactions. Anal Bioanal Chem 392, 783–792 (2008). https://doi.org/10.1007/s00216-008-2213-7
Received:
Revised:
Accepted:
Published:
Issue Date:
DOI: https://doi.org/10.1007/s00216-008-2213-7