
Abstract
We live in an increasingly global, connected and digital world. In less than a decade or so, fast developments in digital technologies, such as the Cloud, Internet, wireless network, and most importantly mobile telephony, have dramatically changed the way we work, live and play. Rapid advances in Information and Communication Technologies (ICT) foster a new world of cross-disciplinary data-intensive research characterised by openness, transparency, access to large volume of complex data, availability of community open tools, unprecedented level of computing power, and new collaboration among researchers and new actors such as citizen scientists. Identifying and understanding the key drivers of change in the data economy and EO sector (including technological, human, cultural and legal factors) is essential to providing context on which to build an EO strategy for the twenty-first century. The emergence of cloud computing is already transforming the way we access and exploit data. This has led to a paradigm shift in the way to distribute and process data, and in creating platforms that drive innovation and growth in user applications.
You have full access to this open access chapter, Download chapter PDF
Introduction
The Earth Observation industry, part of the wider data economy, is experiencing a number of factors that are driving change across the value chain. These include, to name a few, leveraging IT infrastructure such as cloud computing, the rise of platforms and the Internet of Things (IoT), interconnected terrestrial and space-borne systems, diversification of business models and open data policies. Copernicus, the European flagship programme to provide geo-information services to EU policy makers, provides a strong opportunity as market driver for EO-based services. According to a recent survey by the European Association of Remote Sensing Companies (EARSC), Industry is optimistic about the positive impact the Copernicus programme will have on their business (EARSC 2015).
The European Commission’s Digital Single Market Package is a genuine driver for EU growth and new jobs. It highlights the benefits of a stronger Digital Single Market and its potential for higher growth and new jobs, and increasing global competitiveness:
Full and efficient exploitation of tools and services such as Cloud Computing, Big Data, Automation, Internet of Things and Open Data can drive for better productivity and better services, and therefore should be facilitated, including through market driven solutions, R&D and the promotion of the necessary skills and capacity building, along with further ICT standardisation and interoperability (Council of the European Union 2015)
The volume, variety and velocity of data are increasingly rapidly and “Big Data” acts as the oil in the supply chain for many industries. Within the next few years, ESA spacecraft alone will obtain approximately 25 PB of Earth Observation (EO) data as a result of the Copernicus programme (Di Meglio et al. 2014). In addition, data is generated from a multitude of sources, including small satellite constellations, ground and airborne sensors (e.g. Unmanned Aerial Vehicles, UAVs), social media, machine to machine (M2M) communications and crowdsourcing.
The cost-effective to process and store data is falling, making it simpler and more economical to capture larger datasets by leveraging the significant investment made by companies in the cloud computing industry. Increasing value lies in turning this data into knowledge and actionable insights, thereby enabling new applications and services that create value for end users. With views into daily activity being refreshed at a faster rate than ever before, just selling raw pixels is not enough to satisfy end-user demands, those pixels need to be turned into insights. This is evident in the EO sector where ambitious start-ups, such as Planet, are building constellations of small satellites and developing cutting-edge analytics to extract value from the data captured. Many of these start-ups consider themselves as satellite powered data companies. In Planet most recent round of funding the company plans to use the investment to develop its capabilities for processing, interpreting and selling data contained in its images. It was this focus that attracted interest from Data Collective, a venture capital firm, which has backed several big data start-ups (Financial Times 2015).

Data value chain. Source: Digital Catapult (2014)
More EO missions are being launched than ever before. Reduced launch costs, miniaturisation of technology, improved on-board processing and better reliability are driving increased interest in small satellites by new commercial companies. To unlock the economic potential of data from the increasing number of satellites, public agencies and private companies are creating data products that aim to be responsive to user needs. The satellite data generated from ESA’s Sentinel satellite constellation, for example, will provide actionable insights from the observation of the planet thanks to an array of sensor technologies, including Synthetic Aperture Radar (SAR) and Multispectral/Hyperspectral sensors.
EO as a Platform turns raw data into knowledge through processing and analysis, creating value within and across various sectors. EO and remote sensing data has significant potential to help us manage the modern world and our planet’s resources. Applications and services are already emerging for emergency response and environmental monitoring, while emerging markets such as precision agriculture, monitoring of illegal fishing and management of natural resources are rapidly developing. There is increasing value to be created by reaching more customers through the applications of big data. The EO data value chain creates opportunity for small and medium sized enterprises (SMEs) and start-ups to engage with the space sector, and generate value from satellite missions by developing applications for citizens, local government and commercial industry.
Public agencies are increasingly interested in how they can interact effectively with companies that have enabled a globally distributed applications ecosystem and are investing extensively in cloud computing infrastructure. Commercial cloud providers, like Microsoft Azure and Amazon Web Services, are key enablers of building, deploying and managing scalable applications with the aim of reaching a global audience. Open data policies can enable the private sector to do just that, and reach a wide audience of application developers and end users. According to The Economist, information held by governments in Europe could be used to generate an estimated €140 billion worth of value a year (The Economist 2013). In short, making official data public will spur innovation and create new applications. These benefits need to be balanced against the rights of individuals to have their data protected by government.

Summary: value chain, key drivers of change. Source: Satellite Applications Catapult
The key drivers of change in the data economy impacting the EO market include:
-
Rise of the platforms: leveraging cloud computing infrastructure to process more and more layers of data, from multiple sources. Simplifying applications development and building an app ecosystem around scalable, on-demand IT infrastructure.
-
Data as a Service: user manages the application, everything else is delivered as a service. Moving users closer to the data (“data gravity”) via Content Delivery Networks (CDNs).Footnote 1
-
Open data policies: demand from users and government policies changing towards improved access to data and tools.
-
New business models: growing an ecosystem of researchers and developers so that people can easily gain access to and use a multitude of data analysis services quickly, through cloud and high performance computing (HPC) platforms, to add knowledge and open source tools for others’ benefit.
-
Sensor use growing: Internet of Things and sensors intelligently working at the edge of networks, complementarity of space-borne and terrestrial data.
-
Crowdsourcing: citizen science platforms and their commercial capability.
-
Disruptive innovation: introduces a new value proposition. They either create new markets or reshape existing ones.
Rise of the Platforms
Cloud computing refers to accessing highly scalable computing resources through the Internet, often at lower prices than those required to install on one’s own computer because the resources are shared across many users. Cloud computing has become the next logical evolution in computing—combining the critical elements of each architecture that came before it.
The NIST (National Institute of Standards and Technology) offers the following definition of cloud computing:
Cloud computing is a model for enabling ubiquitous, convenient, on-demand network access to a shared pool of configurable computing resources (e.g. networks, servers, storage, applications, and services) that can be rapidly provisioned and released with minimal management effort or service provider interaction.
Cloud computing is about the capability to access any information, at any time, regardless of the resources required and the location of the infrastructure, data, application or user. The availability of robust cloud platforms and applications have begun to enable businesses to shift budget spending from capital expense (including dedicated, physical on-site servers) to operating expense (shared hosting by cloud providers) (Woodside Capital Partners 2014).
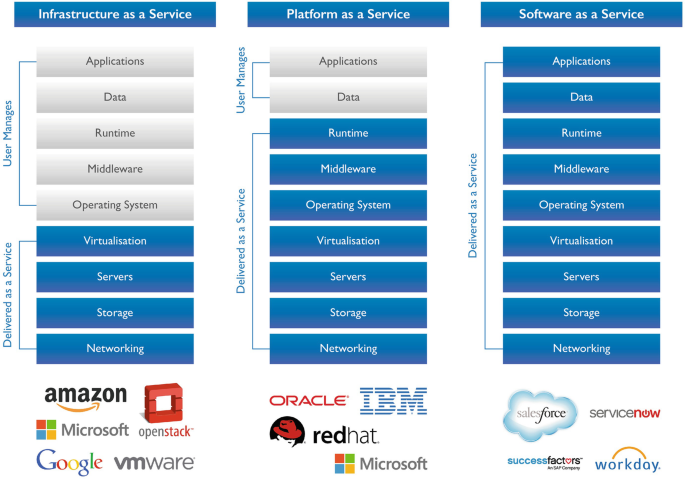
Cloud computing services are typically segmented into three different areas:
-
1.
Infrastructure as a Service (IaaS)—third-party provider hosts virtualised computing resources over the Internet, through which customers can host and develop services and applications.
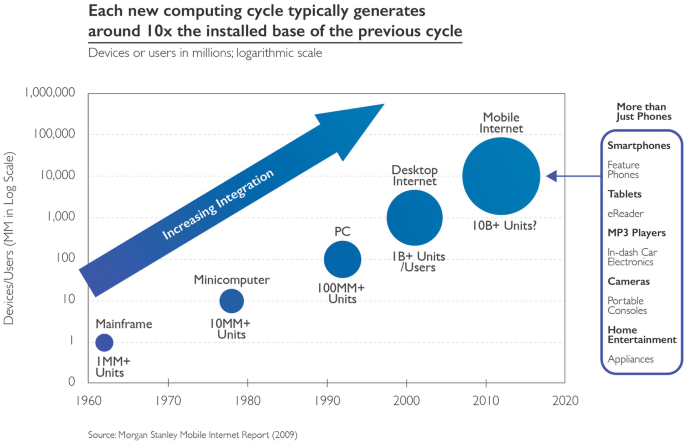
Each new computing cycle typically generates around 10× the installed base of the previous cycle. Source: Kleiner Perkins Caufield Buyers (2014) Internet Trends 2014, see www.kpcb.com/InternetTrends retrieved on December 5th 2014
Cloud delivery options. Source: Woodside Capital Partners (2014) OpenStack: Is this the Future of Cloud Computing? see www.woodsidecap.com/wp-content/uploads/2014/11/WCP-OpenStack-Report_FINALa.pdf. Retrieved on 21st November 2014.
-
2.
Platform as a Service (PaaS)—used by developers to build applications for web and mobile using tools provided by the PaaS provider—these range from programming languages to databases.
-
3.
Software as a Service (SaaS)—software is hosted in the cloud, but appears on devices with full functionality.


Access to the Cloud and platforms are required to capitalise on the data and tools being created to make it easier and faster to discover, process and action on EO datasets. The cloud provides scalability and flexibility in a cost-efficient manner. There should be a combination of ESA and cloud providers supporting the communities within the EO ecosystem to develop tools and ensure data access.
Commercial cloud, capitalising on co-location of computing resources and data storage, is now becoming widely adopted as it offers several advantages enabling users to (1) perform data-intensive science, (2) ensure traceability of workflows, input data sets and therefore enabling to reproduce results, (3) facilitate integration with other non-EO data through standard web services (e.g. open data and IoT for smart cities) and (4) open new business models, whereby commercial data, proprietary software, apps and computing resources can now be rented on-demand (as opposed to purchased) to generate Information as a Service. Given the number of EO platforms that are being developed and coming on-line, the challenge revolves around the technical and economic aspects of interoperability, such as:
-
A common EO data pool from all EO missions in Europe;
-
A processing capability management (sharing of resources and cloud services for processing);
-
Sustainability through fair and democratic access to all resources (data, intellectual properties, enabling technologies/computing) by means of underlying implementation principles based on brokerage within an open environment;
-
Federated user interfaces subsystems (e.g. interlinked EO data catalogues), interface and standards definition and agreement;
-
Development of common value-creation techniques (research in data analytics and information retrieval, information visualization, data mining, fusion of in situ data with geo-information, etc.);
-
Definition and application of commonly agreed data management principles to ensure data discoverability, accessibility, usability, preservation and curation.
-
With the emergence of cloud-based storage and computing, users are now able to easily and cheaply process data on demand. This leads to a paradigm shift whereby data providers are now moving the computations—and therefore the users—to the data, rather than the data to the users. In this context, ESA is developing a series of EO Thematic application platforms or Virtual Research Environments (e.g. Geohazard SuperSites) to exploit the data for different applications and communities.
-
Increasing data access and data liquidity, through interaction with the wider data economy and embracing ICT trends (Cloud, open software, APIs), will support new products with market opportunity. This will pave the way for new and existing organisations that have valuable skills or market knowledge, to enter the EO community by making it easier to discover, access and process EO datasets. Both the “democratisation” of GIS skills and making EO tools and interfaces more user friendly are crucial to enabling a much wider range of users.
Core to the data access agenda is cloud computing, which allows users to use on-demand computing resources co-located with data staged for analysis in the cloud. Commercial cloud providers, such as Amazon Web Services and Microsoft Azure, offer various tools and techniques to enable the build, deployment and management of scalable applications, with the aim of reaching a global audience. Through these platforms, underlying computer and storage resources scale automatically to match application demand. When data is made publicly available via a commercial cloud provider, users can access and analyse the data extremely rapidly and at very large scale.
Core also to increasing data access and liquidity are powerful functional interfaces (APIs) that allow discovery and retrieval of EO data and products, thereby delivering analysis ready data. The cloud based API Economy is key to accelerating value, improving performance, and extending products and services to the widest possible audience. User friendly API’s are essential—they must be flexible enabling enhanced features so entrepreneurs and developers can use combinations of data for specific themes. A well-established way to simplify access to services and data is to implement an API since this enables a developer to exploit their specialist knowledge to create higher level products and services without having to invest a large amount of time and effort to access the relevant data and create, and then verify, basic services. Companies like Planet Spire are following this approach by developing APIs and allowing “plug-and-play” access to them. The biggest player in the satellite data industry, DigitalGlobe has recently announced the launch of Maps API to allow software developers to embed satellite images, maps and other geospatial content into their mobile and web applications.
Data as a Service
More recently, the concept of data as a service (DaaS) has developed. It represents the enablement of regular, non-expert users to effectively take control of often highly complex and traditionally inaccessible IT tools. DaaS can be defined as the sourcing, management, and provision of data delivered in an immediately consumable format to users.Footnote 2 Like all members of the “as a Service” family, DaaS is based on the concept that the product, data in this case, can be provided on demand to the user regardless of geographic or organisational separation of provider and consumer. Data quality can happen in a centralised place, cleansing and enriching data and offering it to different systems, applications or users, irrespective of where they were in the organization or on the network.
An increasing number of Internet network owners have built their own content delivery networks (CDNs) to improve on-net content delivery and to generate revenues from content customers. For example Microsoft builds its own CDN in tandem with its own products through its Azure CDN. CDNs, like Azure and Amazon’s CloudFront, are key enablers of building, deploying and managing scalable applications with the goal of reaching a global end user audience. Through these platforms, underlying computer and storage resources scale automatically to match application demand.
According to some reports, 300,000 APIs (Application Programming Interfaces) are projected to be registered by 2020.Footnote 3 APIs are the fastest growing, business-influencing technology in the IT industry today. With an API, developers can exploit functions of existing computer programmes in other applications. Companies are exposing APIs to allow others to consume their business functions, for a profit. Where Windows and Linux have been traditional development platforms of the past, Google, Facebook, Twitter and other companies are becoming the development platforms of the future. All of these companies built a functional platform of business capabilities and extended their business models by exposing APIs so that developers can exploit their functionality. Google Maps is a key example. Many developers write mash-ups (using content for an application from more than one source) on top of Google Maps for various reasons, for example retail store locators, traffic reports, road conditions and so on.
APIs are now coming of age with the advent of cloud computing, where the ability to host external APIs has matured to a point where cloud service providers have scalable capacity to handle transaction loads and spikes in traffic. Mobile platforms now put application reach on millions of devices, all having access to back-end APIs across the Internet. Amazon Web Services (AWS) Marketplace (Amazon’s API marketplace) attracts not only developers and partners looking to exploit Amazon’s APIs, but other vendors also, such as SAP and Oracle (that provide their own APIs on AWS, to offer analytics for additional value).

APIs are enabling more and more devices to connect. Source: IBM (2014) Exposing and Managing Enterprise Services with IBM API Management.
Open Data Policies
Data has been referred to as the new raw material of the twenty-first century. Like many other raw materials, it needs investment to locate, extract and refine it before it yields value. Open data, employed in combination with open platforms, such as APIs, expands the network of minds and unlocks the data’s latent potential. As a result of increased demand for access to free data, governments and agencies are doing more to open up large amounts of public sector information to the public. ESA, for example, is implementing a free, full and open data policy through the Copernicus programme of Sentinel satellites.
In 1983, President Ronald Reagan made America’s military satellite-navigation system, GPS, available to the world; entrepreneurs pounced on this opportunity. Car navigation, precision farming and three million American jobs now depend on GPS.Footnote 4 Official weather data are also public and avidly used by everyone from insurers to ice-cream sellers. All data created or collected by America’s federal government must now be made available free to the public, unless this would violate privacy, confidentiality or security.
Open and machine-readable is the new default for government information. (US President, Barack Obama (2013))Footnote 5
Many countries have moved in the same direction. In Europe, the information held by governments could be used to generate an estimated €140 billion a year. Footnote 6 McKinsey estimates the potential annual value to Europe’s public sector administration at €250 billion. Footnote 7

The emerging open data ‘Marketplace’. Source: Deloitte (2012) Open growth: Stimulating demand for open data in the UK, see www2.deloitte.com/uk/en/pages/deloitte-analytics/articles/stimulating-demand-for-open-data-in-the-uk.html retrieved on 8th February 2015.
There are lots of companies, charities and individuals who would benefit if all the data the public sector holds was shared with them, particularly if it was shared only with them. However, those benefits have to be balanced against the rights of individuals to have their data protected by government, and the risks to individuals and to society of too much data being available (for example, through making fraud easier).
In The Cathedral & the Bazaar, a book by Eric on software engineering methods, the image of a bazaar is used to contrast the collaborative development model of open source software with traditional software development. In the traditional software development “vending machine model”, the full menu of available services is determined beforehand. A small number of vendors have the ability to get their products into the machine, and as a result, the choices are limited, and the prices are high. A bazaar, by contrast, is a place where the community itself exchanges goods and services.Footnote 8
In the technology world, the equivalent of a thriving bazaar is a successful platform. In the computer industry, the innovations that define each era are frameworks that enabled a whole ecosystem of participation from companies large and small. The personal computer was such a platform and so was the World Wide Web. This same platform dynamic is playing out now in the recent success of the Apple iPhone. Where other phones have had a limited menu of applications developed by the phone vendor and a few carefully chosen partners, Apple built a framework that allowed virtually anyone to build applications for the phone, leading to an explosion of creativity, with more than 100,000 applications appearing in little more than 18 months, and more than 3000 new ones now appearing every week.Footnote 9 Android, with a global smartphone operating system market share of around 80%,Footnote 10 is open-source software for a wide range of mobile devices and a corresponding open-source project led by Google. These successes are due to the openness around frameworks.
As applications move closer to the mass of data, for example by building an applications ecosystem around free and public data sets, more data is created. This concept of ‘data gravity’ is about reducing the cycle time/feedback loop between information and the data presented. This is achieved through lower latency and increased. There is an accelerative effect as applications move closer to data.Footnote 11
Smartphones and tablets, collectively “mobile devices”, are the fastest adopted technology in history. They have been adopted faster than cell phones, personal computers (PCs), televisions, even the Internet and electricity. The reason why the likes of Apple (iOS) and Google (Android) lead the way in mobile applications is because they combine a large pool of talented mobile developers with a robust development infrastructure. Apple ignited the app revolution with the launch of the App Store in 2008, and since then, an entire industry has been built around app design and development. According to recent announcements from Apple, apps on iOS generated over €8 billion in revenue for developers in 2014 and to date, App Store developers have earned a cumulative €20 billion from the sale of apps and games.Footnote 12 According to Flurry Analytics, a mobile analytics firm, in 2014 overall app usage grew by 76%.
New Business Models
New entrants to the EO sector, including Planet and Spire, are opening their data to developers and end-users through APIs. APIs can make it easier to access EO data and to extract the embedded value. Planet has announced that it will release a developer API this year.Footnote 13
Business models are also emerging to develop a more integrated network of stakeholders. CloudEO, a German company that supplies EO data on a pay-per-use or subscription basis,Footnote 14 aims to bring together imagery providers, analytics companies and customers through one platform. In order to attract and expand the user community beyond the boundaries of EO, the development of semantic search structures can play a pivotal role in reaching new users. The GEOinformation for Sustainable Development Spatial Data Infrastructure (GEOSUD SDI) is one example of this.Footnote 15
Among the new products and services that are being developed, EO video data products are worth highlighting. Enabled by more frequent revisit times of EO satellite constellations, these products have the potential to improve the value proposition of a satellite data provider in applications such as disaster relief, surveillance and other applications that could benefit from real-time monitoring.Footnote 16 Canadian company, UrtheCast, has been granted the exclusive right to operate two cameras on the Russian module of the International Space Station (ISS).Footnote 17 As the ISS passes over the Earth, UrtheCast’s twin cameras capture and download large amounts of HD (5 m resolution) video and photos. This data is then stored and made available via APIs on the basis of a pay-for-use model.Footnote 18 One of the innovative characteristics of UrtheCast’s business model is the way it approaches the revenue streams it can tap into, for example by providing videos free of charge and generating an online advertising-like revenue from companies that will have their logos featured on the video in relation to their locations.Footnote 19
Sensor Use Growing
The IoT connects sensors on items, products and machines, enabling users to receive a more fine-grained picture of information systems. IoT represents the next evolution of the Internet, taking a huge leap in its ability to gather, analyse, and distribute data that can be turned into information, knowledge, and actionable insights.Footnote 20
The IoT is forecast to reach 26 billion installed units by 2020, up from 900 million 5 years ago.Footnote 21 Whether used individually or, as is increasingly the case, in tandem with multiple devices, sensors are changing our world for the better—be it by reminding us to take our medicine, or by tracking traffic flow. Satellite imaging of weather systems, vegetation changes, and land and sea temperatures can be combined with temperature and pollution data on the ground to provide a picture of climate change and man’s impact on the planet. Limited range local sensors can provide detailed information that can be cross referenced with satellite data to validate models, which in turn can be used to provide wide area predictions and forecasts. This has been fundamental to the development of weather forecasting, and will be equally fundamental to many other satellite applications.

Rising proliferation of devices. Source: Kleiner Perkins Caufield Buyers (2014), Internet Trends 2014, see www.kpcb.com/InternetTrends retrieved on December 5th 2014.
Embedding sensors in physical objects like computers, watches and robots, provides data to develop technologies that solve our needs and make business cases. For example, an imminent increase in the number of intelligent devices available is set to make supply chains smarter than ever. However it is not just information about the location of physical assets that will boost supply chain visibility. Data about their condition and state will be important, too. For example, if the temperature that food products are kept at throughout the supply chain can be tracked, food companies have a better chance of extending shelf-life and reducing waste.Footnote 22
Toyota has announced the development, in Japan, of the “Big Data Traffic Information Service”, a new kind of traffic-information service utilising big data including vehicle locations and speeds, road conditions, and other parameters collected and stored via telematics services. Based on such data, traffic information, statistics and other related information can be provided to local governments and businesses to aid traffic flow improvement, provide map information services, and assist disaster relief measures.Footnote 23
Crowdsourcing
There has been an explosion of activity in the area termed citizen science, crowdsourcing and volunteered geographic information (VGI). EO data is contributing to problem solving on a global scale. Some of the highest profile successes happen when this data is used in citizen science projects, where the power of large numbers of humans getting involved can achieve results that are simply not possible with computers alone:
-
Speedy provision of information to rescue and support services following natural or manmade disasters;
-
Identifying evidence of illegal activities, including poaching and people trafficking;
-
Improving maps and monitoring the environment.
Citizen science and crowdsourcing are being used in a very diverse range of applications, including archaeology, medicine, mapping, astronomy and disaster response. Science and mapping-related projects may either be organised through one of the aggregator platforms, such as Tomnod and Zooniverse, or stem from calls from organisations such as the UN and scientific bodies.
The Geo-Wiki project, for example, engages people in visual validation of maps, with a focus on land cover and land use. The tool can bring together datasets to be viewed on top of high resolution satellite imagery and has already been used to challenge assumptions about land available for biofuels. The tool also serves as a visualisation platform, bringing together global land cover datasets in a single place, which can be viewed on top of very high resolution satellite imagery from Google Earth and Bing.
The growth of the citizen science movement represents a major shift in the social dynamics of science, in blurring the professional/amateur divide and changing the nature of the public engagement with science.Footnote 24 There has been a shift from observing science passively to being actively engaged in the scientific discussion.
Citizen science encompasses many different ways in which citizens are involved in science. This may include mass participation schemes in which citizens use smartphone applications to submit wildlife monitoring data, for example, as well as smaller-scale activities like grassroots groups taking part in local policy debates on environmental concerns over fracking. Companies are forming to promote citizen science projects. Zooniverse, a citizen science web portal owned and operated by the Citizen Science Alliance, is home to the Internet’s largest collection of citizen science projects. Zooniverse has well over one million volunteers that can get involved in projects to participate in crowdsourced scientific research. Unlike many early Internet-based citizen science projects (such as SETI@home) that used spare computer processing power to analyse data, known as volunteer computing, Zooniverse projects require the active participation of human volunteers to complete research tasks. By combining machine computing with human computing (digital volunteers), a more comprehensive analysis can be performed.
Projects have been drawn from disciplines including astronomy (the Galaxy Zoo project), ecology, cell biology, humanities, and climate science. Galaxy Zoo enables users to participate in the analysis of imagery of hundreds of thousands of galaxies drawn from NASA’s Hubble Space Telescope archive and the Sloane Digital SkySurvey. It was started in 2007 by an Oxford University doctoral student, who decided to involve the community of amateur astronomers by using crowdsourcing. To understand how these galaxies formed, astronomers classify them according to their shapes. Humans are better at classifying shapes than even the most advanced computer. More than 320,000 people have now taken part in Galaxy Zoo, over 120 million classifications have been completed, and there are now more than 25 peer-reviewed publications based on data from Galaxy Zoo.Footnote 25
Disruptive Innovation
Defined by Clayton Christensen, disruptive innovation points to situations in which new organisations can use relatively simple, convenient, low cost innovations to create growth and successfully compete with incumbents. The theory holds that incumbent companies have a high probability of beating entrant firms when the contest is about sustaining innovations. However, established companies almost always lose to entrants armed with disruptive innovations.Footnote 26
Sustaining innovations are what move companies along established improvement trajectories. They are improvements to existing products or dimensions historically valued by customers. Airplanes that fly farther, computers that process faster and cellular phone batteries that last longer are all examples of sustaining innovations.
Disruptive innovations introduce a new value proposition. They either create new markets or reshape existing ones. Christensen defines two types of disruptive innovation:
-
1.
Low-end disruptive innovations can occur when existing products and services are “too good” and hence overpriced relative to the value existing customers can use. Nucor’s steel mini-mill, Wal-Mart’s discount retail store and Dell’s direct-to-customer business model were all low-end disruptive innovations.
-
2.
New-market disruptive innovations can occur when characteristics of existing products limit the number of potential consumers or force consumption to take place in inconvenient, centralised settings. The Sony transistor radio, Bell telephone, Apple PC and eBay online marketplace were all new-market disruptive innovations. They all created new growth by making it easier for people to do something that historically required deep expertise or significant wealth.
Cloud Computing
Cloud-delivered enterprise solutions fit Christensen’s concept of disruptive innovation. They offer cheaper, simpler and often more broadly applicable alternatives to legacy models of enterprise computing. They tend to start out as low-end disruptors, bringing cost and performance advantages to over-served customers, but as these technologies mature in their reliability and sophistication, they’re spreading throughout organisations and solving some of the most demanding problems.Footnote 27
In the 1990s, the enterprise software industry went through an upheaval as the client-server model displaced the mainframe. This new (and now old) standard represented large shift in value, because applications could now be much more powerful and modern using PC standards, data could mostly be centralised, and everything would run at a fraction of the cost compared to mainframes. Fast forward a decade and a half, and the same large-scale change has occurred yet again with most core applications being brought back to the web.
Distributing technology over the web offers current market leaders no intrinsic advantage that a start-up cannot access—that is, the web is served up democratically, whereas software in the past was usually delivered via partners or vendors with the most extensive salesforces. Cloud solutions generally embrace a world defined by collaboration, mobility, and openness. Many cloud solutions today are similarly disrupting incumbents by initially slipping into the “just good enough” category. Product roadmaps then become more comprehensive and customers are served in more meaningful ways.
Business Models in Cloud Computing
The following organisations are key players in the cloud computing market and in enabling a globally distributed applications infrastructure.
Microsoft Azure
Microsoft Azure delivers general purpose platform as a service (PaaS), which frees up developers to focus only on their applications and not the underlying infrastructure required. Having the IT infrastructure, hardware, operating systems and tools needed to support an application opens up possibilities for developers. The Microsoft hybrid cloud leverages both on-premises resources and the public cloud. Forty percent of Azure’s revenue comes from start-ups and independent software vendors (ISVs), and 50% of Fortune 500 companies use Windows Azure. Microsoft has invested $15 billion to build its cloud infrastructure, comprised of a large global portfolio of more than 100 datacentres, one million servers, content distribution networks, edge computing nodes, and fibre-optic networks.Footnote 28
Leveraging Microsoft’s significant investment in infrastructure and the Azure platform, NASA was able to more easily build and operate its new “Be a Martian” site—an educational game that invites visitors to help the space agency review thousands of images of Mars. Site visitors can pan, zoom and explore the planet through images from Mars landers, roving explorers and orbiting satellites dating from the 1960s to the present. In keeping with the rise of gamification, the site is also designed as a game with a twofold purpose: NASA and Microsoft hope it will spur interest in science and technology among students in the US and around the world. It is also a crowdsourcing tool designed to have site visitors help the space agency process large volumes of Mars images. Researchers at the NASA Jet Propulsion Laboratory (NASA/JPL) wanted to solve two different challenges—providing public access to vast amounts of Mars-related exploration images, and engaging the public in activities related to NASA’s Mars Exploration Programme. The sheer volume of information sent back by the rovers and orbiters is unmatched in the history of space exploration. Hundreds of thousands of detailed photographs are now stored in NASA databases, and new photos are transmitted every day.
We have so much data that it’s actually hard to process it all. (Dr. Jeff Norris (2010), NASA Jet Propulsion Laboratory)Footnote 29
The goal is to let the public participate in exploration, making contributions to data processing and analysis. It also provides a platform that lets developers collaborate with NASA on solutions that can help scientists analyse vast amounts of information to understand the universe and support future space exploration. The site was built using a variety of technologies, including the cloud-based Windows Azure platform, and Windows Azure Marketplace DataMarket—a service that lets developers and organisations create and consume applications and content on the Azure platform.
The ‘Be A Martian’ site has successfully demonstrated how Web technology can help an organisation engage with a large, dispersed group of users to view graphically rich content and participate in activities that involve massive amounts of data. Using the Azure DataMarket technology and leveraging Microsoft’s cloud capacity, NASA created its experimental “Pathfinder Innovation Contest”, which is designed to harness a global pool of programming and design talent to foster more citizen science contributions to Mars exploration.
Amazon Web Services (AWS)
Previously, large data sets such as the mapping of the human genome required hours or days to locate, download, customise, and analyse. Now, anyone can access these data sets and analyse them using, for example, Amazon Elastic Compute Cloud (EC2) instances. Amazon EC2 is a web service that provides resizable compute capacity in the cloud. It is designed to make web-scale cloud computing easier for developers. By hosting this important data where it can be quickly and easily processed with elastic computing resources, AWS wants to enable more innovation, at a faster pace.
AWS hosts a variety of public data sets that anyone can access for free. One example of these public data sets, NASA NEX (NASA Earth Exchange), is a collection of Earth science data sets maintained by NASA, including climate change projections and satellite images of the Earth’s surface. In 2013 NASA signed an agreement with AWS to deliver NASA NEX satellite data in order “to grow an ecosystem of researchers and developers”.Footnote 30 Previously, it had been logistically difficult for researchers to gain easy access to earth science data due to its dynamic nature and immense size (tens of terabytes). Limitations on download bandwidth, local storage, and on-premises processing power made in-house processing impractical. Through AWS, NASA is able to leverage the existing investment already made into the platform.
NASA NEX is a collaboration and analytical platform that combines state-of-the-art supercomputing, Earth system modelling, workflow management and NASA remote-sensing data. Through NEX, users can explore and analyse large Earth science data sets, run and share modelling algorithms, collaborate on new or existing projects and exchange workflows and results within and among other science communities. AWS is making the NASA NEX data available to the community free of charge.
We are excited to grow an ecosystem of researchers and developers who can help us solve important environmental research problems. Our goal is that people can easily gain access to and use a multitude of data analysis services quickly through AWS to add knowledge and open source tools for others’ benefit. Footnote 31 (Rama Nemani (2013), principal scientist for the NEX project at Ames)
Together, NASA and AWS are delivering faster time to science and taking the complexity out of accessing this important climate data. Footnote 32 (Jamie Kinney (2013), AWS senior manager for scientific computing)
Scientists, developers, and other technologists from many different industries are taking advantage of AWS to perform big data analytics and meet the challenges of the increasing volume, variety, and velocity of digital information.
Google Cloud Platform
Google’s Cloud Platform is a set of modular cloud-based services that allow the user to create anything from simple websites to complex applications. Google’s vast physical infrastructure enables it to build, organise, and operate a large network of servers and fibre-optic cables. Developers are therefore building on the same infrastructure that allows Google to return billions of search results in milliseconds. Google integrates with familiar development tools and provides API client libraries. Using Google’s existing APIs and services can quickly enable a wide range of functionality for a developer’s application, including the geo-services application, Google Maps.
Geo-services global revenues, made up of satellite navigation, satellite imagery, electronic maps and location-based search, are estimated at €125 billion–€225 billion per year.Footnote 33 There is therefore an increasing number of software developers offering location-based services (LBS) to consumers. Google Maps APIs give developers several ways of embedding Google Maps into web pages, and allows for either simple use or extensive customisation. When Google Maps was introduced, a programmer named Paul Rademacher introduced the first Google Maps mash-up (using content for an application from more than one source), HousingMaps.com, taking data from another Internet site, Craigslist.org, and creating an application that put Craigslist apartment and home listings onto a Google Map. Google hired Rademacher, and soon offered an API that made it easier for anyone to do what he did. Competitors, who had mapping APIs but locked them up behind tightly controlled corporate developer programmes, failed to seize the opportunity. Before long Google Maps had become an integral part of every web developer’s toolkit. This is unlikely to have been possible without the existing investment in cloud infrastructure and systems underlying the application. Today, Google Maps accounts for nearly 90% of all mapping mash-ups, versus only a few percent each for MapQuest, Yahoo! and Microsoft, even though these companies had a head start in web mapping.Footnote 34
Conclusion
Increasing value is created as data progresses through the value chain. Government agencies are working with private industry to stimulate innovative applications from the data. More data is being generated than ever before through the Internet of Things, information layers and diversified sources. An increased number of public and private (including new commercial players) EO satellite missions are contributing to an upsurge in EO data captured, with the intention of distributing this data to enable the creation of innovative applications. The cloud computing revolution continues to put downward pressure on the cost of processing big data, enabling larger datasets to be used. Turning the raw data into knowledge and actionable insights is where value is created. APIs, algorithms and open thematic platforms aim to extract value from raw data and turn pixels into insights. Democratising data use will engage a wider user community, therefore increasing the likelihood of stimulating new, disruptive innovations. To unlock the economic potential of this data, agencies are creating products that are responsive to user needs and implementing free and open data policies, including ESA’s Copernicus Programme.
Notes
- 1.
CDNs: a content delivery network or content distribution network (CDN) is a large distributed system of servers deployed in multiple data centres across the Internet. The goal of a CDN is to serve content to end-users with high availability and high performance. Examples include Microsoft Azure and Amazon CloudFront.
- 2.
Oracle (2014) Data-as-a-service: the Next Step in the As-a-service Journey, see www.oracle.com/us/solutions/cloud/analyst-report-ovum-daas-2245256.pdf retrieved on 2nd March 2015.
- 3.
IBM (2013) Global Technology Outlook.
- 4.
The Economist (2013) A new goldmine; Open data, see www.economist.com/news/business/21578084-making-official-data-public-could-spur-lots-innovation-new-goldmine retrieved on 8th February 2015.
- 5.
Ibid.
- 6.
Ibid.
- 7.
McKinsey Global Institute (2011) Big data: The next frontier for innovation, competition, and productivity.
- 8.
Lathrup, D. and Ruma, L. (2010) Open Government: Collaboration, Transparency, and Participation in Practice , O’Reilly Media.
- 9.
Ibid.
- 10.
Business Insider website, see www.businessinsider.com/iphone-v-android-market-share-2014-5?IR=T retrieved on 3rd March 2015.
- 11.
Dave McCrory (2011), Gathering Moss, Data Gravity, and Context, see www.datagravity.org retrieved on 17th March 2015.
- 12.
Apple (2015) see www.apple.com/pr/library/2015/01/08App-Store-Rings-in-2015-with-New-Records.html retrieved on 19th January 2015.
- 13.
Planet Labs website, see www.planet.com/flock1/ retrieved on 29th January 2015.
- 14.
Henry, C. (2014) CloudEO Starts ‘Virtual Constellation’ Access with Beta Online Marketplace, see www.satellitetoday.com/technology/2014/03/26/cloudeo-starts-virtual-constellation-access-with-beta-online-marketplace/ retrieved on 28th January 2015.
- 15.
M. Kazmierski et al (2014) GEOSUD SDI: accessing Earth Observation data collections with semantic-based services, see www.agile-online.org/Conference_Paper/cds/agile_2014/agile2014_138.pdf retrieved on 19th January 2015.
- 16.
Northern Sky Research (2013) Satellite-Based Earth Observation, 5th Edition.
- 17.
UrtheCast (2013), see www.investors.urthecast.com/interactive/lookandfeel/4388192/UrtheCast-Investor-Deck.pdf retrieved on 29th January 2015.
- 18.
IAC (2014) UrtheCast is #DisruptiveTech, Onwards and Upwards Blog, see www.blog.nicholaskellett.com/2014/10/03/iac-2014-urthecast-is-disruptivetech/ retrieved on 19th January 2015.
- 19.
UstreamTV (2012) UrtheCast Business Model, see www.ustream.tv/recorded/26973814 retrieved on 19th January 2015.
- 20.
Cisco (2011) The Internet of Things: How the Next Evolution of the Internet Is Changing Everything.
- 21.
Financial Times (2014) The Connected Business, see www.im.ft-static.com/content/images/705127d0-58b7-11e4-942f-00144feab7de.pdf retrieved on 21st November 2014.
- 22.
Financial Times (2014) The Connected Business, see www.im.ft-static.com/content/images/705127d0-58b7-11e4-942f-00144feab7de.pdf retrieved on 21st November 2014.
- 23.
ABI/INFORM Global (2013) JAPAN: Toyota to launch Big Data Traffic Information Service.
- 24.
The Royal Society (2012) Science as an Open Enterprise, The Royal Society Science Policy Centre report.
- 25.
Wikipedia, see www.en.wikipedia.org/wiki/Zooniverse_%28citizen_science_project%29 retrieved on 18th January 2015.
- 26.
Christensen et al (2004) Seeing what’s next: using the theories of innovation to predict industry change, Harvard Business School Press.
- 27.
Fortune (2011) see www.fortune.com/2011/09/27/is-the-cloud-the-ultimate-disruptive-innovation/ retrieved on 20th January 2015.
- 28.
Microsoft website see www.news.microsoft.com/cloud/index.html retrieved on 3rd March 2015.
- 29.
Microsoft (2010) see www.microsoft.com/casestudies/Microsoft-Azure/Naspers-Pty-Ltd/New-NASA-Web-Site-Engages-Citizens-to-Help-Explore-Mars/4000008289 retrieved on 19th January 2015.
- 30.
NASA (2013) see www.nasa.gov/press/2013/november/nasa-brings-earth-science-big-data-to-the-cloud-with-amazon-web-services/#.VLK4KCusWSo retrieved on 19th January 2015.
- 31.
Ibid.
- 32.
Ibid.
- 33.
Oxera (2013) What is the economic impact of Geo-services, prepared for Google.
- 34.
Lathrup, D. and Ruma, L. (2010) Open Government: Collaboration, Transparency, and Participation in Practice , O’Reilly Media.
References
Council of the European Union (2015) Draft council conclusions on single market policy. Council of the European Union, Brussels
Meglio D et al (2014) CERN openlab whitepaper on future IT challenges in scientific research. Zenodo, Geneva
Digital Catapult (2014). https://digital.catapult.org.uk/. Accessed 2015
EARSC (2015) A survey into the state and health of the European EO services industry. EARSC, Brussels
Financial Times (2015). www.ft.com/cms/s/0/7805f624-a08b-11e4-8ad8-00144feab7de.html? siteedition=uk#axzz3PRjcpl00. Accessed 2015
The Economist (2013) A new goldmine; open data. www.economist.com/news/business/21578084-making-official-data-public-could-spur-lots-innovation-new-goldmine. Accessed 8 Feb 2015
Woodside Capital Partners (2014) OpenStack: is this the future of cloud computing? www.woodsidecap.com/wp-content/uploads/2014/11/WCP-OpenStack-Report_FINALa.pdf. Accessed 21 Nov 2014
Author information
Authors and Affiliations
Corresponding author
Editor information
Editors and Affiliations
Rights and permissions
<SimplePara><Emphasis Type="Bold">Open Access</Emphasis> This chapter is licensed under the terms of the Creative Commons Attribution 4.0 International License (http://creativecommons.org/licenses/by/4.0/), which permits use, sharing, adaptation, distribution and reproduction in any medium or format, as long as you give appropriate credit to the original author(s) and the source, provide a link to the Creative Commons license and indicate if changes were made.</SimplePara> <SimplePara>The images or other third party material in this chapter are included in the chapter's Creative Commons license, unless indicated otherwise in a credit line to the material. If material is not included in the chapter's Creative Commons license and your intended use is not permitted by statutory regulation or exceeds the permitted use, you will need to obtain permission directly from the copyright holder.</SimplePara>
Copyright information
© 2018 The Author(s)
About this chapter

Cite this chapter
O’Sullivan, C., Wise, N., Mathieu, PP. (2018). The Changing Landscape of Geospatial Information Markets. In: Mathieu, PP., Aubrecht, C. (eds) Earth Observation Open Science and Innovation. ISSI Scientific Report Series, vol 15. Springer, Cham. https://doi.org/10.1007/978-3-319-65633-5_1
Download citation
DOI: https://doi.org/10.1007/978-3-319-65633-5_1
Published:
Publisher Name: Springer, Cham
Print ISBN: 978-3-319-65632-8
Online ISBN: 978-3-319-65633-5
eBook Packages: Physics and AstronomyPhysics and Astronomy (R0)