
Abstract
In this chapter, we go through the fundamentals of artificial neural networks and deep learning methods. We describe the inspiration for artificial neural networks and how the methods of deep learning are built. We define the activation function and its role in capturing nonlinear patterns in the input data. We explain the universal approximation theorem for understanding the power and limitation of these methods and describe the main topologies of artificial neural networks that play an important role in the successful implementation of these methods. We also describe loss functions (and their penalized versions) and give details about in which circumstances each of them should be used or preferred. In addition to the Ridge, Lasso, and Elastic Net regularization methods, we provide details of the dropout and the early stopping methods. Finally, we provide the backpropagation method and illustrate it with two simple artificial neural networks.
You have full access to this open access chapter, Download chapter PDF
Keywords
10.1 The Inspiration for the Neural Network Model
The inspiration for artificial neural networks (ANN), or simply neural networks, resulted from the admiration for how the human brain computes complex processes, which is entirely different from the way conventional digital computers do this. The power of the human brain is superior to many information-processing systems, since it can perform highly complex, nonlinear, and parallel processing by organizing its structural constituents (neurons) to perform such tasks as accurate predictions, pattern recognition, perception, motor control, etc. It is also many times faster than the fastest digital computer in existence today. An example is the sophisticated functioning of the information-processing task called human vision. This system helps us to understand and capture the key components of the environment and supplies us with the information we need to interact with the environment. That is, the brain very often performs perceptual recognition tasks (e.g., voice recognition embedded in a complex scene) in around 100–200 ms, whereas less complex tasks many times take longer even on a powerful computer (Haykin 2009).
Another interesting example is the sonar of a bat, since the sonar is an active echolocation system. The sonar provides information not only about how far away the target is located but also about the relative velocity of the target, its size, and the size of various features of the target, including its azimuth and elevation. Within a brain the size of a plum occur the computations required to extract all this information from the target echo. Also, it is documented that an echolocating bat has a high rate of success when pursuing and capturing its target and, for this reason, is the envy of radar and sonar engineers (Haykin 2009). This bat capacity inspired the development of radar, which is able to detect objects that are in its path, without needing to see them, thanks to the emission of an ultrasonic wave, the subsequent reception and processing of the echo, which allows it to detect obstacles in its flight with surprising speed and accuracy (Francisco-Caicedo and López-Sotelo 2009).
In general, the functioning of the brains of humans and other animals is intriguing because they are able to perform very complex tasks in a very short time and with high efficiency. For example, signals from sensors in the body convey information related to sight, hearing, taste, smell, touch, balance, temperature, pain, etc. Then the brain’s neurons, which are autonomous units, transmit, process, and store this information so that we can respond successfully to external and internal stimuli (Dougherty 2013). The neurons of many animals transmit spikes of electrical activity through a long, thin strand called an axon. An axon is divided into thousands of terminals or branches, where depending on the size of the signal they synapse to dendrites of other neurons (Fig. 10.1). It is estimated that the brain is composed of around 1011 neurons that work in parallel, since the processing done by the neurons and the memory captured by the synapses are distributed together over the network. The amount of information processed and stored depends on the threshold firing levels and also on the weight given by each neuron to each of its inputs (Dougherty 2013).

A graphic representation of a biological neuron
One of the characteristics of biological neurons, to which they owe their great capacity to process and perform highly complex tasks, is that they are highly connected to other neurons from which they receive stimuli from an event as it occurs, or hundreds of electrical signals with the information learned. When it reaches the body of the neuron, this information affects its behavior and can also affect a neighboring neuron or muscle (Francisco-Caicedo and López-Sotelo 2009). Francisco-Caicedo and López-Sotelo (2009) also point out that the communication between neurons goes through the so-called synapses. A synapse is a space that is occupied by chemicals called neurotransmitters. These neurotransmitters are responsible for blocking or passing on signals that come from other neurons. The neurons receive electrical signals from other neurons with which they are in contact. These signals accumulate in the body of the neuron and determine what to do. If the total electrical signal received by the neuron is sufficiently large, the action potential can be overcome, which allows the neuron to be activated or, on the contrary, to remain inactive. When a neuron is activated, it is able to transmit an electrical impulse to the neurons with which it is in contact. This new impulse, for example, acts as an input to other neurons or as a stimulus in some muscles (Francisco-Caicedo and López-Sotelo 2009). The architecture of biological neural networks is still the subject of active research, but some parts of the brain have been mapped, and it seems that neurons are often organized in consecutive layers, as shown in Fig. 10.2.
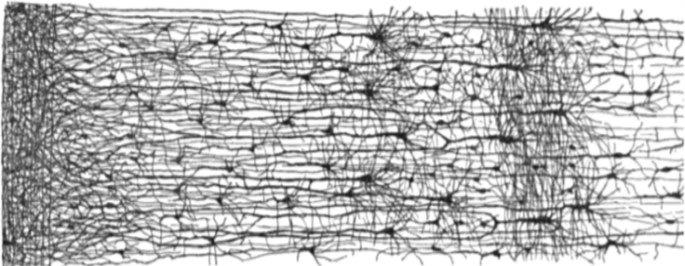
Multiple layers in a biological neural network of human cortex
ANN are machines designed to perform specific tasks by imitating how the human brain works, and build a neural network made up of hundreds or even thousands of artificial neurons or processing units. The artificial neural network is implemented by developing a computational learning algorithm that does not need to program all the rules since it is able to build up its own rules of behavior through what we usually refer to as “experience.” The practical implementation of neural networks is possible due to the fact that they are massively parallel computing systems made up of a huge number of basic processing units (neurons) that are interconnected and learn from their environment, and the synaptic weights capture and store the strengths of the interconnected neurons. The job of the learning algorithm consists of modifying the synaptic weights of the network in a sequential and supervised way to reach a specific objective (Haykin 2009). There is evidence that neurons working together are able to learn complex linear and nonlinear input–output relationships by using sequential training procedures. It is important to point out that even though the inspiration for these models was quite different from what inspired statistical models, the building blocks of both types of models are quite similar. Anderson et al. (1990) and Ripley (1993) pointed out that neural networks are simply no more than generalized nonlinear statistical models. However, Anderson et al. (1990) were more expressive in this sense and also pointed out that “ANN are statistics for amateurs since most neural networks conceal the statistics from the user.”
10.2 The Building Blocks of Artificial Neural Networks
To get a clear idea of the main elements used to construct ANN models, in Fig. 10.3 we provide a general artificial neural network model that contains the main components for this type of models.

General artificial neural network model
x1, …, xp represents the information (input) that the neuron receives from the external sensory system or from other neurons with which it has a connection. w = (w1, …, wp) is the vector of synaptic weights that modifies the received information emulating the synapse between the biological neurons. These can be interpreted as gains that can attenuate or amplify the values that they wish to propagate toward the neuron. Parameter bj is known as the bias (intercept or threshold) of a neuron. Here in ANN, learning refers to the method of modifying the weights of connections between the nodes (neurons) of a specified network.
The different values that the neuron receives are modified by the synaptic weights, which then are added together to produce what is called the net input. In mathematical notation, that is equal to
This net input (vj) is what determines whether the neuron is activated or not. The activation of the neuron depends on what we call the activation function . The net input is evaluated in this function and we obtain the output of the network as shown next:
where g is the activation function. For example, if we define this function as a unit step (also called threshold), the output will be 1 if the net input is greater than zero; otherwise the output will be 0. Although there is no biological behavior indicating the presence of something similar to the neurons of the brain, the use of the activation function is an artifice that allows applying ANN to a great diversity of real problems. According to what has been mentioned, output yj of the neuron is generated when evaluating the net input (vj) in the activation function. We can propagate the output of the neuron to other neurons or it can be the output of the network, which, according to the application, will have an interpretation for the user. In general, the job of an artificial neural network model is done by simple elements called neurons. The signals are passed between neurons through connection links. Each connection link has an associated weight, which, in a typical neuronal network, multiplies the transmitted signal. Each neuron applies an activation function (usually nonlinear) to the network inputs (sum of the heavy input signals) for determining its corresponding sign. Later in this chapter, we describe the many options for activation functions and the context in which they can be used.
A unilayer ANN like that in Fig. 10.3 has a low processing capacity by itself and its level of applicability is low; its true power lies in the interconnection of many ANNs, as happens in the human brain. This has motivated different researchers to propose various topologies (architectures) to connect neurons to each other in the context of ANN. Next, we provide two definitions of ANN and one definition of deep learning:
Definition 1. An artificial neural network is a system composed of many simple elements of processing which operate in parallel and whose function is determined by the structure of the network and the weight of connections, where the processing is done in each of the nodes or computing elements that has a low processing capacity (Francisco-Caicedo and López-Sotelo 2009).
Definition 2. An artificial neural network is a structure containing simple elements that are interconnected in many ways with hierarchical organization, which tries to interact with objects in the real world in the same way as the biological nervous system does (Kohonen 2000).
Deep learning model. We define deep learning as a generalization of ANN where more than one hidden layer is used, which implies that more neurons are used for implementing the model. For this reason, an artificial neural network with multiple hidden layers is called a Deep Neural Network (DNN) and the practice of training this type of networks is called deep learning (DL), which is a branch of statistical machine learning where a multilayered (deep) topology is used to map the relations between input variables (independent variables) and the response variable (outcome). Chollet and Allaire (2017) point out that DL puts the “emphasis on learning successive layers of increasingly meaningful representations.” The adjective “deep” applies not to the acquired knowledge, but to the way in which the knowledge is acquired (Lewis 2016), since it stands for the idea of successive layers of representations. The “deep” of the model refers to the number of layers that contribute to the model. For this reason, this field is also called layered representation learning and hierarchical representation learning (Chollet and Allaire 2017).
It is important to point out that DL as a subset of machine learning is an aspect of artificial intelligence (AI) that has more complex ways of connecting layers than conventional ANN, which uses more neurons than previous networks to capture nonlinear aspects of complex data better, but at the cost of more computing power required to automatically extract useful knowledge from complex data.
To have a more complete picture of ANN, we provide another model, which is a DL model since it has two hidden layers, as shown in Fig. 10.4.
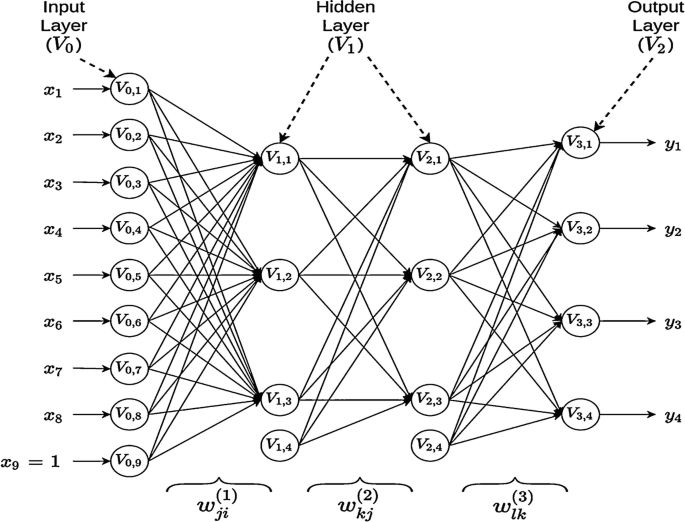
Artificial deep neural network with a feedforward neural network with eight input variables (x1, … ,x8), four output variables (y1, y2, y3, y4), and two hidden layers with three neurons each
From Fig. 10.4 we can see that an artificial neural network is a directed graph whose nodes correspond to neurons and whose edges correspond to links between them. Each neuron receives, as input, a weighted sum of the outputs of the neurons connected to its incoming edges (Shalev-Shwartz and Ben-David 2014). In the artificial deep neural network given in Fig. 10.4, there are four layers (V0, V1, V2, and V3): V0 represents the input layer, V1 and V2 are the hidden layers, and V3 denotes the output layer. In this artificial deep neural network, three is the number of layers of the network since V0, which contains the input information, is excluded. This is also called the “depth” of the network. The size of this network is \( \left|V\right|=\left|\bigcup \limits_{t=0}^{\mathrm{T}}{V}_t\right|=\left|9+4+4+4\right|=21 \). Note that in each layer we added +1 to the observed units to represent the node of the bias (or intercept). The width of the network is max|Vt| = 9.
The analytical form of the model given in Fig. 10.4 for output o, with d inputs, M1 hidden neurons (units) in hidden layer 1, M2 hidden units in hidden layer 2, and O output neurons is given by the following (10.1)–(10.3):
where (10.1) produces the output of each of the neurons in the first hidden layer, (10.2) produces the output of each of the neurons in the second hidden layer, and finally (10.3) produces the output of each response variable of interest. The learning process is obtained with the weights (\( {w}_{ji}^{(1)},{w}_{kj}^{(2)}, \)and \( {w}_{lk}^{(3)}\Big) \), which are accommodated in the following vector: \( \boldsymbol{w}=\left({w}_{11}^{(1)},{w}_{12}^{(1)},\dots, {w}_{1d}^{(1)},{w}_{21}^{(2)},{w}_{22}^{(2)},\dots, {w}_{2{M}_1}^{(2)},{w}_{31}^{(3)},{w}_{32}^{(3)},\dots, {w}_{3{M}_2}^{(3)}\right), \) g1, g2, and g3 are the activation functions in hidden layers 1, 2, and the output layer, respectively.
The model given in Fig. 10.4 is organized as several interconnected layers: the input layer, hidden layers, and output layer, where each layer that performs nonlinear transformations is a collection of artificial neurons, and connections among these layers are made using weights (Fig. 10.4). When only one output variable is present in Fig. 10.4, the model is called univariate DL model. Also, when only one hidden layer is present in Fig. 10.4, the DL model is reduced to a conventional artificial neural network model, but when more than one hidden layer is included, it is possible to better capture complex interactions, nonlinearities, and nonadditive effects. To better understand the elements of the model depicted in Fig. 10.4, it is important to distinguish between the types of layers and the types of neurons; for this reason, next we will explain the type of layers and then the type of neurons in more detail.
-
(a)
Input layer: It is the set of neurons that directly receives the information coming from the external sources of the network. In the context of Fig. 10.4, this information is x1, … ,x8 (Francisco-Caicedo and López-Sotelo 2009). Therefore, the number of neurons in an input layer is most of the time the same as the number of the input explanatory variables provided to the network. Usually input layers are followed by at least one hidden layer. Only in feedforward neuronal networks, input layers are fully connected to the next hidden layer (Patterson and Gibson 2017).
-
(b)
Hidden layers: Consist of a set of internal neurons of the network that do not have direct contact with the outside. The number of hidden layers can be 0, 1, or more. In general, the neurons of each hidden layer share the same type of information; for this reason, they are called hidden layers. The neurons of the hidden layers can be interconnected in different ways; this determines, together with their number, the different topologies of ANN and DNN (Francisco-Caicedo and López-Sotelo 2009). The learned information extracted from the training data is stored and captured by the weight values of the connections between the layers of the artificial neural network. Also, it is important to point out that hidden layers are key components for capturing complex nonlinear behaviors of data more efficiently (Patterson and Gibson 2017).
-
(c)
Output layer: It is a set of neurons that transfers the information that the network has processed to the outside (Francisco-Caicedo and López-Sotelo 2009). In Fig. 10.4 the output neurons correspond to the output variables y1, y2, y3, and y4. This means that the output layer gives the answer or prediction of the artificial neural network model based on the input from the input layer. The final output can be continuous, binary, ordinal, or count depending on the setup of the ANN which is controlled by the activation (or inverse link in the statistical domain) function we specified on the neurons in the output layer (Patterson and Gibson 2017).
Next, we define the types of neurons: (1) input neuron . A neuron that receives external inputs from outside the network; (2) output neuron . A neuron that produces some of the outputs of the network; and (3) hidden neuron . A neuron that has no direct interaction with the “outside world” but only with other neurons within the network. Similar terminology is used at the layer level for multilayer neural networks .
As can be seen in Fig. 10.4, the distribution of neurons within an artificial neural network is done by forming levels of a certain number of neurons. If a set of artificial neurons simultaneously receives the same type of information, we call it a layer. We also described a network of three types of levels called layers. Figure 10.5 shows another six networks with different numbers of layers, and half of them (Fig. 10.5a, c, e) are univariate since the response variable we wish to predict is only one, while the other half (Fig. 10.5b, d, f) are multivariate since the interest of the network is to predict two outputs. It is important to point out that subpanels a and b in Fig. 10.5 are networks with only one layer and without hidden layers; for this reason, this type of networks corresponds to conventional regression or classification regression models.
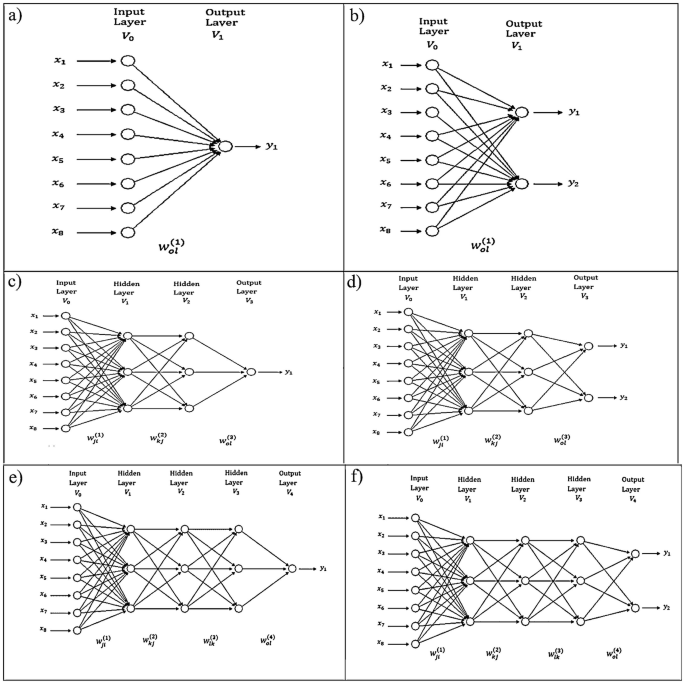
Different feedforward topologies with univariate and multivariate outputs and different number of layers. (a) Unilayer and univariate output. (b) Unilayer and multivariate output. (c) Three layer and univariate output. (d) Three layer and multivariate output. (e) Four layer univariate output. (f) Four layer multivariate output
Therefore, the topology of an artificial neural network is the way in which neurons are organized inside the network; it is closely linked to the learning algorithm used to train the network. Depending on the number of layers, we define the networks as monolayer and multilayer; and if we take as a classification element the way information flows, we define the networks as feedforward or recurrent. Each type of topology will be described in another section.
In summary, an artificial (deep) neural network model is an information processing system that mimics the behavior of biological neural networks, which was developed as a generalization of mathematical models of human knowledge or neuronal biology.
10.3 Activation Functions
The mapping between inputs and a hidden layer in ANN and DNN is determined by activation functions. Activation functions propagate the output of one layer’s nodes forward to the next layer (up to and including the output layer). Activation functions are scalar-to-scalar functions that provide a specific output of the neuron. Activation functions allow nonlinearities to be introduced into the network’s modeling capabilities (Wiley 2016). The activation function of a neuron (node) defines the functional form for how a neuron gets activated. For example, if we define a linear activation function as g(z) = z, in this case the value of the neuron would be the raw input, x, times the learned weight, that is, a linear model. Next, we describe the most popular activation functions.
10.3.1 Linear
Figure 10.6 shows a linear activation function that is basically the identity function. It is defined as g(z) = Wz, where the dependent variable has a direct, proportional relationship with the independent variable. In practical terms, it means the function passes the signal through unchanged. The problem with making activation functions linear is that this does not permit any nonlinear functional forms to be learned (Patterson and Gibson 2017).

Representation of a linear activation function
10.3.2 Rectifier Linear Unit (ReLU)
The rectifier linear unit (ReLU) activation function is one of the most popular. The ReLU activation function is flat below some threshold (usually the threshold is zero) and then linear. The ReLU activates a node only if the input is above a certain quantity. When the input is below zero, the output is zero, but when the input rises above a certain threshold, it has a linear relationship with the dependent variable g(z) = max (0, z), as demonstrated in Fig. 10.7. Despite its simplicity, the ReLU activation function provides nonlinear transformation, and enough linear rectifiers can be used to approximate arbitrary nonlinear functions, unlike when only linear activation functions are used (Patterson and Gibson 2017). ReLUs are the current state of the art because they have proven to work in many different situations. Because the gradient of a ReLU is either zero or a constant, it is not easy to control the vanishing exploding gradient issue, also known as the “dying ReLU” issue. ReLU activation functions have been shown to train better in practice than sigmoid activation functions. This activation function is the most used in hidden layers and in output layers when the response variable is continuous and larger than zero.

Representation of the ReLU activation function
10.3.3 Leaky ReLU
Leaky ReLUs are a strategy to mitigate the “dying ReLU” issue. As opposed to having the function be zero when z < 0, the leaky ReLU will instead have a small negative slope, α,where α is a value between 0 and 1 (Fig. 10.8). In practice, some success has been achieved with this ReLU variation, but results are not always consistent. The function of this activation function is given here:

Representation of the Leaky ReLU activation function with α = 0.1
10.3.4 Sigmoid
A sigmoid activation function is a machine that converts independent variables of near infinite range into simple probabilities between 0 and 1, and most of its output will be very close to 0 or 1. Like all logistic transformations, sigmoids can reduce extreme values or outliers in data without removing them. This activation function resembles an S (Wiley 2016; Patterson and Gibson 2017) and is defined as g(z) = (1 + e−z)−1. This activation function is one of the most common types of activation functions used to construct ANNs and DNNs, where the outcome is a probability or binary outcome. This activation function is a strictly increasing function that exhibits a graceful balance between linear and nonlinear behavior but has the propensity to get “stuck,” i.e., the output values would be very close to 1 or 0 when the input values are strongly positive or negative (Fig. 10.9). By getting “stuck” we mean that the learning process is not improving due to the large or small values of the output values of this activation function.

Representation of the sigmoid activation function
10.3.5 Softmax
Softmax is a generalization of the sigmoid activation function that handles multinomial labeling systems, that is, it is appropriate for categorical outcomes. Softmax is the function you will often find in the output layer of a classifier with more than two categories. The softmax activation function returns the probability distribution over mutually exclusive output classes. To further illustrate the idea of the softmax output layer and how to use it, let’s consider two types of uses. If we have a multiclass modeling problem we only care about the best score across these classes, we’d use a softmax output layer with an argmax() function to get the highest score across all classes. For example, let us assume that our categorical response has ten classes; with this activation function we calculate a probability for each category (the sum of the ten categories is one) and we classify a particular individual in the class with the largest probability. It is important to recall that if we want to get binary classifications per output (e.g., “diseased and not diseased”), we do not want softmax as an output layer. Instead, we will use the sigmoid activation function explained before. The softmax function is defined as
This activation function is a generalization of the sigmoid activation function that squeezes (force) a C dimensional vector of arbitrary real values to a C dimensional vector of real values in the range [0,1] that adds up to 1. A strong prediction would have a single entry in the vector close to 1, while the remaining entries would be close to 0. A weak prediction would have multiple possible categories (labels) that are more or less equally likely. The sigmoid and softmax activation functions are suitable for probabilistic interpretation due to the fact that the output is a probabilistic distribution of the classes. This activation function is mostly recommended for output layers when the response variable is categorical.
10.3.6 Tanh
The hyperbolic tangent (Tanh) activation function is defined as \( \tanh \left(\mathrm{z}\right)=\sinh \left(\mathrm{z}\right)/\cosh \left(\mathrm{z}\right)=\frac{\exp (z)-\exp \left(-z\right)}{\exp (z)+\exp \left(-z\right)} \). The hyperbolic tangent works well in some cases and, like the sigmoid activation function, has a sigmoidal (“S” shaped) output, with the advantage that it is less likely to get “stuck” than the sigmoid activation function since its output values are between −1 and 1, as shown in Fig. 10.10. For this reason, for hidden layers should be preferred the Tanh activation function. Large negative inputs to the tanh function will give negative outputs, while large positive inputs will give positive outputs (Patterson and Gibson 2017). The advantage of tanh is that it can deal more easily with negative numbers.

Representation of the tanh activation function
It is important to point out that there are more activations functions like the threshold activation function introduced in the pioneering work on ANN by McCulloch and Pitts (1943), but the ones just mentioned are some of the most used.
10.4 The Universal Approximation Theorem
The universal approximation theorem is at the heart of ANN since it provides the mathematical basis of why artificial neural networks work in practice for nonlinear input–output mapping. According to Haykin (2009), this theorem can be stated as follows.
Let g() be a bounded, and monotone-increasing continuous function. Let \( {I}_{m_0} \) denote the m0-dimensional unit hypercube \( {\left[0,1\right]}^{m_0} \). The space of continuous functions on \( {I}_{m_0} \) is denoted by \( C\left({I}_{m_0}\right) \). Then given any function \( f\ni C\left({I}_{m_0}\right) \) and ε > 0, there is an integer m1 and sets of real constants αi, bi, and wij, where i = 1,…, m1 and j = 1,…, m0 such that we may define
as an approximate realization of function f(·); that is,
For all \( {x}_1,\dots, {x}_{m_0} \) that lie in the input space.
m0 represents the input nodes of a multilayer perceptron with a single hidden layer. m1 is the number of neurons in the single hidden layer, \( {x}_1,\dots, {x}_{m_0} \) are the inputs, wij denotes the weight of neuron i in input j, bi denotes the bias corresponding to neuron i, and αi is the weight of the output layer in neuron i.
This theorem states that any feedforward neural network containing a finite number of neurons is capable of approximating any continuous functions of arbitrary complexity to arbitrary accuracy, if provided enough neurons in even a single hidden layer, under mild assumptions of the activation function. In other words, this theorem says that any continuous function that maps intervals of real numbers to some output interval of real numbers can be approximated arbitrarily and closely by a multilayer perceptron with just one hidden layer and a finite very large number of neurons (Cybenko 1989; Hornik 1991). However, this theorem only guarantees a reasonable approximation; for this reason, this theorem is an existence theorem. This implies that simple ANNs are able to represent a wide variety of interesting functions if given enough neurons and appropriate parameters; but nothing is mentioned about the algorithmic learnability of those parameters, nor about their time of learning, ease of implementation, generalization, or that a single hidden layer is optimum. The first version of this theorem was given by Cybenko (1989) for sigmoid activation functions. Two years later, Hornik (1991) pointed out that the potential of “ANN of being universal approximators is not due to the specific choice of the activation function, but to the multilayer feedforward architecture itself.”
From this theorem, we can deduce that when an artificial neural network has more than two hidden layers, it will not always improve the prediction performance since there is a higher risk of converging to a local minimum. However, using two hidden layers is recommended when the data has discontinuities. Although the proof of this theorem was done for only a single output, it is also valid for the multi-output scenario and can easily be deduced from the single output case. It is important to point out that this theorem states that all activation functions will perform equally well in specific learning problems since their performance depends on the data and additional issues such as minimal redundancy, computational efficiency, etc.
10.5 Artificial Neural Network Topologies
In this subsection, we describe the most popular network topologies. An artificial neural network topology represents the way in which neurons are connected to form a network. In other words, the neural network topology can be seen as the relationship between the neurons by means of their connections. The topology of a neural network plays a fundamental role in its functionality and performance, as illustrated throughout this chapter. The generic terms structure and architecture are used as synonyms for network topology. However, caution should be exercised when using these terms since their meaning is not well defined and causes confusion in other domains where the same terms are used for other purposes.
More precisely, the topology of a neural network consists of its frame or framework of neurons, together with its interconnection structure or connectivity:
The next two subsections are devoted to these two components.
Artificial neural framework
Most neural networks, including many biological ones, have a layered topology. There are a few exceptions where the network is not explicitly layered, but those can usually be interpreted as having a layered topology, for example, in some associative memory networks, which can be seen as one-layer neural networks where all neurons function both as input and output units. At the framework level, neurons are considered abstract entities, therefore possible differences between them are not considered. The framework of an artificial neural network can therefore be described by the number of neurons, number of layers (denoted by L), and the size of the layer, which consists of the number of neurons in each of the layers.
Interconnection structure
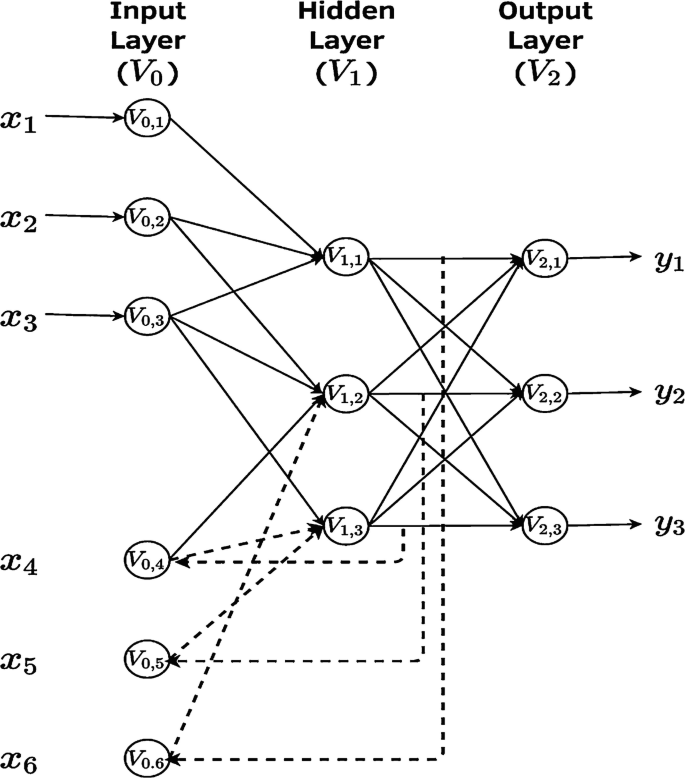
The interconnection structure of an artificial neural network determines the way in which the neurons are linked. Based on a layered structure, several different kinds of connections can be distinguished (see Fig. 10.11): (a) Interlayer connection : This connects neurons in adjacent layers whose layer indices differ by one; (b) Intralayer connection : This is a connection between neurons in the same layer; (c) Self-connection : This is a special kind of intralayer connection that connects a neuron to itself; (d) Supralayer connection : This is a connection between neurons that are in distinct nonadjacent layers; in other words, these connections “cross” or “jump” at least one hidden layer.
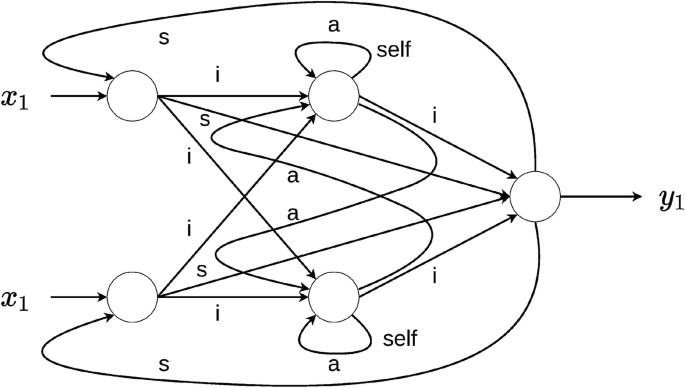
Network topology with two layers. (i) denotes the six interlayer connections, (s) denotes the four supralayered connections, and (a) denotes four intralayer connections of which two are self-connections
With each connection (interconnection), a weight (strength) is associated which is a weighting factor that reflects its importance. This weight is a scalar value (a number), which can be positive (excitatory) or negative (inhibitory). If a connection has zero weight, it is considered to be nonexistent at that point in time.
Note that the basic concept of layeredness is based on the presence of interlayer connections. In other words, every layered neural network has at least one interlayer connection between adjacent layers. If interlayer connections are absent between any two adjacent clusters in the network, a spatial reordering can be applied to the topology, after which certain connections become the interlayer connections of the transformed, layered network.
Now that we have described the two key components of an artificial neural network topology, we will present two of the most commonly used topologies.
Feedforward network
In this type of artificial neural network, the information flows in a single direction from the input neurons to the processing layer or layers (only interlayer connections) for monolayer and multilayer networks, respectively, until reaching the output layer of the neural network. This means that there are no connections between neurons in the same layer (no intralayer), and there are no connections that transmit data from a higher layer to a lower layer, that is, no supralayer connections (Fig. 10.12). This type of network is simple to analyze, but is not restricted to only one hidden layer.
A simple two-layer feedforward artificial neural network
Recurrent networks
In this type of neural network, information does not always flow in one direction, since it can feed back into previous layers through synaptic connections. This type of neural network can be monolayer or multilayer. In this network, all the neurons have (1) incoming connections emanating from all the neurons in the previous layer, (2) ongoing connections leading to all the neurons in the subsequent layer, and (3) recurrent connections that propagate information between neurons of the same layer. Recurrent neural networks (RNNs) are different from a feedforward neural network in that they have at least one feedback loop since the signals travel in both directions. This type of network is frequently used in time series prediction since short-term memory, or delay, increases the power of recurrent networks immensely. In this case, we present an example of a recurrent two-layer neural network. The output of each neuron is passed through a delay unit and then taken to all the neurons, except itself. In Figs. 10.13 and 10.14, we can see that only one input variable is presented to the input units, the feedforward flow is computed, and the outputs are fed back as auxiliary inputs. This leads to a different set of hidden unit activations, new output activations, and so on. Ultimately, the activations stabilize, and the final output values are used for predictions.

A simple two-layer recurrent artificial neural network with univariate output
A two-layer recurrent artificial neural network with multivariate outputs
However, it is important to point out out that despite the just mentioned virtues of recurrent artificial neural networks, they are still largely theoretical and produce mixed results (good and bad) in real applications. On the other hand, the feedforward networks are the most popular since they are successfully implemented in all areas of domain; the multilayer perceptron (MLP; that is, onother name give to feedforward networks) is the de facto standard artificial neural network topology (Lantz 2015). There are other DNN topologies like convolutional neural networks that are presented in Chap. 13, but they can be found also in books specializing in deep learning.
10.6 Successful Applications of ANN and DL
The success of ANN and DL is due to remarkable results on perceptual problems such as seeing and hearing—problems involving skills that seem natural and intuitive to humans but have long been elusive for machines. Next, we provide some of these successful applications:
-
(a)
Near-human-level image classification, speech recognition, handwriting transcription, autonomous driving (Chollet and Allaire 2017)
-
(b)
Automatic translation of text and images (LeCun et al. 2015)
-
(c)
Improved text-to-speech conversion (Chollet and Allaire 2017)
-
(d)
Digital assistants such as Google Now and Amazon Alexa
-
(e)
Improved ad targeting, as used by Google, Baidu, and Bing
-
(f)
Improved search results on the Web (Chollet and Allaire 2017)
-
(g)
Ability to answer natural language questions (Goldberg 2016)
-
(h)
In games like chess, Jeopardy, GO, and poker (Makridakis et al. 2018)
-
(i)
Self-driving cars (Liu et al. 2017),
-
(j)
Voice search and voice-activated intelligent assistants (LeCun et al. 2015)
-
(k)
Automatically adding sound to silent movies (Chollet and Allaire 2017)
-
(l)
Energy market price forecasting (Weron 2014)
-
(m)
Image recognition (LeCun et al. 2015)
-
(n)
Prediction of time series (Dingli and Fournier 2017)
-
(o)
Predicting breast, brain (Cole et al. 2017), or skin cancer
-
(p)
Automatic image captioning (Chollet and Allaire 2017)
-
(q)
Predicting earthquakes (Rouet-Leduc et al. 2017)
- (r)
It is important to point out that the applications of ANN and DL are not restricted to perception and natural language understanding, such as formal reasoning. There are also many successful applications in biological science. For example, deep learning has been successfully applied for predicting univariate continuous traits (Montesinos-López et al. 2018a), multivariate continuous traits (Montesinos-López et al. 2018b), univariate ordinal traits (Montesinos-López et al. 2019a), and multivariate traits with mixed outcomes (Montesinos-López et al. 2019b) in the context of genomic-based prediction. Menden et al. (2013) applied a DL method to predict the viability of a cancer cell line exposed to a drug. Alipanahi et al. (2015) used DL with a convolutional network architecture (an ANN with convolutional operations; see Chap. 13) to predict specificities of DNA- and RNA-binding proteins. Tavanaei et al. (2017) used a DL method for predicting tumor suppressor genes and oncogenes. DL methods have also made accurate predictions of single-cell DNA methylation states (Angermueller et al. 2016). In the area of genomic selection, we mention two reports only: (a) McDowell and Grant (2016) found that DL methods performed similarly to several Bayesian and linear regression techniques that are commonly employed for phenotype prediction and genomic selection in plant breeding and (b) Ma et al. (2017) also used a DL method with a convolutional neural network architecture to predict phenotypes from genotypes in wheat and found that the DL method outperformed the GBLUP method. However, a review of DL application to genomic selection is provided by Montesinos-López et al. (2021).
10.7 Loss Functions
Loss function (also known as objective function) in general terms is a function that maps an event or values of one or more variables onto a real number intuitively representing some “cost” associated with the event. An optimization problem seeks to minimize a loss function. An objective function is either a loss function or its negative (in specific domains, variously called a reward function, a profit function, a utility function, a fitness function, etc.), in which case now the goal is a maximization process. In the statistical machine learning domain, a loss function tries to quantify how close the predicted values produced by an artificial neural network or DL model are to the true values. That is, the loss function measures the quality of the network’s output by computing a distance score between the observed and predicted values (Chollet and Allaire 2017). The basic idea is to calculate a metric based on the observed error between the true and predicted values to measure how well the artificial neural network model’s prediction matches what was expected. Then these errors are averaged over the entire data set to provide only a single number that represents how the artificial neural network is performing with regard to its ideal. In looking for this ideal, it is possible to find the parameters (weights and biases) of the artificial neural network that will minimize the “loss” produced by the errors. Training ANN models with loss functions allows the use of optimization methods to estimate the required parameters. Although most of the time it is not possible to obtain an analytical solution to estimate the parameters, very often good approximations can be obtained using iterative optimization algorithms like gradient descent (Patterson and Gibson 2017). Next, we provide the most used loss functions for each type of response variable.
10.7.1 Loss Functions for Continuous Outcomes
Sum of square error loss
This loss function is appropriate for continuous response variables (outcomes), assuming that we want to predict L response variables. The error (difference between observed (yij) and predicted (\( {\hat{y}}_{ij} \)) values) in a prediction is squared and summed over the number of observations, since the training of the network is not local but global. To capture all possible trends in the training data, the expression used for sum of square error (SSE) loss is
Note that n is the size of your data set, and L, the number of targets (outputs) the network has to predict. It is important to point out that when there is only one response variable, the L is dropped. Also, the division by two is added for mathematical convenience (which will become clearer in the context of its gradient in backpropagation). One disadvantage of this loss function is that it is quite sensitive to outliers and, for this reason, other loss functions have been proposed for continuous response variables. With the loss function, it is possible to calculate the loss score, which is used as a feedback signal to adjust the weights of the artificial neural network; this process of adjusting the weights in ANN is illustrated in Fig. 10.15 (Chollet and Allaire 2017). It is also common practice to use as a loss function, the SSE divided by the training sample (n) multiplied by the number of outputs (L).
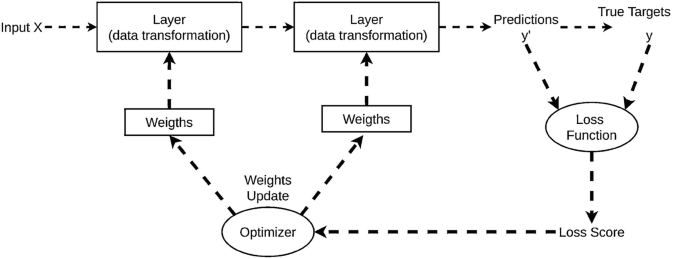
The loss score is used as a feedback signal to adjust the weights
Figure 10.15 shows that in the learning process of an artificial neural network are involved the interaction of layers, input data, loss function which defines the feedback signal used for learning, and the optimizer which determines how the learning proceeds and uses the loss value to update the network’s weights. Initially, the weights of the network are assigned small random values, but when this provides an output far from the ideal values, it also implies a high loss score. But at each iteration of the network process, the weights are adjusted a little to reduce the difference between the observed and predicted values and, of course, to decrease the loss score. This is the basic step of the training process of statistical machine learning models in general, and when this process is repeated a sufficient number of times (on the order of thousands of iterations), it yields weight values that minimize the loss function. A network with minimal loss is one in which the observed and predicted values are very close; it is called a trained network (Chollet and Allaire 2017). There are other options of loss functions for continuous data like the sum of absolute percentage error loss (SAPE): \( L\left(\boldsymbol{w}\right)={\sum}_{i=1}^n{\sum}_{j=1}^L\left|\frac{{\hat{y}}_{ij}-{y}_{ij}}{y_{ij}}\right| \) and the sum of squared log error loss (Patterson and Gibson 2017): \( L\left(\boldsymbol{w}\right)={\sum}_{i=1}^n{\sum}_{j=1}^L{\left(\log \left({\hat{y}}_{ij}\right)-\log \left({y}_{ij}\right)\right)}^2 \), but the SSE is popular in ANN and DL models due to its nice mathematical properties.
10.7.2 Loss Functions for Binary and Ordinal Outcomes
Next, we provide two popular loss functions for binary data: the hinge loss and the cross-entropy loss.
Hinge loss
This loss function originated in the context of the support vector machine for “maximum-margin” classification, and is defined as
It is important to point out that since this loss function is appropriate for binary data, the intended response variable output is denoted as +1 for success and −1 for failure.
Logistic loss
This loss function is defined as
This loss function originated as the negative log-likelihood of the product of Bernoulli distributions. It is also known as cross-entropy loss since we arrive at the logistic loss by calculating the cross-entropy (difference between two probability distributions) loss, which is a measure of the divergence between the predicted probability distribution and the true distribution. Logistic loss functions are preferred over the hinge loss when the scientist is mostly interested in the probabilities of success rather than in just the hard classifications. For example, when a scientist is interested in the probability that a patient can get cancer as a function of a set of covariates, the logistic loss is preferred since it allows calculating true probabilities.
When the number of classes is more than two according to Patterson and Gibson (2017), that is, when we are in the presence of categorical data, the loss function is known as categorical cross-entropy and is equal to
Poisson loss
This loss function is built as the minus log-likelihood of a Poisson distribution and is appropriate for predicting count outcomes. It is defined as
Also, for count data the loss function can be obtained under a negative binomial distribution, which can do a better job than the Poisson distribution when the assumption of equal mean and variance is hard to justify.
10.7.3 Regularized Loss Functions
Regularization is a method that helps to reduce the complexity of the model and significantly reduces the variance of statistical machine learning models without any substantial increase in their bias. For this reason, to prevent overfitting and improve the generalizability of our models, we use regularization (penalization), which is concerned with reducing testing errors so that the model performs well on new data as well as on training data. Regularized or penalized loss functions are those that instead of minimizing the conventional loss function, L(w), minimize an augmented loss function that consists of the sum of the conventional loss function and a penalty (or regularization) term that is a function of the weights. This is defined as
where L(w, λ) is the regularized (or penalized) loss function, λ is the degree or strength of the penalty term, and EP is the penalization proposed for the weights; this is known as the regularization term. The regularization term shrinks the weight estimates toward zero, which helps to reduce the variance of the estimates and increase the bias of the weights, which in turn helps to improve the out-of-sample predictions of statistical machine learning models (James et al. 2013). As you remember, the way to introduce the penalization term is using exactly the same logic used in Ridge regression in Chap. 3. Depending on the form of EP, there is a name for the type of regularization. For example, when EP = wTw, it is called Ridge penalty or weight decay penalty. This regularization is also called L2 penalty and has the effect that larger weights (positive or negative) result in larger penalties. On the other hand, when \( {E}_P={\sum}_{p=1}^P\left|{w}_p\right| \), that is, when the EP term is equal to the sum of the absolute weights, the name of this regularization is Least Absolute Shrinkage and Selection Operator (Lasso) or simply L1 regularization. The L1 penalty produces a sparse solution (more zero weights) because small and larger weights are equally penalized and force some weights to be exactly equal to zero when the λ is considerably large (James et al. 2013; Wiley 2016); for this reason, the Lasso penalization also performs variable selection and provides a model more interpretable than the Ridge penalty. By combining Ridge (L2) and Lasso (L1) regularization, we obtained Elastic Net regularization, where the loss function is defined as \( L\left(\boldsymbol{w},{\lambda}_1,{\lambda}_2\right)=L\left(\boldsymbol{w}\right)+0.5\times {\lambda}_1{\sum}_{p=1}^P\left|{w}_p\right|+0.5\times {\lambda}_2{\sum}_{p=1}^P{w}_p^2 \), and where instead of one lambda parameter, two are needed.
It is important to point out that more than one hyperparameter is needed in ANN and DL models where different degrees of penalties can be applied to different layers and different hyperparameters. This differential penalization is sometimes desirable to improve the predictions in new data, but this has the disadvantage that more hyperparameters need to be tuned, which increases the computation cost of the optimization process (Wiley 2016).
In all types of regularization, when λ = 0 (or λ1 = λ2 = 0), the penalty term has no effect, but the larger the value of λ, the more the shrinkage and penalty grows and the weight estimates will approach zero. The selection of the appropriate value of λ is challenging and critical; for this reason, λ is also treated as a hyperparameter that needs to be tuned and is usually optimized by evaluating a range of possible λ values through cross-validation. It is also important to point out that scaling the input data before implementing artificial neural networks is recommended, since the effect of the penalty depends on the size of the weights and the size of the weights depends on the scale of the data. Also, the user needs to recall from Chap. 3 where Ridge regression was presented, that the shrinkage penalty is applied to all the weights except the intercept or bias terms (Wiley 2016).
Another type of regularization that is very popular in ANN and DL is the dropout, which consists of setting to zero a random fraction (or percentage) of the weights of the input neurons or hidden neurons. Suppose that our original topology is like the topology given in Fig. 10.16.16a, where all the neurons are active (with weights different to zero), while when a random fraction of neurons is dropped out, this means that all its connections (weights) are set to zero and the topology with the dropout neurons (with weights set to zero) is observed in Fig. 10.16b. The contribution of those dropped out neurons to the activation of downstream neurons is temporarily removed on the forward pass and any weight updates are not applied to the neuron on the backward pass. Dropout is only used during the training of a model but not when evaluating the skill of the model; it prevents the units from co-adapting too much.
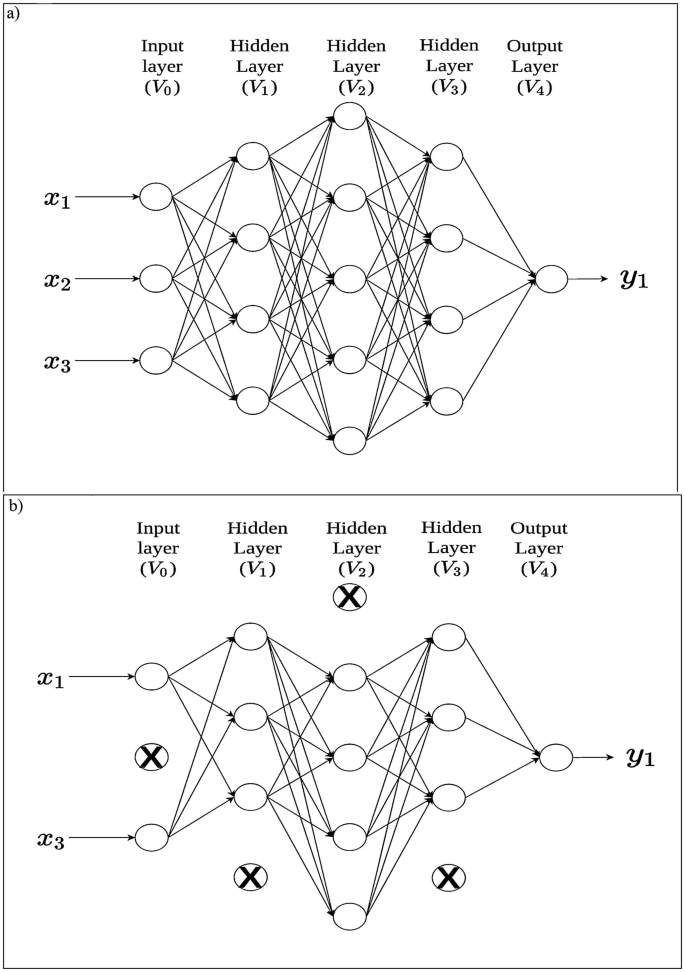
Feedforward neural network with four layers. (a) Three input neurons, four neurons in hidden layers 1 and 3, and five neurons in hidden layer 2 without dropout and (b) the same network with dropout; dropping out one in the input neuron, three neurons in hidden layers 1–3
This type of regularization is very simple and there is a lot of empirical evidence of its power to avoid overfitting. This regularization is quite new in the context of statistical machine learning and was proposed by Srivastava et al. (2014) in the paper Dropout: A Simple Way to Prevent Neural Networks from Overfitting. There are no unique rules to choose the percentage of neurons that will be dropped out. Some tips are given below to choose the % dropout:
-
(a)
Usually a good starting point is to use 20% dropout, but values between 20% and 50% are reasonable. A percentage that is too low has minimal effect and a value that is too high results in underfitting the network.
-
(b)
The larger the network, the better, when you use the dropout method, since then you are more likely to get a better performance, because the model had more chance to learn independent representations.
-
(c)
Application of dropout is not restricted to hidden neurons; it can also be applied in the input layer. In both cases, there is evidence that it improves the performance of the ANN model.
-
(d)
When using dropout, increasing the learning rate (learning rate is a tuning parameter in an optimization algorithm that regulates the step size at each epoch (iteration) while moving toward a minimum (or maximum) of a loss function) of the ANN algorithm by a factor of 10–100 is suggested, as well as increasing the momentum value (another tuning parameter useful for computing the gradient at each iteration), for example, from 0.90 to 0.99.
-
(e)
When dropout is used, it is also a good idea to constrain the size of network weights, since the larger the learning rate, the larger the network weights. For this reason, constraining the size of network weights to less than five in absolute values with max-norm regularization has shown to improve results.
It is important to point out that all the loss functions described in the previous section can be converted to regularized (penalized) loss functions using the elements given in this section. The dropout method can also be implemented with any type of loss function.
10.7.4 Early Stopping Method of Training
During the training process, the ANN and DL models learn in stages, from simple realizations to complex mapping functions. This process is captured by monitoring the behavior of the mean squared error that compares the match between observed and predicted values, which starts decreasing rapidly by increasing the number of epochs (epoch refers to one cycle through the full training data set) used for training, then decrease slowly when the error surface is close to a local minimum. However, to attain the larger generalization power of a model, it is necessary to figure out when it is best to stop training, which is a very challenging situation since a very early stopping point can produce underfitting, while a very late (no large) stopping point can produce overfitting of the training data. As mentioned in Chap. 4, one way to avoid overfitting is to use a CV strategy, where the training set is split into a training-inner and testing-inner set; with the training-inner set, the model is trained for the set of hyperparameters, and with the testing-inner (tuning) set, the power to predict out of sample data is evaluated, and in this way the optimal hyperparameters are obtained. However, we can incorporate the early stopping method to CV to fight better overfitting by using the CV strategy in the usual way with a minor modification, which consists of stopping the training section periodically (i.e., every so many epochs) and testing the model on the validation subset, after reaching the specified number of epochs (Haykin 2009). In other words, the stopping method combined with the CV strategy that consists of a periodic “estimation-followed-by-validation process” basically proceeds as follows:
-
(a)
After a period of estimation (training)—every three epochs, for example—the weights and bias (intercept) parameters of the multilayer perceptron are all fixed, and the network is operated in its forward mode. Then the training and validation error are computed.
-
(b)
When the validation prediction performance is completed, the estimation (training) is started again for another period, and the process is repeated.
Due to its nature (just described above), which is simple to understand and easy to implement in practice, this method is called early stopping method of training. To better understand this method, in Fig. 10.17 this approach is conceptualized with two learning curves, one for the training subset and the other for the validation subset. Figure 10.17 shows that the prediction power in terms of MSE is lower in the training set than in the validation set, which is expected. The estimation learning curve that corresponds to the training set decreases monotonically as the number of epochs increases, which is normal, while the validation learning curve decreases monotonically to a minimum and then as the training continues, starts to increase. However, the estimation learning curve of the training set suggests that we can do better by going beyond the minimum point on the validation learning curve, but this is not really true since in essence what is learned beyond this point is the noise contained in the training data. For this reason, the minimum point on the validation learning curve could be used as a sensible criterion for stopping the training session. However, the validation sample error does not evolve as smoothly as the perfect curve shown in Fig. 10.17, over the number of epochs used for training, since the validation sample error many times exhibits few local minima of its own before it starts to increase with an increasing number of epochs. For this reason, in the presence of two or more local minima, the selection of a “slower” stopping criterion (i.e., a criterion that stops later than other criteria) makes it possible to attain a small improvement in generalization performance (typically, about 4%, on average) at the cost of a much longer training period (about a factor of four, on average).
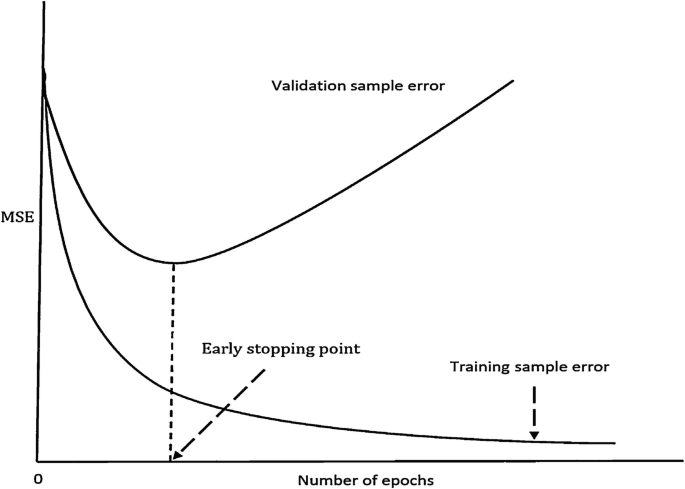
Schematic representation of the early stopping rule based on cross-validation (Haykin 2009)
10.8 The King Algorithm for Training Artificial Neural Networks: Backpropagation
The training process of ANN, which consists of adjusting connection weights, requires a lot of computational resources. For this reason, although they had been studied for many decades, few real applications of ANN were available until the mid-to-late 1980s, when the backpropagation method made its arrival. This method is attributed to Rumelhart et al. (1986). It is important to point out that, independently, other research teams around the same time published the backpropagation algorithm, but the one previously mentioned is one of the most cited. This algorithm led to the resurgence of ANN after the 1980s, but this algorithm is still considerably slower than other statistical machine learning algorithms. Some advantages of this algorithm are (a) it is able to make predictions of categorical or continuous outcomes, (b) it does a better job in capturing complex patterns than nearly any other algorithm, and (c) few assumptions about the underlying relationships of the data are made. However, this algorithm is not without weaknesses, some of which are (a) it is very slow to train since it requires a lot of computational resources because the more complex the network topology, the more computational resources are needed, this statement is true not only for ANN but also for any algorithm, (b) it is very susceptible to overfitting training data, and (c) its results are difficult to interpret (Lantz 2015).
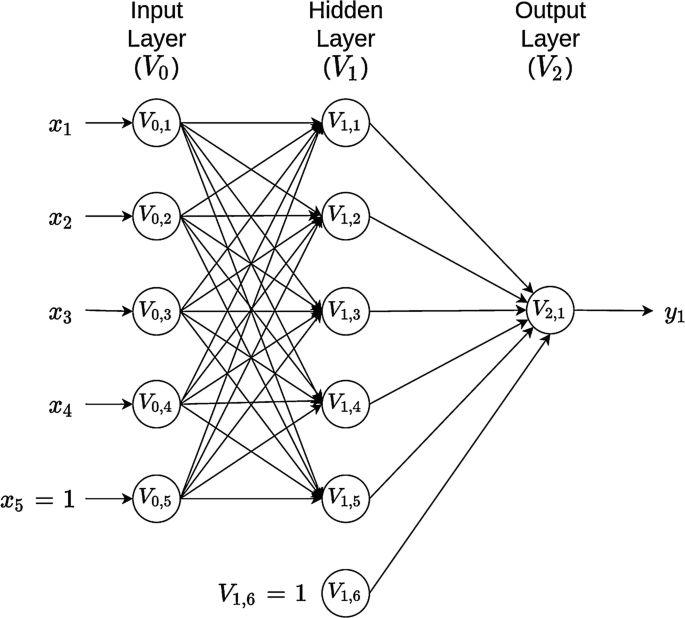
Next, we provide the derivation of the backpropagation algorithm for the multilayer perceptron network shown in Fig. 10.18.
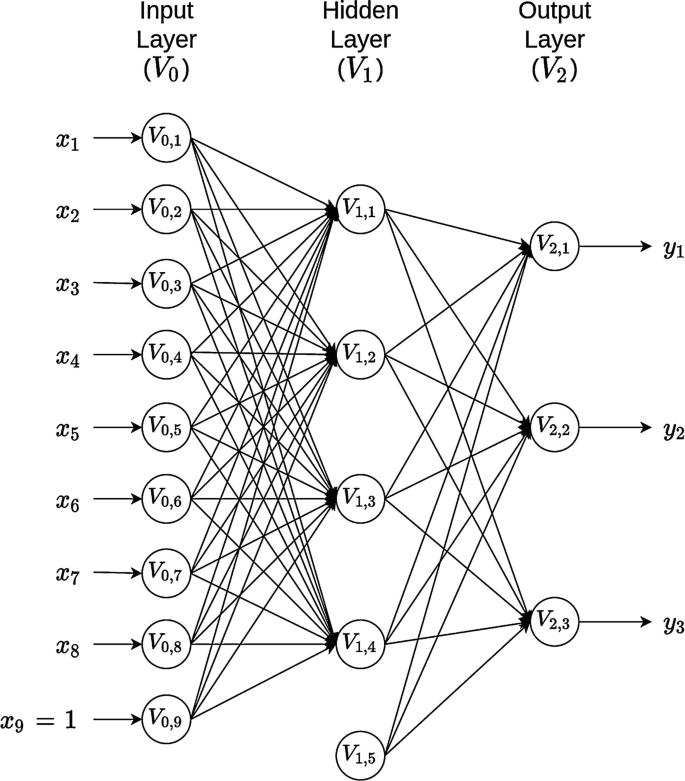
Schematic representation of a multilayer feedforward network with one hidden layer, eight input variables, and three output variables
As mentioned earlier, the goal of the backpropagation algorithm is to find the weights of a multilayered feedforward network. The multilayered feedforward network given in Fig. 10.18 is able to approximate any function to any degree of accuracy (Cybenko 1989) with enough hidden units, as stated in the universal approximation theorem (Sect. 10.4), which makes the multilayered feedforward network a powerful statistical machine learning tool. Suppose that we provide this network with n input patterns of the form
where xi denotes the input pattern of individual i with i = 1, …, n, and xip denotes the input pth of xi. Let yij denote the response variable of the ith individual for the jth output and this is associated with the input pattern xi. For this reason, to be able to train the neural network, we must learn the functional relationship between the inputs and outputs. To illustrate the learning process of this relationship, we use the SSE loss function (explained in the section about “loss functions” to optimize the weights) which is defined as
Now, to explain how the backpropagation algorithm works, we will explain how information is first passed forward through the network. Providing the input values to the input layer is the first step, but no operation is performed on this information since it is simply passed to the hidden units. Then the net input into the kth hidden neuron is calculated as
Here P is the total number of explanatory variables or input nodes, \( {w}_{kp}^{(h)} \) is the weight from input unit p to hidden unit k, the superscript, h, refers to hidden layer, and xip is the value of the pth input for pattern or individual i. It is important to point out that the bias term (\( {b}_j^{(h)} \)) of neuron k in the hidden layer has been excluded from (10.6) because the bias can be accounted for by adding an extra neuron to the input layer and fixing its value at 1. Then the output of the k neuron resulting from applying an activation function to its net input is
where g(h) is the activation function that is applied to the net input of any neuron k of the hidden layer. In a similar vein, now with all the outputs of the neurons in the hidden layer, we can estimate the net input of the jth neuron of the output unit j as
where M is the number of neurons in the hidden layer and \( {w}_{jk}^{(l)} \) represents the weights from hidden unit k to output j. The superscript, l,refers to output layer. Also, here the bias term (\( {b}_j^{(l)}\Big) \) of neuron j in the output layer was not included in (10.8) since it can be included by adding an extra neuron to the hidden layer and fixing its value at 1. Now, by applying the activation function to the output of the jth neuron of the output layer, we get the predicted value of the jth output as
where \( {\hat{y}}_{ij} \) is the predicted value of individual i in output j and g(l) is the activation function of the output layer. We are interested in learning the weights (\( {w}_{kp}^{(h)},{w}_{jk}^{(l)} \)) that minimize the sum of squared errors known as the mean square loss function (10.5), which is a function of the unknown weights, as can be observed in (10.6)–(10.8). Therefore, the partial derivatives of the loss function with respect to the weights represent the rate of change of the loss function with respect to the weights (this is the slope of the loss function). The loss function will decrease when moving the weights down this slope. This is the intuition behind the iterative method called backpropagation for finding the optimal weights and biases. This method consists of evaluating the partial derivatives of the loss function with regard to the weights and then moving these values down the slope, until the score of the loss function no longer decreases. For example, if we make the variation of the weights proportional to the negative of the gradient, the change in the weights in the right direction is reached. The gradient of the loss function given in (10.5) with respect to the weights connecting the hidden units to the output units (\( {w}_{jk}^{(l)}\Big) \) is given by
where η is the learning rate that scales the step size and is specified by the user. To be able to calculate the adjustments for the weights connecting the hidden neurons to the outputs, \( {w}_{jk}^{(l)} \), first we substitute (10.6)–(10.9) in (10.5), which yields
Then, by expanding (10.10) using the change rule, we get
Next, we get each partial derivative
By substituting these partial derivatives in (10.10), we obtain the change in weights from the hidden units to the output units, \( \Delta {w}_{jk}^{(l)}, \)as
where \( {\delta}_{ij}=\left({y}_{ij}-{\hat{y}}_{ij}\right)\ {g}^{(l)\acute{\mkern6mu}}\left({z}_{ij}^{(l)}\right) \). Therefore, the formula used to update the weights from the hidden units to the output units is
This equation reflects that the adjusted weights from (10.13) are added to the current estimate of the weights, \( {w}_{jk}^{(l)(t)} \), to obtain the updated estimates, \( {w}_{jk}^{(l)\left(t+1\right)} \).
Next, to update the weights connecting the input units to the hidden units, we follow a similar process as in (10.12). Thus
Using the chain rule, we get that
where \( \frac{\partial E}{\partial {\hat{y}}_{ij}} \) and \( \frac{\partial {\hat{y}}_{ij}}{\partial {z}_{ij}^{(l)}} \) are given in (10.11), while
Substituting back into (10.14), we obtain the change in the weights from the input units to the hidden units, \( \Delta {w}_{kp}^{(h)} \), as
where \( {\psi}_{ik}={\sum}_{j=1}^L{\delta}_{ij}{w}_{jk}^{(l)}{g}^{(h)\acute{\mkern6mu}}\left({z}_{ik}^{(h)}\right) \). The summation over the number of output units is because each hidden neuron is connected to all the output units. Therefore, all the outputs should be affected if the weight connecting an input unit to a hidden unit changes. In a similar way, the formula for updating the weights from the input units to the hidden units is
This equation also reflects that the adjusted weights from (10.17) are added to the current estimate of the weights, \( {w}_{kp}^{(h)(t)} \), to obtain the updated estimates, \( {w}_{kp}^{(h)\left(t+1\right)} \). Now we are able to put down the processing steps needed to compute the change in the network weights using the backpropagation algorithm. We define w as the entire collection of weights.
10.8.1 Backpropagation Algorithm: Online Version
10.8.1.1 Feedforward Part
Step 1. Initialize the weights to small random values, and define the learning rate (η) and the minimum expected loss score (tol). By tol we can fix a small value that when this value is reached, the training process will stop.
Step 2. If the stopping condition is false, perform steps 3–14.
Step 3. Select a pattern xi = [xi1, …, xiP]T as the input vector sequentially (i = 1 till the number of samples) or at random.
Step 4. The net inputs of the hidden layer are calculated: \( {z}_{ik}^{(h)}={\sum}_{p=0}^P{w}_{kp}^{(h)}{x}_{ip} \), i = 1, …, n and k = 0, …, M.
Step 5. The outputs of the hidden layer are calculated: \( {V}_{ik}^{(h)}={g}^{(h)}\left({z}_{ik}^{(h)}\right) \)
Step 6. The net inputs of the output layer are calculated: \( {z}_{ij}^{(l)}={\sum}_{k=0}^M{w}_{jk}^{(l)}{V}_{ik}^{(h)},j=1,\dots, L \)
Step 7. The predicted values (outputs) of the neural network are calculated: \( {\hat{y}}_{ij}={g}^{(l)}\left({z}_{ij}^{(l)}\right) \)
Step 8. Compute the mean square error (loss function) for pattern i error: \( {E}_i=\frac{1}{2 nL}{\sum}_{j=1}^L{\left({\hat{y}}_{ij}-{y}_{ij}\right)}^2+{E}_i \); then E(w) = Ei + E(w); in the first step of an epoch, initialize Ei = 0. Note that the value of the loss function is accumulated over all data pairs, that is, (yij, xi).
10.8.1.2 Backpropagation Part
Step 9. The output errors are calculated: \( {\delta}_{ij}=\left({y}_{ij}-{\hat{y}}_{ij}\right)\ {g}^{(l)\acute{\mkern6mu}}\left({z}_{ij}^{(l)}\right) \)
Step 10. The hidden layer errors are calculated: \( {\psi}_{ik}={g}^{(h)\acute{\mkern6mu}}\left({z}_{ik}^{(h)}\right){\sum}_{j=1}^L{\delta}_{ij}{w}_{jk}^{(l)} \)
Step 11. The weights of the output layer are updated: \( {w}_{jk}^{(l)\left(t+1\right)}={w}_{jk}^{(l)(t)}+{\eta \delta}_{ij}{V}_{ik}^{(h)} \)
Step 12. The weights of the hidden layer are updated: \( {w}_{kp}^{(h)\left(t+1\right)}={w}_{kp}^{(h)(t)}+{\eta \psi}_{ik}{x}_{ip} \)
Step 13. If i < n, go to step 3; otherwise go to step 14.
Step 14. Once the learning of an epoch is complete, i = n; then we check if the global error is satisfied with the specified tolerance (tol). If this condition is satisfied we terminate the learning process which means that the network has been trained satisfactorily. Otherwise, go to step 3 and start a new learning epoch: i = 1, since E(w) < tol.
The backpropagation algorithm is iterative. This means that the search process occurs over multiple discrete steps, each step hopefully slightly improving the model parameters. Each step involves using the model with the current set of internal parameters to make predictions of some samples, comparing the predictions to the real expected outcomes, calculating the error, and using the error to update the internal model parameters. This update procedure is different for different algorithms, but in the case of ANN, as previously pointed out, the backpropagation update algorithm is used.
10.8.2 Illustrative Example 10.1: A Hand Computation
In this section, we provide a simple example that will be computed step by step by hand to fully understand how the training is done using the backpropagation method. The topology used for this example is given in Fig. 10.19.

A simple artificial neural network with one input, one hidden layer with one neuron, and one response variable (output)
The data set for this example is given in Table 10.1, where we can see that the data collected consist of four observations, the response variable (y) takes values between 0 and 1, and the input information is for only one predictor (x). Additionally, Table 10.1 gives the starting values for the hidden weights (\( {w}_{kp}^{(h)}\Big) \) and for the output weights (\( {w}_{jk}^{(l)} \)). It is important to point out that due to the fact that the response variable is in the interval between zero and one, we will use the sigmoid activation function for both the hidden layer and the output layer. A learning rate (η) equal to 0.1 and tolerance equal to 0.025 were also used.
The backpropagation algorithm described before was given for one input pattern at a time; however, to simplify the calculations, we will implement this algorithm using the four patterns of data available simultaneously using matrix calculations. For this reason, first we build the design matrix of inputs and outputs:
We also define the vectors of the starting values of the hidden and output weights:
Here we can see that P = 1,and M = 2. Next we calculate the net inputs for the hidden layer as
Now the output for the hidden layer is calculated using the sigmoid activation function
where \( {V}_{ik}^{(h)}={g}^{(h)}\left({z}_{ik}^{(h)}\right),i=1,\dots, 4 \) and g(h)(z) = 1/(1 + exp (−z)), which can be replaced by another desired activation function. Then the net inputs for the output layer are calculated as follows:
The predicted values (outputs) of the neural network are calculated as
where \( {\hat{y}}_i={g}^{(l)}\left({z}_{i1}^{(l)}\right),i=1,\dots, 4 \) and g(l)(z) = 1/(1 + exp (−z)). Next the output errors are calculated using the Hadamard product, ∘, (element-wise matrix multiplication) as
The hidden layer errors are calculated as
where \( {\boldsymbol{w}}_1^{(l)} \) is w(l) without the weight of the intercept, that is, without the first element.
The weights of the output layer are updated:
where 2 denotes that the output weights are for epoch number 2. Then the weights for epoch 2 of the hidden layer are obtained with
We check to see if the global error is satisfied with the specified tolerance (tol). Since \( E\left(\boldsymbol{w}\right)=\frac{1}{2n}{\sum}_{i=1}^n{\left({\hat{y}}_i-{y}_i\right)}^2=0.03519>\mathrm{tol}=0.025, \) this means that we need to increase the number of epochs to satisfy the tol = 0.025 specified.
Epoch 2. Using the updated weights of epoch 1, we obtain the new weights after epoch 2. First for the output layer:
And next for the hidden layer:
Now the predicted values are \( {\hat{y}}_1=0.8233 \), \( {\hat{y}}_2=0.3754 \), \( {\hat{y}}_3=0.8480 \), and \( {\hat{y}}_4=0.2459 \), and again we found that \( E\left(\boldsymbol{w}\right)=\frac{1}{2n}{\sum}_{i=1}^n{\left({\hat{y}}_i-{y}_i\right)}^2=0.03412>\mathrm{tol}=0.025. \) This means that we need to continue the number of epochs to be able to satisfy the tol = 0.025 specified. The learning process by decreasing the MSE is observed in Fig. 10.20, where we can see that tol = 0.025 is reached in epoch number 13, with an MSE = E(w) = 0.02425.
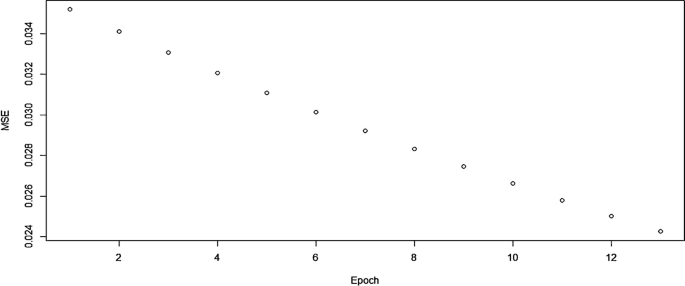
Behavior of the learning process by monitoring the MSE for Example 10.1—a hand computation
10.8.3 Illustrative Example 10.2—By Hand Computation
Table 10.2 gives the information for this example; the data collected contain five observations, the response variable (y) has a value between −1 and 1, and there are three inputs (predictors). Table 10.2 also provides the starting values for the hidden weights (\( {w}_{kp}^{(h)}\Big) \) and for the output weights (\( {w}_{jk}^{(l)} \)). Due to the fact that the response variable is in the interval between −1 and 1, we will use the hyperbolic tangent activation function (Tanh) for the hidden and output layers. Now we used a learning rate (η) equal to 0.05 and a tolerance equal to 0.008 (Fig. 10.21).

A simple artificial neural network with three inputs, one hidden layer with two neurons, and one response variable (output)
Here the backpropagation algorithm was implemented using the five patterns of data simultaneously using matrix calculations. Again, first we represent the design matrix of inputs and outputs:
Then we define the vectors of starting values of the hidden (w(h)) and output (w(l)) weights:
Now P = 3 and M = 3. Next, we calculate the net inputs for the hidden layer as
Now with the tanh activation function, the output of the hidden layer is calculated:
Again \( {V}_{ik}^{(h)}={g}^{(h)}\left({z}_{ik}^{(h)}\right),i=1;k=1,2 \), and \( {g}^{(h)}(z)=\tanh (z)=\frac{\exp (z)-\exp \left(-z\right)}{\exp (z)+\exp \left(-z\right)} \), which can also be replaced by another activation function. Then the net inputs for the output layer are calculated as
The predicted values (outputs) of the neural network are calculated as
where \( {\hat{y}}_{ij}={g}^{(l)}\left({z}_{i1}^{(l)}\right),i=1,\dots, 5 \) and \( {g}^{(l)}(z)=\tanh (z)=\frac{\exp (z)-\exp \left(-z\right)}{\exp (z)+\exp \left(-z\right)} \). The output errors are calculated as
The hidden layer errors are calculated as
where \( {\boldsymbol{w}}_1^{(h)} \) is w(h) without the weights of the intercepts, that is, without the first row.
The weights of the output layer are updated:
Number 2 in w(l)(2) indicates that output weights are for epoch number 2. The weights of the hidden layer in epoch 2 are obtained with
We check to see if the global errors are satisfied with the specified tolerance (tol).\( E\left(\boldsymbol{w}\right)=\frac{1}{2n}{\sum}_{i=1}^n{\left({\hat{y}}_i-{y}_i\right)}^2=0.01104>\mathrm{tol}=0.008 \) which means that we have to continue with the next epoch by cycling the training data again.
Epoch 2. Using the updated weights of epoch 1, we obtain the new weights for epoch 2.
For the output layer, these are
While for the hidden layer, they are
Now the predicted values are \( {\hat{y}}_1=0.6372 \), \( {\hat{y}}_2=0.2620 \),\( {\hat{y}}_3=-0.6573 \), \( {\hat{y}}_4=0.6226, \)\( {\hat{y}}_5=-0.9612, \) and the \( E\left(\boldsymbol{w}\right)=\frac{1}{2n}{\sum}_{i=1}^n{\left({\hat{y}}_i-{y}_i\right)}^2=0.01092>\mathrm{tol}=0.008, \) which means that we have to continue with the next epoch by cycling the training data again. Figure 10.22 shows that the E(w) = 0.00799 < tol = 0.008 until epoch 83.
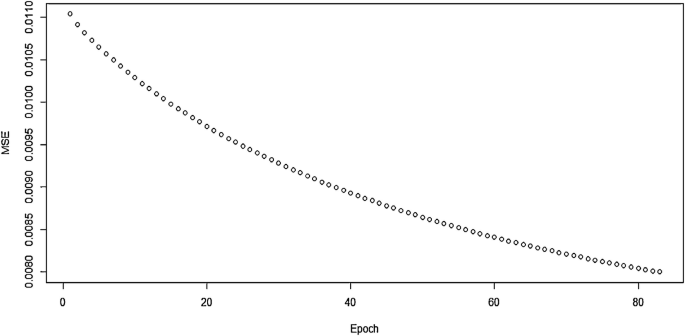
Behavior of the learning process by monitoring the MSE for Example 10.2—a hand computation
In this algorithm, zero weights are not an option because each layer is symmetric in the weights flowing to the different neurons. Then the starting values should be close to zero and can be taken from random uniform or Gaussian distributions (Efron and Hastie 2016). One of the disadvantages of the basic backpropagation algorithm just described above is that the learning parameter η is fixed.
References
Alipanahi B, Delong A, Weirauch MT, Frey BJ (2015) Predicting the sequence specificities of DNA- and RNA-binding proteins by deep learning. Nat Biotechnol 33:831–838
Anderson J, Pellionisz A, Rosenfeld E (1990) Neurocomputing 2: directions for research. MIT, Cambridge
Angermueller C, Pärnamaa T, Parts L, Stegle O (2016) Deep learning for computational biology. Mol Syst Biol 12(878):1–16
Chollet F, Allaire JJ (2017) Deep learning with R. Manning Publications, Manning Early Access Program (MEA), 1st edn
Cole JH, Rudra PK, Poudel DT, Matthan WA, Caan CS, Tim D, Spector GM (2017) Predicting brain age with deep learning from raw imaging data results in a reliable and heritable biomarker. NeuroImage 163(1):115–124. https://doi.org/10.1016/j.neuroimage.2017.07.059
Cybenko G (1989) Approximations by superpositions of sigmoidal functions. Math Control Signal Syst 2:303–314
Dingli A, Fournier KS (2017) Financial time series forecasting—a deep learning approach. Int J Mach Learn Comput 7(5):118–122
Dougherty G (2013) Pattern recognition and classification-an introduction. Springer Science + Business Media, New York
Efron B, Hastie T (2016) Computer age statistical inference. Algorithms, evidence, and data science. Cambridge University Press, New York
Francisco-Caicedo EF, López-Sotelo JA (2009) Una approximación práctica a las redes neuronales artificiales. Universidad del Valle, Cali
Goldberg Y (2016) A primer on neural network models for natural language processing. J Artif Intell Res 57(345):420
Haykin S (2009) Neural networks and learning machines, 3rd edn. Pearson Prentice Hall, New York
Hornik K (1991) Approximation capabilities of multilayer feedforward networks. Neural Netw 4:251–257
James G, Witten D, Hastie T, Tibshirani R (2013) An introduction to statistical learning with applications in R. Springer, New York
Kohonen T (2000) Self-organizing maps. Springer, Berlin
Lantz B (2015) Machine learning with R, 2nd edn. Packt Publishing Ltd, Birmingham
LeCun Y, Bengio Y, Hinton G (2015) Deep learning. Nature 521(7553):436–444
Lewis ND (2016) Deep learning made easy with R. A gentle introduction for data science. CreateSpace Independent Publishing Platform
Liu S, Tang J, Zhang Z, Gaudiot JL (2017) CAAD: computer architecture for autonomous driving. ariv preprint ariv:1702.01894
Ma W, Qiu Z, Song J, Cheng Q, Ma C (2017) DeepGS: predicting phenotypes from genotypes using Deep Learning. bioRxiv 241414. https://doi.org/10.1101/241414
Makridakis S, Spiliotis E, Assimakopoulos V (2018) Statistical and Machine Learning forecasting methods: concerns and ways forward. PLoS One 13(3):e0194889. https://doi.org/10.1371/journal.pone.0194889
McCulloch WS, Pitts W (1943) A logical calculus of the ideas immanent in nervous activity. Bull Math Biophys 5:115–133
McDowell R, Grant D (2016) Genomic selection with deep neural networks. Graduate Theses and Dissertations, p 15973. https://lib.dr.iastate.edu/etd/15973
Menden MP, Iorio F, Garnett M, McDermott U, Benes CH et al (2013) Machine learning prediction of cancer cell sensitivity to drugs based on genomic and chemical properties. PLoS One 8:e61318
Montesinos-López A, Montesinos-López OA, Gianola D, Crossa J, Hernández-Suárez CM (2018a) Multi-environment genomic prediction of plant traits using deep learners with a dense architecture. G3: Genes, Genomes, Genetics 8(12):3813–3828. https://doi.org/10.1534/g3.118.200740
Montesinos-López OA, Montesinos-López A, Crossa J, Gianola D, Hernández-Suárez CM et al (2018b) Multi-trait, multi-environment deep learning modeling for genomic-enabled prediction of plant traits. G3: Genes, Genomes, Genetics 8(12):3829–3840. https://doi.org/10.1534/g3.118.200728
Montesinos-López OA, Vallejo M, Crossa J, Gianola D, Hernández-Suárez CM, Montesinos-López A, Juliana P, Singh R (2019a) A benchmarking between deep learning, support vector machine and bayesian threshold best linear unbiased prediction for predicting ordinal traits in plant breeding. G3: Genes, Genomes, Genetics 9(2):601–618
Montesinos-López OA, Martín-Vallejo J, Crossa J, Gianola D, Hernández-Suárez CM, Montesinos-López A, Juliana P, Singh R (2019b) New deep learning genomic prediction model for multi-traits with mixed binary, ordinal, and continuous phenotypes. G3: Genes, Genomes, Genetics 9(5):1545–1556
Montesinos-López OA, Montesinos-López A, Pérez-Rodríguez P, Barrón-López JA, Martini JWR, Fajardo-Flores SB, Gaytan-Lugo LS, Santana-Mancilla PC, Crossa J (2021) A review of deep learning applications for genomic selection. BMC Genomics 22:19
Patterson J, Gibson A (2017) Deep learning: a practitioner’s approach. O’Reilly Media
Ripley B (1993) Statistical aspects of neural networks. In: Bornndorff-Nielsen U, Jensen J, Kendal W (eds) Networks and chaos—statistical and probabilistic aspects. Chapman and Hall, London, pp 40–123
Rouet-Leduc B, Hulbert C, Lubbers N, Barros K, Humphreys CJ et al (2017) Machine learning predicts laboratory earthquakes. Geophys Res Lett 44(28):9276–9282
Rumelhart DE, Hinton GE, Williams RJ (1986) Learning internal representations by backpropagating errors. Nature 323:533–536
Shalev-Shwartz, Ben-David (2014) Understanding machine learning: from theory to algorithms. Cambridge University Press, New York
Srivastava N, Hinton G, Krizhevsky A, Sutskever I, Salakhutdinov R (2014) Dropout: a simple way to prevent neural networks from overfitting. J Mach Learn Res 15(6):1929–1958
Tavanaei A, Anandanadarajah N, Maida AS, Loganantharaj R (2017) A deep learning model for predicting tumor suppressor genes and oncogenes from PDB structure. bioRiv 177378. https://doi.org/10.1101/177378
Weron R (2014) Electricity price forecasting: a review of the state-of-the-art with a look into the future. Int J Forecast 30(4):1030–1081
Wiley JF (2016) R deep learning essentials: build automatic classification and prediction models using unsupervised learning. Packt Publishing, Birmingham, Mumbai
Author information
Authors and Affiliations
Rights and permissions
Open Access This chapter is licensed under the terms of the Creative Commons Attribution 4.0 International License (http://creativecommons.org/licenses/by/4.0/), which permits use, sharing, adaptation, distribution and reproduction in any medium or format, as long as you give appropriate credit to the original author(s) and the source, provide a link to the Creative Commons license and indicate if changes were made.
The images or other third party material in this chapter are included in the chapter's Creative Commons license, unless indicated otherwise in a credit line to the material. If material is not included in the chapter's Creative Commons license and your intended use is not permitted by statutory regulation or exceeds the permitted use, you will need to obtain permission directly from the copyright holder.
Copyright information
© 2022 The Author(s)
About this chapter

Cite this chapter
Montesinos López, O.A., Montesinos López, A., Crossa, J. (2022). Fundamentals of Artificial Neural Networks and Deep Learning. In: Multivariate Statistical Machine Learning Methods for Genomic Prediction. Springer, Cham. https://doi.org/10.1007/978-3-030-89010-0_10
Download citation
DOI: https://doi.org/10.1007/978-3-030-89010-0_10
Published:
Publisher Name: Springer, Cham
Print ISBN: 978-3-030-89009-4
Online ISBN: 978-3-030-89010-0
eBook Packages: Biomedical and Life SciencesBiomedical and Life Sciences (R0)