
Abstract
The poly(ADP-ribose)polymerase (PARP) enzyme tankyrase (TNKS/ARTD5, TNKS2/ARTD6) uses its ankyrin repeat clusters (ARCs) to recognize degenerate peptide motifs in a wide range of proteins, thereby recruiting such proteins and their complexes for scaffolding and/or poly(ADP-ribosyl)ation. Here, we provide guidance for predicting putative tankyrase-binding motifs, based on the previously delineated peptide sequence rules and existing structural information. We present a general method for the expression and purification of tankyrase ARCs from Escherichia coli and outline a fluorescence polarization assay to quantitatively assess direct ARC–TBM peptide interactions. We provide a basic protocol for evaluating binding and poly(ADP-ribosyl)ation of full-length candidate interacting proteins by full-length tankyrase in mammalian cells.
You have full access to this open access chapter, Download protocol PDF
Key words
- Tankyrase
- PARP
- Poly(ADP-ribosyl)ation
- Tankyrase-binding peptide motif
- Enzyme–substrate relationships
- Protein-protein interactions
- Protein expression
- Protein purification
- Fluorescence polarization (FP)
- Structural biology
1 Introduction
Poly(ADP-ribosyl)ation (PARylation) constitutes a striking posttranslational modification (PTM) catalyzed by poly(ADP-ribose)polymerase (PARP) enzymes, which serially transfer ADP-ribose from NAD+ onto substrate proteins [1]. The resulting long, strongly negatively charged PAR chains provide attachment sites for proteins endowed with PAR-binding modules or directly affect substrate function [2]. PAR can thus act as a scaffolding component as well as a regulatory PTM. PARylation is most commonly associated with nuclear events such as gene regulation and DNA damage repair , but PAR is found in both the nucleus and the cytoplasm [1, 3]. The PARP tankyrase, of which there are two human paralogs (TNKS/ARTD5, TNKS2/ARTD6 , see Fig. 1a), contributes to both the nuclear and cytoplasmic pools of PAR [4, 5]. The biological roles of the two tankyrases are largely redundant [6], pointing to shared molecular mechanisms. The recruitment of tankyrase to different protein complexes associated with specific cellular processes and situated at different subcellular locations defines its diverse functions. All tankyrase binders characterized to date bear a tankyrase-binding motif (TBM) , which in its simplest form consists of six to eight consecutive amino acids [4, 7, 8]. TBMs are recognized by tankyrase’s ankyrin repeat clusters (ARCs) [7, 9, 10]. Out of the five ARCs, the central one (ARC3) is devoid of a known peptide-binding function while the other four (ARCs 1, 2, 4, and 5) each feature a highly conserved peptide-binding pocket with similar specificities [7, 10] (Fig. 1a). Given four peptide-binding ARCs, tankyrase recognizes its binders multivalently .

Substrate binding by tankyrase . (a) Domain organization of human tankyrase and tankyrase 2 (modified from [31]). (b) and (c) Examples for ARC–TBM interactions studied by X-ray crystallography . (b) Human TNKS2 ARC4 is shown in surface representation with bound TBM peptides from 3BP2 and MCL1 shown in stick representation with the core TBM octapeptide colored purple and orange, respectively, and by heteroatom. TBM amino acid positions (1–8) and sequences shown. The figure was generated by superimposing the ARCs of the ARC4-3BP2 and ARC4-MCL1 crystal structures (PDB accession codes 3TWR and 3TWU, respectively) onto each other and showing ARC4 of the former [7]. The colored surface areas represent different contact areas, as indicated, that mediate binding of the TBM peptides (Modified from [7] with permission from Elsevier/Cell Press). (c) ARC2 (from ARC2–3) of murine Tnks bound by the N-terminus of murine Axin1 (PDB accession code 3UTM), which contains two TBMs [11]. Each TBM binds one copy each of ARC2 in a dimeric ARC2-3 assembly. The figure was generated by superimposing the two ARC2-3 copies onto each other; the surface of ARC2 bound by the first TBM is shown. TBMs are shown and labeled as in (b). The first TBM, shown in magenta, consists of a continuous stretch of eight amino acids. In the second TBM, shown in green, the Arg at position 1 is followed by a seven-amino-acid insertion (positions +1 to +7), as indicated in the sequences shown. The peptide insertion forms a loop. (d) TBM sequence rules represented by a sequence logo. (Reprinted from [7] with permission from Elsevier/Cell Press.) (e) Sequence alignment of known example TBMs ([7] and references therein, [11, 22, 23, 37,38,39]), colored by identity with conservation graph, generated with ClustalX and Jalview [40, 41]. UniProt IDs are indicated [24]. The asterisk indicates insertion sequences in AXIN1 and AXIN2. The TBMs of 3BP2 , TRF1 (TERF1_HUMAN), and MERIT40 (BABA1_HUMAN), studied as model TBMs here, are highlighted
The TBM has been characterized extensively and a consensus sequence of R-x-x-[small hydrophobic or G]-[D/E]-G-[no P]-[D/E] identified through positional scanning and evaluation of known TBMs [7] (Fig. 1d and e). Paired with structural information from ARC–peptide complexes [7, 11–13], these “sequence rules” provide a valuable tool for identifying tankyrase binders/substrates . Fig. 1b–e gives examples for X-ray crystal structures describing TBM-ARC interactions, summarize the experimentally derived TBM sequence rules, and list known TBMs. Within the motif, the Arg residue at position 1, bound in an extensive “Arg cradle,” is essential, as is Gly at position 6, owing to its unique geometry that is adopted when the residue is sandwiched between two aromatic side chains in the ARC (Fig. 1b, d). At positions 2 and 3, where side chains point away from the ARC, a wide range of amino acids is tolerated. At position 4, a small and/or hydrophobic residue binds a tight hydrophobic sub-pocket. Gly, Pro, Ala, and Cys (in this order of preference) have been found suitable by positional scanning [7], and known TBMs mostly feature Pro and Gly, followed by Ala, Val, Leu, and Cys (Fig. 1e). At position 5, Asp is clearly preferred, with Glu ranked second, but Val, Gln, Tyr, Ile, and Cys were all allowed in positional scanning experiments (Fig. 1b, d) [7]. In line with these observations, Asp and Glu are found at position 5 in the vast majority of known TBMs , followed by Gln, Pro, Ile, and Val (Fig. 1e). Positions 7 and 8 tolerate a wide range of amino acids, with the exception of Pro at position 7, where Pro causes an unfavorable distortion of the peptide backbone (Fig. 1d). At position 8, Asp and Glu are most favored, owing to an electrostatic contact with the ARC , and can balance out the negative contribution made by suboptimal residues at other positions (Fig. 1b, d) [7]. Recent structural and biophysical studies suggest that the spatial organization of the five ARCs and the positioning of multiple TBMs within a subset of tankyrase binders encode another determinant of tankyrase binding [13].
Among the tankyrase–substrate relationships most extensively studied to date are those with AXIN (axis inhibition protein, AXIN1 , AXIN2), scaffolding proteins involved in Wnt signaling [11, 14], the telomeric protein TRF1 (telomeric repeat-binding factor 1, official gene name TERF1) [12, 15], and the signaling adaptor protein 3BP2 (SH3 domain-binding protein 2, official gene name SH3BP2) [7, 16]. Many more tankyrase binders/substrates have been identified, and the list of known interactors keeps expanding [5]. An in silico prediction of tankyrase binders gives reason to anticipate a broad involvement of tankyrase in a wide range of biological functions [7]. To understand the complex biological roles of tankyrase, also in light of the considerable interest in tankyrase as a potential therapeutic target [5, 17], we require insights into the complement of tankyrase-binding proteins in the proteome.
Here, we outline a hierarchical three-step candidate approach for identifying tankyrase binders and substrates, providing further experimental detail on the method reported previously [7]. Step 1 constitutes TBM prediction, step 2 the evaluation of TBMs as direct ARC binders by fluorescence polarization (FP), and step 3 the validation of tankyrase binding and tankyrase-dependent PARylation in the full-length protein context. We chose two model proteins: the first identified tankyrase binder , TRF1 [15], and a novel tankyrase binder, MERIT40 (Mediator of RAP80 interactions and targeting subunit of 40 kDa, official gene name BABAM1), which was identified by the approach presented here [7]. The TBM from 3BP2 serves as an additional example in the FP assay [7]. As part of step 2, we present a general method for the expression and purification of TNKS and TNKS2 ARCs from Escherichia coli (Table 1). ARCs 1, 4, and 5 can be produced as individual domains . ARCs 2 and 3 are insoluble when produced independently; however, they can be produced as a double ARC2-3 construct. Moreover, the entire tankyrase N-termini with all five ARCs can be generated [7, 13]. Proteins are expressed with a cleavable N-terminal His6-GST tag , which enables simple affinity purification , minimally followed by size exclusion chromatography upon tag removal. The subsequent FP assay uses a candidate TBM peptide, synthesized with a fluorescent label such as fluorescein , to directly measure the binding affinity to a tankyrase ARC or a set of ARCs . In this assay, the fluorescent peptide probe is excited by polarized light . The light emitted by an unbound probe loses most of its polarization due to its rapid motion in solution. When bound to an ARC, movement of the peptide is slowed down and a high degree of polarization retained in the emitted light. Titration of tankyrase ARCs at a constant probe concentration allows the dissociation constant (Kd) to be determined [7, 18,19,20]. Upon confirmation of the isolated TBM , further validation of the candidate tankyrase binder requires an assessment of tankyrase binding and substrate PARylation using full-length proteins (step 3). We present details for a straightforward assay based on co-expression in HEK293T cells , co-immunoprecipitation and the detection of PAR in the immunoprecipitates, using PAR-binding antibodies [7].
2 Materials
Unless the supplier is explicitly mentioned, chemicals are typically obtained from Sigma-Aldrich.
2.1 Protein Expression
-
1.
Inducible bacterial expression constructs for affinity-tagged tankyrase ARCs (TNKS: NM_003747.2; TNKS2: NM_025235.2; see Table 1 for construct details; see Note 1 ).
-
2.
BL21-CodonPlus (DE3)-RIL E. coli chemically competent cells (Agilent Technologies) (see Note 2 ).
-
3.
“Lysogeny Broth” (LB) agar plates , supplemented with kanamycin (50 μg/mL) and chloramphenicol (34 μg/mL).
-
4.
LB medium (100 mL for overnight starter culture).
-
5.
“Terrific Broth” (TB) medium (4–8 L for large-scale expression).
-
6.
1000× stock solutions of antibiotics : 50 mg/mL kanamycin (in H2O) and 34 mg/mL chloramphenicol (in isopropanol ).
-
7.
Shaking incubators capable of a temperature range of at least 18–37 °C.
-
8.
Erlenmeyer flasks (250 mL) for pre-cultures, baffled Erlenmeyer flasks (2 L) for large-scale expression.
-
9.
Isopropyl β-d-1-thiogalactopyranoside (IPTG , 1 M stock solution)
-
10.
Refrigerated centrifuge for harvesting large volumes of bacterial cultures (4000 × g, e.g., Beckman Coulter Avanti J-26XP with JLA 8.1000 rotor).
-
11.
Liquid nitrogen bath.
-
12.
50 mL Falcon tubes or plastic film with thermal sealer for storage of bacterial pellets .
2.2 Protein Purification
-
1.
Protease inhibitors , such as Pierce protease inhibitor tablets, EDTA-free (Thermo Fisher Scientific).
-
2.
Lysozyme , 40 mg/mL stock.
-
3.
Sonicator fitted with a large probe or homogenizer capable of breaking bacterial cells .
-
4.
Ultra-filtered H2O.
-
5.
Cell lysis buffer: 50 mM Tris–HCl pH 7.5, 500 mM NaCl , 5 mM β-mercaptoethanol . Add protease inhibitor tablets and lysozyme (100 μg/mL final concentration) immediately before use.
-
6.
Refrigerated centrifuge for removing insoluble lysate fraction (30,000 × g, e.g., Beckman Coulter Allegra 64R with F0650 rotor).
-
7.
5.0 μm syringe filter units.
-
8.
5 mL HisTrap HP Ni2+ affinity column (GE Healthcare, see Note 3 ).
-
9.
Peristaltic pump .
-
10.
Vacuum pump and bottle filters (0.22 μm) for filtering and degassing buffers.
-
11.
Buffer A for Ni2+ affinity column: 50 mM Tris–HCl pH 7.5, 500 mM NaCl , 5 mM β-mercaptoethanol , 10 mM imidazole pH 7.5—filtered and degassed.
-
12.
Buffer B for Ni2+ affinity column : 50 mM Tris pH 7.5, 500 mM NaCl , 5 mM β-mercaptoethanol, 250 mM imidazole pH 7.5—filtered and degassed.
-
13.
FPLC system with buffer gradient capabilities , UV absorbance detector and fraction collector (e.g., ÄKTA Purifier, GE Healthcare).
-
14.
5 mL HiTrap Q HP column (GE Healthcare).
-
15.
Buffer A for Q column: 50 mM Tris–HCl pH 7.5, 100 mM NaCl , 5 mM β-mercaptoethanol—filtered and degassed.
-
16.
Buffer B for Q column: 50 mM Tris–HCl pH 7.5, 1.5 M NaCl , 5 mM β-mercaptoethanol—filtered and degassed.
-
17.
Dialysis buffer: 50 mM Tris–HCl pH 7.5, 100 mM NaCl, 5 mM β-mercaptoethanol (see Note 11) .
-
18.
Dialysis tubing, 3500 Da molecular weight cutoff (MWCO).
-
19.
Dialysis tubing clips.
-
20.
2 L beaker, magnetic stirrer plate, stirrer bar.
-
21.
TEV protease , 5 mg/mL stock.
-
22.
15 mL spin protein concentrator, 3000 Da MWCO for single-ARC constructs, 10,000 Da MWCO for double-ARC constructs, 30,000 Da MWCO for ARC1-5 constructs .
-
23.
Refrigerated centrifuge for concentrating protein (3200 × g, e.g., Beckmann Coulter Allegra X12-R centrifuge with SX4750 swinging bucket rotor).
-
24.
Refrigerated centrifuge for removing precipitate prior to size exclusion chromatography (18,000 × g, e.g., Eppendorf 5417R with F45-30-11 rotor).
-
25.
HiLoad 16/600 Superdex 75 or 200 pg size exclusion column (GE Healthcare, see Note 4 ).
-
26.
Tris(2-carboxyethyl)phosphine (TCEP) , 0.5 M stock (see Note 5 ).
-
27.
Size exclusion buffer: 25 mM HEPES-NaOH pH 7.5, 100 mM NaCl , 2 mM TCEP—filtered and degassed (see Notes 6 and 11 ) .
-
28.
96-deep-well blocks for fraction collection, or fraction collector tubes (depending on the format of the fraction collector).
-
29.
UV spectrophotometer.
-
30.
4× SDS sample buffer.
-
31.
15% polyacrylamide gels for SDS-PAGE .
-
32.
Protein standard for SDS-PAGE.
-
33.
Coomassie stain for SDS-PAGE gels.
-
34.
15 mL and 50 mL Falcon tubes .
-
35.
Thin-walled individual 0.2 mL PCR tubes for flash-freezing protein aliquots.
-
36.
Liquid nitrogen bath.
2.3 Fluorescence Polarization (FP) Assay
-
1.
Plate reader capable of taking FP measurements (e.g., BMG Labtech POLARstar Omega).
-
2.
Appropriate wavelength filters for chosen fluorophore , one corresponding to excitation wavelength, and two (ideally a matched pair with identical optical properties), corresponding to the emission wavelength. Here, we use a 485 nm excitation filter and two matched 520 nm emission filters for fluorescein .
-
3.
Opaque, black, 384-well, non-binding, flat-bottom plates, either in standard format (e.g., 781,900, Greiner Bio-One) or in small-volume format (e.g., 784,900, Greiner Bio-One). The latter are particularly useful if limited protein is available.
-
4.
Microplate centrifuge (1000 × g, e.g., Beckman Coulter Allegra X-12R with SX4750 swinging bucket rotor, fitted with microplate inserts)
-
5.
FP assay buffer: 25 mM HEPES–NaOH pH 7.5, 100 mM NaCl , 1 mM TCEP , 0.05% w/v 3-[(3-cholamidopropyl)dimethylammonio]-1-propanesulfonate hydrate (CHAPS) (see Notes 7 and 11 ).
-
6.
Fluorescently tagged peptide corresponding to TBM of potential tankyrase binder/substrate , 2× stock (50 nM for a final assay concentration of 25 nM) in FP assay buffer. In the present examples (3BP2 , MERIT40 , TRF1 ), fluorescein and 5(6)-carboxyfluorescein are used as fluorophores . The peptides have been described previously [7]. We recommend peptides of minimally the TBM octapeptide with one flanking amino acid on either side. The peptides used here are longer (see Fig. 3b for peptide sequences). The fluorescein fluorophore is linked via β-Ala, which also provides an additional linker to minimize potential steric interference of the fluorophore with the peptide-ARC interaction (see Note 8 ).
-
7.
Tankyrase ARC protein: 2× stock of twofold dilution series, 0–400 μM, (final assay concentrations of 0–200 μM protein) in FP assay buffer .
-
8.
Software for curve fitting and analysis (e.g., GraphPad Prism 6).
2.4 Binding and PARylation of Full-Length Candidate Proteins by Tankyrase in Cells
-
1.
Mammalian expression constructs for epitope-tagged (e.g., MYC2) tankyrases (TNKS: NM_003747.2; TNKS2: NM_025235.2) and epitope-tagged (e.g., FLAG ) tankyrase-binding protein candidates (here for TRF1 /TERF1: NM_017489.2 and MERIT40 /BABAM1: NM_001033549.2), corresponding empty vectors as controls .
-
2.
QuikChange Lightning mutagenesis kit (Agilent Technologies) or individual components from other sources for site-directed mutagenesis .
-
3.
Mutagenesis primers to mutate putative TBM (recommended mutation : G6R).
-
4.
PCR thermal cycler, standard setup and reagents for recombinant DNA techniques .
-
5.
Human Embryonic Kidney (HEK) 293T cells (ATCC).
-
6.
10 cm and 15 cm cell culture dishes.
-
7.
Hemocytometer or automated cell counter.
-
8.
Dulbecco’s Modified Eagle’s Medium (DMEM) .
-
9.
Fetal bovine serum (FBS ).
-
10.
Humidified cell culture incubators at 37 °C, 5% CO2 .
-
11.
0.2% Versene in PBS (137 mM NaCl , 2.7 mM KCl , 8 mM Na2HPO4, 1.5 mM KH2PO4 , 537 μM EDTA, 80 μM phenol red , final pH adjusted to 7.2, sterilization-autoclaved; all reagents cell-culture grade).
-
12.
0.05% trypsin in Versene (137 mM NaCl , 2.7 mM KCl, 8 mM Na2HPO4, 5.5 mM D-glucose , 1.5 mM KH2PO4 , 25 mM Tris, 1% phenol red, 0.5 g trypsin (1:250) per 1 L, 137 μM streptomycin sulfate, 168 μM benzyl penicillin, final pH adjusted to 7.5, filter-sterilized using a 0.22 μm filter).
-
13.
Ultra-filtered sterile H2O .
-
14.
Calcium phosphate transfection reagents (all cell culture grade):
-
(a)
2× HEPES-buffered saline (HBS) : 50 mM HEPES , 10 mM KCl , 280 mM NaCl , 1.5 mM Na2HPO4, 12 mM glucose, final pH adjusted to 7.05 with KOH , filter-sterilized and stored at 4 °C.
-
(b)
25 mM chloroquine diphosphate , filter-sterilized and stored at −20 °C (1000× stock).
-
(c)
2 M CaCl2 , filter-sterilized and stored at 4 °C.
-
(a)
-
15.
Phosphate-buffered saline (PBS) .
-
16.
Cell scraper .
-
17.
Refrigerated centrifuge for collecting mammalian cells (300 × g, e.g., Beckmann Coulter Allegra X-12R with SX4750 swinging bucket rotor).
-
18.
Radioimmunoprecipitation assay (RIPA) buffer : 50 mM HEPES–NaOH pH 7.5, 150 mM NaCl , 1% Triton X-100 , 0.5% sodium deoxycholate , 0.1% SDS , 1 mM DTT , 2 μM ADP-HPD PARG inhibitor and protease inhibitors (e.g., Pierce protease inhibitor tablets, EDTA-free , Thermo Fisher Scientific). Add DTT, ADP-HPD, and protease inhibitors immediately before use.
-
19.
Sonicator fitted with small probe.
-
20.
Refrigerated centrifuge for clearing lysates and settling affinity resin (800–18,000 × g, e.g., Eppendorf 5417R with F45-30-11 rotor).
-
21.
Anti-FLAG M2 Agarose resin .
-
22.
Vacuum pump with inlet trap and collection flask for aspirating buffer.
-
23.
SDS-PAGE gels (e.g., 4–15% Tris–glycine polyacrylamide gradient gels for excellent resolution ).
-
24.
Electrophoresis apparatus for the above and appropriate power supply.
-
25.
4× SDS sample buffer.
-
26.
Protein standard for SDS-PAGE .
-
27.
Nitrocellulose transfer membrane.
-
28.
Wet transfer Western blotting apparatus and appropriate power supply.
-
29.
Ponceau S solution .
-
30.
Nonfat dry milk powder .
-
31.
Mouse monoclonal anti-FLAG M2 HRP-conjugated antibody (here 1 mg/mL), mouse monoclonal anti-MYC (9E10) HRP-conjugated antibody (here 1 mg/mL), rabbit polyclonal anti-PAR (4336-BPC-100, Trevigen, concentration not specified by supplier), goat anti-rabbit IgG (H+L) secondary antibody , HRP-conjugate (here 0.8 mg/mL) (see Note 9 ).
-
32.
ECL Western blotting substrate .
-
33.
X-ray film for Western blot detection or alternative ECL detection setup.
3 Methods
The details of many standard experimental methods not addressed here can be found in [21].
3.1 Predicting Tankyrase Binders
Experimental approaches such as yeast-two-hybrid analysis [22] or co-immunoprecipitation coupled with tandem mass spectrometry [23] have been used to identify proteins present in complexes with tankyrase. It is desirable to pinpoint those proteins that directly interact with tankyrase. The existence of putative TBMs is the most reliable known indicator for direct interaction. Based on previously identified TBM sequence rules and structural information, we provide a guide to identifying strong TBM candidates for further validation . A previously generated list of ranked octapeptide motifs across the entire human proteome can be used [7]. Here, we recapitulate a simple step-by-step approach for identifying candidate TBMs without the need for specialized bioinformatics beyond the use of established programs and databases.
-
1.
Screen your protein of interest for potential TBMs . In an initial step, a search for Arg and Gly spaced 6 amino acids apart (i.e., with four amino acids in between, RxxxxG) will suffice. See step 4 below for atypical TBMs.
-
2.
Using UniProt (http://www.uniprot.org), assess the topology of the protein and whether the candidate motif would be located in the cytoplasm or nucleoplasm, accessible to tankyrase [24]. The relevant information can be found under Subcellular location > Topology.
-
3.
Assess the occurrence of disordered stretches in your protein of interest. TBMs must be present in unstructured regions of the protein to be accessible to tankyrase and must not be part of a stable α-helix or β-strand. Secondary structure information, obtained from the Protein Data Bank [25], is available in UniProt (http://www.uniprot.org) under Structure > Secondary structure [24]. It remains possible that TBMs are present within loops of structured protein domains. If no structural information is available, a disorder predictor such as IUPred (http://iupred.enzim.hu) may be used to obtain an indication of protein disorder [26].
-
4.
Assess the short-listed sequences for their suitability as TBMs . REAGDGEE has been found to be the optimal 8-amino-acid TBM by positional scanning [7], but many TBMs only span six amino acids (positions 1–6). While the sequence rules from positional scanning prove valuable in predicting TBMs, it should be noted that some of their aspects may be specific to the context of the 3BP2 TBM peptide , which positional scanning was performed on [7]. Whereas Arg and Gly at positions 1 and 6, respectively, are essential, other residues are important as well, with the exception of positions 2 and 3, which can likely be ignored since they do not contribute to binding and mainly fulfil spacing roles (Fig. 1b, d). Please refer to the motif description under Subheading 1 for the assessment. Of note, a large or strongly charged amino acid at position 4 very likely disqualifies the TBM candidate as a genuine tankyrase binder . Furthermore, Asp and Glu at position 8 can compensate for unfavorable amino acids at other positions [7], as seen in one of the TBMs of AXIN1 /2, where a suboptimal Val at position 4 appears to be counterbalanced by a Glu at position 8 (Fig. 1e) [7, 11]. Interestingly, a second TBM in AXIN1/2 shows that the Arg, normally at position 1, can be placed further N-terminal, resulting in looping-out of the “inserted” residues (Fig. 1c, e). Likewise, the E3 ubiquitin ligase RNF146 has been proposed to contain numerous atypical TBMs with a nonconventional positioning of the Arg [27], and it is possible that a distal Arg is required for weak binding of the TBM of GRB14 to tankyrase (Fig. 1e) [7, 8, 28]. Thus, the possibility of a distal Arg residue should be taken into consideration. It is likely that such extended TBMs display a weaker affinity for tankyrase. Numerous tankyrase binders contain multiple TBMs, such as AXIN1 /2 [11] and MERIT40 [7] (see below). Since avidity effects likely contribute to binding of these proteins to tankyrase, the affinity of some of these individual TBMs for the ARC may be lower, and this may be reflected in deviations from the “optimal” sequence.
3.2 Validating TBMs by Fluorescence Polarization (FP)
3.2.1 Expression of Tankyrase ARCs
cDNA sequences encoding TNKS or TNKS2 ARC constructs are cloned into a pETM-30-2 expression vector (or similar vector) to generate fusion proteins with an N-terminal His6-GST tag followed by a TEV protease cleavage site (ENLYFQG) [7]. See Table 1 for suggested ARC boundaries [7]. Chemically competent BL21-CodonPlus (DE3)-RIL E. coli cells for protein expression are transformed with sequence-validated plasmids . A single colony is selected to inoculate an overnight pre-culture, which is then used to inoculate the larger expression cultures (typically 4–8 L). The cultures are grown shaking at 37 °C to exponential phase, then cooled at 4 °C for 30 min before induction with IPTG overnight at 18 °C. The cells are then collected by centrifugation . Purification can either follow immediately, or cell pellets can be stored at −80 °C until processed for purification .
-
1.
Transform chemically competent BL21-CodonPlus (DE3)-RIL E. coli cells with tankyrase ARC expression constructs by heat shock . Plate cells on LB agar plates containing suitable antibiotics , here kanamycin (50 μg/mL) and chloramphenicol (34 μg/mL) (see Notes 1 and 2 ). Incubate overnight at 37 °C.
-
2.
Pick a single colony from the plate and inoculate an overnight pre-culture of LB medium (100 mL) supplemented with 50 μg/mL kanamycin and 34 μg/mL chloramphenicol . Incubate overnight in a shaking incubator at 37 °C .
-
3.
Add 5 mL of the pre-culture to each liter of TB medium supplemented with 50 μg/mL kanamycin and 34 μg/mL chloramphenicol . Generally, the yield for individual TNKS and TNKS2 ARC constructs is 6–10 mg/L of culture.
-
4.
Incubate cultures at 37 °C with shaking at 180 rpm until an optical density at 600 nm (OD600) of approximately 2.0 is reached. Remove cultures from incubator and cool them at 4 °C for 30 min (see Note 10 ).
-
5.
Add IPTG to a final concentration of 0.5 mM (0.5 mL of 1 M stock per liter of culture) to induce protein production . Incubate cultures at 18 °C with shaking overnight (≈15 h).
-
6.
Collect cells by centrifugation in a precooled centrifuge at 4 °C for 30 min at 4000 × g.
-
7.
Discard supernatant. The cells can be lysed for immediate purification. Alternatively, pellets can be flash-frozen in a liquid nitrogen bath for storage at −80 °C until required .
3.2.2 Purification of Tankyrase ARCs
A similar procedure is followed for the purification of all tankyrase ARCs. All buffers are ice-cold, and work is performed at 4 °C or on ice throughout. In the first step, the protein is affinity-purified by immobilized metal affinity chromatography (IMAC) using a Ni2+ affinity column . The affinity tag is then cleaved overnight using TEV protease , under simultaneous dialysis to remove imidazole from the elution step. A second Ni2+ affinity chromatography step separates the cleaved tag from the protein. An optional anion exchange chromatography step removes further impurities. Finally, size exclusion chromatography yields high-quality purified protein for downstream applications. The general procedure is applicable to all TNKS and TNKS2 ARCs with small changes (Fig. 2a; see Note 11 ).
-
1.
Dissolve protease inhibitor tablets in the required volume of lysis buffer (approximately 20 mL of buffer for every 10 g of cell pellet) and add lysozyme (100 μg/mL final) in a large glass beaker containing a magnetic stirrer bar. Add frozen cell pellet and stir gently until cells are completely thawed and a homogeneous suspension is obtained.
-
2.
Break cells by using a large-tip sonicator at 40% amplitude output, using a 5 s on, 5 s off pulse, for a total of 5 min “on” time. Keep cells on ice continuously to avoid overheating (see Note 12 ). Take a sample of the total lysate for subsequent analysis by SDS-PAGE (9 μL lysate + 3 μL 4× SDS sample buffer).
-
3.
Remove cell debris and insoluble material by centrifugation at 30,000 × g for 30 min. If lysate is still cloudy , centrifuge for a further 30 min until clear.
-
4.
While the lysate is being cleared, prepare a 5 mL HisTrap Ni2+ affinity column by washing with 10 column volumes (CV) of H2O and then equilibrating with 10 CV of buffer A for Ni2+ affinity column, using a low-pressure peristaltic pump, set to a flow rate of 2 mL/min (see Note 3 ).
-
5.
Decant the supernatant into a beaker, and sonicate on ice, 5 s on, 5 s off for a total of 20 s “on” time to further break up genomic DNA and avoid clogging the filter in the next step .
-
6.
Filter the supernatant through 5.0 μm syringe filter units. Take a sample of the soluble lysate for subsequent analysis by SDS-PAGE (9 μL lysate + 3 μL 4× SDS sample buffer). Load the cleared lysate on the equilibrated HisTrap column using the peristaltic pump as before (see Note 13 ). The His6-GST-tagged protein will bind to the immobilized Ni2+ ions. Wash the column with 20 CV of buffer A (100 mL) to remove unbound contaminants. Collect lysate flow-through and the wash buffer in case the protein was not bound or was released during the wash, and take samples for analysis by SDS-PAGE (9 μL flow-through or wash + 3 μL 4× SDS sample buffer).
-
7.
Attach the HisTrap column to an FPLC system, and elute the His6-GST-ARC protein with the following three-step protocol, at a flow rate of 2 mL/min, collecting 1.5 mL fractions in a 96-deep-well block:
step 1: 100% buffer A for 2 CV .
step 2: gradient from 0–100% buffer B over 20 CV.
step 3: 100% buffer B for 4 CV.
-
8.
Take samples of each peak elution fraction (9 μL of eluate + 3 μL 4× SDS sample buffer). Analyze the samples taken in steps 2 and 6 (2 μL of sample for lysates and flow-through, 5 μL of sample for wash) and the peak elution fractions (5 μL of sample) by SDS-PAGE (Fig. 2b).
-
9.
Pool fractions containing ARC fusion protein . Take a sample of the pooled fractions (9 μL of protein + 3 μL 4× SDS sample buffer). Add TEV protease (approximately 100 μL of 5 mg/mL stock for every 25 mL fusion protein solution) to cleave the tag.
-
10.
Soak dialysis tubing (3500 Da MWCO) in dialysis buffer, and seal one end with a dialysis membrane clip. Transfer the protein into the dialysis tubing and seal the other end. More than one dialysis tube may be required. Dialyze overnight in a 2 L glass beaker containing dialysis buffer, with gentle stirring at 4 °C. Avoid contact between the stirrer bar and the dialysis tubing to prevent rupture .
-
11.
Pour content of dialysis tubing into 50 mL Falcon tubes . Centrifuge at 3200 × g for 15 min to remove any precipitate that may have formed. Take a sample of the protein post-TEV cleavage (9 μL of protein + 3 μL 4× SDS sample buffer). White precipitate often forms overnight with the change to low-salt buffer. SDS-PAGE analysis of the precipitate reveals it to be enriched in a contaminant (not shown).
-
12.
Meanwhile, wash a 5 mL HisTrap column with 10 CV of H2O . Next, equilibrate the column in 10 CV of dialysis buffer. Filter the supernatant through a 0.22 μm syringe filter and load it onto the equilibrated HisTrap column using the low-pressure peristaltic pump. Collect the flow-through. The untagged ARC protein will pass through, while the cleaved tag (or residual His6-GST-ARC fusion protein ) will be retained on the column (see Note 14 ). Wash with 2 CV of dialysis buffer to fully remove all ARC protein from the column, collecting the wash. Take samples of the flow-through and wash (9 μL of protein + 3 μL 4× SDS sample buffer).
-
13.
Analyze 5 μL of the pre-TEV sample, post-TEV sample and flow-through/wash samples from the second Ni2+ column by SDS-PAGE to assess successful tag removal and separation (Fig. 2c).
-
14.
Take the protein-containing samples (flow-through/wash) and concentrate the protein to about 20 mL by centrifuging in a 3000 Da MWCO spin concentrator at 3200 × g for 30 min at a time in a swinging bucket rotor. Mix by gently pipetting up and down to prevent a steep concentration gradient from forming in the concentrator. Take a sample of the concentrated protein (9 μL of protein + 3 μL 4× SDS sample buffer).
-
15.
The following anion exchange chromatography step is optional, but was found to increase the purity of ARC proteins, especially TNKS2 ARC5, by removing a higher-molecular-weight impurity. Using the peristaltic pump at 2 mL/min , wash a 5 mL HiTrap Q HP column with 5 CV of H2O, followed by 5 CV of buffer B for Q column, and then equilibrate with 10 CV of buffer A for Q column. Pass the concentrated protein over the column, and collect the flow-through. Wash the column with 2 CV of buffer A for Q column, also collecting the flow-through. ARCs do not bind to the Q column; however, the impurity does and will be retained on the column (see Note 15 ). Take a sample of the combined flow-through and wash (9 μL of protein + 3 μL 4× SDS sample buffer). Analyze 5 μL of the samples from step 14 and this step by SDS-PAGE as above (Fig. 2d).
-
16.
Concentrate the protein as in step 14, to ≤2 mL.
-
17.
Centrifuge protein in a microcentrifuge tube at 18,000 × g for 10 min to remove any particles before size exclusion chromatography .
-
18.
Load the concentrated protein onto an equilibrated size exclusion column connected to an FPLC system , using a 2 mL sample loop (see Note 4 ). Elute the protein isocratically, using 1.2 CV of size exclusion buffer. Collect 1 mL fractions in a 96-deep-well block.
-
19.
Take samples of the input material and peak fractions (9 μL input or fraction + 3 μL 4× SDS sample buffer). Analyze 5 μL of the samples by SDS-PAGE (Fig. 2e).
-
20.
Combine fractions containing pure protein. Wash the membrane of a spin concentrator by spinning through one concentrator volume of H2O to remove any stabilizing agents such as glycerol and azide. Now concentrate the protein using the pre-washed spin concentrator as described above (step 14) until a concentration of >0.5 mM is achieved (solubility of multi- ARC constructs can be lower). The concentration can be determined by measuring the UV absorbance at 280 nm and using the molar extinction coefficient calculated by ProtParam ( http://web.expasy.org/protparam/ ) [29].
-
21.
Aliquot the protein into small volumes in thin-walled PCR tubes and flash-freeze them in a liquid nitrogen bath. Frozen protein aliquots can be stored at −80 °C until future use.

Purification of tankyrase ARCs. (a) 5 μg purified TNKS and TNKS2 ARCs were resolved on 15% Tris–glycine polyacrylamide gels for SDS-PAGE and the gels stained with Coomassie. M, marker. See Table 1 for construct boundaries. (b)-(e) Step-by-step purification of a representative ARC, TNKS2 ARC5. (b) Ni2+ affinity purification of His6-GST-TNKS2 ARC5 fusion protein . T, total lysate; S, soluble lysate; FT, flow-through; W, wash. (c) Removal of the His6-GST affinity tag by TEV cleavage and a second Ni2+ affinity purification step. Pre-TEV, protein before TEV cleavage; Post-TEV, protein after TEV cleavage; S, pooled protein after subtraction of affinity tag . (d) Anion exchange chromatography . Pre-Q, protein before anion exchange chromatography; Post-Q, protein after anion exchange chromatography. (e) Size exclusion chromatography . M, marker; I, input
3.2.3 Fluorescence Polarization Assay for TBM Validation
This assay measures the direct binding of a fluorescently labeled TBM candidate peptide to a tankyrase ARC [7]. The ARC protein is titrated at a constant peptide probe concentration, and the change in polarization (ΔFP) is measured and plotted. Plotting ΔFP values against [ARC] enables a dissociation constant (Kd) to be calculated. In the present example, we use fluorescein-based peptide labels, but the general method can be adapted for different fluorophores .
-
1.
Ensure the plate reader is set up for fluorescence polarization, with the correct filters for the fluorophore . The fluorescein example uses a 485 nm excitation filter and two 520 nm emission filters, one parallel and one perpendicular to the plane of the linearly polarized light used for excitation.
-
2.
Dissolve the lyophilized peptide probe in FP assay buffer, to approximately 100 μM. The concentration can be measured spectrophotometrically (see Note 16 ). Here, we measure the absorbance of the peptide stock at 492 nm and use a molar extinction coefficient for fluorescein of ε492 = 83,000/M/cm [30]. The concentrated probe can then be aliquoted into small volumes (5–10 μL) and flash-frozen in liquid nitrogen for long-term storage at −80 °C, to be thawed when required.
-
3.
Determine the optimal probe concentration to use. This will depend on the sensitivity of the plate reader. FP values should be independent of the probe concentration used, and give a robust signal window for an unbound vs. protein-bound peptide. Make 2× stocks of a twofold dilution series of probe in FP buffer, from 0–800 nM (10 concentrations + no peptide). It is often easier to make a 1/100 dilution of the concentrated peptide stock to avoid pipetting small volumes. Total sample volumes per well are either 15 or 50 μL (see step 5 below).
-
4.
Prepare a 2× protein stock solution, by diluting tankyrase ARC protein in FP buffer to 20 μM (10 μM final protein concentration). The protein concentration should be in vast excess over the peptide probe to obtain a first impression of the anticipated signal window between free and protein-bound peptide probe .
-
5.
Plate out the assay samples in technical duplicate (see Table 2, Note 17 ). Small-volume plates will require 15 μL per well (7.5 μL of each stock), standard-volume plates 50 μL per well (25 μL of each stock). Mix the probe stock solution 1:1 with either FP buffer for the peptide probe-only titration or protein stock for the titration in the presence of protein . Add a “blank” well with FP buffer only. A well with 5 nM fluorescein (literature FP of 35 millipolarization units, mP) can be used as a standard to automatically set the gain adjustment of the plate reader. Temporarily seal the plate with adhesive film or a lid and spin at 1000 × g for 1 min in a swinging bucket rotor with plate inserts. Incubate in the dark at room temperature for 30 min to ensure binding equilibrium is reached.
Table 2 Example plate layout for establishing the probe concentration in a fluorescence polarization assay.Rows B and C correspond to 3BP2 peptide titrations (here up to 400 nM) in the absence of protein, while rows D and E correspond to 3BP2 peptide titrations in the presence of protein. Numbers correspond to final fluorophore concentration (nM). Blank wells contain buffer alone. Standard wells contain 5 nM of free fluorescein . Wells along the edge of the microplate (row A and column 1) are left empty to minimize the “edge effect” (see Note 17 ) -
6.
Set the gain adjustment of the instrument. The POLARstar Omega automatically calculates the gain by scaling the FP value to 35 mP for the wells containing 5 nM free fluorescein . 50 flashes per well is a good starting point to minimize fluorophore bleaching, and means each data point will be the average of 50 measurements.
-
7.
Read the plate and calculate FP in mP. Some plate readers and software packages will automatically blank-correct and calculate the FP values. If not, subtract the averaged F_parallel and F_perpendicular readings obtained for the blank wells from the corresponding individual values of the other wells. FP values are calculated using the following equation:
\( FP \ (mP)=\frac{\left( F\_ parallel- F\_ perpendicular\right)}{\left( F\_ parallel+ F\_ perpendicular\right).} \)
F_parallel and F_perpendicular denote the fluorescence intensities parallel and perpendicular to the plane of the linearly polarized light used for excitation. mP, millipolarization units.
-
8.
Export the FP data and raw fluorescence intensity values. Plot the data (average FP vs. [probe]) using GraphPad Prism or your data analysis program of choice (Fig. 3a).
Fig. 3 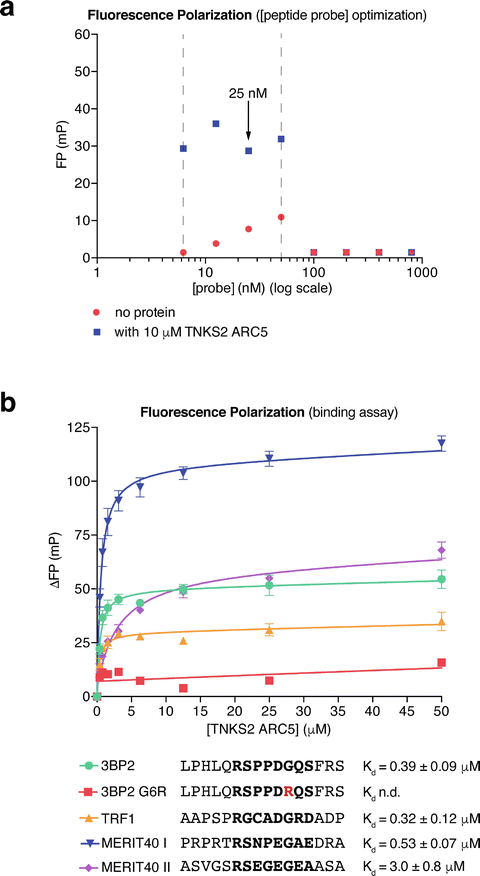
Assessing ARC–TBM peptide interactions by fluorescence polarization . (a) Optimization of the peptide probe (3BP2 ) concentration for the FP binding assay . Data are from one experiment performed in technical duplicate with mean FP values plotted. The dashed vertical lines indicate the suitable peptide probe concentration range. 25 nM was chosen for the subsequent assays. (b) FP binding assays for the TBM peptides from TRF1 , MERIT40 , and 3BP2 (WT positive control and G6R negative control). Peptide sequences (with octapeptide in bold) and affinities for TNKS2 ARC5 are indicated. n = 3 separate experiments; error bars, SEM. The error values for the dissociation constants correspond to the standard error of the fit in nonlinear regression. n.d., not determined (no binding curve)
-
9.
Determine the minimum probe concentration required. Raw fluorescence intensity values of >10× the blank reading are necessary to calculate accurate FP values. In the example shown in Fig. 3a, fluorescence intensity values measured with probe concentrations below 6.25 nM were too low and therefore excluded.
-
10.
Determine the maximum probe concentration. The FP values will drop sharply when the signal overloads the detectors. In this case, both detectors reach saturation, so the fluorescence intensities registered in the parallel and perpendicular channels will be identical, and hence the FP calculated will be zero. In the example shown in Fig. 3a, 50 nM is the maximum usable peptide probe concentration. FP readings between 6.25 and 50 nM probe are approximately constant.
-
11.
Peptide probe concentrations should be kept as low as reasonably possible. Thus, the peptide concentration can be ignored in Kd calculations. 25 nM probe was chosen for the protein titration experiments shown below . Prepare a 2× probe stock solution (50 nM in FP buffer). Prepare a twofold dilution series of tankyrase ARC protein from 0–400 μM (0–200 μM final concentration) in FP buffer. The maximum protein concentration may be lowered if B max is reached at low protein concentrations , i.e., in the case of high affinity. An initial maximum [ARC] of 200 μM ensures that binding can be detected for weak binders as well.
-
12.
Set up a binding experiment for Kd determination. Mix the probe and protein stock solution 1:1 to give a final well volume of 15 μL (7.5 μL of each stock solution, small-volume plates). Centrifuge the plate as in step 5 above. Incubate the plate in the dark at room temperature for 30 min to achieve equilibrium before measurement.
-
13.
Calculate FP as in step 7 above and export the raw fluorescence and calculated FP values.
-
14.
Enter the individual FP values into GraphPad Prism or your data analysis program of choice.
-
15.
Baseline-correct by subtracting the FP value for the zero-protein well from all other values in that row, to obtain ΔFP values. Calculate the mean of the technical duplicates. Plot ΔFP against [protein]. Perform a nonlinear regression analysis, using a one-site total binding model :
ΔFP = B max × [ARC]/(K d + [ARC]) + NS × [ARC] + Background
B max denotes the maximum specific binding in mP, where the binding curve saturates; K d is the dissociation constant ; NS denotes the slope of nonspecific binding in ΔFP/[ARC] units; Background denotes the baseline ΔFP value, which should be zero. Although it is possible to constrain the background to zero, it is advisable to retain the background term since the baseline is defined by more values than that from the zero-protein sample.
Non-binding peptides will give a straight line of nonspecific binding . Binding peptides will give a logarithmic curve (Fig. 3b). This analysis will yield a Kd value.
-
16.
Repeat the experiment to obtain pooled data from (typically three) separate experiments . In each separate experiment, technical duplicates are combined into a single data point. Error bars (SEM) are calculated for the mean data points from the separate experiments (Fig. 3b). The peptides from 3BP2 , TRF1 , and MERIT40 (two peptides) bind TNKS2 ARC5 with the indicated affinities, while no binding is detectable for the G6R negative control peptide from 3BP2 (Fig. 3b).

3.3 Validation of Tankyrase Binding and PARylation in Full-Length Protein Context
This final section outlines a step-by-step approach to assess and validate the full-length candidate protein interaction with full-length tankyrase and the extent of its tankyrase-dependent PARylation . Mammalian expression constructs for MYC2-tagged TNKS2 (pLP-dMYC SD-TNKS2) and FLAG- or FLAG3-tagged candidate interacting proteins (pCMV-FLAG-MERIT40 and pLP-tripleFLAG SD-TRF1 ) are generated. Standard site-directed mutagenesis is performed to mutate the Gly at position 6 of the FP-validated TBMs to Arg. The FLAG-tagged candidate proteins and corresponding TBM mutant derivatives are next used as “baits” in co-immunoprecipitation experiments, to assess their binding to and their PARylation by MYC2-TNKS2, using catalytically inactive TNKS2 (G1032W) as control [31].
3.3.1 Co-expression of TNKS2 and MERIT40 or TRF1 in HEK293T Cells
-
1.
Grow a sufficient number (here two) 15 cm cell culture plates of HEK293T cells to a cell density of ≈90% confluence in standard DMEM media supplemented with 10% FBS .
-
2.
Remove the media and gently rinse the cell culture plates with 10 mL of Versene to remove residual media, which could impede the efficient dissociation of the cells by trypsin .
-
3.
Add 3 mL of trypsin–Versene to each plate and place the plates back in the incubator for 2 min. Gently tap the side of the plates to help the cells detach from the plate and dissociate from each other.
-
4.
Add 10 mL of DMEM media with 10% FBS to each plate; the FBS will inactivate the trypsin . Pipette the cell suspension up and down a few times to ensure proper dissociation of cell clumps into a homogenous cell suspension.
-
5.
Measure the cell density , using either a hemocytometer or automated cell counter. Add 6 × 10⁶ cells each to the required number of 10 cm cell culture plates for the co-transfection of different DNA constructs (Table 3). Add 10 mL of DMEM media with 10% FBS to each plate and incubate cells overnight.
Table 3 Chart for co-transfection of HEK293T cells for co-immunoprecipitation . The indicated FLAG/FLAG3-tagged constructs (5 μg) are used as baits in co-immunoprecipitation with the indicated MYC2-tagged TNKS2 constructs (5 μg). The G-to-R mutation at position 6 of the TBM efficiently abolishes the ARC–TBM peptide interaction [7]. A G1032W mutation abolishes both poly- and mono(ADP-ribosyl)ation by TNKS2 [31]. Each "+" sign denotes a single co-transfection setup -
6.
The next day, co-transfect cells with 5 μg of each DNA construct (thus 10 μg total) per plate (Table 3). Pipette 5 μg of each DNA construct in a 15 mL Falcon tube , add 250 μL of 2 M CaCl2 followed by 1.75 mL H2O and mix thoroughly. Subsequently, add 2 mL of 2× HBS , mix the solution thoroughly by pipetting up and down and incubate for 5–10 min at room temperature (see Note 18 ).
-
7.
Replace the growth media from the 10 cm plate with 15 mL of fresh growth media supplemented with 25 μM chloroquine. Chloroquine inhibits degradation of endocytosed DNA and can increase transfection efficiency [21].
-
8.
Gently add the transfection mix (4 mL each, dropwise) to each plate and incubate transfected cells for 24 h.
-
9.
The next day, remove the media and add 10 mL of ice-cold PBS . Harvest the cells by gently scraping them off the plate (see Note 19 ). Collect the scraped cell suspension in a 15 mL Falcon tube and pellet the cells by centrifugation at 300 × g for 5 min at 4 °C. Discard the supernatant; snap-freeze cell pellet in liquid nitrogen and store at −80 °C until further use.
3.3.2 Co-immunoprecipitation
-
1.
Add 1 mL of ice-cold RIPA buffer (with freshly added DTT and protease inhibitors ) to each cell pellet and resuspend cells on ice. The freeze–thaw and the detergents will break open the cells. Transfer the lysates to 1.5 mL microcentrifuge tubes and incubate on ice for 5 min for extraction.
-
2.
Sonicate lysates for 6 s on ice, using a small tip sonicator at 25% amplitude output to shear chromatin .
-
3.
Clear cell lysates by high-speed centrifugation at 18,000 × g for 15 min at 4 °C and transfer supernatants to new 1.5 mL microcentrifuge tubes.
-
4.
Transfer 30 μL of each cleared lysate to a new microcentrifuge tube (input samples) and add 10 μL 4× SDS sample buffer. Boil samples at 95 °C for 5 min, collect by brief centrifugation , and store at −20 °C until analysis , if required.
-
5.
Pre-equilibrate a sufficient amount of anti-FLAG M2 Agarose resin (25 μL of packed-volume resin per immunoprecipitation sample plus a minimum of 10% dead volume) with RIPA buffer and incubate resin with cleared lysates for 2 h on a rotating wheel at 4 °C.
-
6.
Gently settle the resin by centrifugation at 800 × g for 5 min at 4 °C and remove supernatant using a vacuum pump.
-
7.
Wash the resin by adding 1 mL of RIPA buffer to each sample and incubating microcentrifuge tubes for 5 min on a rotating wheel at 4 °C.
-
8.
Settle the resin as before (step 6) and repeat the wash step four more times.
-
9.
After the last wash step, gently remove as much of buffer as possible and add 25 μL of 2× SDS sample buffer. Boil samples at 95 °C for 5 min, collect briefly by centrifugation and store at −20 °C until analysis , if required (immunoprecipitate (IP) samples).
3.3.3 SDS-PAGE and Immunoblotting
-
1.
Resolve 10 μL of the boiled input (step 4 above) and IP (step 9 above) samples on a pre-cast 4–15% Tris–glycine polyacrylamide gradient gel for SDS-PAGE analysis .
-
2.
Transfer proteins from the gel onto a nitrocellulose membrane using a wet-transfer blotting system . Ponceau S can be used to assess the transfer quality.
-
3.
Incubate the nitrocellulose membrane for at least 1 h at room temperature on a horizontal shaking platform in 5% dry milk powder in PBS to block the membrane to reduce nonspecific binding of antibodies during the subsequent immunodetection steps.
-
4.
Incubate the membranes with the required antibody at the appropriate dilution in 5% milk/PBS overnight at 4 °C on a horizontal shaking platform. (Antibody dilutions: anti-FLAG HRP-conjugated antibody , 1:1000; anti-MYC HRP -conjugated antibody, 1:1000; anti-PAR , 1:1000) .
-
5.
Wash the membrane three times for 5 min with copious amounts PBS + 0.1% Tween 20 on a horizontal shaking platform.
-
6.
As required, incubate the membrane with the matching HRP-coupled secondary antibody, here diluted 1:5000 in 5% milk/PBS for 1 h at room temperature on a horizontal shaking platform (see Note 20 ).
-
7.
Repeat wash step 5.
-
8.
Develop Western blot by incubating membrane with ECL Western blotting substrate following the manufacturer’s instructions.
-
9.
Detect chemiluminescence signal by exposing membrane to X-ray film in a dark room and develop the film with an X-ray film developer (see Note 21 ). Fig. 4 shows the TBM-dependent interaction of FLAG3-TRF1 and FLAG-MERIT40 with MYC2-TNKS2, and the TNKS2-dependent PARylation of both TNKS2 interactors, in addition to TNKS2 auto-PARylation (see Note 22). Both MERIT40 TBMs contribute to tankyrase binding (Fig. 4b).
Fig. 4 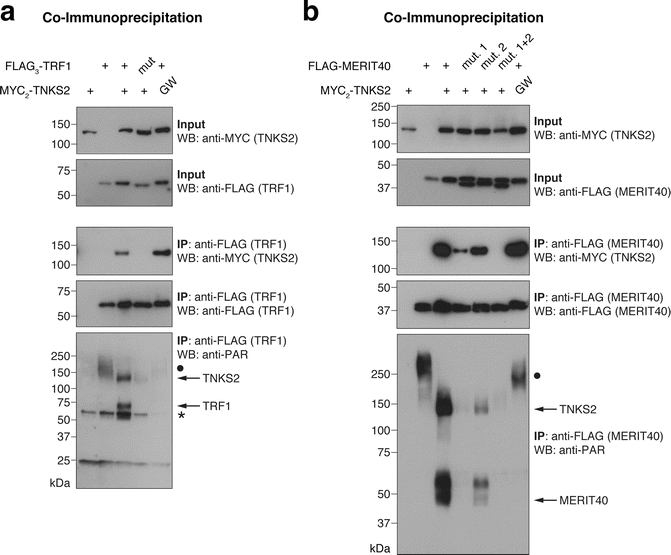
Assessing tankyrase binding and PARylation by tankyrase in the full-length protein context. (a) FLAG3-TRF1 , either in its wild-type form or as a G18R TBM mutant (“mut.”), was co-expressed with the indicated MYC2-TNKS2 constructs, either in wild-type form or as a G1032W PARP-inactive mutant (“GW”) [31]. FLAG-TRF1 was immunoprecipitated and input and immunoprecipitate (IP) samples analyzed by SDS-PAGE and Western blotting as indicated. “•” in the anti-PAR blot labels a high-molecular-weight PARylated species that appears to be antagonized by MYC2-TNKS2 overexpression. “*” in the anti-PAR blot denotes a nonspecific band. (b) Same analysis as in (a) with FLAG-MERIT40, either in wild-type form or as a G33R (“mut. 1”), G53R (“mut. 2”), or GG33/53RR (“mut. 1 + 2”) TBM mutant. MERIT40 appears as a doublet, most likely reflecting differentially phosphorylated species [32]. See Note 22 on attributing PAR signals to candidate proteins

4 Notes
-
1.
We recommend using vectors with a kanamycin selection marker. Ampicillin hydrolysis by secreted β-lactamase and under low pH increases the proportion of cells lacking the plasmid, which decreases protein yield [33].
-
2.
RIL cells contain additional tRNAs for codons of Arg, Ile, and Leu that are otherwise rare in E. coli . The plasmid bearing these genes contains a chloramphenicol selection marker.
-
3.
We recommend using one 5 mL column per 4 L expression culture. If using larger volumes, connect additional column(s) in series. Ni2+ affinity columns can easily be reconstituted by stripping from and re-charging with Ni2+ as per the manufacturer’s instructions.
-
4.
Use a Superdex 200 column for ARC1-5 constructs. All other ARC constructs are sufficiently small for the Superdex 75 column.
-
5.
TCEP is more stable than DTT and not volatile, unlike β-mercaptoethanol or DTT. However, TCEP is acidic and will affect the final pH of the buffer unless the 0.5 mM stock solution is pH-adjusted with NaOH. To keep costs down, TCEP is only used in the final purification step.
-
6.
HEPES is preferred for the final protein and in experiments due to its lower temperature dependency compared with Tris [34]. Tris was chosen for the affinity purification step due to its weak interaction with Ni2+, which would help decrease background (contaminant) binding [35]. If HEPES buffer is used in the affinity purification step, the imidazole concentration may need to be increased to achieve comparably low background binding.
-
7.
Detergent is used to reduce nonspecific binding and surface tension that may interfere with fluorescence intensity readings in the plate format. The choice of detergent and its concentration is empirical. We have also had good experience with using 100 μg/mL bovine serum albumin (BSA) , but use CHAPS here since it is more effective at reducing nonspecific binding .
-
8.
Keeping the fluorescently labeled peptides as short as possible increases the ΔFP signal window between the bound and unbound states. Ideally, peptides should be HPLC-purified ; however, this is not always realistically achievable, especially if large numbers of peptides are to be compared and no access to in-house solid-state peptide synthesis is available. To save costs, peptides can be used at non-HPLC-purified grade, in which case a capping step is strongly recommended after each amino acid coupling reaction to prevent peptide synthesis intermediates from being linked to the fluorophore in the final coupling step and affecting the assay [7].
-
9.
Alternatively, fluorescently labeled antibodies can be used for detection with appropriate fluorescence imaging systems. Instead of the anti-PAR antibody, an anti-pan-ADP-ribose or anti-poly(ADP-ribose) binding reagents (MABE1016 and MABE1032, respectively, Millipore) may be explored.
-
10.
Compared to LB, TB is richer and enables higher cell densities in the log phase of growth. Cooling the cultures before IPTG induction slows down expression , thereby facilitating correct protein folding and increasing protein solubility.
-
11.
For ARC2-3 and ARC1-5 constructs described here, a minimal NaCl concentration of 300 mM needs to be maintained, compared to 100 mM for all single-ARC constructs, and glycerol may further help stabilize the protein [7].
-
12.
For large volumes, it may be easier to lyse cells in two batches. Alternative disruption techniques can be used, such as homogenization by an Avestin EmulsiFlex homogenizer.
-
13.
If available with the FPLC setup, a superloop or, preferably, a sample pump can be used to load the column.
-
14.
Depending on the ARC construct and the final concentration of imidazole in the dialysis buffer, ARCs can bind weakly to the Ni2+ column even after tag cleavage . They can be eluted with a further imidazole gradient. While this adds one more step to the purification protocol, it enables even higher purities to be achieved.
-
15.
The Q column step can also be performed before concentration, directly using the flow-through from the second Ni2+ affinity column ; however, prior concentration saves time in loading the column.
-
16.
Confirm the pH of the peptide stock solution before measuring the concentration. Acidity, for example due to residual trifluoroacetic acid from the peptide synthesis, will strongly affect fluorophore absorption.
-
17.
We recommend leaving wells in the outermost rows and columns empty to reduce the microplate “edge effect,” a discrepancy in readings between the central and peripheral wells [36].
-
18.
It is important to add the different transfection reagents in the specified order to ensure proper calcium phosphate–DNA particle formation.
-
19.
Avoid using micropipette tips to transfer the cell suspension after scraping. The small opening of the tips can cause cells to break due to shearing. You can cut off the tips to avoid this risk.
-
20.
For directly HRP-coupled antibodies , azide as a preservative should be avoided as it inhibits HRP activity .
-
21.
The Western blot protocol can be adapted for film-free chemiluminescence detection or fluorescence-based detection.
-
22.
Attributing a PAR signal to a particular protein by molecular weight may be challenging, in part due to possible PAR-induced mobility shifts in SDS-PAGE. Since the tankyrase substrate candidates are immunoprecipitated from cell lysates, it is possible that the observed PAR signal corresponds to other PARylated proteins in a protein complex. Ultimate confirmation of substrates can be obtained from experiments with purified proteins or PAR site mapping by mass spectrometry, for example.
References
Gibson BA, Kraus WL (2012) New insights into the molecular and cellular functions of poly(ADP-ribose) and PARPs. Nat Rev Mol Cell Biol 13:411–424. doi:10.1038/nrm3376
Teloni F, Altmeyer M (2016) Readers of poly(ADP-ribose): designed to be fit for purpose. Nucleic Acids Res 44:993–1006. doi:10.1093/nar/gkv1383
Vyas S, Chesarone-Cataldo M, Todorova T et al (2013) A systematic analysis of the PARP protein family identifies new functions critical for cell physiology. Nat Commun 4:2240. doi:10.1038/ncomms3240
Hsiao SJ, Smith S (2008) Tankyrase function at telomeres, spindle poles, and beyond. Biochimie 90:83–92. doi:10.1016/j.biochi.2007.07.012
Haikarainen T, Krauss S, Lehtio L (2014) Tankyrases: structure, function and therapeutic implications in cancer. Curr Pharm Des 20:6472–6488
Chiang YJ, Hsiao SJ, Yver D et al (2008) Tankyrase 1 and tankyrase 2 are essential but redundant for mouse embryonic development. PLoS One 3:e2639. doi:10.1371/journal.pone.0002639
Guettler S, LaRose J, Petsalaki E et al (2011) Structural basis and sequence rules for substrate recognition by tankyrase explain the basis for cherubism disease. Cell 147:1340–1354. doi:10.1016/j.cell.2011.10.046
Sbodio JI (2002) Identification of a tankyrase-binding motif shared by IRAP, TAB182, and human TRF1 but not mouse TRF1. NuMA contains this RXXPDG motif and is a novel tankyrase partner. J Biol Chem 277:31887–31892. doi:10.1074/jbc.M203916200
Seimiya H (2002) The telomeric poly(ADP-ribose) polymerase, tankyrase 1, contains multiple binding sites for telomeric repeat binding factor 1 (TRF1) and a novel acceptor, 182-kDa tankyrase-binding protein (TAB182). J Biol Chem 277:14116–14126. doi:10.1074/jbc.M112266200
Seimiya H, Muramatsu Y, Smith S, Tsuruo T (2004) Functional subdomain in the ankyrin domain of tankyrase 1 required for poly(ADP-ribosyl)ation of TRF1 and telomere elongation. Mol Cell Biol 24:1944–1955. doi:10.1128/MCB.24.5.1944-1955.2004
Morrone S, Cheng Z, Moon RT et al (2012) Crystal structure of a tankyrase-axin complex and its implications for axin turnover and tankyrase substrate recruitment. Proc Natl Acad Sci 109:1500–1505. doi:10.1073/pnas.1116618109
Li B, Qiao R, Wang Z et al (2016) Crystal structure of a tankyrase 1–telomere repeat factor 1 complex. Acta Crystallogr Sect F Struct Biol Cryst Commun 72:320–327. doi:10.1107/S2053230X16004131
Eisemann T, McCauley M, Langelier M-F et al (2016) Tankyrase-1 ankyrin repeats form an adaptable binding platform for targets of ADP-ribose modification. Structure 24:1679–1692. doi:10.1016/j.str.2016.07.014
Huang S-MA, Mishina YM, Liu S et al (2009) Tankyrase inhibition stabilizes axin and antagonizes Wnt signalling. Nature 461:614–620. doi:10.1038/nature08356
Smith S (1998) Tankyrase, a poly(ADP-ribose) polymerase at human telomeres. Science 282:1484–1487. doi:10.1126/science.282.5393.1484
Levaot N, Voytyuk O, Dimitriou I et al (2011) Loss of tankyrase-mediated destruction of 3BP2 is the underlying pathogenic mechanism of cherubism. Cell 147:1324–1339. doi:10.1016/j.cell.2011.10.045
Riffell JL, Lord CJ, Ashworth A (2012) Tankyrase-targeted therapeutics: expanding opportunities in the PARP family. Nat Rev Drug Discov 11:923–936. doi:10.1038/nrd3868
Moerke NJ (2009) Fluorescence polarization (FP) assays for monitoring peptide-protein or nucleic acid-protein binding. Curr Protoc Chem Biol 1:1–15. doi:10.1002/9780470559277.ch090102
Dédier S, Reinelt S, Rion S et al (2001) Use of fluorescence polarization to monitor MHC-peptide interactions in solution. J Immunol Methods 255:57–66
Qian J, Voorbach MJ, Huth JR et al (2004) Discovery of novel inhibitors of Bcl-xL using multiple high-throughput screening platforms. Anal Biochem 328:131–138. doi:10.1016/j.ab.2003.12.034
Sambrook J, Russell DW (2012) Molecular cloning: a laboratory manual, Fourth edn. Cold Spring Harbor Laboratory Press, New York
Nagy Z, Kalousi A, Furst A et al (2016) Tankyrases promote homologous recombination and check point activation in response to DSBs. PLoS Genet 12:e1005791. doi:10.1371/journal.pgen.1005791
Bisht KK, Dudognon C, Chang WG et al (2012) GDP-mannose-4,6-dehydratase is a cytosolic partner of tankyrase 1 that inhibits its poly(ADP-ribose) polymerase activity. Mol Cell Biol 32:3044–3053. doi:10.1128/MCB.00258-12
UniProt Consortium (2015) UniProt: a hub for protein information. Nucleic Acids Res 43:D204–D212. doi:10.1093/nar/gku989
Berman HM (2000) The protein data bank. Nucleic Acids Res 28:235–242. doi:10.1093/nar/28.1.235
Dosztányi Z, Csizmok V, Tompa P, Simon I (2005) IUPred: web server for the prediction of intrinsically unstructured regions of proteins based on estimated energy content. Bioinformatics 21:3433–3434. doi:10.1093/bioinformatics/bti541
DaRosa PA, Wang Z, Jiang X et al (2014) Allosteric activation of the RNF146 ubiquitin ligase by a poly(ADP-ribosyl)ation signal. Nature. doi:10.1038/nature13826
Lyons RJ (2001) Identification of a novel human tankyrase through its interaction with the adaptor protein Grb14. J Biol Chem 276:17172–17180. doi:10.1074/jbc.M009756200
Gasteiger E, Hoogland C, Gattiker A, Wilkins MR (2005) Protein identification and analysis tools on the ExPASy server. In: The proteomics protocols handbook. Humana Press, New Jersey, pp 571–607. doi:10.1385/1-59259-890-0:571
Thermo Fisher Scientific (2010) The molecular probes handbook: a guide to fluorescent probes and labeling technologies, 11th edn. Life Technologies Corporation, Carlsbad, CA
Mariotti L, Templeton CM, Ranes M et al (2016) Tankyrase requires SAM domain-dependent polymerization to support Wnt-β-Catenin signaling. Mol Cell 63:498–513. doi:10.1016/j.molcel.2016.06.019
Brown KK, Montaser-Kouhsari L, Beck AH, Toker A (2015) MERIT40 is an Akt substrate that promotes resolution of DNA damage induced by chemotherapy. Cell Rep 11:1358–1366. doi:10.1016/j.celrep.2015.05.004
Sivashanmugam A, Murray V, Cui C et al (2009) Practical protocols for production of very high yields of recombinant proteins using Escherichia coli. Protein Sci 18:936–948. doi:10.1002/pro.102
Good NE, Winget GD, Winter W et al (1966) Hydrogen ion buffers for biological research. Biochemistry 5:467–477
Fischer BE, Häring UK, Tribolet R, Sigel H (1979) Metal ion/buffer interactions. Stability of binary and ternary complexes containing 2-amino-2(hydroxymethyl)-1,3-propanediol (Tris) and adenosine 5'-triphosphate (ATP). Eur J Biochem 94:523–530
Mills NL, Shelat AA, Guy RK (2007) Assay optimization and screening of RNA-protein interactions by AlphaScreen. J Biomol Screen 12:946–955. doi:10.1177/1087057107306128
Wang W, Li N, Li X et al (2015) Tankyrase inhibitors target YAP by stabilizing angiomotin family proteins. Cell Rep 13:524–532. doi:10.1016/j.celrep.2015.09.014
Kim MK, Dudognon C, Smith S (2012) Tankyrase 1 regulates centrosome function by controlling CPAP stability. EMBO Rep 13:724–732. doi:10.1038/embor.2012.86
Cho-Park PF, Steller H (2013) Proteasome regulation by ADP-ribosylation. Cell 153:614–627. doi:10.1016/j.cell.2013.03.040
Larkin MA, Blackshields G, Brown NP, Chenna R (2007) Clustal W and Clustal X version 2.0. Bioinformatics 23(21):2947–2948
Waterhouse AM, Procter JB, Martin DMA et al (2009) Jalview version 2--a multiple sequence alignment editor and analysis workbench. Bioinformatics 25:1189–1191. doi:10.1093/bioinformatics/btp033
Acknowledgments
We thank Catherine Templeton for cloning, Fiona Jeganathan for help with the FP assays, Kim Stegmann for help with protein purification, and Jane Sandall for laboratory support. S.G. acknowledges the support by Frank Sicheri, the late Tony Pawson (Lunenfeld-Tanenbaum Research Institute and University of Toronto) and Robert Rottapel (University Health Network and University of Toronto) as well as members of their laboratories, where the presented protocols were first established. Work in the S.G. laboratory is supported by The Institute of Cancer Research (ICR) and Cancer Research UK through a Career Establishment Award to S.G. (C47521/A16217). Work in the I.C. laboratory is supported by The Institute of Cancer Research (ICR) and Cancer Research UK through funding to the Cancer Therapeutics Unit (C309/A11566). K.P. is supported by a Wellcome Trust PhD studentship (WT102360/Z/13/Z).
Author information
Authors and Affiliations
Corresponding author
Editor information
Editors and Affiliations
Rights and permissions
Open Access This chapter is distributed under the terms of the Creative Commons Attribution 4.0 International License (http://creativecommons.org/licenses/by/4.0/), which permits use, duplication, adaptation, distribution and reproduction in any medium or format, as long as you give appropriate credit to the original author(s) and the source, provide a link to the Creative Commons license and indicate if changes were made.
The images or other third party material in this chapter are included in the chapter’s Creative Commons license, unless indicated otherwise in the credit line to the material. If material is not included in the chapter’s Creative Commons license and your intended use is not permitted by statutory regulation or exceeds the permitted use, you will need to obtain permission directly from the copyright holder.
Copyright information
© 2017 The Author(s)
About this protocol
Cite this protocol
Pollock, K., Ranes, M., Collins, I., Guettler, S. (2017). Identifying and Validating Tankyrase Binders and Substrates: A Candidate Approach. In: Tulin, A. (eds) Poly(ADP-Ribose) Polymerase. Methods in Molecular Biology, vol 1608. Humana Press, New York, NY. https://doi.org/10.1007/978-1-4939-6993-7_28
Download citation
DOI: https://doi.org/10.1007/978-1-4939-6993-7_28
Published:
Publisher Name: Humana Press, New York, NY
Print ISBN: 978-1-4939-6992-0
Online ISBN: 978-1-4939-6993-7
eBook Packages: Springer Protocols