
Abstract
We study the dynamics of risk-sharing cooperatives among heterogeneous agents. Based of their knowledge on their risk exposure and the performance of the cooperatives, agents choose whether or not to remain in the risk-sharing agreement. We highlight the key role of other-regarding preference (altruism and inequality aversion) in stabilizing less segregated (and smaller) cooperatives. Limited knowledge and learning of own risk exposure also contributes to reducing segregation, the two effects (of learning and other-regarding preferences) being complementary. Our findings shed light on the mechanisms behind risk-sharing agreements between agents heterogeneous in their risk exposure.


Notes
Note here that increasing the level of the network with whom the agent can create a cooperative will have a similar effect as densifying the network. This discussion is thus related to one on the shape of the network we expose in Appendix F.2
Relaxing either this assumption or the fact that agents cannot jump from one cooperative to another would render the model extremely complicated. This would first call for additional assumptions on how agents offer and accept a creation or a change of cooperative, and on the identity of the agent in charge of the decision. Then, each decision would be conditional on others’ acceptance, which would lead to possibly long computations to achieve convergence. For example, if one agent offers to create a cooperative, he chooses on the basis of the information on all other participants, and so do they. If one participant rejects the offer, the offer changes, and a new calculation should take place, conditional on who accepted. This then has to be repeated until convergence, if ever it happens. These concerns led us to choose the most classical evolutionary logic: any proposed cooperative is created, and all agents evaluate their satisfaction and decide to leave after one step. We have also tested settings in which the selected agent had the choice to build the cooperative or not, based on his belief and the ones reported by the other potential members. Our results on the effect of other-regarding preferences were then qualitatively the same as the ones exposed here, whereas those on learning were more difficult to interpret as learning had then both a direct impact on cooperatives’ creation (through the mechanism of choice) and on cooperatives’ evolution (through πt in Eqs. 8, 11 and 12). Automatic creation allows us to disentangle these two effects of learning and to concentrate on cooperatives’ evolution alone.
See Chiappori et al. (2014) for a discussion on heterogeneity in risk-aversion.
CRRA utility functions present the advantages of having already been used by Kimball (1988) in his seminal paper on cooperatives and of allowing for the estimation of the risk-aversion parameter (see for example Kimball (1988), Chetty (2006) or Meyer and Meyer (2005) who estimate ρ to be in the range [1.1; 6]).
Note again that if agents would not learn their type in this case, they would behave as if they were homogeneous and would tend to stay in any cooperative to which they belong.
This destabilizing effect disappears when agents take into account the effect on their friends (i.e. social utility) only when it is positive (see Barbet et al. 2017).
References
Alderman H, Paxson CH (1992) Do the poor insure? a synthesis of the literature on risk and consumption in developing countries. Policy Research Working Paper Series 1008, The World Bank
Alger I, Weibull J (2008) Family ties, incentives and development a model of coerced altruism. In: Basu K, Kanbur R (eds) Arguments for a better world: essays in honor of Amartya Sen. Oxford University Press
Alger I, Weibull J (2010) Kinship, incentives, and evolution. Am Econ Rev 100:1727–1760
Arrondel L, Masson A (2006) Altruism, exchange or indirect reciprocity: what do the data on family transfers show?, Elsevier, chap 14, pp 971–1053. Handbook on the Economics of Giving, Reciprocity and Altruism
Arrow K (1965) Aspects of the theory of risk-bearing. Yrjo Jahnssonin Saatio, Helsinki
Arrow K (1981) Optimal and voluntary income distribution. In: Roseelde S (ed) Economic welfare and the economics of soviet socialism: essays in honor of Abram Bergson. Cambridge University Press, pp 267–288
Barbet V, Bourlès R, Rouchier J (2017) Informal risk-sharing cooperatives: the effect of learning and other-regarding preferences
Becker GS (1974) A theory of social interactions. J Polit Econ 82(6):1063–1093
Bloch F, Genicot G, Ray D (2008) Informal insurance in social networks. J Econ Theory 143:36–58
Bourlès R, Henriet D (2012) Risk-sharing contracts with asymmetric information. Geneva Risk Insur Rev 37:27–56
Bourlès R, Bramoullé Y, Perez-Richet E (2017) Altruism in networks. Econometrica 85:675–689
Bourlès R, Bramoullé Y, Perez-Richet E (2018) Altruism and risk sharing in networks. CEPR Discussion Papers 13164
Bramoullé Y, Kranton R (2007) Risk-sharing networks. J Econ Behav Organ 64:275–294
Brenner T (2006) Agent learning representation: advice on modelling economic learning. In: Tesfatsion L, Judd KL (eds) Handbook of computational economics vol 2: agent-based computational economics, Handbooks in Economics Series, Elsevier/North-Holland, chap 18
Camerer C, Ho TH (1999) Experience-weighted attraction learning in normal form games. Econometrica 67:827–874
Chetty R (2006) A new method of estimating risk aversion. Am Econ Rev 96 (5):1821–1834
Chiappori PA, Samphantharak K, Schulhofer-Wohl S, Townsend RM (2014) Heterogeneity and risk sharing in village economies. Quant Econ 5(1):1–27
De Weerdt J, Fafchamps M (2011) Social identity and the formation of health insurance networks. J Dev Stud 47(8):1152–1177
DeWeerdt J, Fafchamps M (2011) Social identity and the formation of health insurance networks. J Dev Stud 47(8):1152–1177
Dubois P, Jullien B, Magnac T (2008) Formal and informal risk sharing in ldcs: theory and empirical evidence. Econometrica 76(4):679–725
Fafchamps M (2011) Risk sharing between households, North-Holland, pp 1255–1280. Handbook of Social Economics
Fafchamps M, Gubert F (2007) The formation of risk sharing networks. J Dev Econ 83(2):326–350
Fafchamps M, Lund S (2003) Risk-sharing networks in rural philippines. J Dev Econ 71:261–287
Fehr E, Schmidt K (1999) A theory of fairness, competition, and cooperation. Q J Econ 114(3):817–868
Foster AD, Rosenzweig MR (2001) Imperfect commitment, altruism, and the family: evidence from transfer behavior in low-income rural areas. Rev Econ Stat 83 (3):389–407
Hamilton W (1964a) The genetical evolution of social behaviour. i. J Theor Biol 7:1–16
Hamilton W (1964b) The genetical evolution of social behaviour. ii. J Theor Biol 7:17–52
Islam A (2011) Medium- and long-term participation in microcredit: an evaluation using a new panel dataset from bangladesh. Am J Agric Econ 93(3):843–862
Kimball M (1988) Farmers’ cooperatives as behavior towards risk. Am Econ Rev 78(1):224–232
Kirman A (2010) Complex economics: individual and collective rationality. Routledge
Lazcó S (2014) Does risk sharing increase with risk aversion and risk when commitment is limited? J Econ Dyn Control 46:237–251
Leloup B (2002) L incertitude de deuxième ordre en économie : le compromis exploration vs. exploitation. PhD thesis. Ecole normale supérieure, Cachan
Ligon E, Thomas J, Worrall T (2002) Informal insurance arrangements with limited commitment: theory and evidence from village economies. Rev Econ Stud 69 (1):209–244
Mercier-Ythier J (2006) The economic theory of gift-giving: perfect substituability of transfers and redistribution of wealth. In: Kolm SC, Ythier JM (eds) Handbook of the economics of giving, altruism and reciprocity, North Holland, pp 228–369
Meyer D, Meyer J (2005) Relative risk aversion: what do we know? J Risk Uncertain 31(3):243–262
Morduch J (1995) Income smoothing and consumption smoothing. J Econ Perspect 9(3):103–114
Moulet S, Rouchier J (2008) The influence of sellers’ beliefs and time constraint on a sequential bargaining in an artificial perishable goods market. J Econ Dyn Control 32(7):2322–2348
Rapoport H, Docquier F (2006) The economics of migrants’ remittances, Elsevier, chap 17, pp 1135–1198. Handbook on the Economics of Giving, Reciprocity and Altruism
Roos P, Nau D (2010) Risk preference and sequential choice in evolutionary games. Adv Complex Syst 13(04):559–578
Roth A, Erev I (1995) Learning in extensive form games: experimental data and simple dynamic models in the intermediate run. Games Econom Behav 8:164–212
Rouchier J (2003) Re-implementation of a multi-agent model aimed at sustaining experimental economic research: the case of simulations with emerging speculation. J Artif Soc Soc Simul 6(4):1–7
Rouchier J (2013) Agent-based simulation as a useful tool for the study of markets. In: Edmonds B, Meyer R (eds) Simulating social complexity: a handbook. Springer, Berlin, pp 617–650
Simon H (1955) A behavioral model of rational choice. Q J Econ 69(1):99–118
Townsend R (1994) Risk and insurance in village india. Econometrica 62 (3):539–591
Watts D, Strogat S (1998) Collective dynamics of ‘small-world’ networks. Nature 393:440–442
Acknowledgments
We wish to thank Hugo David-Mauduit and Simon Venturi (from École Centrale Marseille) for very useful research assistance, Marjorie Sweetko for English language revision and an anonymous referee for constructive criticisms that greatly improved the paper. This work was supported by the Conseil Régional Provence-Alpes-Côte d’Azur (France) through a PhD program. Barbet and Bourlès acknowledge the support of the French National Research Agency Grant ANR-17-EURE-0020.
Funding
This work was supported by the Conseil Régional Provence-Alpes-Côte d’Azur (France) through a PhD program and the French National Research Agency Grant ANR-17-EURE-0020.
Author information
Authors and Affiliations
Corresponding author
Ethics declarations
Conflict of interests
The authors declare that they have no conflict of interest.
Additional information
Publisher’s note
Springer Nature remains neutral with regard to jurisdictional claims in published maps and institutional affiliations.
Appendices
Appendix A: Constructing a cooperative segregation index
In the core paper, we introduced a segregation index in cooperatives and detail its meaning. To obtain this index we have modified the standard demographic index of dissimilarity which compares the composition of each neighborhood to the composition of the whole population. It is equal to 1 if the segregation is complete, that is, if all neighborhoods are composed of only one type of individual. It is equal to 0 if there is no segregation, that is, the composition of all neighborhoods is equal to the composition of the whole population. To adapt this index to our model, instead of considering neighborhoods we consider the cooperatives and compare their compositions to the population composition. In our case, the standard demographic index of dissimilarity is:
with \({n^{l}_{k}}\) and \({n^{h}_{k}}\) denoting the number of low-risk and high-risk agents in cooperative k. An isolated agent is considered to be a cooperative composed of only one agent, that is, a highly segregated cooperative. nl (respectively nh) denotes the total number of low-risk (resp. high-risk) agents in the population. This index is equal to 0 when the proportions of low- and high-risk agents in each cooperative are the same as in the whole society, and if no agent is isolated. It is equal to 1 when each cooperative is completely segregated (no cohabitation in cooperatives) or if all agents are isolated.
This index includes isolated agents and does not directly give an indication of cooperatives’ composition. To correct this bias, we use a modified index based on the decomposition of the previous one in two parts. The first part computes the index on isolated agents (SI). SI only depends on the fraction of isolated agents and the composition of this fraction. Denoting \(\mathcal {I}_{l}\) (and respectively \({\mathcal {I}}_{h}\)) the set of isolated agents with a low-risk type (resp. high-risk type) we have:
SI is the part of D explained by the isolated agent. The second part of D comes from the composition of each cooperative and varies between 0, if there is no segregation in cooperatives, and 1 − SI, if cooperatives are completely segregated. We then have:
With \(\mathcal {K}\) the set of cooperatives. By normalizing SC, we obtain a segregation index on cooperatives \(D_{\mathcal {K}}\) that equals 0 when the proportion of low- and high-risk agents in each cooperative is the same as in the whole society, and equals 1 when cooperatives do not mix different risk types:
By convention \(D_{\mathcal {K}} = 1\) if there is no cooperative.
Appendix B: General dynamics of the model
The first and simplest of the dynamics concerns learning. Our choice of parameters means that learning takes about 50 time steps (beyond which, agents have over 95% probability of knowing their type).
The system is, however, not stable once agents know their type. The learning regime is followed by a so-called “convergence” regime during which our indicators converge to the stabilized level (this is illustrated in Fig. 7 using the dynamics of the number of cooperatives). The end of this convergence depends on the indicator, but it generally ends around t = 100. Then, indicators oscillate around their stabilized level, in what we call the “stabilized” regime.

Illustration of the different regimes based on the number of cooperatives. The moving average is the mean of the indicator over the last 50 periods. We observe sharp convergence during the learning regime, a smoother readjustment during the convergence regime and then oscillations around the “stabilized level”. The vertical yellow and green lines indicate respectively the level reached at t = 50 and t = 100
Appendix C: The macro dynamics of the model
The macro dynamics of our model (an emerging phenomenon in ABM) is summarized in Fig. 8. In ABM we define ex-ante the local rules for interactions and decisions of our agents and the scheduling of the model. The macro dynamics presented here is not directly implemented in our model but is the consequence at macro level of the local behavior of our agents. We chose ex-post to represent these macro dynamics as a stock and flow chart because we think this is the best key to understanding the results we observe. We can identify two relevant stocks:
-
1.
The stock of isolated agents, characterized by its composition of low- and high-risk agents and the density of the network linking these agents in autarky.
-
2.
The stock of agents in cooperatives, characterized by the number, the size, and the composition of cooperatives.
These two stocks are mathematically linked at every point in time by the following relation: Stock.Autarky = Total.population − Stock.in.Coop. Still, this relationship alone does not sufficiently clarify the dynamics, so we detail to understand well the dynamic, so we detail the flows between these two stocks.

Scheme of the macro dynamics of the model
There are two flows linking these stocks:
- Flow A::
-
One flow comes from the creation of cooperatives. It depletes the stock of isolated agents and increases the stock of agents in cooperatives. This flow is shaped by the number of isolated agents. As there is at most one cooperative created per time step, it is the same size as this new cooperative. One agent is randomly picked to create a cooperative with his friends and the friends of his friends. Thus, the larger the stock of isolated agents, the more likely the chosen agent is to find a lot of agents in his network to create his cooperative (arrow 1). This relationship between the size of the stock in autarky and flow A is very important for the general dynamics. A second factor influencing flow A is the density of the network connecting agents in autarky. For the same stock, a higher density leads the selected agent to gather more agents (arrow 7).
- Flow B::
-
The other, opposite flow corresponds to agents leaving cooperatives. For a given stock of agents in cooperatives, a larger flow implies (logical link) and is the consequence (causal link) of greater instability in cooperatives. The less (resp. the more) stable the cooperatives, the larger (resp. the smaller) this flow for a given stock (arrow 2). Thus, flow B is only driven by the micro level dynamics whereas flow A is essentially driven by the level and the nature of the stock of agents in autarky (i.e. by macro components).
From this structure we can infer the following:
-
The composition of flow B influences the composition of the stock of agents in autarky (dashed arrow 3), which in turn influences the composition of the new cooperative created (arrow 4). Then, when the composition of flow B is stable, all these compositions become similar.
-
When the stock of agents in cooperatives remains stable (as in the stabilized regime, for example), a small fraction of agents in cooperatives implies a high instability of cooperatives at the micro level. Indeed, for the stock to be stable, flows A and B have to be equal. Then, when there are few agents in cooperatives (and therefore a lot of agents in autarky), flow A is large and so flow B is large too, leading to the conclusion that cooperatives are unstable.
This macro structure already yields some intuitions about the mechanisms behind our indicators:
- Size of cooperatives.:
-
The average size of cooperatives is influenced both by the size of the new cooperative (dashed arrow 6) and by the micro dynamics at cooperative level.
- The fraction of agents in cooperatives.:
-
The fraction of agents in cooperatives only depends on the stock of agents in cooperatives, as it is the ratio of this stock to the total number of agents. Therefore, a stable low fraction means great instability in the cooperatives.
- Segregation in cooperatives.:
-
At the macro level, the most important factor influencing segregation is the composition of the leaving flow, which impacts the composition of new cooperatives. If all the new cooperatives created are already highly segregated, segregation is likely to be large and only depends on internal cooperative mechanisms (dashed arrow 5). Segregation thus depends strongly on who leaves cooperatives, if the composition of this flow is stable enough.
Appendix D: Typical scenarios
In this section, we describe a typical run of the model, first without ORP then with altruism and with inequality aversion. These scenarios link macro and micro dynamics.
1.1 D.1 The baseline scenario: without ORP
Let us first describe the typical evolution of cooperatives with neither ORP nor learning. The effects of our various parameters can then be understood in terms of divergences from this baseline scenario.
At the beginning, all agents are available to form new cooperatives, which are therefore quite big. Low-risk agents, however, quickly leave these initial cooperatives, whereas most high-risk agents stay. Most of the isolated agents are thus low-risk. They end up creating stable cooperatives among themselves. At this point, homogeneous cooperatives are very stable. As all agents in these cooperatives are of the same risk type, they have the same expected utility in isolation, and as soon as the expected utility of a cooperative is lower than this utility in isolation all the agents simultaneously leave the cooperative. Hence cooperative survival is extremely path-dependent, as is the composition of the leaving flow. This leads to high levels of segregation.
1.2 D.2 The scenario with altruism
As in the baseline scenario, large cooperatives of mixed composition are first created. The low-risk agents leave them quite quickly, changing the composition of the stock of isolated agents to almost 25% high-risk against 75% low-risk. Almost all newly created cooperatives thus reflect this in their composition, and the negative effect on consumption induced by this small fraction of high-risk agents is borne more easily by the low-risk agents, who stay in the cooperatives longer. Moreover low-risk agents still leave but more slowly, and not all at the same time (as explained in the core paper, the most successful ones are “trapped” longer). This ensures a mix which lasts longer and decreases segregation.
In terms of macro dynamics, agents now leave the cooperative individually (not in large groups as in the baseline scenario) and thus do not greatly modify the composition of the stock of agents in autarky. This stabilizes the composition of newly created cooperatives. This self-reinforcing process at the macro level leads to lower segregation. At the same time due to the “sacrificial” effect, the leaving and entering flows are larger decreasing the overall fraction of agent in cooperative.
1.3 D.3 The scenario with inequality aversion
As in the baseline scenario, large cooperatives of mixed composition are first created. The low-risk agents leave them quite quickly, changing the composition of the stock of isolated agents to almost 20% high-risk against 80% low-risk. Almost all newly created cooperatives thus reflect this in their composition, and the negative effect on consumption induced by this small fraction of high-risk agents is borne more easily by the low-risk agents, who stay in the cooperatives longer. They still leave but more slowly, and not all at the same time (for the same reasons exposed for altruism: most successful low-risk agents are “trapped” longer). This ensures a mix which lasts longer and decreases segregation.
In terms of macro dynamics, agents now leave the cooperative individually (not in large groups as in the basic scenario) and thus do not greatly modify the composition of the stock of agents in autarky. This stabilizes the composition of newly created cooperatives. This self-reinforcing process at macro level leads to lower segregation.
Surprisingly, the small leaving flow does not increase the fraction of agents in cooperatives, due to the lower density of the network of isolated agents (see Appendix C). As agents of the same type leave their cooperatives at different times, they leave most of their friends behind and have fewer friends in autarky to create new cooperatives. Finally, as IA stabilizes small cooperatives, cooperatives are smaller on average.
Appendix E: The effect of inequality aversion on average segregation
To analyze further the non-linear effect of inequality aversion on segregation, Fig. 9 plots the average segregation index among1000 simulations, for various parameters of inequality aversion β.

The effect of inequality aversion on the average index of segregation when agents know their type and ρ = 2.5. (The average index of segregation over the 50 first time steps is averaged over 1000 simulations for each value of β))
This confirms the non-linear effect of inequality aversion on segregation, the (negative) impact being higher for high level of inequality aversion.
Appendix F: Robustness checks
1.1 F.1 The effect of risk-aversion
The effect of risk-aversion is summarized in Fig. 10.

The effect of risk-aversion (RA) without learning or ORP on the average level of segregation (left panel) and the average fraction of agents in cooperatives (right panel) over 50 steps
Risk aversion greatly improves the stability of cooperatives. Still, results are very path-dependent for high coefficient of (relative) risk-aversion, stabilizing a large variety of scenarios from low segregation to complete segregation.
-
When the coefficient of relative risk-aversion equals 1.5, cooperatives are unstable. Low-risk agents quickly leave and the performance of the remaining homogeneous cooperatives is highly path-dependent (explaining high segregation and the small fraction of agents in cooperatives).
-
With a higher relative risk-aversion coefficient (2.5), the first cooperatives are more stable. Low-risk agents leave less quickly, so the segregation index decreases during the learning phase. Nevertheless, high coefficients of RA also stabilize homogeneous cooperatives.
-
A coefficient of 3.5 is a special case, where simulations are highly path-dependent. RA can stabilize both situations in which every cooperative is completely segregated and situations in which cooperatives are mixed.
1.2 F.2 The shape of the social network
In this subsection, we analyze the impact of the social network. We study three shapes of network: small world with a mean number of friends of 10 (as in the core of the paper); random, with the same mean number of friends; and complete, where everybody is linked to everybody. We focus on cases without ORP and with inequality aversion. We abstract from learning, assuming that agents perfectly know their type from t = 0. Results are displayed in Figs. 11 and 12.
-
On segregation (Fig. 11). Segregation is maximal for the complete network. Without ORP, small world and random networks are equivalent. With inequality aversion, small world networks lead to less segregated cooperatives.
-
On the size of cooperatives (Fig. 12). Without ORP, the complete network tends to generate two completely segregated cooperatives. With inequality aversion, the complete network generates smaller cooperatives that are still larger than with random networks. In both cases, the smallest cooperatives are generated by small world networks.
Fig. 11 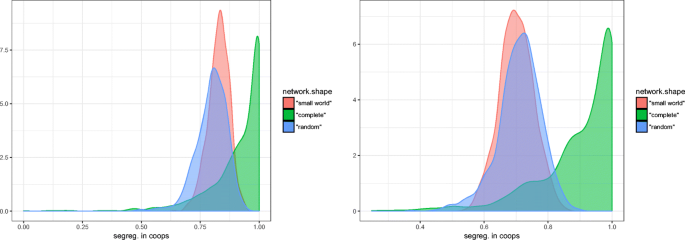
The effect of network shape on the average segregation without ORP (left panel) and with inequality aversion (β = 0.8, right panel)
Fig. 12 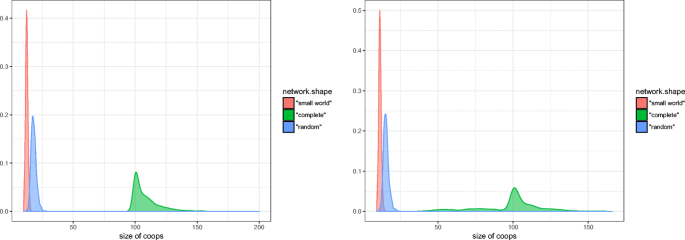
The effect of network shape on the average size of cooperatives without ORP (left panel) and with inequality aversion (β = 0.8, right panel)


Results on the size of cooperatives are essentially driven by the size of the created cooperatives. With the complete network, all agents are linked. Every isolated agent therefore creates the largest possible cooperative at each time step. With the small world network, friends of friends are more likely to be friends, and the selected agent will reach less agents than in the random network case, ending up with smaller cooperatives.
The results on segregation with inequality aversion are driven by the stronger effect of inequality aversion in smaller cooperatives. In the case of the complete network, everybody is connected to everybody else, but cooperatives are too large for ORP to have an effect. Low-risk agents thus leave quickly and create large and completely segregated cooperatives. In the small world network, friends of friends are more likely to be friends and cooperatives are small. The effect of inequality aversion on segregation is thus slightly strongest in the small world network.
All these mechanisms also hold with altruism although there are larger effects on the size of the cooperative (due to the fact that, under altruism, the shape of the network also determines the agents toward whom one is altruistic).
We have also tested for endogenous evolving networks. The idea was that agents are able to drop some links to creates news ones inside their cooperatives. Each time step, with a certain probability, agents in cooperatives were able to do so. Counter intuitively this rewiring tends to increase segregation in cooperatives with altruism. Indeed the cooperatives are still more segregated than the network itself because in the network there is no correlation between my type and the type of my friends. The rewiring tends to create such a positive correlation: the composition of my friends will converge to the composition of my cooperative, which is segregated. Then the new cooperatives created will have more chance to be already segregated. Moreover, with sufficiently high probability of rewiring, the property of small world networks (high cliquishness and small average path) would no longer maintain and often the network splits.
Rights and permissions
About this article

Cite this article
Barbet, V., Bourlès, R. & Rouchier, J. Informal risk-sharing cooperatives: the effect of learning and other-regarding preferences. J Evol Econ 30, 451–478 (2020). https://doi.org/10.1007/s00191-019-00644-9
Published:
Issue Date:
DOI: https://doi.org/10.1007/s00191-019-00644-9