
Abstract
The growth or decline of a population over a period of time can be expressed in terms of the changes in biomass. The changes that occur are the result of the sum of the individuals born (R) minus those dying (M) during the interval, the growth (G) of the individuals in the population, and of the net difference between emigration (E) and immigration (I).
This is a preview of subscription content, log in via an institution.
Buying options
Tax calculation will be finalised at checkout
Purchases are for personal use only
Learn about institutional subscriptionsNotes
- 1.
Life tables can be applied to plants and seaweeds if they can be differentiated as individuals. Chapman (1986) reviews the demography of seaweeds. Harper (1977) reviews population dynamics for plants.
- 2.
A collection of all the individuals present at any one time, indicated by the vertical dotted line, would include all the live individuals present. This is L x the survivorship table age structure, and is shown in the histogram at top right of Fig. 4.1.
Fig. 4.1 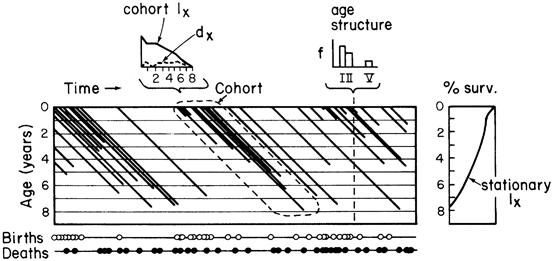
Diagram of the life and death of individuals of a hypothetical population over age classes and over time. The history of each individual is given as the diagonal lines. In the small graph of the top left of the figure, the vertical axis is the number of individuals, the horizontal axis is age in years. In the graph to the right, the vertical axis is age in years. (Adapted from Margalef (1978))
- 3.
This is the same problem presented by life insurance rates calculated on the basis of outdated human survivorship data. Since current human survival rates are nearly always higher than earlier rates, the fairer (and cheaper) rates will be those calculated for the very latest survival data. Incidentally, most of the development of life tables for ecological work was done based on actuarial techniques.
- 4.
Equation (4-17) is not completely correct, even though it appears very frequently in the ecological literature. See Goodman (1982) for a discussion of the correct version,\({v_x} = ({{{{e^{rx + 1}}}/{{l_x}}}})\sum_{y = x}^\infty {e^{-ry}}{l_y}{m_y}\) The values calculated using Eq. (4-21) are in error by e r. Since we are generally interested in the patterns of the v x over x, the error is not critical, since the pattern will still be evident.
- 5.
In human populations there has been too much attention given to total family size and too little to age at first reproduction. Cole (1965) showed that human populations that started reproducing at 12 years of age could attain over twice the growth rate of a population whose age at first birth was 30 years of age. The effect of total number of children was small compared to the effect of age at first reproduction. The countries where growth of population has been most successfully curtailed are those where economic and social restrictions have led to delayed reproduction until the parents were in their 30s, as well as to reductions in the number of children per family.
- 6.
“r” refers to the intrinsic rate of increase of a population, and “K” to the carrying capacity of the environment, as used in the logistic equation of population growth, discussed in Chap. 5.

Author information
Authors and Affiliations
Corresponding author
Rights and permissions
Copyright information
© 2015 Springer-Verlag New York
About this chapter
Cite this chapter
Valiela, I. (2015). Population Dynamics in Consumers. In: Marine Ecological Processes. Springer, New York, NY. https://doi.org/10.1007/978-0-387-79070-1_4
Download citation
DOI: https://doi.org/10.1007/978-0-387-79070-1_4
Published:
Publisher Name: Springer, New York, NY
Print ISBN: 978-0-387-79068-8
Online ISBN: 978-0-387-79070-1
eBook Packages: Biomedical and Life SciencesBiomedical and Life Sciences (R0)