
Abstract
This chapter describes the state-of-the-art of the potential of Digital Earth for progressively better solutions for disaster mitigation. The chapter illustrates the use of strong Digital Earth tools for data sharing and important potential for users, such as 2D or multi-D visualizations. Milestones of developments in early warning, disaster risk management and disaster risk reduction concepts are highlighted as a continuous movement between sustainable development and original concepts of disaster risk reduction. Improved solutions have been based on new research directions formulated in Sustainable Development Goals tasks and by expanding the possibilities of new effective solutions via newly organized data ecosystems generated by the United Nations Global Geospatial Information Management, the Group on Earth Observations and the Group on Earth Observations System of Systems, Copernicus and, more recently, the Digital Belt and Road initiative. The new trends in spatial big data are emphasized; the most important for disaster risk reduction are the basic theses of the U.N. Conference in Sendai. This chapter describes three aspects: innovative Digital Earth development, national and local disaster risk assessment and the benefits arising from the use of maps and dynamic data, and analyses of the contributions of cartography to disaster risk reduction.
You have full access to this open access chapter, Download chapter PDF
Keywords
1 Introduction
In this chapter, we describe the state-of-the-art potential of Digital Earth (DE) for progressively better solutions for disaster mitigation.
For over 20 years, DE has witnessed an ebb and flow in interest from the world’s scientific community. Initially, it sought a place between activities focused strictly on maps, data and information (Global Map—GM, Global Spatial Data Infrastructure—GSDI, etc.). Later, it began to push through with a comprehensive concept and an emphasis on the need to share and integrate data and information, and impetus and knowledge from the scientific realm, the private sector, and the needs of people in different parts of the Earth. Today, novel solutions are expected from DE, which will also significantly help realize disaster risk reduction (DRR) and Disaster Mitigation projects. Al Gore (former vice president of the USA) described a concept and definition of Digital Earth in his speech in Los Angeles on January 1998, saying it is: “A multiresolution, three-dimensional representation of the planet, into which we can embed vast quantities of geo-referenced data” (Gore 1998). In 2008, Goodchild noted that “Digital Earth includes four aspects: visualization, ease of use, interoperability and mashups, modelling and simulation” (Goodchild 2008). Some of the best analyses of the potential of the DE concept in the European Union (EU) are the SWOT analyses by De Longueville et al. (2010a, b). Studies showed positive and attractive aspects based on the political and economic support of influential countries such as the USA, China and, more recently, Russia. They also found obstacles originating from overly complex DE approaches that did not fit the research concepts of the EU. Clarification of DE leadership was also an issue. These aspects are all important for finding more successful approaches to solve disaster mitigation and DRR problems that are natural, societal or economical, as well as complex ones including known and unidentified factors. In addition, knowledge and new technologies are developing. We now have access to new near- to real-time information resources such as Prevention Web, the knowledge platform for disaster risk reduction managed by the U.N. Office for Disaster Risk Reduction (U.N. DRR), and research analyzing some of the unsuccessful efforts in developed countries such as those during Hurricane Katrina and recommending adequate steps in the future.
Section 15.2 describes the terminology used in disaster mitigation and this chapter and as well as some of the supportive efforts of international scientific organizations. Section 15.3 describes the development of early warning (EW), disaster risk management (DRM) and disaster risk reduction (DRR) concepts. Section 15.4 describes Digital Earth for the future of disaster mitigation and DRR and innovative support of the implementation of the Sendai Framework and existing geospatial projects, including the U.N. Global Geospatial Information Management (U.N. GGIM), Copernicus, Global Earth Observation System of Systems (GEOSS) and Digital Belt and Road (DBAR). Section 15.5 introduces national and local disaster risk assessment and the benefits arising from the usage of maps and dynamic data. Section 15.6 analyzes and shows the development of selected disaster risk mapping approaches and technologies with examples of adaptation principles, context map composition and existing symbol systems. Studies have attempted to recognize how users and inhabitants understand information from databases, maps and specialized models. The final Sect. 15.7 discusses expected developments in the research and technology background in the near-future. It will be necessary to accelerate the creation of new concepts from new knowledge (like from the Hyogo Framework) and new environments created by the realization of ideas of the U.N. GGIM and Chinese DBAR. All these approaches were developed on the same background as part of new data and information media, demonstrating how the potential is open to all of society as well as specialists and decision makers. Some of the approaches, such as mobile tools and digital maps, are described in this chapter.
2 Terminology and Research Organization Efforts
A very important aspect of new approaches is the terminology. The United Nations International Strategy for Disaster Reduction (U.N. ISDR) created the first terminology from the fields of early warning, disaster risk management and disaster reduction, which has been updated according to development the field. In this chapter, selected terminology from the U.N. ISDR is used.
The definitions of disaster mitigation, emergency, disaster damage, disaster impact, disaster management, emergency management, disaster risk, acceptable risk, residual risk, disaster risk assessment, disaster risk management, disaster risk reduction, early warning system, multi-hazard early warning system, and vulnerability can be found in the U.N. ISDR (2009).
There are two globally operating organizations, the U.N. ISDR and Integrated Research on Disaster Risk (IRDR), which formulate global tasks in the disaster risk reduction (DRR) area. There are also activities in important world organizations and by members of the International Science Council (ICSU). The first working group and later the Commission Cartography for Early Warning and Disaster Risk Management were founded within the International Cartographic Association—ICA (in 2004 and 2007, respectively, arranged by Konecny). The activities of the International Society for Photogrammetry and Remote Sensing (ISPRS), which started the GI4DM organization, were also very fruitful as well as those of the International Federation of Surveyors (FIG), which was organized during Working Week 2016 in Christchurch, New Zealand, at the Recovery from Disaster conference.
3 Development of Early Warning (EW), Disaster Risk Management (DRM) and Disaster Risk Reduction (DRR) Concepts
In the past, DRM was solved together with problems of the environment, subsequently developed relatively separately, and a new DRR trend enhanced their close cooperation in contemporary sustainable development efforts. There are two lines of development in U.N. documents in approaches to crisis situations, both natural and anthropogenic. They are:
-
(1)
Environmental, linked to finding the most appropriate environmental approaches to solve planet Earth’s problems. They are mainly oriented around concepts of sustainable development (SD). As a first important document mentioning natural disasters in the Report on Approaches to Crisis Management Issues Related to Development, U.N. environmental policies were created at the United Nations Conference on the Human Environment in Stockholm on 5–16 June 1972 (http://www.biblebelievers.org.au/gc1972.htm). Later, this approach was documented at the United Nations Conference in Rio de Janeiro in 1992, in Johannesburg in 2002 and at many others.
-
(2)
Crisis risk management (early warning, disaster management and disaster risk reduction). The second line of development includes the Yokohama and Hyogo World Conferences (1994 and 2005), the Global Platform for Disaster Risk Reduction in Geneva in 2010 and the key concept of the “U.N. International Strategy for Disaster Reduction” (ISDR—United Nations International Strategy for Disaster Reduction). Another concept was developed in disaster risk research, which addresses the problem of natural and human-induced environmental hazards in IRDR (Integrated Research on Disaster Risk) (Konecny et al. 2010).
Three United Nations Conferences focused on DRR have been held. First, the World Disaster Reduction Conference in Yokohama in 1994, which defined the Yokohama Strategy and Plan of Action for a Safer World: guidelines for natural disaster prevention, preparedness and mitigation. The Second World Conference on Disaster Reduction was held in Kobe, Japan from 18 to 22 January, 2005. The Hyogo Framework for Action (2005–2015) (HFA): Building the Resilience of Nations and Communities to Disasters was an outcome of the 2005 conference. The HFA set five specific priorities for action: (1) making disaster risk reduction a priority; (2) improving risk information and early warning; (3) building a culture of safety and resilience; (4) reducing the risks in key sectors; and (5) strengthening preparedness for response (WCDRR 2016). The third conference was the Third U.N. World Conference on Disaster Risk Reduction in Sendai, Japan in 2015 (United Nations General Assembly 2015). The goals and role of research in the realization of these topics are described in Sect. 15.4 of this chapter. The Sendai Framework materials highlighted the need to tackle disaster risk reduction and climate change adaption when setting the Sustainable Development Goals, particularly in light of the insufficient focus on risk reduction and resilience in the original Millennium Development Goals (WCDRR 2016).
4 Digital Earth for the Future of Disaster Mitigation and DRR: Innovative Support of the Implementation of the Sendai Framework
4.1 Sendai Disaster Reduction Conference Targets
In the Third U.N. World Conference (U.N. DRR) on March 14, 2015 in Sendai, Japan, the Sendai Framework for Disaster Risk Reduction 2015–2030 was adopted (United Nations General Assembly 2015). The U.N. DRR conference is a culmination of contemporary state-of-the-art approaches to solve the problems of risks and disasters on our planet. The conference materials mentioned the role of Information and Communication Technologies (ICT), geographical information system (GIS), remote sensing, mapping, sensors, and volunteered geographic information. The document does not mention explicitly Digital Earth, but the proposed solutions follow lines defined by Digital Earth pioneers and updated according to research frontiers in the world. The necessity of design for deep integration of data and information and the necessity of offering products to specialists, customers and all society in an understandable way were emphasized.
The Sendai Framework defined four new priorities of action:
-
Priority 1: Understand disaster risk;
-
Priority 2: Strengthen disaster risk governance to manage disaster risk;
-
Priority 3: Invest in disaster risk reduction for resilience;
-
Priority 4: Enhance disaster preparedness for effective response and “Build Back Better” in recovery, rehabilitation and reconstruction (United Nations General Assembly 2015).
The priorities are equally important to find better solutions, and the Digital Earth concept should be useful in addressing all of them. We discuss the priority 1 intentions here. Researchers know enough about individual disasters, but are weak in their knowledge when disasters are combined, as in the Fukushima nuclear power station collapse or the Wenchuan earthquake. It is very valuable that solutions are being accepted at global, national, regional and local levels. In priority 1: Understanding disaster risk, on national and local levels, there are requests to develop, periodically update and disseminate location-based disaster risk information such as risk maps to decision makers, the general public and communities at risk of exposure to a disaster in an appropriate format by using applicable geospatial information technology. In addition, local and national organizations promote real-time access to reliable data, make use of space and in situ information, including geographic information systems (GIS), and use information and communication technologies innovations to enhance measurement tools and the collection, analysis and dissemination of data.
The DRR framework defined in Sendai is inextricably linked with the main U.N. document defining the Sustainable Development Goals 2015–2030 (SDGs).
4.2 Global Development Policy Framework (GDPF)
With other U.N. documents such as the Sendai Framework for DRR 2015–2030, the SIDS Modalities of Action (SAMOA) Pathway, the Addis Ababa Action Agenda, the Paris Agreement on Climate Change and the HABITAT III Urban Agenda, the SDGs created a newly formulated Global Development Policy Framework (GDPF) (Fig. 15.1).

Source UN-GGIM: strengthening the global data ecosystem, by Scott, ©2018 United Nations. Reprinted with the permission of the United Nations
Global development policy framework.
In addition to natural disasters, there are new issues connected with problems of cities or megacities from the geospatial information perspective in particular and for DE in general. These problems are defined in another activity of the GDPF—HABITAT III. Its key document “The New Urban Agenda” was adopted at the United Nations Conference on Housing and Sustainable Urban Development (Habitat III) in Quito, Ecuador (United Nations 2016) and represents a shared vision for a better and more sustainable future. If well-planned and well-managed, urbanization can be a powerful tool for sustainable development for both developing and developed countries. The conference reached a critical point in understanding that cities can be the source of solutions to, rather than the cause of, the challenges that our world is facing today.
The New Urban Agenda presents a paradigm shift based on the science of cities; it lays out standards and principles for the planning, construction, development, management, and improvement of urban areas. The agenda also incorporates a new recognition of the correlation between good urbanization and development. The New Urban Agenda realizes the 2030 Agenda for Sustainable Development, especially Goal 11 on Sustainable cities and communities. It also planned to adopt and implement DRR and management, reduce vulnerability, build resilience and responsiveness to natural and human-made hazards and foster the mitigation of and adaptation to climate change. DRR is aimed at preventing new risk, reducing existing disaster risk and managing residual risk, all of which contribute to strengthening resilience and therefore to the achievement of sustainable development. DRR is the policy objective of disaster risk management, and its goals and objectives are defined in disaster risk reduction strategies and plans.
To improve the quality of solutions in disaster mitigation and DRR, U.N. member states should facilitate the strengthening and normative capacity-building of global geospatial information management in support of the implementation of the 2030 Agenda. Efforts include promoting the use of geospatial information systems and services for modern mapping, methodological development, national and regional capacity-building, setting of standards, data collection, dissemination and sharing, and better integration of geospatial and statistical information systems of U.N. Member States.
4.3 U.N. GGIM
A newly established Global Data Ecosystem by the U.N. Global Geospatial Information Management (U.N. GGIM) will support realization of the SDGs, including all aspects linked with DRR, to respond to global data ecosystem needs. It helps to develop the global understanding of geospatial information and, in a second step, its coordination, coherence and implementation. The vision is to position geospatial information to address global challenges and missions to ensure that geospatial information and resources are coordinated maintained, accessible, and used effectively and efficiently by member states and society to address key global challenges in a timely manner.
In the U.N. GGIM, Scott defined the data needs for the 2030 Agenda as follows (Scott 2018): “The scope of the 2030 Agenda requires high-quality and disaggregated data that are timely, open, accessible, understandable and easy to use for a large range of users, including for decision making at all levels. There is a need for a reporting system on the SDGs that would have benefit from the subnational (local) to the national level; and allow for global reporting that builds directly on the data shared by countries. It is important to create an opportunity for countries to directly contribute to the global reporting. While the challenges are immense, the digital technology that is available today allows the necessary transformation. An aspiration is to strengthen countries’ national geospatial and statistical information systems to facilitate and enable a ‘data ecosystem’ that leverages an accessible, integrative and interoperable local to global system-of-systems.”
The U.N. GGIM is the newest initiative to qualitatively improve the potential to solve the problems of the world, including disaster mitigation. In addition, other important initiatives have the same aim in specific regions of the World—e.g., Copernicus for Europe and the Digital Belt and Road (DBAR) initiative in Asia.
4.4 Copernicus—A European Contribution to GEOSS
Copernicus (formerly Global Monitoring for Environment and Security—GMES) is a European project based on data received from Earth observation satellites and ground-based information. These data are coordinated, analyzed and prepared for end users. Through Copernicus, the state of our environment and its short-, medium- and long-term evolution are monitored to support policy decisions and investments. Copernicus plays key role in EU EW, DRM and DRR efforts. Copernicus mainly supports decision making by institutional and private actors. Decisions can concern new regulations to preserve our environment or urgent measures in the case of natural or man–made catastrophes (i.e., floods, forest fires, water pollution) on a global scale. The services are used by environmental agencies, local, regional and national authorities, and civil protection organizations. The new observation techniques and analysis of data will allow for these actors to better anticipate potential threats, to intervene in a timely manner and to increase the efficiency of the intervention. Figure 15.2 shows the structure and purposes of Copernicus.

Adapted from: EC (2019). Used with permission: Copernicus EU, European Commission
Structure of Copernicus.
Copernicus (and its INSPIRE component) is the European contribution and participation in the worldwide monitoring and management of planet Earth organized by the Group on Earth Observation (GEO). The global community acts together for a synergy of all techniques of observation, detection and analysis. At the World Summit on Earth Observation in Washington in July 2003, the Group on Earth Observations (GEO) was established with the goal of addressing the information requirements for the environment on a global scale. In Brussels in February 2005, a 10-year implementation plan of an integrated global earth observation system of systems (GEOSS) was defined. A number of operational systems for supporting disaster response have made steady to strong progress. Collaborative supersites have been established for the scientific community to monitor and analyze volcanoes and earthquakes more rapidly and effectively; for example, supersites have improved the assessment of earthquakes in Haiti, China, Chile, and Indonesia. One example is SERVIR that provides mapping for disaster response and has assisted countries in Central America and the Caribbean in responding to hurricanes, earthquakes and other extreme events (GEOSS 2019).
4.5 Digital Belt and Road Program—Disaster Efforts
The Digital Belt and Road (DBAR) program and Digital Silk Road Alliance (DSRA) are relatively new activities initiated by the Silk Belt and Road (BAR) initiative. The DBAR is a pioneering international venture to share expertise, knowledge, technologies and data to demonstrate the significance of Earth observation science and technology and applications for large-scale sustainable development projects. The extensive geographical scope of the “BAR” initiative calls for smart uses and applications of big Earth data in the design, development and implementation of diverse projects related to infrastructure improvement, environmental protection, disaster risk reduction, water resource management, urban development, food security, coastal zone management, and the conservation and management of natural and cultural heritage sites. DBAR is committed to implementing projects and actions relevant to the 17 Sustainable Development Goals (SDGs) adopted by the United Nations in September 2015 (United Nations Brussels Team 2018). In the DBAR, natural hazards are an important issue. Belt and Road nations experience approximately 85% of the world’s major earthquakes, tsunamis, typhoons, floods, droughts and heatwaves. For example, more than 86,000 people were killed or reported missing in a massive earthquake in Wenchuan, China in May 2008 and the 2004 Indian Ocean earthquake and tsunami killed hundreds of thousands of people. Seven of the top ten countries that saw major losses from disasters between 1995 and 2014 are in this region (Guo 2018, p. 26). The program monitors different types of ecosystems and their evolution, including grasslands, forests, glaciers, urban areas, farmland and coastal regions. Environmental and socioeconomic information will be shared through a platform for big Earth data, scheduled for roll-out between 2016 and 2026. This open-access gateway will allow for researchers, policy makers and the public to track changes, development and trends. The program will investigate indices and indicators to feed into the UN’s 2030 Sustainable Development Goals (Guo 2018).
Working group 6 of the DBAR says that DBAR disaster aims to integrate Earth observations (EO) and social vulnerability data to promote implementation of the Sendai Framework in countries along the BAR region. The approach taken by this WG covers satellite information and communication technologies as well as implementation-oriented technologies that involve hardware solutions for risk reduction challenges. “If we do nothing, sensitive environments will be lost and exposure to risks will rise” (Guo 2018).
There are efforts to find solutions using newly defined ideas about big Earth Data. There are four main obstacles to a strategy for the Belt and Road region: poor access to data; a digital divide between developed and developing countries; a lack of awareness of the potential of Earth observations among some policy makers, local scientists and practitioners; and a lack of collaboration. These are long-standing problems—they also slowed emergency responses during and after the Indian Ocean tsunami in 2004, for example.
Important consequences of DBAR strategies necessitate research on new approaches and knowledge improvements. There should be proof of concept for the data. Guo is developing a new concept of big Scientific data and big Earth Data (Guo 2017, p. 4): “Big data is a revolutionary innovation that has allowed the development of many new methods in scientific research. This new way of thinking has encouraged the pursuit of new discoveries. Big data occupies the strategic high ground in the era of knowledge economies and also constitutes a new national and global strategic resource. “Big Earth data”, derived from, but not limited to, Earth observation, has macro-level capabilities that enable rapid and accurate monitoring of the Earth, and is becoming a new frontier contributing to the advancement of Earth science and significant scientific discoveries. … Big data research is different from traditional logical research. It uses analytical induction applied to a vast amount of data to statistically search, compare, cluster, and classify. It involves correlation analysis and implies that there may be certain a regularity in the relation between the values of two or more variables; it also aims to uncover hidden correlated networks.”
The substantive characteristics of big data computing comprise a paradigm shift from model-driven science to data-driven science, as well as the establishment of a data-intensive scientific approach.
As a branch of big data, scientific big data is a typical representative of data-intensive science. Scientific big data has a number of characteristics, including complexity, comprehensiveness, and global coverage, as well as a high degree of integration with information and communication technology. The approaches used in science are also being transformed—from single-discipline to multidisciplinary and interdisciplinary approaches, from natural science to the integration of natural and social sciences, and from work carried out by individuals or small research groups to projects coordinated by international scientific organizations.
In addition to helping scientists solve hard or previously unsolvable problems through real-time dynamic monitoring and analysis of various related data, the data itself can become an object and tool of research: scientists can conceive, design, and implement research based on the data (Hey et al. 2009 in Guo 2017).
Earth science research, including the atmosphere, land and ocean, has produced huge datasets derived from satellite observations, ground sensor networks, and other sources. This is collectively called big Earth data. Big Earth data has features in common with scientific big data and also has unique characteristics. Big Earth data is characterized as being massive, multisource, heterogeneous, multitemporal, multiscale, high-dimensional, highly complex, nonstationary, and unstructured. It provides support for data-intensive research in the Earth sciences. Modern Earth science requires globally established, quasi real-time, all-weather Earth data acquisition capabilities, and has developed an integrated space-air-ground observation system with high spatial, temporal, and spectral resolutions (Guo 2017).
To realize the above-mentioned efforts, the ISDE organization initiated the Digital Silk Road Alliance (DSRA), established in Sydney in April 2017 with the support of the China Association for Science and Technology (CAST), with the aim of building a network of scientists involved in the Digital Belt and Road initiative and using Digital Earth and geospatial information technologies to solve the scientific problems facing human beings, and to address problems related to the U.N. Sustainable Development Goals.
The DSRA wants to develop Digital Earth in the fields of cartography, remote sensing and geo-information sciences, which are essential for socioeconomic development. Further development of cooperation mechanisms and frameworks toward the development of Earth observation systems and Digital Earth is expected. It is important to use such approaches on global and regional levels in the realms of Earth observation and Digital Earth.
4.6 GGIM and DBAR Comparisons and Potential
Comparing the contemporary differences between the U.N. GGIM and the DBAR, the U.N. GGIM is a mature project connected with stable governmental and public infrastructures aiming to address the needs of the SDGs and Sendai DRR and contemporary needs of civil society and its organizations. DBAR has similar ambitions but primarily originated from the countries where spatial data infrastructure (SDI) and national data infrastructure (NSDI) were still not fully developed according to the Silk Belt and Road. The DBAR has a new approach to look for and elaborate big data, mainly based on satellite images. There are still missing concepts regarding delivery of data to interesting groups, the private sector and individual inhabitants (such as the U.N. GGIM using INSPIRE knowledge and experiences). Along the Belt and Road, countries have different political and economic systems and different data, information and knowledge policies. There has been great investment in the DBAR, which created hopes for fast improvement of the situation, but data and information are only part of the efforts, including DRR. In many countries, geoinformatics and cartography are unappreciated. Maps are created without knowledge of how they will be accepted by users (context and adaptive maps) and how the information should be delivered for professionals and public users. This is very important in EW, DRM and DRR.
It is difficult to say which areas will benefit more from Digital Earth. Because the problems are very complex, their solutions require powerful and adaptable tools. Digital Earth is based on integration of various streams and determination of adequate decisions. Informed decisions also rely on the wishes, opinions and reactions of societies, which can be collected via information from social media or volunteers in the field.
It is likely that the main tasks of the U.N. GGIM will be realized incrementally. DBAR activities elaborating important and new aspects of the big data reality will create new situations in data policies in the countries along the Silk Road and Belt. Convergence of both streams will be inevitable and will lead to realization of the dreams of the founders of SDI and NSDI as well as appreciation of modern visualization methods, mainly cartographical ones. Those methods will help experts and the contemporary public to understand problems and cooperate to create solutions for disaster mitigation problems.
5 Digital Earth for National and Local Disaster Risk Assessment
Digital Earth is suitable for reporting practices that have been already tested and implemented in one locality and can be successfully adapted in another. Sharing of practices is important in any field of human activity, including disaster risk management. As noted by Amaratunga et al. (2015), sharing of sound practices is intended to improve knowledge sharing for exchange of data and experiences between users on every level—global, national and local.
5.1 National Level
The goal of every state is to identify and minimalize risks in its territory. In the Czech Republic, a group of emergency management experts studied the emergency threats and vulnerabilities (Paulus et al. 2016) and identified and categorized the most typical emergency situations. From this analysis, 22 typological emergency situations were pinpointed. A detailed and typified plan for each emergency was defined, including the responsible public administrative organization and the administrative level on which the plans are used (central, regional, local). An indispensable part of each typified plan is the list of recommended spatial data and maps necessary for a successful reckoning of a particular emergency. Public administration bodies are responsible for the development of action plans on the regional and local levels and for identification of key stakeholders.
5.2 Local Level—Cities and Urban Areas
A report titled “State of Disaster Risk Reduction at the Local Level: A report on the Patterns of Disaster Risk Reduction Actions at Local Level” (Amaratunga et al. 2015) focuses on disaster risk reduction in urban areas: “Fast growing cities and urban areas of the world increase disaster risk due to economic growth and fast population expansion. … Sound practices that have been tested and implemented by different cities around the world aid knowledge sharing opportunities for future disaster risk reduction. … The intent is to provide local governments and other institutions learn from one another by effectively facilitating the sharing of sound practices and disseminating these established sound practices in risk reduction.”
Ten essential goals and examples of well-functioning solutions for local governments to make their cities more disaster-resilient were defined and are listed below (U.N. ISDR 2012).
5.3 Existing Methodologies for Risk Assessment
Overviews of how to map and estimate risk have been presented by several scholars (Kappes et al. 2012; Klucka 2014; Forzieri et al. 2016). The European Commission published the Risk Assessment and Mapping Guidelines for Disaster Management (EC 2010), but it was not the first draft of such a pan-European manual. For example, the output of the European project Interreg IIIC Interregional Response to SIPROCI, to which seven countries contributed, is even wider and more thorough than the above mentioned EU final document but was never fully implemented at the European level (SIPROCI 2007). An example of a major non-EU agency that deals with risk discovery and estimation is the Federal Emergency Management Agency (FEMA) from the USA. FEMA announced the release of the State Mitigation Plan Review Guide in 2016 (FEMA 2016) that aids state, tribal, or local governments in developing hazard mitigation plans.
5.4 Using Maps for Risk Assessment
An important part of any methodology for identifying and estimating risks is the design of presentations to professionals and the general public. The ideal way to view the risk estimates clearly is a map. The significance and role of maps is described in the book Successful Response Starts with a Map (National Research Council 2007), prepared as a Hurricane Katrina analysis. The creation of maps for risk identification was also described by the above mentioned SIPROCI project (2007) and by other authors including Carpignano et al. (2009) and Winter (1993) described in Dymon (1994). Carpignano et al. (2009) described the development of a decision support system based on a multirisk approach that can overcome difficulties in the overall risk assessment for a territory. To define multirisk maps, a multirisk perspective and stakeholder’s perceptions were integrated into a classical risk assessment frame. The specific purpose of this work is to describe the methodological framework built at this stage of the project and discuss the initial results.
Dymon (1994) describes a hazard management map taxonomy offered by Winter (1993) that regards hazard, risk and emergency as the three major categories:
-
Hazard maps identify and display the location of hazard zones, areas where there are dangers to humans and their property.
-
Risk maps (vulnerability) require calculation of the conditional probability that a given area will experience a particular hazard or a combination of hazards and portray the spatial distribution of those risk computations.
-
Emergency maps comprise three additional types: planning, evacuation and crisis maps.
The SIPROCI report (2007) provides a comprehensive method for risk mapping. However, specific proposals were not included in the official final methodology (EC 2010). However, conclusions and recommendations were incorporated into the methodology, such as the by the Fire Rescue Service in the Czech Republic (Krömer et al. 2010), which recommends creating the following types of maps:
-
Hazard map—a summary map of the different types of hazards, i.e., a digital map of the manifestations of individual types of emergencies.
-
Vulnerability map—the indicator of accumulated vulnerability of the territory as a sum of partial elements of vulnerability.
-
Preparedness map—readiness in the territory can be expressed as the availability of forces and means (components of the integrated rescue system) and the availability of means of protection of the population (e.g., coverage of the territory by end elements of the warning).
-
Risk map—a summary of all the above map types.
In its official methodology, the EU Risk Assessment and Mapping Guidelines for Disaster Management (EC 2010) only include general recommendations for preparing these types of maps:
-
Maps of the spatial distribution of major hazards show the spatial distribution of all relevant elements that need to be protected, such as population, infrastructures, and naturally protected areas.
-
The spatial distribution of vulnerability in terms of the susceptibility to damage for all relevant subjects.
-
These maps can then provide the basis for the preparation of risk maps in terms of showing the combination of the likelihood and impact of a certain event, as well as for creating of aggregated hazard maps.
However, specific mapping requirements for risk assessment only appear in EU directives for flood mapping such as the Floods Directive (EC 2007). Flood risk mapping is the area of disaster management in which mapping methodologies have advanced the most. The EU directive on the ‘Assessment and management of flood risks’ requires Member States to conduct an initial assessment for flood hazard maps and flood risk maps:
-
The hazard maps should cover geographic areas that could be flooded according to different scenarios. Flood hazard maps show the extent of floods at high- (optional), medium- (at least a 100-year return period) and low-probability floods or extreme events.
-
Risk maps should show the potential adverse consequences associated with floods under those scenarios.
5.5 The Benefits of Digital Earth for Risk Assessment—Using Dynamic Data
Creating maps with the standardized content and symbolism mentioned in the previous section is necessary for preparing the components of an integrated rescue system for crisis situations and for managing them. However, the basis of the Digital Earth concept is not the creation of printed and static maps, but the dynamic sharing of different types of data, including near-real time data sharing. The development of electronics, networks, databases, data sharing (included in Digital Earth) brings new possibilities for risk assessment.
As an example, for a risk assessment at a particular location and at a certain time, it is possible to take advantage of the current location of mobile phones, from which the present population can be estimated more accurately than using the standard census data. Extensive studies focused on different aspects of human presence estimation based on mobile phone data have been presented, particularly from Europe and Asia (Ahas et al. 2010; Batista e Silva et al. 2013; Cao et al. 2017; Järv et al. 2017; Kang et al. 2012). Kubíček et al. (2018) proposed analysis of human presence using data from mobile operators. The analysis is based on a dataset describing the estimated human presence (EHP) with two values—visitors and transiting persons—depending on the overall time spent within a specific mobile cell.
The advantage of using the EHP numbers over data from a census was analyzed during the Integrated Rescue System training held in 2017 in Brno, Czech Republic. The goal was to decide where to locate water tanks with supplies of drinking water for inhabitants in case the standard water supply network becomes contaminated.
This emergency situation is demonstrated in Fig. 15.3. “The location-allocation analysis on the leftmost side only takes into account census data and evenly distributed population throughout the administrative unit. Each water tank can supply approximately 2000 people. The second analysis adjusts the water tank locations according to the real locations of buildings and population in administrative units. The third and fourth analysis quantifies the EHP for working days and weekends. Using of EHP proposes a greater number of necessary water tanks in administrative units, and their optimal locations change according population fluctuations” (Kubíček et al. 2018).

Reprinted from Kubíček et al. (2018) by permission of Taylor & Francis Ltd.
The role of the spatiotemporal distribution of the population in the case of a water shortage.
Risk assessment is addressed at different levels (international, national and local), and each of these levels has its own goals and uses. It is very useful to share experiences and data between these levels. This allows for generalization of knowledge and results from the local level to the national and international levels. Such analyses can become an engine for developing better risk assessment methods and disaster mitigation. The Digital Earth concept linking databases and enabling data sharing provides a methodological and technological background for this goal.
6 Digital Earth and Disaster Risk Mapping Technology
6.1 The Role of Cartography in Disaster Risk Mapping
In the frame of disaster risk mapping, geographic knowledge is crucial for making proper decisions. The importance of spatial information and its potential support for emergency actions were stressed and evaluated by several authors (Kevany 2008; Zlatanova and Li 2008; and Konecny 2006). Among the various ways to transmit, share, and visualize geographic knowledge, cartography is one of the most important. Cartography and geoinformatics have experienced a huge technological shift over the last 30 years. Digital Earth systems have become important foundations for data management related to geographic phenomena.
The application of dynamic cartographic visualization opens the possibilities of adaptive cartography. It allows for creating maps of current risks (e.g., current and predicted flooded area or direction of fire spread), the location of nearby emergency services, or escape routes for the population at risk.
The theory of using adaptive cartography for emergency management geographic support was described by Reichenbacher (2003) and Meng (2005). This method is based on the idea of geographic data visualization automation and adjustment according to the situation, purpose and user’s background (Reichenbacher 2003).
The adaptation of maps can generally be defined by a number of “Ws”—what, when, where, who, and how—as documented in Fig. 15.4. It illustrates the types of contexts that can influence the conditions of disaster risk mapping.

Adapted from Kozel et al. (2011)
Possible contexts influencing map use and mapping.
6.2 Use Case Examples
The adaptive mapping principles described in the previous section were demonstrated in several scenarios, e.g., Talhofer et al. 2007, Mulickova et al. 2007. One of the scenarios, called “FLOOD”, aims to improve flood management. A case study was practically verified in the winter of 2011/2012, when one of the field experiments was performed. Based on an analysis of the flood management system in the Czech Republic (Kubíček et al. 2011), five main ACTIVITIES were defined for the Flood Use case (SITUATION):
-
PREDICTION AND PROGRESS—development and expected progress of the flood
-
TECHNICAL SUPPORT—technical support in the inundated area—support of Flood Security Activities
-
RESCUE—the evacuation of citizens
-
ORGANIZATION—an organization of powers and means
-
PUBLIC INFORMATION—information for the public on flood development, evacuation, etc.
Some of the ACTIVITIES defined above are universal (e.g., organization) and may be performed in different SITUATIONS whereas others (e.g., flood prediction) are situation-specific.
There were a few principal operational ranges defined in the presented use case: FLOODPLAIN for detailed information on the inundation, REGION/DISTRICT/MUNICIPALITY to comply with the hierarchical order of the flood management system, CATCHMENT to monitor the flood at natural borderlines, and SECTION for a detailed view of the municipality.
6.3 Use Case Adaptation Principles
The fact that an object is evaluated from the perspective of a defined context is fundamental to the map symbol adaptation process. The most important aspect of the geographic feature may not be the character of the object as defined by the data source, but what ROLE it plays in the decision-making process. The map symbol is an expression of such a ROLE. Because the data are typically collected for purposes other than emergency management, semantic relations must be defined, and new roles should be specified.
Based on context, the semantic relevance is assessed. Information on the geographic object is relevant if it is necessary for the decision-making process within the context. The relevancy assessment is important from the cartographic point of view since the large number of objects that are visualized on the map limit its legibility and thus the effectiveness of the cartographic visualization as a decision support tool.
When information is relevant, we can assess the degree of relevancy and use other cartography means to increase/decrease the importance of a spatial object or phenomena. The relevancy degree can be assessed for both the semantic and spatial aspects, as illustrated in Fig. 15.5.

Adapted from: Brezinova et al. (2011)
Degrees of spatial and semantic relevance. Cartographic symbols prepared by L. Friedmannova.
The activity and the crisis event itself undergo temporal changes and thus the object properties change as well. For example, if the water level is rising and another house is endangered or a house is already evacuated. These facts should be considered during map symbol design.
6.4 Context Map Composition
The process of data model definition is illustrated in Fig. 15.6. The emergency context defines the basic data model (e.g. the information content of the map), and relevant features of the models BASETOPO, CRITICAL, and CONTEXT SPECIFIC are selected. The basic model is then modified as the context is more precisely specified (i.e., according to the PHASE). The model is generalized and further specified for each level of detail within the operation range.

Adapted from Mulickova (2011)
Data model definition.
The examples of a context map for flood management in Fig. 15.7 document different context views of the spatial database. Context maps for three emergency contexts—PREDICTION (A), RESCUE (B, D) and ORGANIZATION (C) are shown. The level of detail corresponds with the operation range “section”. Maps share the same topographic background (i.e., BASETOPO) and, to a certain extent, flood-SPECIFIC features (i.e., the flood extent and buildings in it). The visualizations differ in activity-specific features—i.e., features specific to prediction (flood activity degree, number of affected persons), to the organization (places of intervention and its description) and to the rescue efforts (evacuation zones, routes). The features of the CRITICAL model are not included.
Maps A and B in Fig. 15.7 illustrate the phase of preparation—there is no flooding yet but there is a prediction of flooding. At that time, houses are endangered. In the response phase (Maps C and D), houses are already affected. The visualization changes are based on the progress of the disaster event.

Source Mulickova and Kubicek (2011)
Examples of context mapping for various phases of the emergency management cycle.
Maps B and D support the same activity (i.e., rescue) but in different phases. The maps display visualization changes based on the progress of the activity. In the preparation phase, the zone of evacuation is marked and buildings for evacuation are selected. In the response phase, all the buildings are already evacuated.
A possible technical implementation is described in detail by Kozel (2009) and Kozel and Štampach (2010).
6.5 Existing Symbol Systems for Disaster Management
Cartography plays a key role in disaster management for a clear representation of the necessary objects and phenomena to decision makers. Upon the occurrence of disasters, crisis management actors need specialized maps to provide a clear idea of the emergency, localization, distribution and characteristics. One of the objectives of cartographers is to design effective representation of spatial information through graphic symbols (Akella 2009). The symbols should indicate information about depicted objects and phenomena without the use of a legend, especially in an emergency. They should also provide users qualitative and quantitative information for the presented object or phenomenon (Konecny and Bandrova 2006).
A number of agencies and organizations related to disaster protection have developed databases, geo-portals and cartographic products for crisis management and adopted their own standards for symbols.
One of the most popular symbol systems for crisis management is the set of 500 humanitarian symbols of the United Nations Office for the Coordination of Humanitarian Affairs (OCHA). The symbols are freely available at http://reliefweb.int/ and aim to help disaster responders present information about crisis situations quickly and simply (United Nations Office for the Coordination of Humanitarian Affairs 2012). The symbols can be used to produce humanitarian reports, maps, and websites. The OCHA humanitarian icons are divided into 17 categories. The set of symbols covers both disasters and activities, including the supply of water containers and equipment shelter, access to people in need and protection of civilians. The icons are associative and have a simple structure that allows for easy comprehension.
The Emergency Mapping Symbology (EMS) in Canada was developed under the auspices of GeoConnections, with participation from emergency management organizations across Canada. It was designed to be used by federal, provincial, regional and local organizations involved in the management of major events, disasters, and other incidents where emergency help and security are needed (GeoConnections 2010). The EMS contains a set of symbols and a four-level, hierarchical classification of the entities. The categories include incidents, infrastructures, operations, and aggregates. Symbols in the same category have similar colors. There is also a second version of the symbols adapted for black and white printing.
The Association of Volunteer Emergency Response Teams developed a project called Disaster Response Map Symbols (DRMS) as an effort to compile a standard set of symbols aimed to support the creation of efficient maps for disaster management. It comprises 285 symbols. The DRMS contains 5 families of symbols in a single font, including vehicles, infrastructure, mobile/temporary services and teams, events, ships and some special symbols (Association of Volunteer Emergency Response Teams 2009).
Another popular symbol system is the symbology developed by federal, state, and local agencies in the USA working together under the auspices of the Federal Geographic Data Committee (FGDC) Homeland Security Working Group. The symbol system includes symbols and their definitions for the categories of incidents, natural events, operations, and infrastructures. The structure of each category and a damage-operational status hierarchy were developed using color and frame shapes with line patterns (Homeland Security Working Group 2017). The symbols are designed to be presented in color or black and white formats.
The cartographic symbols should have clear and short definitions to be used in a map legend. One very important characteristic is that they are situated on a map and should indicate qualitative and quantitative information about the represented object, phenomena or process to users.
Considering the advantages and disadvantages of existing emergency symbol systems, a new symbol system for the needs of disaster management was developed at the Laboratory on Cartography of the University of Architecture, Civil Engineering and Geodesy in Sofia. The Symbol System for Disaster Management (SSDM) was developed to support thematic mapping for early warning and crisis management and operational activities of all participants in disaster management, as well as to help citizens understand specialized emergency maps. The SSDM was designed to be useful for the general public as well as for professionals.
6.6 Opportunities for New Disaster Risk Mapping Technologies
The technological shifts in cartography and geoinformatics were on the level of data analysis and visualization, bringing new data sources from different sensors and mapping strategies. One of the most notable examples of this is cell phone data.
Data derived from active cell phones or active SIM cards for some administrative units are becoming available for various uses (see an example from the Czech Republic, the O2 Liberty API, https://www.o2.cz/podnikatel/liberty-api/). Analysis of the number of SIM cards and existing demographic data has opened a novel set of possible applications for emergency management and disaster risk mapping. The availability of cell phone data enables the following:
-
More accurate estimation of the actual number of inhabitants within the administrative unit and their temporal rhythms (example on Brno, Czech Republic in Kubíček et al. 2018). Comparing such an analysis with the existing census data and annual demographic reports (see Fig. 15.8), the administrative units can be further divided into several typological units (with the maximum during working days, weekends, etc.) In addition, the population estimations can be used to better plan the evacuation and other inhabitant-sensitive activities during emergencies.
Fig. 15.8 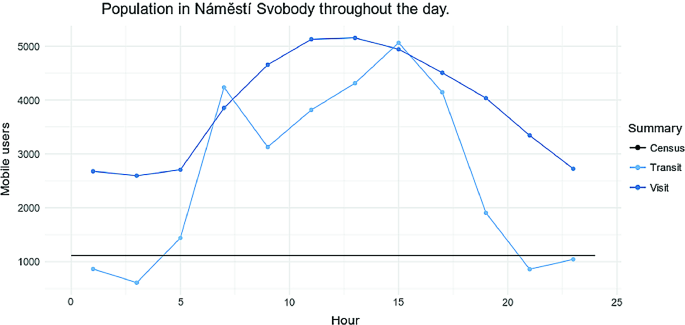
Reprinted from Kubíček et al. (2018) by permission of Taylor & Francis Ltd.
Variability of the population in an administrative unit Náměstí Svobody, Brno, Czech Republic. Comparison of cell phone and census data.
-
The cell phone data analysis often reveals regular trends as described above and some irregular peaks and peculiarities. These high concentrations of inhabitants are connected with cultural and sports events such as concerts and music festivals.

6.7 Future Directions—New Symbol System for Disaster Management (SSDM)
The examples, approaches and case studies described above provide various opportunities for future development and applications such as the development of virtual and augmented reality tools and devices. The Digital Earth concept can be also understood as a virtual reality system (Çöltekin et al. 2019).
The new cartographic Symbol System for Disaster Management (SSDM) was created in Bulgaria after proposing a classification structure of represented objects and phenomena, construction and design of symbols, implementation in real situations and use in map compiling for disaster preparedness.
6.7.1 Classification Structure
The SSDM consists of a 4-level hierarchical classification of objects and phenomena concerning disaster management and a set of 115 symbols. At the highest level, the objects are divided into 5 categories: disasters, infrastructure, protection services and safety infrastructure, affected people and infrastructure, and operational sites and activities. Each category is divided into classes, which are divided into subclasses that consist of objects and phenomena (Fig. 15.9).

Source Marinova (2018)
Classification structure
6.7.2 Design of Symbols
The ability of symbols to transmit information and the way they are perceived by map users are critically important. The design process of the SSDM started with consideration of the rules of construction and use of symbol systems, examination of the relations between objects and phenomena, their classification and specifics. The design was accompanied by optimal requirements to achieve readability, expressiveness and visibility, taking into account modern technologies and techniques in cartography. It is challenging to choose graphical variables so that all the symbols can be quickly and easily perceived and are associative and properly referred to their respective categories.
All categories of the SSDM are distinguishable by their shape and color. The symbols consist of white pictograms and shapes with various background colors. The choice of background colors, except to achieve clear distinctiveness, depends on the message that the symbols should express to the users. A psychological perception of the colors was taken into account. The different shapes for the categories aim to avoid potential problems resulting from low light or black and white printing.
Each category has an individual letter code for easy identification: A—disasters; B—infrastructure; C—protection services and safety infrastructure; D—affected people and infrastructure; and E—operational sites and activities. Each object and its respective symbol have an alphanumeric code formed by the category code and the serial number of the object in its category.
Figure 15.10 presents part of the symbol system, including the alphanumeric code, graphic symbol and a brief description.

Source Marinova (2018)
Symbols of the symbol system for disaster management (SSDM)
The status of objects in “infrastructure” and “protection services and safety infrastructure” in a crisis situation is represented by a combination of symbols in category B (infrastructure) and category C (protection services and safety infrastructure), with symbols representing destroyed, affected and unaffected objects of category D shown in a reduced size (Fig. 15.11).

Source Marinova (2018)
Symbols to present affected infrastructure
6.7.3 Maps for Disaster Protection
The new Symbol System for Disaster Management was applied in experimental development of training maps supporting actions in emergencies and in a series of maps for disaster protection at local and regional levels. The main tasks of local and regional disaster protection plans are the analysis and assessment of disaster risks, prevention and mitigation, early warning, and coordination of disaster management activities. Participants in these activities need specialized geographic information to support concrete actions.
The SSDM was applied in the production of base maps of the municipality of Troyan, Bulgaria, at a scale of 1:50000 (Fig. 15.12) and Troyan at a scale of 1:10000 (Fig. 15.13). The maps were compiled according to predefined elements of map content and aim to support activities described in the disaster protection plan of the municipality.

Source Marinova (2018)
Base map for disaster protection

Source Marinova (2018)
Base map for disaster protection (partial).
The main features of hydrography, settlements, infrastructure (including transport, telecommunication, energy, manufacturing and water infrastructure) as well as services and facilities related to disaster protection (such as hospitals, shelters, and helicopter pads) are represented by the SSDM. Based on the main disaster protection maps, a series of maps for disaster management in case of earthquakes, floods, fire, and industrial accidents were created. Additional information was provided for some features including the object name and description, number of beds in shelters, dangerous industrial objects, type of stored materials, and fire-fighting equipment. Infrastructure and services/facilities for protection are represented by the symbols in Category B and Category C (Fig. 15.13). These maps also support predisaster activities, including assessment and preparedness.
In a crisis situation base maps can be processed into rapid and reference maps presenting the type and location of disaster(s) by adding symbols from Category A and symbols for affected people and affected infrastructure in Category D (Fig. 15.14). The symbols for operational sites and activities (Category E) could be useful for damage assessment and recovery in the postdisaster stage.

Adapted from: Marinova (2018)
A map for evacuation planning
The map content and displayed information of operational situations could help support the responsible authorities and individuals to make timely and effective decisions. Such maps could allow for identification of the affected areas in municipalities or regions, and provide significant contributions to population protection, mitigation and evacuation planning operations.
Cartography plays a key role in the main stages of disaster management. Efficient and cooperative preventive and protective activities of authorities require appropriate and easily understood geographic information. The use of a standard system of associative symbols can facilitate significantly cooperative disaster management strategies at local, regional and international levels.
7 Conclusion
Disaster mitigation and DRR are complicated processes, and solutions could be improved by using powerful tools such as Digital Earth. The concept of DE covers almost all activities occurring in ICT in the contemporary world. To be successful in employing the right solutions, we need to create improved concepts that consider the newest knowledge about disaster mitigation and DRR. To realize this, we need well-organized data and information such as in data ecosystems (as in the U.N. GGIM) that reflect the complexity of the problems to be solved, defined by the SDGs. Sharing data and information, visualization with the help of digital maps, cartographic models and their combinations hold important promise to support decision makers and society with true and understandable outputs to help to comprehend situations, to create instructions and standards on how to behave in various situations, and to be ready when risks transform into disasters. This chapter highlighted the newest projects, including the U.N. GGIM and DBAR. In the future, these approaches with commonalities and differences should be developed to support smart solutions for human society.
References
Ahas R, Silm S, Järv O et al (2010) Using mobile positioning data to model locations meaningful to users of mobile phones. J Urb Technol 17(1):3–27
Akella MK (2009) First responders and crisis map symbols: clarifying communication. Cartogr Geogr Inf Sci 36(1):19–28
Amaratunga D, Pathirage C, Malalgoda C (2015) State of disaster risk reduction at the local level: a report on the patterns of disaster risk reduction actions at local level. Research report. UNISDR, Geneva, Switzerland
Association of Volunteer Emergency Response Teams (2009) Disaster response map symbols, version 1.01 (Beta). Association of Volunteer Emergency Response Teams, Horsham, UK
Brezinova S, Drapela MV, Friedmannova L et al (2011) Producing of cartographic infrastructure. In: Konecny M (ed) Dynamicka geovizualizace v krizovem rizeni. Masaryk University, Brno, Czechia, pp 235–287
Cao J, Tu W, Li Q et al (2017) Spatio-temporal analysis of aggregated human activities based on massive mobile phone tracking data. J Geoinf Sci 19(4):467–474
Carpignano A, Golia E, Di Mauro C et al (2009) A methodological approach for the definition of multi‐risk maps at regional level: first application. J Risk Res 12(3–4):513–534
Çöltekin A, Oprean D, Wallgrün JO et al (2019) Where are we now? Re-visiting the Digital Earth through human-centered virtual and augmented reality geovisualization environments. Int J Digit Earth 12(2):119–122
De Longueville B, Annoni A, Schade S et al (2010a) Digital Earth’s Nervous System for crisis events: real-time Sensor Web Enablement of Volunteered Geographic Information. Int J Digit Earth 3(3):242–259
De Longueville B, Annoni A, Schade S et al (2010b) Digital earth’s nervous system and volunteered geographic information sensing: towards a self-aware planet. In: Abstracts of 3rd ISDE digital earth summit. ISDE, Nessebar, Bulgaria, 12–14 Jun 2010
Dymon UJ (1994) Mapping-The Missing Link in Reducing Risk under SARA III, RISK: Health, Safety & Environment 5(4):337–349
e Silva FB, Gallego J, Lavalle C (2013) A high-resolution population grid map for Europe. J Maps 9(1):16–28
EC (2007) Directive 2007/60/EC of the European parliament and of the council of 23 October 2007 on the assessment and management of flood risks
EC (2010) Risk assessment and mapping guidelines for disaster management. Commission staff working paper
EC (2019) Emergency management service - service overview. https://emergency.copernicus.eu/mapping/sites/default/files/files/CopernicusEMS-Service_Overview_Brochure.pdf. Accessed 21 Jul 2019
FEMA (2016) State mitigation plan review guide, FP 302-094-2. https://www.fema.gov/media-library/assets/documents/101659. Accessed 13 May 2019
Forzieri G, Feyen L, Russo S et al (2016) Multi-hazard assessment in Europe under climate change. Clim Change 137(1):105–119
GeoConnections (2010) Emergency mapping symbology, version 1.0. http://gisuser.com/2010/06/geoconnections-announces-emergency-mapping-symbology-now-available/. Accessed 15 Mar 2014
GEOSS (2019) GEOSS. www.earthobservations.org/geoss. Accessed 2 Jun 2019
Goodchild MF (2008) The use cases of digital earth. Int J Digit Earth 1(1):31–42
Gore A (1998) The digital earth: understanding our planet in the 21st Century. Aust Surv 43(2):89–91
Guo H (2017) Big earth data: a new frontier in Earth and information sciences. Big Earth Data 1(1–2):4–20
Guo H (2018) Steps to the digital silk road. Nature 554:25–27
Hey T, Tansley S, Tolle K (2009) The forth paradigm: data intensive scientific discovery. Microsoft Research, Washington, DC
Homeland Security Working Group (2017) Symbology reference. http://www.fgdc.gov/HSWG/index.html. Accessed 20 Feb 2017
Järv O, Tenkanen H, Toivonen T (2017) Enhancing spatial accuracy of mobile phone data using multi-temporal dasymetric interpolation. Int J Geogr Inf Sci 31(8):1630–1651
Kang C, Liu Y, Ma X et al (2012) Towards estimating urban population distributions from mobile call data. J Urb Technol 19(4):3–21
Kappes MS, Keiler M, von Elverfeldt K et al (2012) Challenges of analyzing multi-hazard risk: a review. Nat Hazards 64(2):1925–1958
Kevany MJ (2008) Improving geospatial information in disaster management through action on lessons learned from major events. In: Zlatanova S, Li J (eds) Geospatial information technology for emergency response. Taylor & Francis Group, London, UK, pp 3–19
Klucka L (2014) Mapping of security risk in the South Moravia District. MSc Thesis. Masaryk University, Faculty of Science, Department of Geography, Brno, Czechia
Konecny M (2006) Mobile and adaptive cartography and geoinformatics in early warning and crises management. In: Seventeenth United Nations regional cartographic conference for Asia and the Pacific. UNO, Bangkok, p 12
Konecny M, Bandrova T (2006) Proposal for a standard in cartographic visualization of natural risks and disasters. Int J Urb Sci 10(2):130–139
Konecny M, Zlatanova S, Bandrova T (2010) Geographic information and cartography for risk and crisis management. Towards better solutions. Springer, Berlin Heidelberg
Kozel J (2009) Contextual map service. PhD Dissertation. Masaryk University, Faculty of Science, Department of Geography, Brno, Czechia
Kozel J, Ludik T, Mulickova E et al (2011) Principy dynamicke geovizualizace. In: Konecny M (ed) Dynamicka geovizualizace v krizovem rizeni. Masaryk University, Brno, Czechia, pp 99–128
Kozel J, Štampach R (2010) Practical experience with a contextual map service. In: Konecny M, Zlatanova S, Bandrova TL (eds) Geographic information and cartography for risk and crisis management: towards better solutions. Springer, Berlin, Heidelberg, pp 305–316
Krömer A, Musial P, Folwarczny L (2010) Mapovani rizik. Spektrum, Ostrava, Czechia, 126 p.
Kubíček P, Konečný M, Stachoň Z et al (2018) Population distribution modelling at fine spatio-temporal scale based on mobile phone data. Int J Digit Earth 1–22 https://doi.org/10.1080/17538947.2018.1548654
Kubíček P, Muličková E, Konečný M et al (2011) Flood management and geoinformation support within the emergency cycle (EU Example). In: Hřebíček J, Schimak G, Denzer R (eds) Environmental software systems. Frameworks of eEnvironment. Springer, Berlin, Heidelberg, pp 77–86
Marinova S (2018) Thematic mapping and visualization for early warning and crisis management. UACEG, Sofia. ISBN 978-954-724-108-4
Meng L (2005) Egocentric design of map-based mobile services. Cartogr J 42(1):5–13
Mulickova E (2011) Cartographic models. In: Konecny M (ed) Dynamicka geovizualizace v krizovem rizeni. Masaryk University, Brno, Czechia, pp 210–234
Mulickova E, Kozel J, Kubicek P (2007) Utilisation of contextual visualization in monitoring of dangerous goods transportation. In: Interop-soft 2007. MSD Brno, Brno, pp 47–53
Mulickova E, Kubicek P (2011) Adaptive mapping in flood management. In: Konecny M, Mulickova E, Kubicek P et al (eds) Geoinformation support for flood management in china and the Czech Republic. Masaryk University, Brno, Czechia, pp 91–101
National Research Council (2007) Successful response starts with a map: improving geospatial support for disaster management. The National Academies Press, Washington, DC
Paulus F, Krömer A, Petr J et al (2016) Threats analysis for the Czech Republic. IOOL, Lazne Bohdanec
Reichenbacher T (2003) Adaptive methods for mobile cartography. In: 21st International cartographic conference, ICA, Durban, South Africa, 10–16 August 2003
Scott G (2018) UN-GGIM: strengthening the global data ecosystem. https://un-ggim-europe.org/wp-content/uploads/2018/11/4-UNGGIM-Presentation-GScott-6June2017.pdf. Accessed 10 May 2019
SIPROCI (2007) Interregional response to natural and man-made catastrophes. http://www.cti.gr/en/activities-en/development-projects-en/item/164-siproci/164-siproci. Accessed 14 May 2019
Talhofer V, Kubicek P, Brazdilova J et al (2007) Dynamic cartographic visualisation in a process of transportation monnitoring of dangerous chemical substances. In: Proceedings of the International conference on military technologies 2007. University of Defence, Brno
U.N. ISDR (2009) Terminology. https://www.unisdr.org/we/inform/terminology. Accessed 10 May 2019
U.N. ISDR (2012) How to make cities more resilient: a handbook for local government leaders. United Nations, Geneva
United Nations (2016) Conference on housing and sustainable urban development (Habitat III), The new urban agenda, Quito, Ecuador, 2016. http://habitat3.org/wp-content/uploads/NUA-English.pdf. Accessed 20 Apr 2019
United Nations Brussels Team (2018) The sustainable development goals (SDGs). https://www.unbrussels.org/the-sustainable-development-goals-sdgs. Accessed 15 May 2019
United Nations General Assembly (2015) Sendai framework for disaster risk reduction 2015–2030. In: The third World conference on disaster risk reduction, United Nations, Sendai, Japan, 3 June 2015
United Nations Office for the Coordination of Humanitarian Affairs (OCHA) (2012) World: humanitarian and country icons 2012. http://reliefweb.int/report/world/world-humanitarian-and-country-icons-2012. Accessed 23 Feb 2017
WCDRR (2016) World conference for disaster risk reduction. https://en.wikipedia.org/wiki/World_Conference_on_Disaster_Risk_Reduction. Accessed 10 May 2019
Winter NL (1993) Hazard management mapping: a taxonomy. In: 16th Proceedings of appllied geography conference
Zlatanova S, Li J (2008) Geospatial information technology for emergency response. Taylor & Francis Group, London, UK
Author information
Authors and Affiliations
Corresponding author
Editor information
Editors and Affiliations
Rights and permissions
Open Access This chapter is licensed under the terms of the Creative Commons Attribution 4.0 International License (http://creativecommons.org/licenses/by/4.0/), which permits use, sharing, adaptation, distribution and reproduction in any medium or format, as long as you give appropriate credit to the original author(s) and the source, provide a link to the Creative Commons license and indicate if changes were made.
The images or other third party material in this chapter are included in the chapter's Creative Commons license, unless indicated otherwise in a credit line to the material. If material is not included in the chapter's Creative Commons license and your intended use is not permitted by statutory regulation or exceeds the permitted use, you will need to obtain permission directly from the copyright holder.
Copyright information
© 2020 The Author(s)
About this chapter

Cite this chapter
Konecny, M. et al. (2020). Digital Earth for Disaster Mitigation. In: Guo, H., Goodchild, M.F., Annoni, A. (eds) Manual of Digital Earth. Springer, Singapore. https://doi.org/10.1007/978-981-32-9915-3_15
Download citation
DOI: https://doi.org/10.1007/978-981-32-9915-3_15
Published:
Publisher Name: Springer, Singapore
Print ISBN: 978-981-32-9914-6
Online ISBN: 978-981-32-9915-3
eBook Packages: Earth and Environmental ScienceEarth and Environmental Science (R0)