
Abstract
Food security has important positive implications for cognition, the basis for human capital formation. This paper points to the highly probable food insecurity mediated poverty trap—on the basis of a collation of researches by nutrition and paediatric scientists, and neuroscientists—by which poverty causes malnutrition and thus poor human capital formation, resulting again in poverty in the next generation. It marshals empirical support for the existence of this trap—National Sample Survey data for India as a whole showing that households with low economic status are indeed associated with a significantly higher statistical probability of malnutrition and anthropometric deficiency than other households. However, at the same time, it qualifies this conclusion on the basis of a primary survey of two villages carried out in 24 South Paraganas district of West Bengal which indicates that the results for India as a whole are not necessarily true for each narrowly defined region: in this specific case, nutritional deficiency or qualitatively poor dietary intake is poorly associated with income status and often observed for high income households. Second, households in these two villages are observed to remain in the wealthier part of the economic distribution in spite of poor dietary intake. An important parallel finding also emerges from National Sample Survey data: alleviation of income poverty over time is not necessarily a cure for food insecurity with income enhancement often associated with copycat status good consumption. A case thus emerges for nutritional counselling whereby households could be advised how changes in their diet can enhance their productivity and wellbeing. Finally, the study of two villages’ points to the likelihood of poor nutrition being determined more by cultural characteristics born out of religious, caste and geographical affiliations than income. It thus concludes that region specific studies for determining the significant drivers of food insecurity are called for.
Access this chapter
Tax calculation will be finalised at checkout
Purchases are for personal use only
Notes
- 1.
Interview given in 1995 to a news channel which was then again quoted by S. R. Osmani in the 1st Abraham Horwitz Lecture in 1997.
- 2.
- 3.
A normal male person doing sedentary work and belonging to the age group 20–39 is considered to be numeraire, i.e. the embodiment of one consumer unit. A person of given sex, age and activity level is converted into an appropriate number of consumer units based on calorie requirement (NSS Report on Nutritional Intake, 1999–2000) relative to the calorie requirement of the numeraire.
- 4.
From NFHS-2 to NFHS-3, only a 7 year period, the percentage of households with no access to toilets and resorting to open defecation went down from 64 to 55%; the percentage with access to piped water supply went up from 38.7 to 42% and the percentage of households which treated water to purify it before drinking went up from 31.6 to 34.4%.
- 5.
- 6.
See Briend et al. (2015) who attribute stunting without wasting to a deficiency in these nutrients.
References
Briend, A., Khara, T., & Dolan, C. (2015). Wasting and stunting—Similarities and differences; policy and programmatic implications. Food and Nutrition Bulletin, 36(1), S15–S33.
Deaton, A., & Dreze, J. (2009). Food and nutrition in India: Facts and interpretation. Economic and Political Weekly, XLIV(7), 42–65.
International Institute for Population Sciences (IIPS) and ORC Macro. (2000). National Family Health Survey (NFHS-2), 1998–99: India. IIPS.
International Institute for Population Sciences (IIPS) and Macro International. (2007). National Family Health Survey (NFHS-3), 2005–06: India (Vol. I). IIPS.
Liu, J., Raine, A., Venables, P. H., Dalais, C., & Mednick, S. A. (2003). Malnutrition at age 3 years and lower cognitive ability at age 11 years: Independence from psychosocial adversity. Archives of Pediatrics and Adolescent Medicine, 157(6), 593–600.
Marjit, S., Santra, S., & Hati, K. K. (2015). Relative social status and conflicting measures of poverty: A behavioral analytical model. Journal of Quantitative Economics, 13(1), 77–86.
Martorell, R., Melgar, P., Maluccio, J. A., Stein, A. D., & Rivera, J. A. (2010). The nutrition intervention improved adult human capital and economic productivity. Journal of Nutrition, 140(2), 411–414.
Noble, K. G. (2017, March). Brain trust. Scientific American, 31(3), 44–49.
Noble, K. G., et al. (2015). Family income, parental education and brain structure in children and adolescents. Nature Neuroscience, 18, 773–778.
Noble, K. G., McCandliss, B. D., & Farah, M. J. (2007). Socioeconomic gradients predict individual differences in neurocognitive abilities. Developmental Science, 10(4), 464–480.
Plaza, B. L., et al. (2001). The impact of malnutrition on brain development, intelligence and school work performance. Archivos Latinoamericanos de Nutricion, 5(1), 64–71.
Programme Evaluation Organisation, Planning Commission, Government of India. (2011). Evaluation study on Integrated Child Development Schemes (ICDS) (Vol. 1).
Rah, J. H., Cronin, A. A., Badgaiyan, B., Aguayo, V. M., Coates, S., & Ahmed, S. (2015). Household sanitation and personal hygiene practices are associated with child stunting in rural India: A cross-sectional analysis of surveys. British Medical Journal Open, 2015, 5.
Sachdev, Y., & Dasgupta, J. (2001). Integrated Child Development Services (ICDS) scheme. Medical Journal Armed Forces India, 57(2), 139–143.
Spears, D., Ghosh, A., & Cumming, O. (2013). Open defecation and childhood stunting in India: An ecological analysis of new data from 112 districts. PLoS ONE, 8, e73784.
Suryanarayana, M. H. (2003). Policies for nutrition: How imperative are they? In S. M. Dev, K. P. Kannan, & N. Ramachandran (Eds.), Towards a food secure India: Issues & policies (pp. 406–432). Institute for Human Development.
Suryanarayana, M. H. (2009). Nutritional norms for poverty: Issues and implications. Concept Paper. http://planningcommission.nic.in/reports/genrep/surya.pdf
Waber, D. P., Bryce, C. P., Girard, J. M., Zichlin, M., Fitzmaurice, G. M., & Galler, J. R. (2014). Impaired IQ and academic skills in adults who experienced moderate to severe infantile malnutrition: A forty-year study. Nutritional Neuroscience, 17(2), 58–64.
Acknowledgements
This paper is based on the findings of a project initiated by the Planning and Development Unit, Jadavpur University and funded by NITI Aayog, Government of India as well as related unpublished parts of the doctoral dissertation of Paramita Bhattacharya.
Author information
Authors and Affiliations
Corresponding author
Editor information
Editors and Affiliations
Appendix: Questionnaire for Primary Survey
Appendix: Questionnaire for Primary Survey
-
1.
Village name
-
2.
Are there any children in the household in the age group of 16–20 years?
-
3.
Name, age and gender of head of household
-
4.
Household size
-
5.
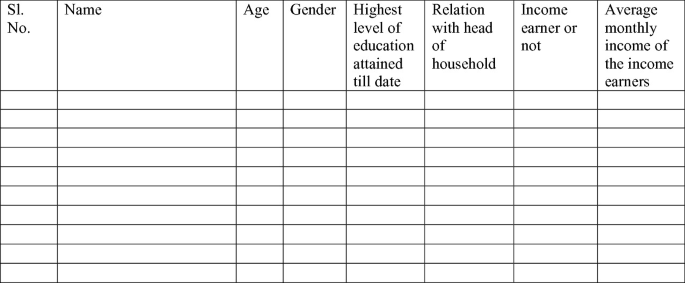
Age and gender of other members of the household, their relationship with the head of the household, and the monthly income of the income earners.

-
6.
Identify members using Sl. No in the table above whose principal source of income is the following:
-
i.
Government, public sector or private sector job.
-
ii.
Self-employment in agriculture
-
iii.
Wage employment in agriculture
-
iv.
Others
-
i.
-
7.
Religion
-
8.
Classify the households in terms of the following categories if Hindu
-
i.
SC
-
ii.
ST
-
iii.
OBC
-
iv.
General
-
i.
-
9.
In case the household is Hindu and is placed in the first three categories (above), does it possess a relevant certificate?
-
10.
In case the household is non-Hindu and SC/ST does it have a relevant certificate?
-
11.
Identify the children aged 16 to 18 years who are not in school by Sl. No. (in 5).
-
12.
Against the possible reasons for not being in school list the relevant Sl. Nos, thus pointing out the reason for each child identified in 11 for not being in school.
-
i.
Dropped out voluntarily due to family facing financial hardship
-
ii.
Dropped out because of poor performance or failure
-
iii.
Other (explain):
-
i.
-
13.
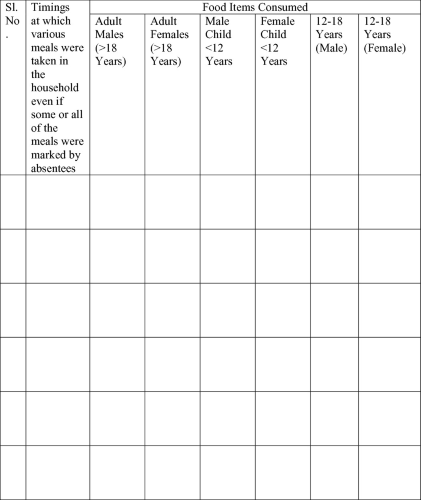
Present consumption of food in the household


-
14.
Food consumption in the household 15 years back

-
15.
Monthly consumption of major food items and expenditures on these (now and 15 years back if there has been a significant change between then and now):
Food items
Quantity being consumed now (monthly)
Current expenditure (monthly)
Quantity consumed 15 years ago (monthly)
Expenditure 15 years ago (monthly)
Cereals
Pulses
Vegetables
Oil
Milk and milk products
Non-vegetarian food
Fruits
Sugar/gur
Tea/coffee
Pan/tobacco products
-
16.
Is there a good primary government school that is accessible from the village now? What about middle and secondary schools? Compare with the situation 15 years back
-
17.
Comment on the quality of the mid-day meal programme now and 15 years back as well as provide details regarding how much it helps/helped to supplement the food consumption of the household
-
18.
Compare the state of accessible government health facilities (health centres/dispensaries/hospitals) at present to that 15 years back?
-
19.
Do you access private health facilities now? What about 15 years back?
-
20.
What are/were the expenditures on health and education now/‘15 years ago’?
-
21.
Name the goods (and their quantities) which you consume as a result of (a) home production, transfers from relatives or friends outside the household, and (b) access to nature (forests/lakes/trees, etc.)? Compare this to the situation 15 years back.
-
22.
Do you use the PDS? If yes, provide monthly quantity of purchases and expenditures on these. What was the scenario 15 years ago?
-
23.
Wealth now and 15 years ago
-
i.
Amount of land owned
-
ii.
Nature of home ownership: owned/rented/relative’s house
-
iii.
Type of household: Kuccha/Pucca
-
iv.
Type of flooring
-
v.
Type of roofing
-
vi.
Number of rooms
-
vii.
Number of household members sleeping per room.
-
viii.
Drinking water source
-
ix.
Type of toilet facility
-
x.
Ownership of a bank or post office account
-
xi.
Ownership of durable goods (list and visually inspect)
-
i.
-
24.
What is the source of drinking water? Is it treated before consumption? Compare with the situation 15 years back.
-
25.
How active are/were Anganwadis 15 years back?
Rights and permissions
Copyright information
© 2023 The Author(s), under exclusive license to Springer Nature Singapore Pte Ltd.
About this chapter

Cite this chapter
Mitra, S., Bhattacharya, P. (2023). Exploring the Significance of Food Insecurity Mediated Poverty and Low Productivity Traps: Furthering Policy by Reconciling Secondary Data with Primary Survey. In: Raychaudhuri, A., Ghose, A. (eds) Managing Pandemic and Correcting Development Fundamentals. India Studies in Business and Economics. Springer, Singapore. https://doi.org/10.1007/978-981-19-8680-2_7
Download citation
DOI: https://doi.org/10.1007/978-981-19-8680-2_7
Published:
Publisher Name: Springer, Singapore
Print ISBN: 978-981-19-8679-6
Online ISBN: 978-981-19-8680-2
eBook Packages: Economics and FinanceEconomics and Finance (R0)