
Abstract
Unlike a power reactor, a research reactor is mainly used as a neutron generator for various experiments and applications. The UTR-KINKI is a low-power research reactor installed for the purpose of research and education at the university. Although its rated thermal power is only 1 W, it can be used as a neutron source for various educational programs on radiation measurement and applications. In addition, when conducting experiments, the \(\gamma\)-rays and neutrons emitted from the reactor must be measured properly from the viewpoint of radiation protection. This chapter describes experimental programs using a research reactor as a neutron source and the measurements necessary for radiation control during the experiment.
You have full access to this open access chapter, Download chapter PDF
Keywords
- Activation reaction
- Thermal neutron flux
- Neutron dose rate
- Gamma dose rate
- Gamma spectrometry
- X-ray radiography
- Neutron radiography
3.1 Activation and Half-Life Measurement
3.1.1 Activation
Aluminum (Al) is a stable isotope with a mass number of 27, which has a natural abundance ratio of 100%. When a small piece of Al is placed in a nuclear reactor and irradiated with thermal neutrons, a part of the nuclide Al-27 is induced by capture reactions shown in the following reaction formula, changing into Al-28:
The above reaction formula can be expressed as 27Al(n, \(\gamma\))28Al. The reaction cross sections of Al are shown in Fig. 3.1. As shown in Fig. 3.1, in the case of Al-27 as the target nucleus, manganese-27 (Mg-27), sodium-24 (Na-24) and Mg-26 are produced by the (n, p), (n, \(\alpha\)) and (n, np) reactions, respectively, in addition to the (n, \(\gamma\)) reaction in the above formula. In terms of reactor irradiation, the (n, \(\gamma\)) reaction, which is the “capture reaction” in Fig. 3.1, occurs mainly because the thermal neutron component is dominant. The thermal neutron capture cross section is relatively large, 0.23 barn. The unit of the cross section is barn, 10 −24 cm 2.

Cross sections of Al-27 for neutrons (Data from Ref. [1])
The amount of Al-28 produced is proportional to the following four factors: the amount of the target nuclide (number of atoms); the particle flux density of thermal neutrons \(\phi\) (cm−2 s−1) (this is called the thermal neutron flux); the probability of the nuclear reaction occurring \(\sigma\) (10–24 cm2); the irradiation time t (s). If the irradiation position, irradiation time and target nuclide are the same, the produced radioactivity (Bq) increases with the irradiated sample amount (mg).
The Al-28 is the radionuclide that decays to silicon-28 (Si-28; stable isotope) with a half-life of 2.24 min. At the time of decay, \(\beta^{\, - }\)-rays with a maximum energy of 2.86 MeV are emitted, followed by \(\gamma\)-rays with a maximum energy of 1.779 MeV (Ref. [2]). Figure 3.2 shows the decay diagram. The produced radioactivity can be quantified by measuring these radiations with a radiation instrument. Based on the produced radioactivity, the number of atoms in the target sample can be obtained from the thermal neutron flux \(\phi\), reaction cross section \(\sigma\) and irradiation time t.

Diagram of the decay of Al-28
The analysis method to determine the amount of contained elements in a sample is called the activation analysis, using “activation” to convert stable elements into radioactive isotopes. Since neutrons have no electric charge, they are absorbed by atomic nuclei without being subjected to Coulomb repulsive force, causing the formation of neutron-rich nuclei. Therefore, it is relatively easy to cause activation of the nucleus. Since a nuclear reactor is the device that provides neutrons stably, activation analysis can be conducted by using a nuclear reactor.
The activation analysis method is one of the elemental analysis methods. Because of its high sensitivity, the activation analysis method can be applied as an ultra-trace analysis method. Also, the activation analysis method has excellent characteristics: (1) high-analytical sensitivity; (2) non-destructive analysis without chemical treatment; (3) simultaneous analysis of many elements (Ref. [3]). Furthermore, the activation analysis method is used in a wide range of fields, including earth science, biology and archaeology, for the determination of trace elements (Na, cobalt: Co, copper: Cu, etc.) in rocks, minerals, natural water, meteorites and blood, and for the analysis of trace elements (gold: Au, Cu, mercury: Hg, etc.) in hair. To obtain high sensitivity, it is necessary that the cross section of the target nuclear reaction is large, the half-life of the produced radionuclide is suitably short, and the irradiation neutron flux is large.
Another application of “activation,” besides the activation analysis, is the production of Si semiconductor by neutron irradiation. An n-type Si semiconductor is the Si single crystal doped with phosphorus (P) (Ref. [4]). The Si-30 is naturally present in Si at a ratio of 3.05%. When the Si single crystal is irradiated with neutrons, Si-30 absorbs neutrons and changes into Si-31. The Si-31 is induced by \(\beta\)-decay and is converted to the P-31 that is a stable isotope. This reaction can be used to dope P uniformly in Si. By controlling the neutron irradiation time, the concentration of P to be added can be set precisely.
3.1.2 Decay and Half-Life of Radioactivity
The phenomenon that a radioactive isotope changes into a stable element is called “decay,” occurring stochastically. Radioactive nuclei (radionuclides) have their own half-lives, and the number of radioactive nuclei decreases with time. The Al-28 is the radionuclide that decays to Si-28 with a half-life of 2.24 min. Upon the decay, \(\beta\)-rays with a maximum energy of 2.86 MeV are emitted, which can be measured with a GM (Geiger–Mueller) counter.
Because radiation is emitted in accordance with a certain of decay, the number of decays per second is associated with the ability to emit radiation and is called the radioactivity, which is written in the following equation:
where A is the radioactivity (Bq), N the number of atoms in the target material (number of atoms), and \(\lambda\) the decay constant (s−1). As shown in Eq. (3.1), the radioactivity is proportional to the number of target atoms, and when the above differential equation is solved, the following equation is obtained, and the radioactivity decreases according to an exponential function if there is no supply of target atoms from other sources:
Here, we assume that the radioactivity A is the value of A0 at time t = 0. A semilogarithmic graph with the elapsed time of decay of the radioactivity as the horizontal axis is shown in Fig. 3.3. The half-life T1/2 and the decay constant are given by
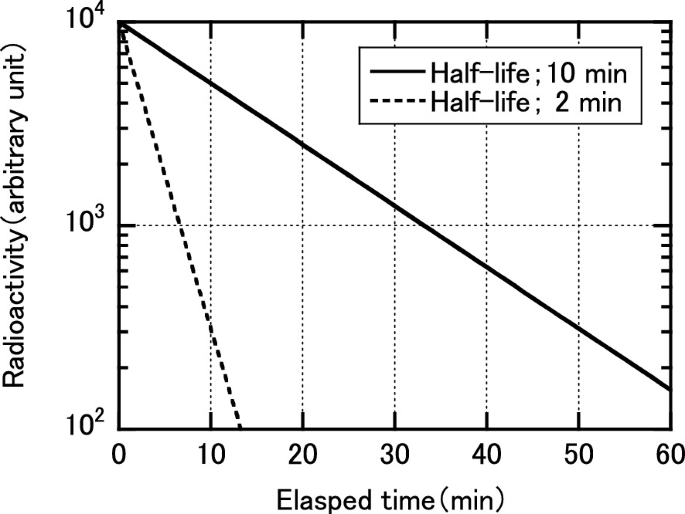
Decay of radioactivity
From Eq. (3.3), the decay constant \(\lambda\) is inversely proportional to the half-life T1/2. If the decay constant is large, i.e., the half-life is short, the slope of the straight line is large, as shown in Fig. 3.3.
3.1.3 GM Counter Tube
The Al-28 that is produced by neutron irradiation in a nuclear reactor is a \(\beta^{\, - }\)-decay nuclide. The \(\beta^{\, - }\)-rays emitted by the decay are counted by GM counters. The counting rate (s−1; cps: counts per second) corresponds to the number of radiation emitted per unit time. Also, number of radiation corresponds to the radioactivity of the sample to be measured. The half-life is obtained from the decrease of the counting rate in accordance with time.
The GM counter is a kind of gas ionization detector in which a gas is enclosed. Also, the GM counter is generally designed with a hollow cylinder as the negative electrode and a thin wire-shaped positive electrode in the center of the cylinder. The gas is ionized by the radiation incident in the tube, and the generated electrons and cations move toward the positive and negative electrodes, respectively. Low-energy electrons are also accelerated by the electric field strength, and an electron avalanche is generated. About 109 times as much charge is generated in the tube as is initially generated by the radiation, and the pulse output from the counting tube can be a few V or more, which makes it highly resistant to noise and provides high detection sensitivity (Ref. [5]).
The GM counter used in this experiment is an end-window-type GM counter, which has a mica window at the tip of the cylindrical probe. The pulse signal from the GM counter is introduced to the scaler for counting. The GM counter and the scaler used in the experiment are shown in Fig. 3.4 for reference. The scaler module shown in the picture has also the function of applying a high voltage to the counter tube.

Photograph of GM counter and scaler
3.1.4 Method of Measurement
3.1.4.1 Preparation of GM Counter 1: Plateau Curve
GM counter tubes are used in the following procedures:
-
(1)
Connect the GM counter to the scaler with a coaxial cable.
-
(2)
Check that the voltage adjustment volume of the high-voltage power supply indicates the lowest voltage.
-
(3)
Turn on the power switch, and increase slowly and gradually the applied voltage to fix it at the specified voltage.
-
(4)
Set the timer and start counting.
The voltage to be used is determined by obtaining the plateau curve of the GM counter while changing the applied voltage using a \(\beta\)-ray radiation source. Figure 3.5 shows an example of the plateau curve. The working voltage should be set at about 1/3 of the plateau length from the counting start voltage, which is 700 V, as shown Fig. 3.5.

Example of plateau curve
3.1.4.2 Preparation of GM Counter 2: Background Counting
When measuring radiation with a GM counter, background radiation emitted from natural radionuclides in the vicinity is counted in addition to the radiation emitted from the measurement target. When the counting rate decreases due to the decay of radioactivity, the decrease in the counting rate is slowed down by the addition of counting due to the background radiation. To obtain a net count of the radiation emitted from the object to be measured, it is necessary to measure the counting rate due to background radiation in advance. The counting rate due to background radiation varies depending on day and night, season, weather, etc., even at the same measurement site. Also, in most cases, the variation can be ignored if the measurement is made within one hour.
Before conducting the measurement of the induced radioactivity, the background count rate is measured by the following procedures:
-
(1)
Connect the GM counter and the scaler with a coaxial scale, and turn on the power.
-
(2)
Without inserting a sample, set the applied voltage to the working voltage.
-
(3)
Set the preset time to 10 min, and measure the background count. Record the results.
3.1.4.3 Experimental Procedures
A small piece of Al is placed in the reactor at the full power of 1 W, and thermal neutron irradiation is carried out, ranging between 15 and 30 min.
A stopwatch is operated at the same time as the end of irradiation, and counting is started as soon as possible after the end of irradiation. The GM counter is used to count the \(\beta\)-rays emitted from the Al piece for 1 min each. The procedure is repeated at one-minute intervals. In each counting, the counting start time (elapsed time after the end of irradiation) and the counting rate (counts per minute: cpm) are recorded. An example of the recording format is shown in Table 3.1.
The specific procedure of the decay measurement of radioactivity (Al) is described as follows:
-
(1)
Connect the GM counter and the scaler, and turn on the power.
-
(2)
Set the applied voltage to the operating voltage.
-
(3)
Set the preset time to one minute.
-
(4)
Set a small piece of Al to be measured on the sample table.
-
(5)
Press the “RESET COUNT” button according to the elapsed time since the end of irradiation to start counting.
-
(6)
The start time of counting (display time of the stopwatch) is recorded, and the system waits until the counting is completed.
-
(7)
After completing the measurement by presetting, record the count (Table 3.1).
-
(8)
Repeat steps (5) to (7) until 10 half-lives (about 23 min) have elapsed from the end of irradiation.
-
(9)
The net counting rate is calculated by subtracting the background counting rate from the counting rate.
-
(10)
As shown in Fig. 3.6, the vertical axis of the semilogarithmic graph sheet is plotted as the net counting rate (cpm), and the horizontal axis as the elapsed time (min) after the end of irradiation. Since the radioactivity decreases exponentially with time, the decay curve is a straight line with a decreasing right side on the semilogarithmic graph. From the decay curve, the time required for the counting rate to decrease to half is obtained with 3 to 4 significant digits and is used as the half-life of Al-28.
Fig. 3.6 
Graph sheet of elapsed time and net counting rate

3.1.5 Discussion
The key points for discussion are as follows:
-
(1)
The half-life of Al-28 was determined by obtaining the time required for the counting rate to be halved from the decay curve. Verify that the value is close to the literature value of 2.2414 min (134.48 s).
-
(2)
The half-life you obtained has an error. Discuss the methods used to minimize the error.
-
(3)
GM counter tubes have a dead time from 10–4 s to twice that. Therefore, when the counting rate is 300 per second (cps), the counting error is about 0.3%. In addition, when the counting rate is equal to the background counting rate, the counting error of the net counting rate is large. In drawing the decay curve, consider the range of net counting rates that are appropriate for obtaining an accurate half-life.
-
(4)
Calculate the radioactivity after the end of irradiation, assuming that the absolute counting efficiency of the GM counter (number counted/number of emitted beta-rays) is 0.15. Also, calculate the number of Al-28 atoms in the calculated radioactivity.
3.2 Thermal Neutron Flux Measurement
3.2.1 Introduction
A variety of neutron irradiation experiments is performed by using research reactors. Samples and detectors are placed inside or outside the reactor and irradiated with neutrons to analyze the composition of the samples or to investigate the response of the detectors. In such experiments, information on the neutron flux at the location where the sample or detector is irradiated is essential to determine the neutron fluence as the time-integrated amount of neutron flux, which must be measured accurately for each irradiation. In addition, the spatial distribution of the neutron flux inside the reactor is determined by the shape, structure and composition of the reactor and the position of the control rods, and is proportional to the thermal power distribution in the reactor. Therefore, we can also know the accurate thermal power distribution inside the reactor by measuring the spatial distribution of the neutron flux. Especially, in an extremely low power reactor such as UTR-KINKI, the thermal power cannot be determined from the temperature change of the reactor because the reactor is kept at normal temperature and pressure during operation. That is why the thermal power of the reactor is obtained from the spatial distribution of neutron flux.
The aim of this experiment is to measure a thermal neutron flux in the reactor by the activation method, which is the most widely used method for measuring neutron flux, and to understand the principle of the measurement.
3.2.2 Theory
When a material consisting of a stable isotope is irradiated with neutrons, activation reactions may occur such that the stable isotope absorbs neutrons and becomes a radioactive isotope. The activation method determines the flux of irradiated neutrons indirectly by measuring the activity produced in the material.
Let us consider the relationship between the neutron flux and the activity produced in the target material. Assuming that the neutron flux is ϕ (cm−2 s−1), the cross section of the activation reaction is σ (cm2), and the number of target nuclei is N, the reaction rate (the number of activation reactions per unit time) R (s−1) is expressed by the following equation:
The produced radioactive nuclei will decay with its decay constant. The rate of decay (the number of decays per unit time) is expressed as λn (s−1), where λ is the decay constant (s−1), and n is the number of radioactive nuclei in the target material. Therefore, the rate of change in n can be expressed as follows:
Assuming n = 0 at t = 0, and solving the differential equation for n, we get the solution as follows:
Since the activity A of the material is given by λn, the following equation is obtained by multiplying both sides of Eq. (3.6) by the decay constant λ:
This is the activity of the target material produced for a time t after the start of the irradiation.
As the time t approaches to infinity \(\left( {t \to \infty } \right)\) in Eq. (3.7), the term \(\left( {1 - e^{ - \lambda t} } \right)\) is unity and the activity approaches an asymptote. The activity \({\text{A}}_{\infty }\) is called the saturation activity, and the following relationship can be obtained:
Here, as shown in Fig. 3.7, consider that after the irradiation from t = 0 to t = t0, the preparation for the activity measurement is made from t = t0 to t = t1, and the measurement is performed from t = t1 to t = t2. Since the activity decays exponentially after the irradiation is stopped at t = t0, if the activity at the end of irradiation (t = t0) is A0, the activity of the target material A is given by

Change in radioactivity of target material irradiated with neutrons for time t0
Therefore, the total count C obtained from the measurement performed for the interval between t1 and t2 can be expressed as follows:
where B is the background count and \(\varepsilon\) is the detection efficiency. The reaction rate R (or saturated activity) can be obtained by measuring C and B, as follows:
Once the reaction rate R is obtained in this way, the neutron flux ϕ can be obtained from the relationship between the reaction rate and the neutron flux shown in Eq. (3.4) as follows:
3.2.3 Target Material
In this experiment, a gold (Au-197) foil is used as a target material. The Au-197 is the stable isotope of gold and its natural abundance is 100%. When Au-197 absorbs neutrons through capture reactions, the radioactive isotope Au-198 is produced by the reaction 197Au(n, γ)198Au. Figure 3.8 shows the decay diagram of Au-198. Au-198 decays to Hg-198 by \({\upbeta }^{ - }\)-decay with a half-life of 2.695 days. 99.0% decays to the first excited state of Hg-198, and populates to the ground state by emitting 411.8 keV \({\upgamma }\)-ray almost simultaneously. Therefore, the activity of the activated gold foil is generally determined by measuring \({\upbeta }\)-rays with a gaseous detector, or by measuring \({\upgamma }\)-rays with a high-purity germanium (HPGe) semiconductor detector.

Decay diagram of Au-198
Figure 3.9 shows the cross section of the radiative capture reaction of gold. It can be seen from the figure that the cross section decreases monotonically in a straight line in the low energy region. Since the cross section is almost inversely proportional to neutron velocity \(v\) (i.e., proportional to \(1/v = 1/\sqrt E\)), this energy region is often called “\(1/v\) region.” In the higher energy region, there is a sharp peak (resonance peak), and the cross section changes rapidly in a narrow energy range. In the database of nuclear reaction cross sections called the Nuclear Data Library, cross-sectional data for nuclear reactions with thermal neutrons are given for neutrons of 0.0253 eV (2200 m s−1), and for Au, the activation cross section for neutrons of 0.0253 eV is 98.65 barn.

Cross sections of (n, \(\gamma\)) reactions of Au and Cd (Data from Ref. [1])
The Au is often chosen as a target material for the following reasons.
Firstly, the cross section of the radiative capture reaction is large, and the half-life of Au-198 is appropriate. As mentioned earlier, the saturated activity \(A_{\infty }\) is equal to the reaction rate R, and the reaction rate R is linearly proportional to the cross section of the reaction. So, if the cross section is small, a large activity cannot be obtained, and sufficient counts therefore cannot be obtained in the measurement. In addition, if the half-life is too short, the activity decreases within a short time after the irradiation and that leads difficulties in a measurement. Conversely, if the half-life is too long, that also leads difficulties, because a long irradiation time is necessary to obtain a sufficient activity.
Secondly, the only natural isotope of Au is Au-197, which makes it easy to obtain a highly pure material. The high purity is advantageous because a highly pure material does not contain other isotopes or impurities that can be activated by neutrons. If non-target radionuclides are produced in the activation, their activity will interfere with the measurement. Another advantage is that thin Au foils or wires are commercially available and easy to obtain. A large neutron detector deteriorates the spatial resolution of the measurement and also disturbs the neutron flux to be measured by the detector. On the other hand, Au foils or wires can be fabricated much smaller than ordinary neutron detectors and can be used to perform measurements with good spatial resolution and without significantly affecting the neutron flux. Target materials used in the activation method are shown in Table 3.2.
3.2.4 Measurement of Thermal Neutron Flux
In the previous explanation, irradiated neutrons were assumed to be monenergistic for simplicity, but in actual irradiation environments, neutron energy is not monenergistic except in special cases, and the activation cross section varies with neutron energy as described in Fig. 3.9.
In the case of a thermal neutron reactor such as UTR-KINKI, neutron spectrum (distribution of neutron flux with respect to neutron energy) in the irradiation field where samples and detectors are installed is expressed as a superposition of the spectrum of thermal neutrons in thermal equilibrium with surrounding materials and the spectrum of epi-thermal neutrons with higher energy. The thermal neutron flux distribution \(\phi \left( E \right)\) is approximated by the Maxwell distribution as shown in the following equation:
where \(\phi_{{{\text{th}}}}\) is the thermal neutron flux (cm−2 s−1), k is the Boltzmann’s constant (8.6173 × 10⁻⁵ eV K−1), and T is the neutron temperature (K). The neutron temperature is approximately same as the moderator temperature in a system with little neutron absorption. Figure 3.10 shows the Maxwell distribution.

Maxwell distribution of thermal neutrons at room temperature
Taking into account the energy dependence of the activation cross section and neutron flux \(\phi \left( E \right)\), the reaction rate R in Eq. (3.4) can be rewritten as follows:
When the target material is Au, we can take advantage of the fact that the activation cross section has the \(1/v\) behavior in the thermal neutron region. If the cross section at an arbitrary speed \(v_{0}\) (energy \(E_{0}\)) is \(\sigma_{0}\), the energy-dependent cross section \(\sigma \left( v \right)\) and \(\sigma \left( E \right)\) can be expressed by the following equations, respectively:
Equation (3.14) is then rewritten as follows:
where \(\overline{\sigma }\) is the average activation cross section for thermal neutrons with the Maxwell distribution, and \(\phi_{{{\text{th}}}}\) is the thermal neutron flux, and they are, respectively, given by:
Therefore, the thermal neutron flux can be deduced from Eq. (3.17) as follows:
3.2.5 Cadmium Filter Method
As described in Sect. 3.2.4, the neutron spectrum in the irradiation field of a thermal neutron reactor is a superposition of the spectrum of thermal and epi-thermal neutrons. Therefore, the Au foil installed in the neutron irradiation field will be irradiated not only by thermal neutrons but also by epi-thermal neutrons. In particular, since the activation cross section of Au has a large resonance peak at about 4.9 eV (see Fig. 3.9), epi-thermal neutrons also activate the Au foil. Thus, the activity generated in the Au foil consists of components for thermal and epi-thermal neutrons and is given by
where A is the total activity generated in the foil, and Ath and Aep are components for thermal and epi-thermal neutrons, respectively.
To obtain the thermal neutron flux from the activity generated in the Au foil, it is necessary to remove the component caused by epi-thermal neutrons (Aep) from the total activity (A) and extract the component for thermal neutrons (Ath). For such separation of activity, a method known as the “cadmium filter method” is generally used. Cadmium (Cd) is known as a strong neutron absorber, and the Cd absorption cross section is very convenient for the purpose of separating thermal and epi-thermal neutrons. As shown in Fig. 3.9, the Cd absorption cross section has a high peak for neutrons with the energy about 0.4 eV. Here, if the Au foil is covered with two Cd plates of appropriate thickness, the Cd plates act as a filter to block neutrons with the energy lower than about 0.4 eV, and the Au foil is only activated by neutrons with the energy more than about 0.4 eV. The energy of 0.4 eV is considered as the boundary where the Cd plate blocks neutrons or not. If we regard the energy as the boundary between the energy regions of thermal and epi-thermal neutrons, we can obtain the activity produced by thermal neutrons, by taking the difference between the activities produced in the Au foils covered with and without the Cd plates. This is the principle of the cadmium filter method.
In the actual irradiation experiment, two Au foils are prepared, one of them is covered with Cd plates, and the other is irradiated with neutrons without Cd plates. The difference in the activity per unit mass should be calculated for taking into account that the number of target nuclei in the two Au foils is different (the weight of the two Au foils is not equal). When the saturated activity per unit mass of the Au foil covered with Cd plates is ab (Bq g−1), and that of the bare Au foil not covered with Cd plates is ac (Bq g−1), the saturated activity per unit mass produced by thermal neutrons ath (Bq g−1) is given by
The ratio of the activities produced in the two Au foils covered with and without Cd plates is called the “cadmium ratio.” The cadmium ratio RCd can be expressed as follows:
When the cadmium ratio is known, the activity of the bare gold foil ab can solely be used to obtain the activity generated by thermal neutrons ath as follows:
The cadmium ratio is used as an index to show the ratio of the density of thermal and epi-thermal neutrons at the irradiation position. Noteworthy is that the larger the ratio, the larger the proportion of thermal neutrons.
3.2.6 Experiment
3.2.6.1 Sample Preparation and Irradiation
-
(1)
Prepare Au foils to be irradiated and weigh them with an electronic balance. Two Au foils are necessary for each irradiation position. Number each foil and record its weight and irradiation position.
-
(2)
One of the two Au foils at each irradiation position is sandwiched between two Cd plates, and the other is left bare.
-
(3)
Open the top shield closures of the reactor and place the foils at the irradiation positions in the graphite reflector of the reactor core. The positions will be appointed by a supervisor. After the foil installation is completed, the top shield closures are closed. The crane is operated by a staff member to open and close the top shield closures, so do not enter the reactor room during the crane operation.
-
(4)
Start up the reactor, increase the power, make the reactor a critical state of 1 W in automatic operation mode, and start irradiation. The time when the reactor reaches a critical state of 1 W is defined to be the start of irradiation (t = 0), so the stopwatch is started at the same time as the reactor reaches a critical state of 1 W. The irradiation time (t0) will be instructed by the supervisor.
-
(5)
Shut down the reactor at the end of irradiation (t = t0). Since the radiation dose in the reactor core immediately after shutdown is high, wait until the counting rate of the fission counter is less than 10 cps and the “Low Count Rate” indicator light turns on (usually it takes about 10 min). When the indicator light turns on, open the top shield closures again and take out the irradiated foils. Since the foils are activated (radioactive), handle them carefully by following the instructions of the supervisor.
3.2.6.2 Activity Measurement (β-Ray Measurement with a GM Counter)
-
(1)
Apply high voltage to a GM counter. The voltage to be applied will be instructed by the supervisor on the day of the experiment.
-
(2)
Count background radiation to obtain background counting rate.
-
(3)
Determine the detection efficiency of the counter by counting the \(\beta\)-rays from a standard \(\beta\)-source of known activity.
-
(4)
Since the Au-198 has a long half-life of about 2.7 days, it is not necessary to pay much attention to the decay of radioactivity after removal from the reactor. In addition, be sure to record the start time (t = t1) and end time (t = t2) of the measurement for each sample.
3.2.6.3 Activity Measurement (γ-Ray Measurement with an HPGe Detector)
-
(1)
Confirm that the dewar vessel of the HPGe detector is filled with liquid nitrogen and that the detector is sufficiently cooled (it is usually prepared by staff prior to the experiment but must be checked).
-
(2)
Apply high voltage to the HPGe detector. The applied voltage will be instructed by the supervisor on the day of the experiment.
-
(3)
Determine the detection efficiency (peak efficiency) of the measurement system for the \(\gamma\)-rays emitted from Au-198 (411.8 keV) (see the supplementary explanation).
-
(4)
Measure \(\gamma\)-rays from each sample and acquire a gamma spectrum with a multichannel analyzer (MCA). Obtain the net counting rate of the photoelectric peak (it is recommended to use the function of the software that controls the MCA). Be sure to record the start time (t = t1) and end time (t = t2) of the measurement for each sample.
3.2.6.4 Data Analysis and Discussion
-
(1)
Summarize the information on the standard source used for determining the detection efficiency (nuclide, source number, activity, calibration date, etc.) and obtained data such as measurement time, counts, background, etc.
-
(2)
Summarize the foil number, weight, measured value, start time of irradiation and irradiation duration, start time and end time of the measurements, and other necessary information on each sample as a list.
-
(3)
Calculate the saturated activity per weight (Bq g−1) (reaction rate per weight) of each sample using Eq. (3.11).
-
(4)
Calculate the activity produced by thermal neutrons and the cadmium ratio for each irradiation position using Eqs. (3.22) and (3.23), respectively.
-
(5)
Calculate the thermal neutron flux at each irradiation position using Eq. (3.20).
-
(6)
In the case that the measurement was performed at several irradiation positions, summarize the thermal neutron flux and the cadmium ratio at each position and plot their spatial distributions. The spatial distribution of the thermal neutron flux can be approximated by a cosine distribution when the measurement is performed at several irradiation positions in the vertical direction of the reactor.
-
(7)
What corrections would be needed for a more precise measurement of thermal neutron flux using the activation method?
[Column] How to determine photoelectric peak efficiency
If the net count rate of the photoelectric peak measured with an HPGe detector is n (cps) and the \(\gamma\) emission rate of the source is I (s−1), the peak efficiency \(\varepsilon_{p}\) is expressed by the following equation:
The peak efficiency of an HPGe detector is complicatedly related to the geometric arrangement of the detector and \(\gamma\) emitter, and the energy of the \(\gamma\)-rays, etc. Therefore, it is generally difficult to obtain the exact peak efficiency easily.Footnote 1 In this experiment, it is necessary to determine the peak efficiency for the 411.8 keV \(\gamma\)-rays emitted from Au-198. Since a standard source emitting 411.8 keV \(\gamma\)-rays is usually not available, the peak efficiency is estimated as follows:
The peak efficiencies (\(\varepsilon_{p1}\), \(\varepsilon_{p2}\), ,...) are obtained for γ-rays of several energies (E1, E2, ...) using several standard γ-ray sources specified by the supervisor. Then, the results are plotted on a double logarithmic graph with the energy (denoted E) on the horizontal axis and the peak efficiency (denoted \(\varepsilon_{p}\)) on the vertical axis, and the first-order fitting is performed as follows:
where a and b are constants determined by fitting. From Eq. (3.26), we obtain the peak efficiency of the detector for the 411.8 keV \(\gamma\)-rays.
It is known that, in a limited range from a few hundred keV to a few MeV, the simple empirical expression in Eq. (3.26) can be used to express the relationship between the \({\upgamma }\)-ray energy and the peak efficiency.
[Column] Sum peak method
The stable isotope of Na-23 (natural abundance: 100%) absorbs thermal neutrons well and becomes the radioactive Na-24 by the (n, \(\gamma\)) reaction. Sodium carbonate (Na2CO3) powder, which is a compound containing sodium, can be encapsulated and used as a target material for the activation method.
Na-24 decays to Mg-24 by \(\beta^{ - }\) emission with a half-life of 14.96 h, and two \(\gamma\)-rays (2.754 MeV and 1.369 MeV) are emitted in a cascade pattern immediately after the decay. When they are measured with a high-purity germanium (HPGe) semiconductor detector, the pulse height distribution shows not only the photoelectric peaks at 2.754 MeV and 1.369 MeV but also a peak at the position corresponding to the sum of the energies of the two \(\gamma\)-rays (4.123 MeV). The peak is called the “sum peak,” which appears when the two \(\gamma\)-rays are detected by photoelectric interactions simultaneously. Figure 3.11 shows a typical pulse height spectrum of \(\gamma\)-rays from Na-24 measured with an HPGe semiconductor detector.

Pulse height spectrum of \(\gamma\)-rays from Na-24 measured with HPGe detector
Let the Na-24 activity of a sample A0 (Bq), and the two \(\gamma\)-rays emitted by the decay be \(\gamma_{1}\) and \(\gamma_{2}\). If the total detection efficiencies for \(\gamma_{1}\) and \(\gamma_{2}\) are \(\varepsilon_{1}\) and \(\varepsilon_{2}\), respectively, the probability that \(\gamma_{1}\) and \(\gamma_{2}\) are then detected simultaneously will be \(\varepsilon_{1} \varepsilon_{2}\). Also, the probability that only \(\gamma_{1}\) is detected is \(\left( {\varepsilon_{1} - \varepsilon_{1} \varepsilon_{2} } \right)\), and the probability that only \(\gamma_{2}\) is detected is \(\left( {\varepsilon_{2} - \varepsilon_{1} \varepsilon_{2} } \right)\). Furthermore, if the probabilities of photoelectric interaction for \(\gamma_{1}\) and \(\gamma_{2}\) are \(\varepsilon_{1p}\) and \(\varepsilon_{2p}\), respectively, the peak counting rate of \(\gamma_{1}\), \(\gamma_{2}\) and the sum peak are as follows:
where n1, n2 and ns are the peak counting rates for \(\gamma_{1}\), \(\gamma_{2}\) and sum peak, respectively.
The total counting rate nT is then expressed as follows:
All four detection efficiencies \(\varepsilon_{1}\), \(\varepsilon_{2}\), \(\varepsilon_{1p}\) and \(\varepsilon_{2p}\) can be eliminated from Eqs. (3.27) to (3.30), and finally the following relation is obtained:
Therefore, the Na-24 activity in the sample can be measured absolutely from the counting rate of the photoelectric peak obtained by the measurement and the total counting rate.
It is common, however, that the low pulse height part including noise in the spectrum is removed by setting the threshold level in the measurement system. In addition, since the background count must also be removed, an ingenuity is necessary to obtain the total count rate nT.
3.3 Measurements of Neutron and γ-Ray Dose Rates
Air dose rates are measured at the measurement points around the reactor at the full power of 1 W in the UTR-KINKI operation.
3.3.1 Production of Neutron and \(\gamma\) -Ray
During the reactor operation, neutrons and \(\gamma\)-rays are produced. The origin of neutrons has come from fission reactions in the reactor, including prompt and delayed neutrons. The origins of \(\gamma\)-rays are as follows: the generation of fission products in the reactor; the \(\gamma\)-rays as a result of inelastic scattering of neutron with materials; the \(\gamma\)-rays from neutron-induced radioactive materials.
The energy distribution of neutrons at the center of the core is shown in Fig. 3.12. The energy ranges from thermal neutron to a few MeV. In the core, radiation is generated from the activation of in-core components and fission products, and γ-rays do not reach the reactor surface due to biological shielding.

Neutron energy spectrum ratio at the center of the core
3.3.2 Measuring Instruments and Principle of Measurement
The purpose of the measurement of air dose rates around the reactor is to confirm that the leaked dose rate from the reactor is less than the value specified in the safety regulations (Refs. [6, 7]). It is confirmed by the measurement that both the dose due to external exposure of workers around the reactor (Refs. [8, 9]) is sufficiently low and that there is no damage to the biological shielding of the reactor and no point with a peculiarly high dose rate.
Air dose rates in the experiment will be measured using survey meters, which are portable measuring instruments among the ambient dose equivalent rate measuring instruments. The most commonly used survey meters for \(\gamma\)-rays are an ionization chamber survey meter and a NaI(Tl) scintillation survey meter. The latter is capable of measuring even low dose rate levels of natural background dose rate, and the range of dose rate that can be measured is generally limited to 30 \(\mu {\text{Sv}} \; {\text{h}}^{ - 1}\). Since the dose rate on the outer surface of the top shield of the reactor operating at the full power of 1 W can exceed 30 \(\mu {\text{Sv}} \; {\text{h}}^{ - 1}\). In the experiment, an ionization chamber survey meter is going to be used. Some neutron ambient dose equivalent rate meters are also called REM counters. The radiation weighting factor used to evaluate the effective dose is determined by a function of energy in the case of neutron exposure. Therefore, the coefficients for converting fluence to dose differ depending on the energy of the incident neutron. Figure 3.13 shows the coefficients for converting fluence to dose for neutron energy.

Neutron dose conversion coefficients per fluence
An ideal neutron ambient dose equivalent rate detector has the energy response that matches the curve shown in Fig. 3.13. Most of the neutron ambient dose equivalent rate detectors are proportional counters filled with helium-3 (He-3) gas. The reaction cross section of He-3 is shown in Fig. 3.14. As shown in Fig. 3.14, the He-3 (n, p) reaction used for detection has a large cross section in the lower energy region. To fit the detector response to the curve in Fig. 3.13, the detector is surrounded by polyethylene of about 10 cm thickness. Polyethylene is composed of carbon and hydrogen, and the fast neutron incident on the detector is slowed down and shifted to the lower energy side by elastic scattering with hydrogen. The slowing down of fast neutrons makes it highly sensitive to fast neutron. Meanwhile, the pulse generated by the incident \(\gamma\)-rays on the detector does not contribute to the dose rate measurement because of its low pulse height.

Reaction cross section of He-3 (Data from Ref. [1])
3.3.3 Measurement
Air dose rates will be measured at the measurement points around the reactor that is at the full power of 1 W in UTR-KINKI. The measurement points (MP) are shown in Fig. 3.15. The measured values will be recorded in Fig. 3.16. The location and the height of the points are as follows:

Measurement points around the reactor

Data sheet of measurement results (unit: \(\mu {\text{Sv}} \; {\text{h}}^{ - 1}\))
-
MP1: Center of the reactor top, on the surface
-
MP2: Off-center of the reactor top, on the surface
-
MP3: Top of the stairs, 0.8 m above the surface of the reactor top
-
MP4 to MP7: Surface of the biological shielding tank,
-
0.8 m above the bottom level of the tank
-
MP8: Surface of the storage box, 0.8 m above the floor
-
MP9: Entrance of the reactor room, 0.8 m above the floor.
3.3.3.1 Measurement Preparation
-
(1)
Ionization chamber survey meter: start up by selecting the switch from OFF to ON. Perform a zero check and set the measurement range to 10 \(\mu {\text{Sv}} \; {\text{h}}^{ - 1}\).
-
(2)
Survey meter for neutron: press the power button to turn on the power.
3.3.3.2 Measurement and Recording
-
(1)
The order of measurement is MP4 to MP9 as the first half, and the next is MP1 to MP3.
-
(2)
Align the detection part of the survey meter with the measurement position and wait for the dose rate to settle to a certain value before reading and recording. Each reading shall be recorded with two significant digits. At measurement points MP1 to MP3, the measuring range of the ionization chamber survey meter shall be switched to the appropriate range.
-
(3)
At each measurement point, add up \(\gamma\)-ray dose rates and neutron dose rates, and record the total value. In this case, the second decimal place shall be rounded up to the nearest whole number in \(\mu {\text{Sv}} \; {\text{h}}^{ - 1}\), and the first decimal place shall be recorded. No rounding or truncation shall be performed to ensure that the values are on the safe side.
3.3.4 Discussion
3.3.4.1 Difference Between Dose Rates at Measuring Points
Consider the reasons for (1) and (2) as follows:
-
(1)
Why are north–south (measurement points MP5 and MP7) and east–west (measurement points MP4 and MP6) different?
-
(2)
For measurement point MP8, why is the neutron dose rate larger than the \(\gamma\)-ray dose rate?
3.3.4.2 External Exposure Doses for Workers
At the full power of 1 W of UTR-KINKI, the entry to the reactor top is restricted, and then, there is no restriction of entry in the reactor room except for the reactor top. The “Regulation on Prevention of Ionizing Radiation Hazards” related to occupational safety and health stipulates that the radiation dose at the place where people always enter should be kept lower than 1 mSv per week. In the safety regulations for the reactor facility, the control target (constraint value) for the reactor side dose rate is set at 20 \(\mu {\text{Sv}} \; {\text{h}}^{ - 1}\). Confirm that the air dose rates at the measurement points (MP4 to MP9) do not exceed these control target values. Furthermore, discuss the reason why the control target value was set at 20 \(\mu {\text{Sv}} \; {\text{h}}^{ - 1}\) for a 40-h work week.
3.3.4.3 Quantitative Consideration of Shielding
The distances from the center of the reactor core to each measurement point, the shielding materials and their thicknesses between them are shown in Table 3.3. Here, the material of filled sand with water is considered equivalent to concrete. Using the radiation transport calculation code PHITS (ver. 3.02) [10], we obtained numerically the dose rate (Sv h−1) of incident neutron on graphite or concrete with a thickness of 150 cm. The incident neutron energy is as follows: 1 MeV, 2 MeV and 3 MeV. The shielding effects by thickness are shown in Figs. 3.17, 3.18 and 3.19, in relative values with the dose rate at the incident point as 1. The dose rates of the \(\gamma\)-rays generated by inelastic neutron scattering are shown by dashed lines.

Shielding against 1 MeV neutron radiation (left: graphite; right: concrete)

Shielding against 2 MeV neutron radiation (left: graphite; right: concrete)

Shielding against 3 MeV neutron radiation (left: graphite; right: concrete)
Refer to Table 3.3 and Figs. 3.17, 3.18 and 3.19, and estimate the effective energy of the neutron at the center of the reactor core to be closest to 1 MeV, 2 MeV or 3 MeV, based on the ratio of the air dose rate of the neutron to the \(\gamma\)-ray at each measurement point.
[Column] Leakage \(\gamma\) -ray spectrometry
As described in Sect. 3.3.1, \(\gamma\)-rays are emitted from in-core activated components and fission products, which rarely reach the surface of the reactor because \(\gamma\)-rays are shielded by the biological shield. Moreover, \(\gamma\)-rays are emitted by the reactions where low-energy neutrons are captured by stable nuclei, and as a result, the excited nuclei immediately de-excite. The \(\gamma\)-rays emitted in the process are called the prompt \(\gamma\)-rays. Since the prompt \(\gamma\)-rays have a relatively high energy and are penetrating, they constitute a major component of the \(\gamma\)-rays leaking from the biological shield. High-purity germanium detectors (HPGe detector) have excellent energy resolution and are suitable for measuring the energy spectrum of the prompt \(\gamma\)-rays.
-
(1)
HPGe detector
There are two types of HPGe detectors; the one is a p-type detector and the other is an n-type detector. The p-type is generally used for the measurement of \(\gamma\)-rays with the energy more than 40 keV. The p-type coaxial HPGe detector has a p + layer formed by boron ion implantation in the central hole and an n + layer formed by lithium diffusion on the surface. A depletion layer is formed by applying reverse bias between p + and n + layers and is sensitive to \(\gamma\)-rays. The detection efficiency depends on the size of the depletion layer, and a detector with a thick depletion layer is desirable to obtain sufficient detection efficiency for high-energy \(\gamma\)-rays.
The measurement of \(\gamma\)-rays with the HPGe detector is based on the interaction between \(\gamma\)-rays and Ge crystal. When secondary electrons are generated by the interaction, an electron–hole pair is generated in the depletion layer, which can be read out as an electrical signal. The greatest characteristic of the detector is that \(\gamma\)-ray energy can be determined with high accuracy. This is called that the detector has good energy resolution. The energy resolution is expressed as the full width at half maximum (FWHM; Fig. 3.20), which is defined as the width at the P/2 of the peak with the height P. Since \(\gamma\)-ray energy can be directly read out as the number of electron–hole pairs, and the average energy to generate an electron–hole pair is as small as 2.9 eV, there is little fluctuation in the number of electron–hole pair production, and good energy resolution can be realized. The FWHM of the HPGe detector is usually smaller than 2 keV for the 1332.5 keV \(\gamma\)-rays emitted from Co-60.

Full width at half maximum of a peak
Since the band gap of the HPGe detector is small, the detector needs to be cooled to an operating temperature by liquid nitrogen or an electric cooler in order to reduce the effect of thermal noise caused by electrons exceeding the band gap.
-
(2)
Measurement system
As shown in Fig. 3.21, when radiation enters a detector and gives its energy, the energy is read out as an electrical signal. Figure 3.21 shows the waveform of the signal after signal processing (preamplifier and main amplifier) is conducted. Radiation can be counted one by one, and one signal (pulse) is generated when radiation is detected. The pulse height V is proportional to the energy E of the secondary electron generated by the interaction between \(\gamma\)-rays and Ge crystal. The energy spectrum shown in Fig. 3.22 is obtained by discriminating this signal with a pulse height analyzer (multichannel analyzer: MCA).

Configuration of \(\gamma\)-ray spectrum measurement system

Example of leakage \(\gamma\)-ray spectrum
-
(3)
Leakage \(\gamma\)-ray spectrometry
When measuring \(\gamma\)-ray spectrum leaking from the biological shield of the reactor, the detector is placed as close as possible to the surface of the shield tank. After an energy calibration, the preset time of the MCA is set and the measurement is performed for a certain period of time. Figure 3.22 shows an example of the leakage \(\gamma\)-ray spectrum. As shown in Fig. 3.22, the energy of the leakage \(\gamma\)-rays is relatively high and reaches 10 MeV. Therefore, it is necessary to perform the energy calibration by reducing the gain of the main amplifier sufficiently so that a wide energy spectrum can be obtained.
-
(4)
Data analysis
Calculate the channels of the peaks that appear in the spectrum using the functions of the software provided with MCA. From the relationship between the MCA channel and the energy obtained by the energy calibration, convert the channels of the peak to the energy and list them. From the results of energy distribution, find out what kind of capture reaction caused the identified peak.
When identifying the peak of the \(\gamma\)-spectrum, it is recommended to use the database of prompt \(\gamma\)-rays shown as follows:
IAEA, “Database for Prompt Gamma-ray Neutron Activation Analysis, Most Intense Gamma Rays.”
https://www-nds.iaea.org/pgaa/Annex1/Table-IV-Chap7.pdf, Accessed 1 July 2022.
3.4 Neutron Radiography
3.4.1 Introduction
Radiography is the technology that uses the penetrating effect of radiation to see through the interior of an object. The most familiar radiography technology is the X-ray radiography used in medical examinations. As the non-destructive inspection technique that does not damage or destroy the object, the X-ray technology is used not only for medical purposes but also in a wide variety of fields, including the inspection of industrial products, the investigation of cultural properties, science and engineering research, and security checks at the airport.
A medical X-ray image is a picture of the inside of a human body taken with X-rays, and such an image can be taken with not only X-rays but also neutron beams. The technique of imaging a subject using neutron beams is called neutron radiography or neutron imaging.
When the same subject is photographed using X-rays and neutron beams, the resulting images are very different. This is due to the fact that X-rays and neutrons have different materials to interact with. When X-ray radiography and neutron radiography are used together for the same subject, complementary information about the components and structures inside the object can be obtained. Furthermore, different techniques are required to make an image with X-rays and neutrons.
The purpose of the neutron radiography experiment is to understand the principle of neutron radiography and the imaging technique by taking a picture of a subject using neutrons generated in the reactor. The same subject will be also imaged with X-rays, and the two images obtained by X-rays and neutrons will be compared to see how the differences in the interaction of the two radiations with materials appear in the images.
3.4.2 Attenuation of X-rays and Neutrons in Matter
X-rays are absorbed or scattered and attenuated in matter by three kinds of interactions (photoelectric effect, Compton scattering and pair production). Among these, the photoelectric effect and Compton scattering are interactions with electrons in materials, and it can be imagined that atoms with more electrons, i.e., atoms with larger atomic numbers attenuate X-rays more in the energy region where these interactions dominate. In fact, as shown in Fig. 3.23, the mass attenuation coefficient of X-rays (cm2 g−1) increases monotonically with atomic number.

When a subject is irradiated with X-rays, X-rays are shielded by absorption and scattering in materials with large atomic numbers, whereas X-rays are transmitted through materials with small atomic numbers. Thus, the shadows of materials with large atomic number contained in the subject appears in the image as if it were a shadow picture. The reason why hard tissues, such as bones and teeth inside a human body, appear clearly on radiographs used in medical examinations is that hard tissues contain calcium (Ca) and have a relatively higher atomic number than soft tissues such as muscle and fat (the effective atomic number of hard tissues is about twice that of soft tissues).
On the other hand, unlike X-rays, neutrons are attenuated by direct interaction (absorption or scattering) with nuclei. The mass attenuation coefficient of thermal neutrons does not change monotonically with atomic number as in the case of X-rays, because the probability of the interaction varies with each nuclide. Figure 3.23 also shows the mass attenuation coefficients of thermal neutrons against atomic number. The mass attenuation coefficient of thermal neutrons varies greatly with atomic number and is large even for elements with small atomic numbers, such as hydrogen (H), lithium (Li) and boron (B). There are also other elements, such as cadmium (Cd) and gadolinium (Gd), that have particularly large mass attenuation coefficient. In addition, neutrons can easily penetrate heavy metals such as iron and lead, which are difficult for X-rays to penetrate. Therefore, neutron radiography can be used to visualize and inspect hydrogen-rich materials, including water, oil and plastics in structures made of heavy metals.
3.4.3 Imaging Plate
Photographic film has been used for X-ray diagnosis for a long time because the film is an integral two-dimensional X-ray detector which can produce images easily using established techniques. In 1981, the Fujifilm Corporation developed the imaging plate (IP; Ref. [12]) as a new computed radiography technology to replace photographic X-ray films. Since IPs are approximately 100 times more sensitive than conventional photographic films for X-rays, the radiation exposure in X-ray diagnosis was greatly reduced by using IPs. In addition, there is no need to develop a film to obtain an image as is the case with conventional photographic film, and the images can be stored for a long time without deterioration because they are acquired as digital data. The IP has various excellent characteristics as a two-dimensional radiation detector, such as the ability to perform quantitative analysis by image processing and the large dynamic range (the IP has a dynamic range of about five orders of magnitude, whereas the conventional photographic film has about two orders of magnitude).
The principle of X-ray imaging with IP is very different from that of photographic film and is based on a phenomenon called photostimulated luminescence (PSL). When a special material called a stimulable phosphor is irradiated with radiations, the material absorbs and accumulates the energy of radiation. Then, when the phosphor is irradiated with a laser beam, the phosphor emits the stored energy as the photostimulated luminescence. Figure 3.24 shows a photograph and the structure of IP, which is composed of a thin plastic sheet coated with BaFBr:Eu and covered with a protective film. After the IP is irradiated with X-rays, the surface of the IP is scanned with a He–Ne laser (633 nm), and the luminescence (UV light) is detected and converted to electric signal with a photomultiplier tube. The signals are then digitized and processed with a computer to make a two-dimensional image. The resolution of the image can be increased to several tens of micrometers. In addition, by irradiating the IP with visible light for about ten minutes after the readout, all the information stored in the IP is erased and the IP can be used again.

IP (left) and cross-sectional structure (right)
Since the IP for X-rays does not contain any neutron-sensitive components, it cannot be used for neutron radiography as it is. Therefore, neutron-sensitive IPs have been developed by mixing Gd as a neutron converter in the stimulable phosphor. The Gd has a very large (n, \(\gamma\)) reaction cross section for thermal neutrons, and absorbs thermal neutrons well and emits prompt \(\gamma\)-rays and conversion electrons. The conversion electrons in particular can give energy to the vicinity of the Gd crystal that absorbed neutrons and the energy is stored in the IP as a neutron image, which can be used for neutron radiography.
3.4.4 Neutron Radiography Facility
There are several neutron sources used for neutron radiography, including research reactors, accelerator neutron sources and radioisotopes (RIs). Among these, a research reactor is a stable source with high-intensity neutrons and has been used widely for neutron radiography. Accelerator neutron sources have also been widely used in recent years because their performance has been improved. Here, we describe the neutron radiography facility of UTR-KINKI (Ref. [13]), which is used for the experiment.
The upper part of the reactor is closed by concrete top shield closures during the reactor operation. The top shield closures can be replaced with upper irradiation facilities depending on the purpose of the experiment. There are several types of upper irradiation facilities, one of which is the B-facility for neutron radiography. The other facilities are the A-facility for small animal irradiation and the C-facility for the insertion of experimental samples to the reactor core during the reactor operation. Figure 3.25 shows a photograph of the neutron radiography facility (B-facility) in UTR-KINKI.

(© AERI, Kindai University. All rights reserved)
Neutron radiography facility in UTR-KINKI
Figure 3.26 shows a cross-sectional view of the neutron radiography facility in UTR-KINKI. The collimator (neutron guide tube) in the neutron radiography facility is located just above the central stringer hole, and the neutron beam is derived from the area where thermal neutron flux is maximum. The collimator is made of mortar with lithium fluoride, which absorbs thermal neutrons efficiently, and the neutrons that collide with the inner wall of the collimator are absorbed so that thermal neutron beams are at the exit of the collimator as parallel as possible.

Cross-sectional view of neutron radiography facility in UTR-KINKI
The performance of a collimator can be expressed by the collimator ratio (L/D), where L is the length of the collimator and D is the diameter of the collimator inlet. In the case of UTR-KINKI, L = 92 cm and D = 9 cm, so the collimator ratio is 10.2. In general, the collimator ratio of a neutron radiography facility should be more than 10, and preferably more than 100, so the collimator ratio of UTR-KINKI is close to the lower limit.
The lower shield is installed on the collimator, and the upper shield is installed on the lower shield. The lower shield has a cassette folder in which the subject and neutron IP are installed, and can be put in and out like a drawer during reactor operation. Since the diameter of the collimator exit is 20 cm, the diameter of the irradiation field is about 20 cm. In addition, the thermal neutron flux in the irradiation field at a critical state of 1 W is about 1 × 104 cm−2 s−1.
Since the full power of UTR-KINKI is 1 W, and the thermal neutron flux is smaller than that of other neutron radiography facilities, a long irradiation time is required to obtain the neutron fluence required for imaging. In the case of neutron IPs, the typical irradiation time to obtain a still image is about 15 min.
3.4.5 X-ray Generator
X-rays used for common X-ray diagnosis are generated by an X-ray tube. Figure 3.27 shows the configuration of an X-ray generator using an X-ray tube. The voltage applied between the cathode and anode is called the tube voltage, and a high voltage of several tens to hundreds of kV is applied. The current carried between the cathode and anode is called the tube current. When thermo electrons generated from a filament (cathode) heated to a high temperature are accelerated by the tube voltage and collide with a metal target (anode), X-rays are generated by bremsstrahlung.

Configuration of X-ray generator
The efficiency for the conversion of electrical power to X-rays is small, and most of the kinetic energy of electrons is converted to heat when they collide with a metal target, and only a small amount is converted to X-ray energy. The metal target is then heated during X-ray generation, so it is often cooled by water. In addition, since X-rays are generated by bremsstrahlung, it is more efficient to use a material with a large atomic number as a target to generate X-rays. Thus, a metal with a large atomic number and a high melting point is advantageous for the metal target, and tungsten (W) is often used.
The energy spectrum of X-rays emitted from an X-ray tube consists of a continuous spectrum of bremsstrahlung and a peak of characteristic X-rays emitted from a metal target. Figure 3.28 shows the energy spectrum of X-rays emitted from an X-ray tube. The maximum energy of the continuous spectrum is determined by the tube voltage of the X-ray tube, i.e., the acceleration voltage of the electrons.

Energy spectrum of X-rays generated by X-ray tube (tube voltage: 100 kV, target: W, absorber: Al 1.0 mm)
The intensity of the generated X-rays is determined by the current flowing between the electrodes of the X-ray tube, i.e., the tube current, because the intensity increases with the number of electrons striking the metal target per unit time. However, since the efficiency of X-ray generation by bremsstrahlung increases with the energy of the electrons, the X-ray intensity is higher with a higher tube voltage for the same tube current.
The image contrast of radiographs is related to the energy of X-rays. The higher the energy of X-rays, the higher the transmission power, and thus the lower the image contrast. In addition, radiographic density is determined by X-ray intensity and X-ray irradiation time. The product of the tube current (mA) and the irradiation time (s), mAs (milliampere-seconds), is used as the measure of the amount of X-rays produced by X-ray tube. Moreover, with the same amount of mAs, an image with the same radiographic density can be obtained even if the combination of the tube current and irradiation time is different.
3.4.6 Experiment
-
(1)
Prepare several subjects to be radiographed and place them in a 20 cm diameter circle drawn in the center of an aluminium (Al) plate. Once the subjects are placed, fix them with scotch tape.
-
(2)
Insert X-ray IPs and neutron IPs in an eraser for about 10 min to erase any remaining image information. Put each IP into a cassette, which is a light-shielded container for an IP. It is important not to confuse the IPs for X-rays and neutrons.
-
(3)
Put the Al plate with subjects on the cassette containing the X-ray IP, and irradiate X-rays with an X-ray generator. Set the tube voltage at 40 kV and the tube current at 1 mA, and irradiate X-rays for 3 s.
-
(4)
Operate the reactor with the neutron radiography facility in automatic operation mode at a critical state of 1 W. Place the cassette containing the neutron IP and the Al plate with subjects in the cassette folder and insert it into the lower shield. The irradiation time is 15 min.
-
(5)
After the irradiation is completed, set the IPs in a reader and read out the image.
3.4.7 Discussion
Figure 3.29 shows examples of radiographic image. Compare two images radiographed with X-rays and neutrons, and discuss how the difference in the interaction between X-rays/neutrons and materials is shown in the images.

Radiographic images of same objects using neutrons (left) and X-rays (right)
Notes
- 1.
While a standard source can be regarded as a point source, a gold foil is a plane source, and it is difficult to make the geometric conditions of the detector the same as those of a standard source. By separating the source and detector, the geometrical conditions of the detector for the gold foil become closer to those for point sources, but the counting rate decreases and the statistical accuracy becomes poor.
References
Shibata K, Iwamoto O, Nakagawa T et al (2011) JENDL-4.0: a new library for nuclear science and engineering. J Nucl Sci Technol 48:1–30
The Japan Radioisotope Association (2011) Radioisotope pocket data book 11th edn. Tokyo, Japan (in Japanese)
Naito K (1978) Genshiro kagaku (Nuclear reactor chemistry), nuclear engineering series 4. University of Tokyo Press, Tokyo, Japan (in Japanese)
ATOMICA The principle of silicon semiconductor production by neutron irradiation. (in Japanese). https://atomica.jaea.go.jp/data/detail/dat_detail_08-04-01-25.html. Accessed 1 July 2022
The Japan Radioisotope Association (2020) Mippusengen no kiso (Fundamentals of sealed sources), 7th edn. Maruzen Publishing, Tokyo, Japan (in Japanese)
Guide for joint use of the Kindai University Reactor. (in Japanese). https://www.kindai.ac.jp/files/rd/research-center/aeri/guide/external-use/outside4.pdf. Accessed 1 July 2022
Atomic Energy Research Institute, Kindai University, Safety regulations for the nuclear reactor facility. (in Japanese)
Nuclear Regulation Authority of Japan (2000) Notice on quantity of radioisotopes, quantities etc. of radiation-emitting isotopes, public notice of the science and technology agency, no. 5, Oct. 23, 2000. https://www.nsr.go.jp/data/000182250.pdf. Accessed 1 July 2022
Shibata T ed (2021) Hoshasen gairon (Introduction to radiation) 13th edn. Tsusho-sangyo-kenkyu-sha, Tokyo, Japan (in Japanese)
Sato T, Iwamoto Y, Hashimoto H et al (2018) Features of particle and heavy ion transport code system (PHITS) version 3.02. J Nucl Sci Technol 55:684–690
Hubbell JH, Seltzer SM (1995) Tables of X-ray mass attenuation coefficients and mass energy-absorption coefficients from 1 keV to 20 MeV for elements Z = 1 to 92 and 48, additional substances of dosimetric interest. NIST standard reference database 126 https://www.nist.gov/pml/x-ray-mass-attenuation-coefficients. Accessed 1 July 2022
Fujifilm Corporation, Fujifilm development of a new X-ray diagnostic imaging system “FCR.” (in Japanese). https://www.fujifilm.co.jp/corporate/aboutus/history/ayumi/dai5-08.html. Accessed 1 July 2022
Niwa T, Koga T, Morishima Y et al (1987) Characteristics of neutron radiography facility constructed at Kinki University reactor. J Atomic Energy Soc Japan 29:904–912 (in Japanese)
Author information
Authors and Affiliations
Corresponding authors
Rights and permissions
Open Access This chapter is licensed under the terms of the Creative Commons Attribution-NonCommercial-NoDerivatives 4.0 International License (http://creativecommons.org/licenses/by-nc-nd/4.0/), which permits any noncommercial use, sharing, distribution and reproduction in any medium or format, as long as you give appropriate credit to the original author(s) and the source, provide a link to the Creative Commons license and indicate if you modified the licensed material. You do not have permission under this license to share adapted material derived from this chapter or parts of it.
The images or other third party material in this chapter are included in the chapter's Creative Commons license, unless indicated otherwise in a credit line to the material. If material is not included in the chapter's Creative Commons license and your intended use is not permitted by statutory regulation or exceeds the permitted use, you will need to obtain permission directly from the copyright holder.
Copyright information
© 2023 The Author(s)
About this chapter

Cite this chapter
Wakabayashi, G., Yamada, T., Endo, T., Pyeon, C.H. (2023). Radiation Measurement and Application. In: Introduction to Nuclear Reactor Experiments. Springer, Singapore. https://doi.org/10.1007/978-981-19-6589-0_3
Download citation
DOI: https://doi.org/10.1007/978-981-19-6589-0_3
Published:
Publisher Name: Springer, Singapore
Print ISBN: 978-981-19-6588-3
Online ISBN: 978-981-19-6589-0
eBook Packages: Physics and AstronomyPhysics and Astronomy (R0)