
Abstract
The Nagahama Social Science Survey is designed to add a social scientific scope to the Nagahama Prospective Genome Cohort for Comprehensive Human Bioscience conducted by the Center for Genomic Medicine at Kyoto University. Since 2016, it has been conducted three times; all the surveys share the same questionnaire to build a panel (cohort) data. Each survey also collected data based on its own theme as well. In this chapter, we explain the theme and questionnaire for the first survey and discuss basic summary statistics.
This study is conducted as a part of the Project “Toward Building Socio-Life Science” undertaken at the Research Institute of Economy, Trade and Industry (RIETI).
We would like to thank Professor Yoji Inaba (Nihon University) for providing us with the data from the "Survey on Security, Trust, and Social Participation in Daily Life" (2013) for conducting this research. The survey was supported by a Grant-in-Aid for Scientific Research (A) from the Ministry of Education, Culture, Sports, Science and Technology of Japan (MEXT), "Policy Implications of Social Capital: A Study of its Fostering Factors and Regional Differences" (Project No. 24243040, PI: Yoji Inaba, Nihon University).
You have full access to this open access chapter, Download chapter PDF
Keywords
1 Introduction
Human behaviour depends on various social scientific factors, including income and wealth, risk attitudes, family, and views on various social and political issues. At the same time, it is heavily influenced by life scientific factors, including biological treats, mental state, and medical histories. As the recent outbreak of COVID-19 evidences, therefore, epidemiological issues cannot be fully understood without taking the interaction of all those social and life scientific factors into account. Similarly, social scientific studies on human behaviour must take into account both social and life scientific factors. Despite this, however, social scientific research and life scientific research have traditionally been conducted in a separate manner. In particular, basic research data concerning human behaviour has been compiled independently in those two fields. It is our view that this has badly hampered a healthy development of a scientific field encompassing social and life science, which we call socio-life science.
With these considerations, we initiated to build socio-life science panel (cohort) data at Kyoto University in 2016, which is made possible by a collaboration between the Graduate School of Medicine and the Institute of Economic Research at the university. Building this panel data, we have conducted social scientific surveys (Nagahama Social Science Survey or, simply, Nagahama Survey) so as to add a social scientific scope to the existing genome cohort data compiled at the Center for Genomic Medicine, the Nagahama Prospective Genome Cohort for Comprehensive Human Bioscience (the Nagahama Study), focusing on bioscientific aspects of humans; for details of this genome cohort data, see Setoh and Matsuda (2021). The Nagahama Survey, which targets participants of the Nagahama Study, has been conducted three times so far (fiscal years 2016, 2018, and 2020). The data altogether provide information not only social scientific aspects of life but also bioscientific features, including genomic information.
Recently, a number of social scientific panel data projects have started to add genomic information. Our survey is unique in that survey questions are designed in such a way to make full use of genomic information in social scientific approach, which is collected in the Nagahama Study, at the same time that social scientific factors can be incorporated into bioscientific research.
The three social science surveys constitute panel data. They seek the same basic information from participants. At the same time, they have different emphases. In this chapter, we explain the purpose of our first social scientific survey in 2016 in relation to our survey questions; the first survey’s emphasis is on the factors that might put a society together or, in other words, serve as a social bond. As a part of this panel data, we have conducted an additional survey on the formation of COVID-19 antibody and behaviour change in 2021. On this survey, see Hirota et al. (2021).
In Sect. 2, we explain the basic way in which data is compiled. In Sect. 3, we explain the survey questions and descriptive statistics. The actual questions (originally in Japanese) are presented in the appendix.
2 Outline of the Nagahama Social Science Survey
This survey is to add a social scientific scope to the Nagahama Prospective Genome Cohort for Comprehensive Human Bioscience (the Nagahama Study), which is a genome cohort survey focusing on bioscientific aspects of humans (for details on the Nagahama Study, see Setoh and Matsuda 2021). Our survey, which targets participants of the Nagahama Study, has been conducted three times (fiscal years 2016, 2018, and 2020). Each time, survey questionnaires were sent by mail to all survey participants, namely, 8482 participants for the first survey, 9813 participants for the second, and 9737 for the third. The number of valid answers was 5954 (70.2%) in the first, 6988 (71.2%) in the second, and 6776 (69.6%) in the third.
A non-profit organization, the Zero-Ji Health Promotion Club, sent out and collected questionnaires, and cleaned up data so that, by the time we received, it was made completely anonymous. Each question, and its use of answers in association with life-scientific data, has been approved by the independent ethics committee organized by the city of Nagahama, which authorizes the Nagahama Study by its city ordinance. See Setoh and Matsuda (2021) for details on the approval process of the surveys conducted under the Nagahama Study.
The Nagahama Study accepts multiple members of a single family as respondents. As a result, all the survey results represent a respondent personal views and states, but not that of the household to which a respondent belong. We cannot identify individuals who have their family member(s) participating in the survey.
3 First Nagahama Survey (2016 Survey)
The 2016 Nagahama Survey, which is the first of the three surveys conducted so far, has two major purposes. The first is to investigate what holds a society together in relation to social and life scientific factors. This question is one of the most fundamental questions for social scientists but has not yet been addressed systematically in the existing literature. We intend to address the question by means of the determinants of individual social capital. The second is to measure risk attitudes, which are expected to serve as a major determinant for one’s healthcare and state of health itself. Measuring one’s risk attitude is a difficult task and, in our survey, we address this question from different angles. In addition, we intend to measure economic and personal attitudes towards happiness and fairness. The answers to all the questions can be quantified so that we may select as independent and/or dependent variables.
3.1 Individual and Family Characteristics
Our survey covers a respondent’s objective characteristics relating to family, education, and job.
-
1.
Gender and age: Gender and age are basic characteristics that are collected in the original Nagahama Study. Figures 1 and 2 summarize data. As Fig. 1 shows, female respondents in our survey constitute a larger fraction than the entire Japanese population based on the 2015 census. As Figs. 2 and 3 show, for both males and females, people in their 60 and 70 s are over-represented in our survey relative to the entire population. This bias is likely to be attributable the fact that the Nagahama Study is based on voluntary participation and tied to free health checkups provided by Kyoto University medical staff. It is intuitively clear that people in their 60 and 70 s are more health conscious and are more inclined to participate in a survey. The higher female participation, shown in Fig. 1, is consistent with our intuition; for example, the 2019 Mejji-Yasuda Life Insurance Survey reports that 62.8% of female participants say that they are carefully observing their health, while the fraction falls to 57.6% for the male participants (see Meiji-Yasuda Life Insurance Company 2019).
Fig. 1 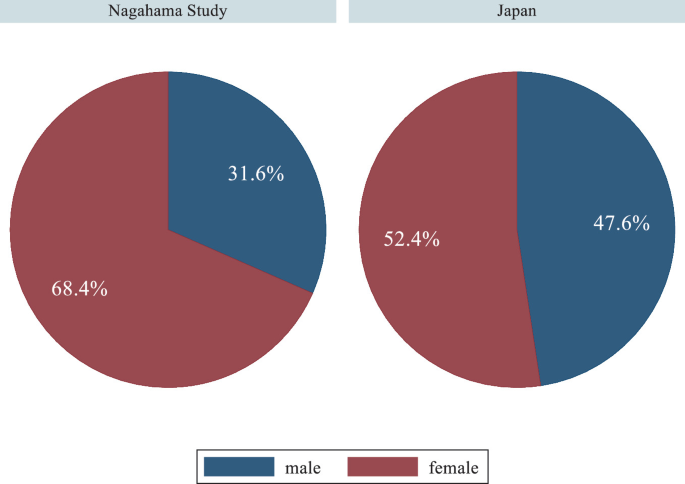
Gender composition
Fig. 2 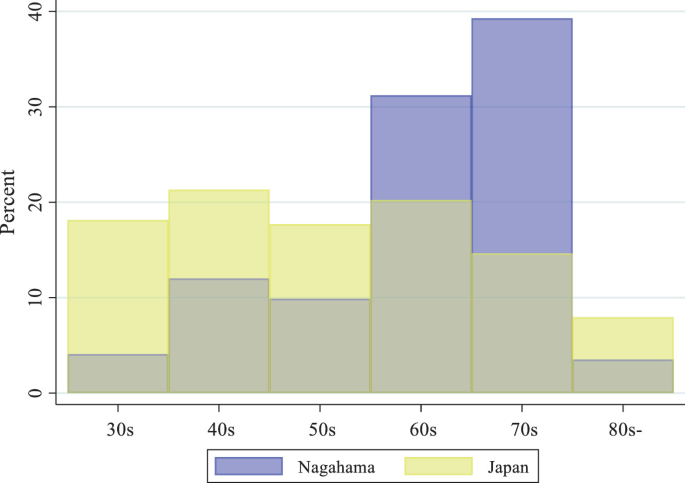
Age composition (male), comparison with entire Japan
Fig. 3 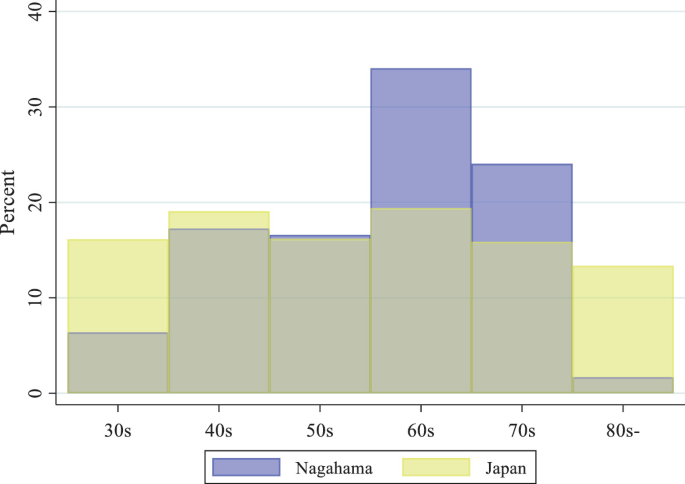
Age composition (female), comparison with entire Japan
-
2.
Family: We ask if a respondent lives with children of different age groups: preschool, elementary and middle school, high school, after high school, employed, and others including home making and being unemployed (Q1). We also ask if a respondent lives with his/her parent or his spouse’s parent (Q2). As Fig. 4 shows, around one quarter of the participants live with parents (including parents in law). Moreover, we ask about the number of grandchildren a respondent has (Q3) and if he lives with any of the grandchildren (Q4); see Figs. 5 and 6.
Fig. 4 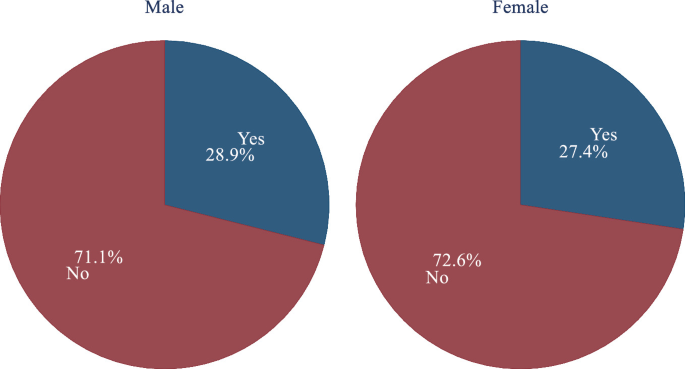
Whether they live with their parents (Q2)
Fig. 5 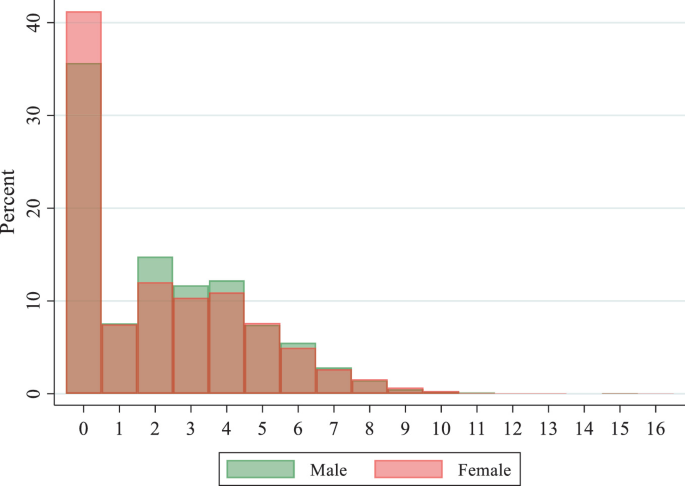
Number of grandchildren (Q3)
Fig. 6 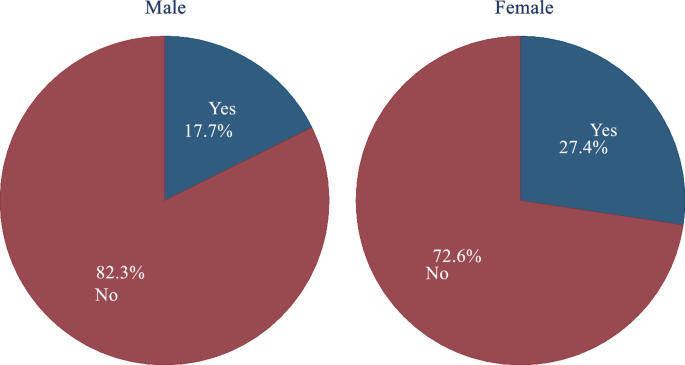
Whether they live with their grandchildren (Q4)


-
3.
Education: As for education, we ask the type of school a respondent last graduated from (Q6) and the year in which he graduated (Q7). The alternatives for an answer are: (1) primary school; (2) middle school; (3) high school; (4) undergraduate college; (5) graduate school; (6) two-year college; (7) technical college; (8) higher technical college; (9) do not want to answer. We also ask a respondent with an undergraduate or graduate degree to specify the field of specialization (Q6-1). The alternatives for an answer are: (1) literature; (2) education; (3) law; (4) economics; (5) science; (6) medicine or dentistry; (7) pharmacology; (8) engineering; (9) agriculture; (10) others. Figures 7 and 8 illustrate the distributions of highest degrees and majors for college graduates. For both men and women, as Fig. 7 shows, high school graduates constitute the highest fractions, which is consistent with the Japanese population.Footnote 1 In contrast, the fraction of those with a four-year college degree is much smaller in the Nagahama group than the entire Japanese population. Women with a four-year degree constitute a smaller fraction, while those with a two-year college degree constitute a larger fraction. Figure 8 summarizes the majors of those who have a college degree and a higher.
Fig. 7 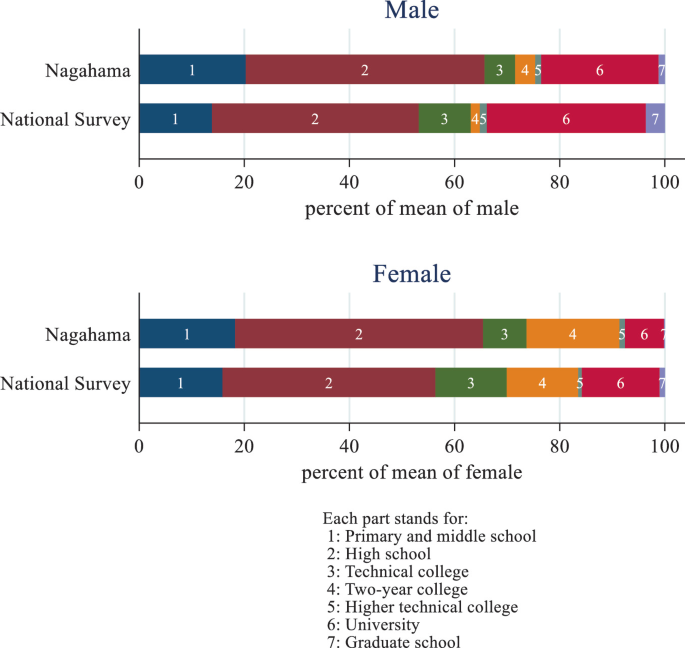
Education (Q6)
Fig. 8 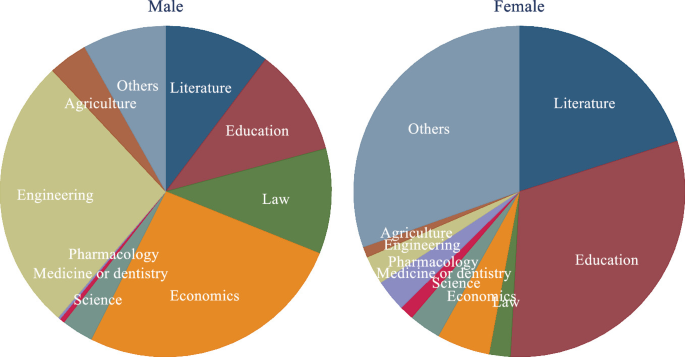
Major (Q6-1)
-
4.
Job: The survey covers a respondent’s job. We ask the number of weekly hours in which a respondent work to earn income (Q10). We also ask the type of employment that a respondent has (Q8). The alternatives for an answer are: (1) not employed (full time housewife, students, and retirees); (2) employee; (3) self-employee (food services, shop owners, farmers, etc.); (4) independent professionals (physicians, lawyers; accountants, tax accountants, writers, etc.); (5) family worker; (6) household worker not formally employed; (7) contract worker or subcontractor not formally employed; (8) do not want to answer. If the respondent is an employee, we ask about his job description (Q8-1). The alternatives for an answer are: (1) full-time employee below a manager level; (2) full-time employee at a manager level; (3) full-time employee at an executive level; (4) contract employee; (5) temporary or part-time worker; (6) dispatched worker; (7) commissioned worker; (8) do not want to answer. Figure 9 illustrates the distribution of job types for our survey samples and for Japan as a whole. In this figure, those who do not want to answer are dropped. For both men and women in their 40 s and 50 s, the fraction of people who have a job is higher than the Japanese population. The fraction of men who have a full-time job is smaller in the Nagahama group; the fraction of women who have a part-time job is larger. A larger fraction of people are self-employed in the Nagahama group than the Japanese population. In contrast, the percentage of regular employees is lower. In addition, females in their 40 s and 50 s are also characterized by a high proportion of part-time employees and others. We also ask the kind of job that a respondent performs (Q9). The alternatives for an answer are: (1) agriculture, forestry, and fishery; (2) mining; (3) sales; (4) service provider; (5) administrative and managerial; (6) clerical; (7) transportation or communication; (8) manufacturing, construction, maintenance, moving and delivery business; (9) data processing and system engineering; (10) specialized or technical work other than those in (9), healthcare, personnel, legal staff, teachers, artists (11) security (self-defense force, police, fireman, security guard); (12) do not want to answer. Figure 10 illustrates the distribution of kinds of jobs for our survey samples and for Japan as a whole; because the job types in our questionnaire are finer than in the census, we adjust our job types to that of the census. For both males and females, the share of agriculture, forestry, and fishery work is high and that of manufacturing is low compared with the entire Japan.
Fig. 9 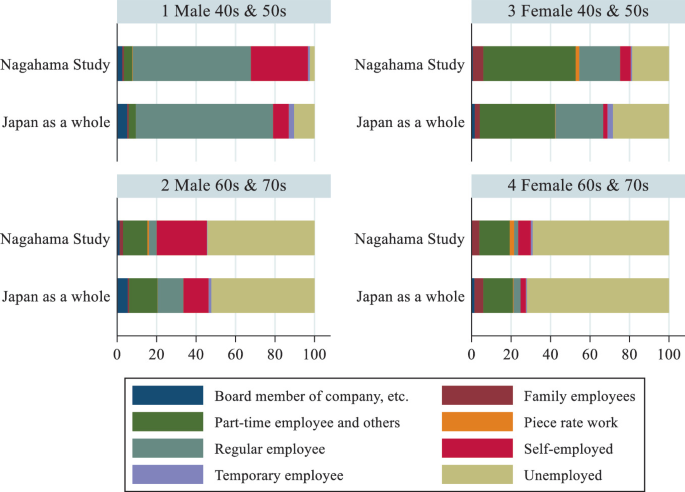
Types of job (Q8 and Q8-1)
Fig. 10 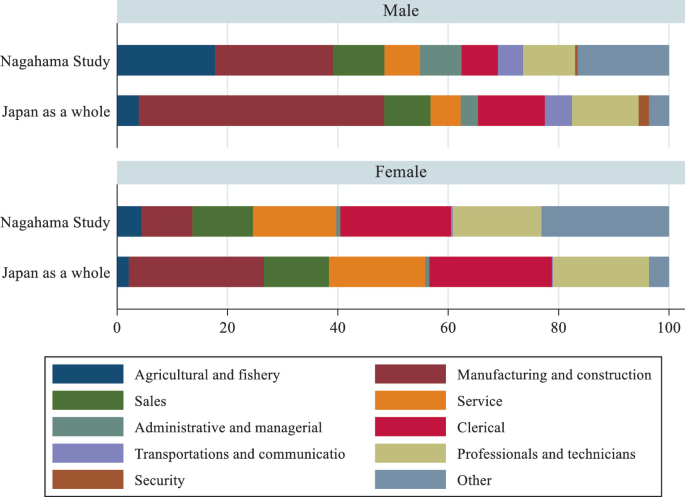
Kinds of job (Q9)
-
5.
Financial state: In order to explain personal views on life and the states of health, it is important to control income and financial assets. For this reason, we first ask a respondent’s yearly household income as well as personal income (Q11, Q13). The alternatives for an answer on these questions are: (1) 0–2 m yen; (2) 2–4 m yen; (3) 4–6 m yen; (4) 6–8 m yen; (5) 8–10 m yen; (6) 10–15 m yen; (7) more than 15 m yen; (8) do not want to answer. We also ask about a respondent’s household total assets as well as personal total assets, including bank deposits, shares and mutual funds (Q12, Q13). The alternatives for an answer on these questions are: (1) 0–2 m yen; (2) 2–4 m yen; (3) 4–6 m yen; (4) 6–8 m yen; (5) 8–10 m yen; (6) 10–15 m yen; (7) 15–20 m yen; (8) more than 20 m yen; (9) do not want to answer. The upper panel of Fig. 11 shows the distributions of annual income for male and female (Q13). For each age groups of men and women, the lower panels show the relationship between each income level and the percentage of people who are in that income level or lower (cumulative relative frequency curves). For example, the heights of orange lines at 2 show that about 90% of people in their 70 s have income less than or equal to 4 m yen. Figure 12 shows the individual assets of participants (Q14). The upper panel shows that the fraction of women with personal assets of 2 m yen or less is higher than that of males. In the lower panels, the cumulative frequency curves by age group shifts downward in the order of 40 s, 50 s, 70 s, and 60 s for both males and females, which implies that many people reduce their assets most when they are in their 60 s.
Fig. 11 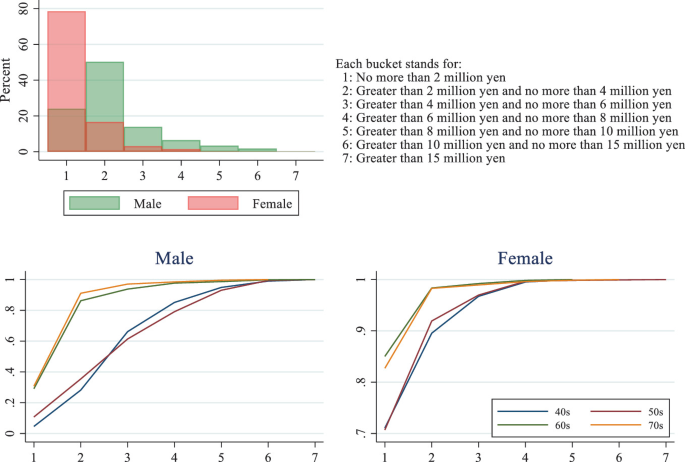
Individual income (Q13)
Fig. 12 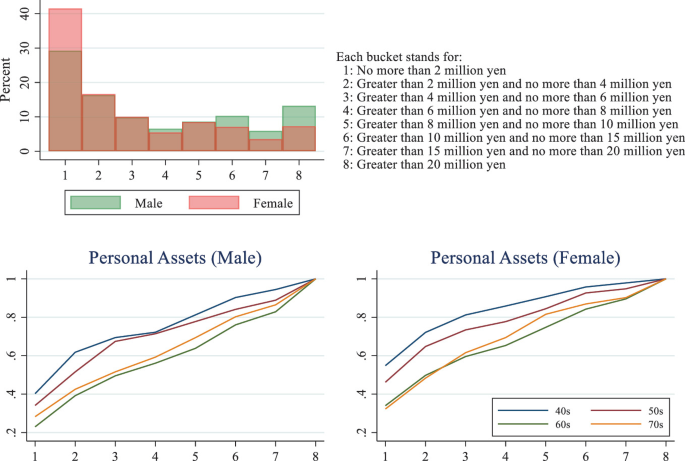
Individual assets (Q14)


3.2 Social Capital
In the first Nagahama Survey, we ask 13 questions relating to social capital. The questions can be classified into one of the OECD’s four types of social capital: (1) personal relationships; (2) social network support; (3) civic engagement; (4) trust and cooperative norms (see Scrivens and Smith (2013) and Yodo and Yano (2017, 2021)). Some of the questions related to social capital are taken from the Survey on Security, Trust, and Social Participation in Daily Life (2013) conducted by Yoji Inaba (the Inaba Survey). Unlike our Nagahama Survey, the Inaba Survey covers the entire country.Footnote 2 In what follows, we compare our survey results with those in the Inaba Survey to show differences between Nagahama participants and Inaba participants, the latter of whom represent Japan as a whole.
-
1.
Personal relationships: To measure the amount of social capital representing personal relationships, we ask how often an individual interacts with his neighbors (Q33). The alternatives for an answer are: (1) I have someone with whom I cooperate in my daily life, for example, by giving each other advice or loaning each other daily necessities. (2) I associate with some neighbors by regularly chatting with them. (3) I only associate with them at the minimum level of exchanging greetings. (4) I do not associate with them at all. As shown in the first panel of Fig. 13, the answers are not very different between men and women. The lower panels show that the older the age group, the higher the degree of closeness to neighbours. It can also be seen that such a change in distribution occurs more gradually in females; it occurs rapidly between their 40 s and 50 s in males. Figure 14 compares the Nagahama respondents with the Japanese population represented in the Inaba Survey. It shows that the Nagahama respondents have closer relationship with neighbours than the average Japanese. Another question is how many of his neighbours a respondent interacts with on friendly term (Q34). The alternatives for an answer are: (1) 20 or more; (2) 5–19; (3) 4 or less; (4) I do not know who lives next door. Figure 15 illustrates the distribution of answers to this question. As shown in the upper panel, the percentage of people who have more contacts with neighbours is higher for men than women. As the lower panels show, the older they are, the more neighbors they associate with. Figure 16 shows the distributions of answers for the Nagahama Study and the Inaba Survey. We can see that the participants in the Nagahama Study have closer relationships with neighbours than the average Japanese people. Moreover, we ask how often a respondent usually interacts with people in each of the following groups: friends and acquaintances, relatives, and workmates (Q37). The alternatives for an answer are: (1) daily; (2) from once a week to a few times a month; (3) from once a year to a few times in several years; (4) never. Figures 17, 18 and 19 show the distributions of answers to these questions. Answers to the questions relating to friends and acquaintances and to relatives are similar to those relating to neighbours. In contrast, answers to the question relating to workmates are significantly different from those relating to friends and acquaintances, and relatives; people maintain looser relationships with workmates.
Fig. 13 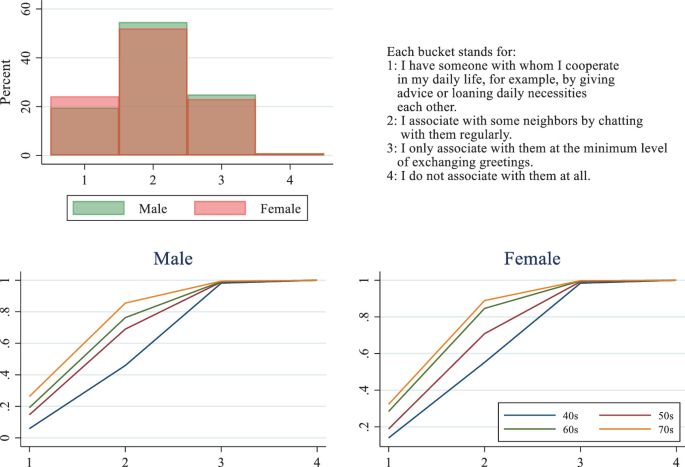
Interaction with neighbors (Q33)
Fig. 14 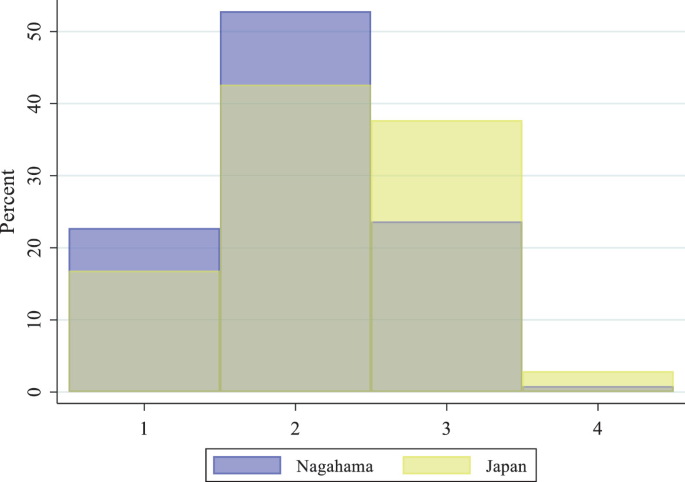
Interaction with neighbors (Q33), comparison with entire Japan
Fig. 15 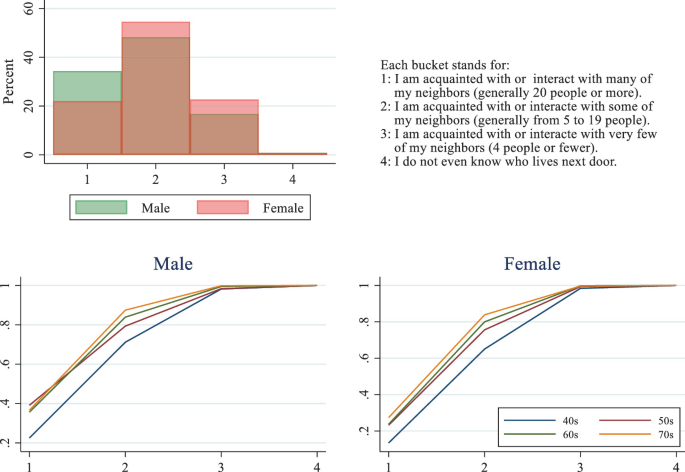
Number of close neighbors (Q34)
Fig. 16 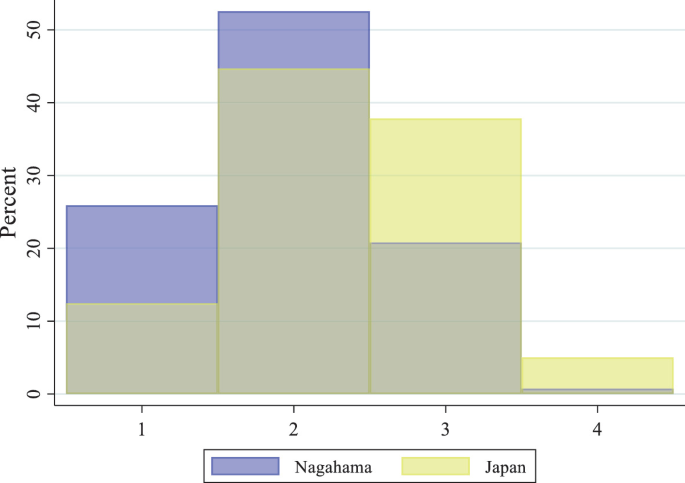
Number of close neighbors (Q34), comparison with entire Japan
Fig. 17 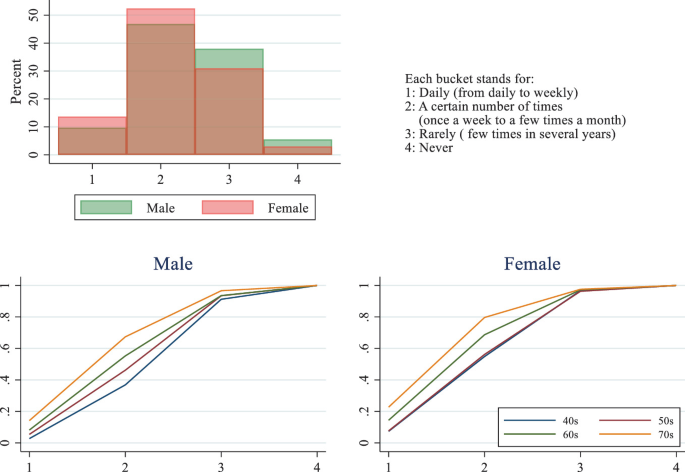
Frequency of interaction (friends) (Q37-1)
Fig. 18 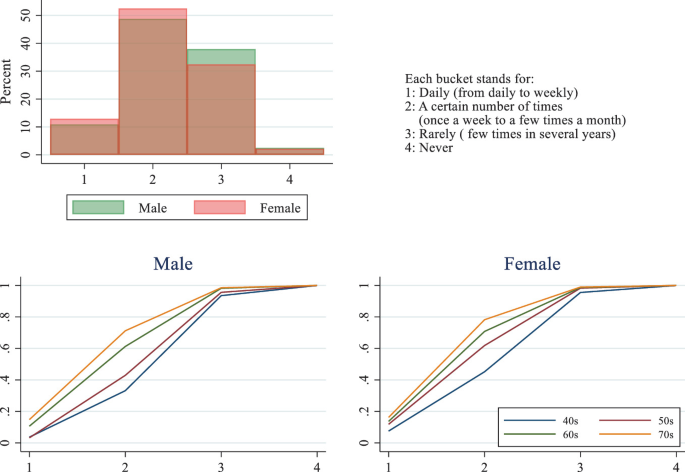
Frequency of interaction (relatives) (Q37-2)
Fig. 19 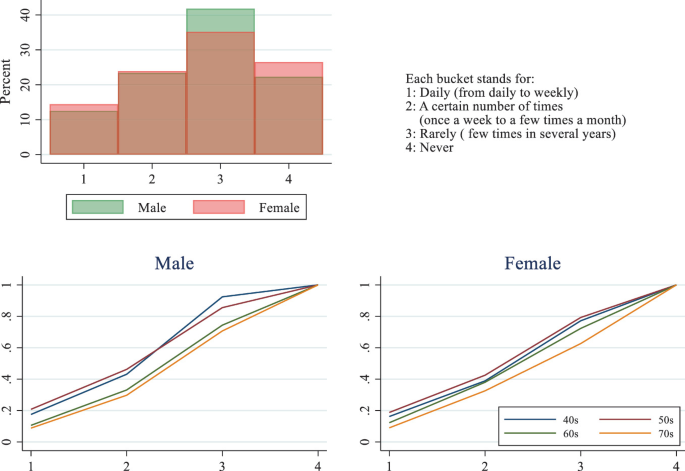
Frequency of interaction (workmates) (Q37-3)
-
2.
Social network support: To measure the amount of social capital representing social network support, we ask the extent to which a respondent thinks he can count on people in each of the following groups: neighbours, family members, relatives, friends and acquaintances, and workmates to seek for help to deal with daily problems and concern (Q35). The alternatives for an answer are: (1) very much; (2) somewhat; (3) cannot say either way; (4) not very much; (5) not at all. Moreover, we ask if a respondent wants his children and grandchildren to continue to live in the region where he currently lives (Q39). The alternatives for an answer are: (1) yes; (2) no, and (3) I do not know. With neighbours, family members, relatives and workmates, the Nagahama respondents maintain closer ties than the average Japanese. With friends, they are not very different from the average Japanese. The upper panels of Figs. 20, 21, 22, 23 and 24 compare the distributions of answers between men and women, which are similar to each other. As the figures show, the distributions of answers to Q35 is much the same as those concerning personal relationship with respect to neighbours. In contrast, with respect to friends, the distribution of answers to the questions concerning social network support do not vary across age groups. This is more clearly so for men. More women in their 40 s, in contrast, have friends whom they can count on very much than those in other age groups. (This may be because they may have a strong network built through childcare activities.) Moreover, young people appear to have more workmates whom they can count on than older people. This is likely because more old people are retired than young people. Figure 25 shows the distributions of answers for Nagahama and Inaba Surveys. With respect to friends and workmates, on the one hand, the distributions are similar to each other. On the other hand, Nagahama participants tend to have closer ties with neighbours, family members and relatives than the Japanese people as a whole.
Fig. 20 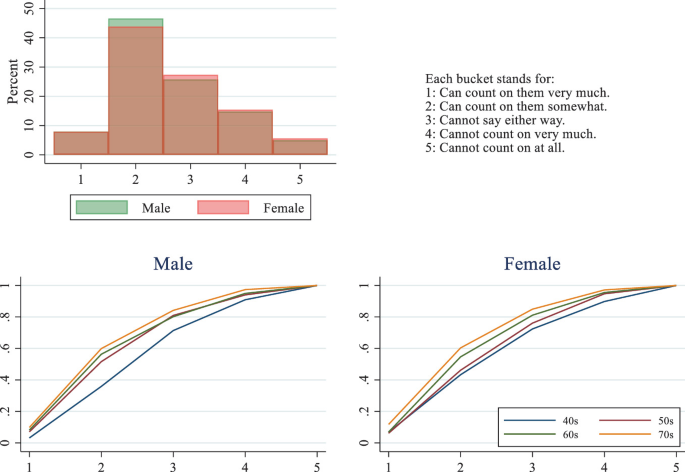
Those who you can count on (neighbours) (Q35-1)
Fig. 21 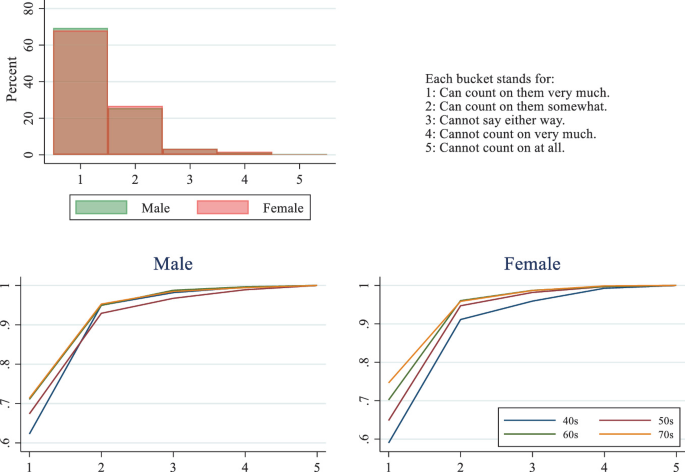
Those who you can count on (family members) (Q35-2)
Fig. 22 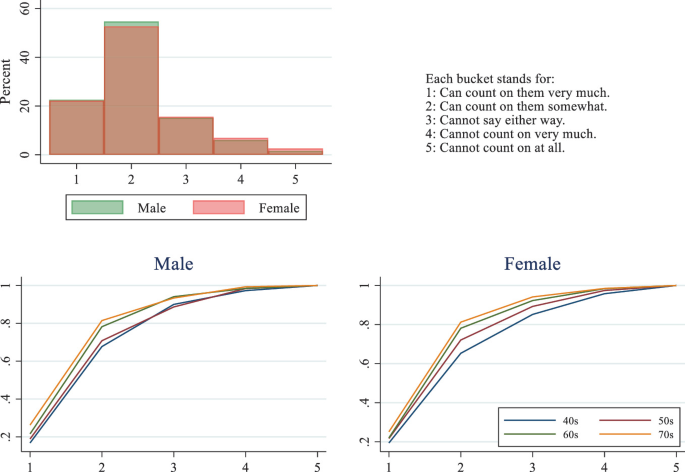
Those who you can count on (relatives) (Q35-3)
Fig. 23 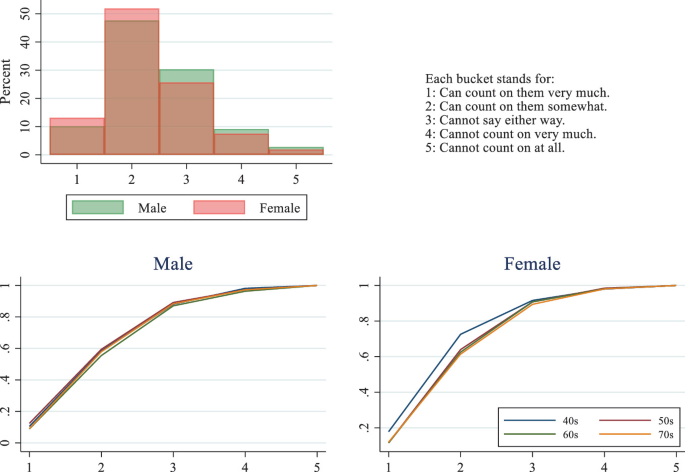
Those who you can count on (friends) (Q35-4)
Fig. 24 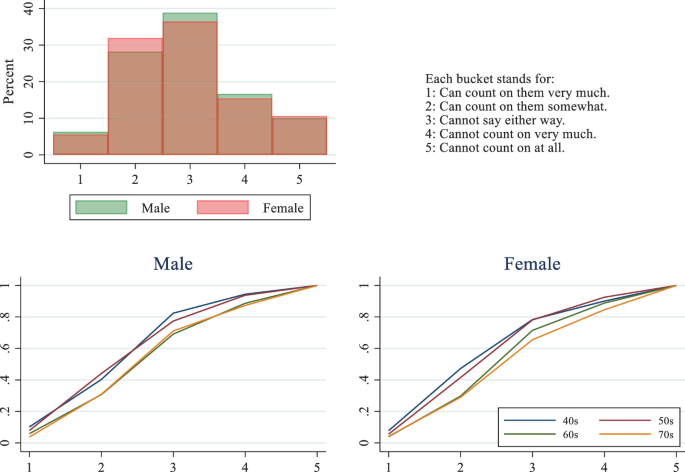
Those who you can count on (workmates) (Q35-5)
Fig. 25 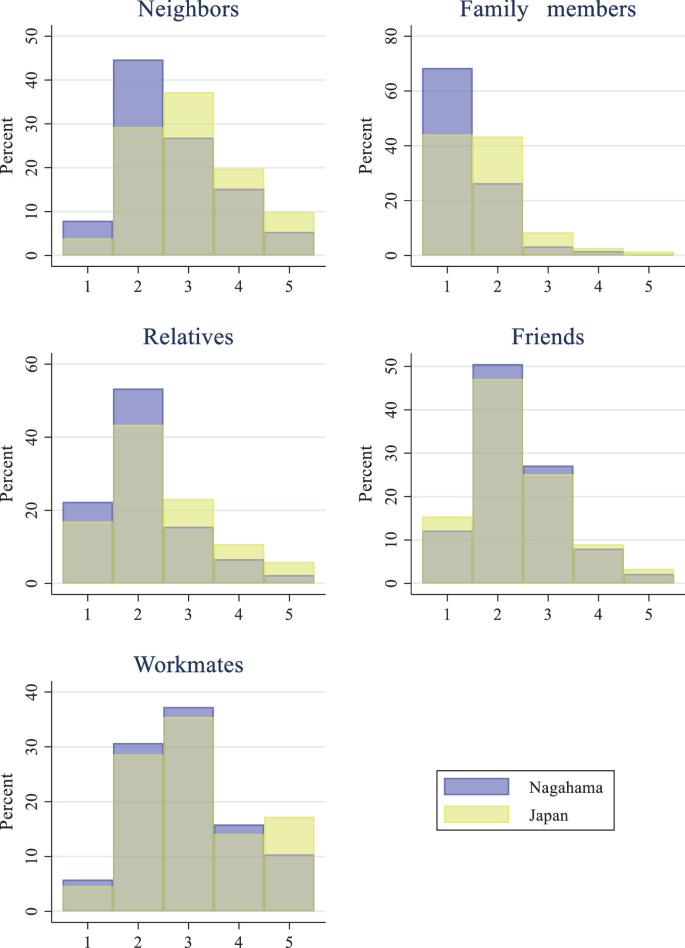
Those who you can count on (Comparison with Entire Japan) (Q35)
-
3.
Civic engagement: In order to measure the amount of social capital representing civic engagement, we ask if a respondent participates in each of the following activities: local community activities, sports, hobbies, and recreational activities, volunteer, NPO, and civic activities, and activities in other types of organizations (Q38). The alternatives for an answer are: (1) almost every week; (2) about two or three days in a month; (3) about one day per month; (4) a few times a year; (5) I am not active. We also measure an individual’s social capital relating to civic engagement by asking his willingness to contribute to the society an individual belongs to. That is, we ask if a respondent is willing to contribute to fixing community problems, such as the decline of a local shopping street, an increase in abandoned land and housing lots, and local childcare activities (Q40). The alternatives for an answer are: (1) yes; (2) yes, if possible; (3) not very much; (4) not at all; (5) I do not know. We ask if a respondent have donated money to a NPO or an organization conducting charitable activities during the past year (Q36). The alternatives for an answer are: (1) none; (2) 1–999 yen; (3) 1,000–4,999 yen; (4) 5,000–9,999 yen; (5) 10,000–49,999 yen; (6) more than 50,000 yen. Figure 26 shows that men tend to participate in community activities more than women. As Figs. 28 and29 show, people who do not participate in voluntary and other activities are more than those who do. As Fig. 27 shows, in contrast to abovementioned activities, people are divided into groups who are strongly committed and are not at all interested. Figure 30 shows the distributions of answers for Nagahama participants and for Japanese people as a whole.Footnote 3 The distributions are not very different with respect to recreational activities, volunteer activities, and other activities. In contrast, more people in the Nagahama Survey participate in community activities than Japanese people as a whole. Figure 31 shows that people are not strongly willing to make donations, which is a usual characteristic of Japanese people as Fig. 32 shows.Footnote 4 With respect to the willingness to contribute to fixing community problems, very few people are either unwilling or willing strongly. Young people and old people are not so different: see Fig. 33. We also measure an individual’s trust in various social institutions. That is, we ask to what extent a respondent trusts the National Diet, the government, local governments, courts, police, and financial institutions (banks, securities companies, etc.) (Q41). The alternatives for an answer are: (1) strongly yes; (2) somewhat yes; (3) cannot say either; (4) not very much; (5) not at all; (6) I do not know. As Figs. 34, 35, 36, 37, 38, and 39 , show, people’s trust in the National Diet and government have similar distributions. Their trust in local governments, courts, police, and financial institutions have similar distributions. These distributions are not very different across different age groups.
Fig. 26 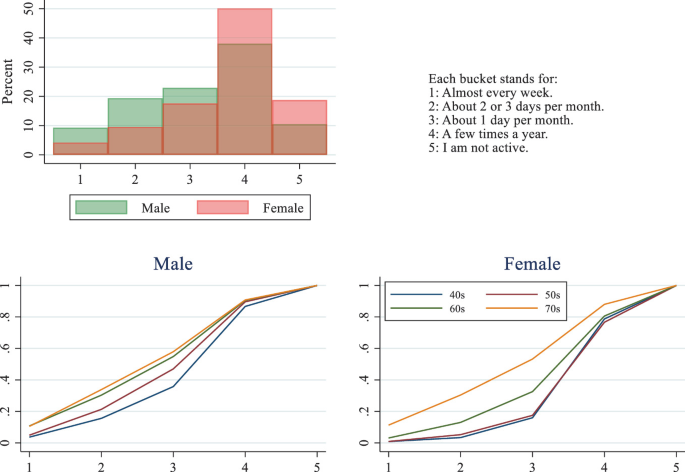
Participation in community activities (Q38-1)
Fig. 27 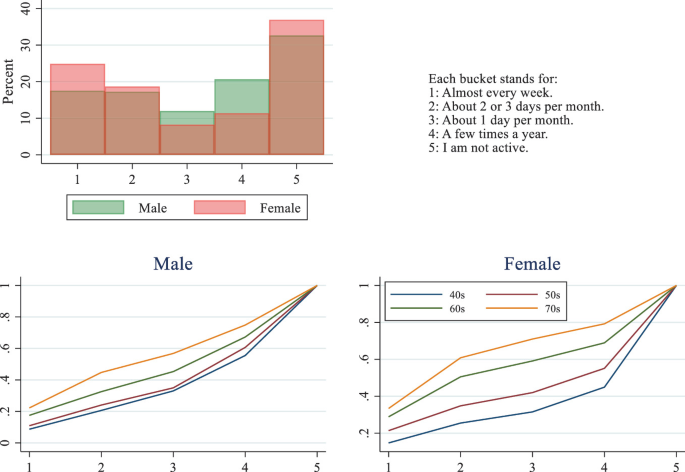
Participation in recreational activities (Q38-2)
Fig. 28 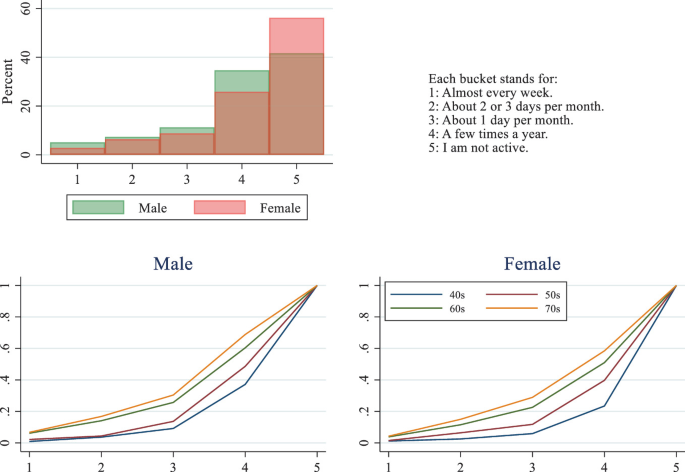
Participation in volunteer activities (Q38-3)
Fig. 29 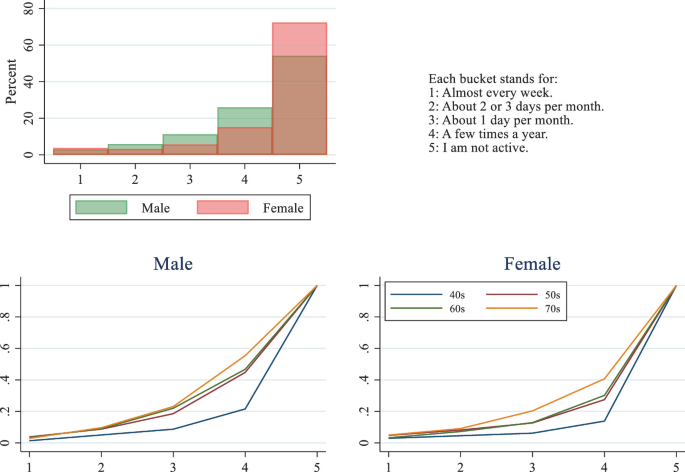
Participation in other activities (Q38-4)
Fig. 30 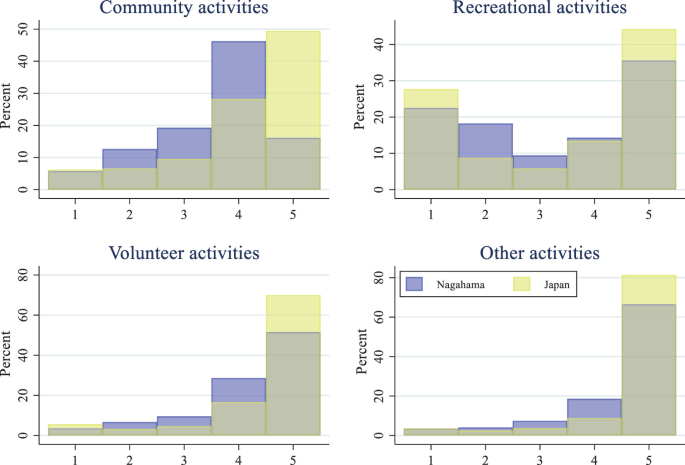
Participation in various activities (comparison with entire Japan) (Q38)
Fig. 31 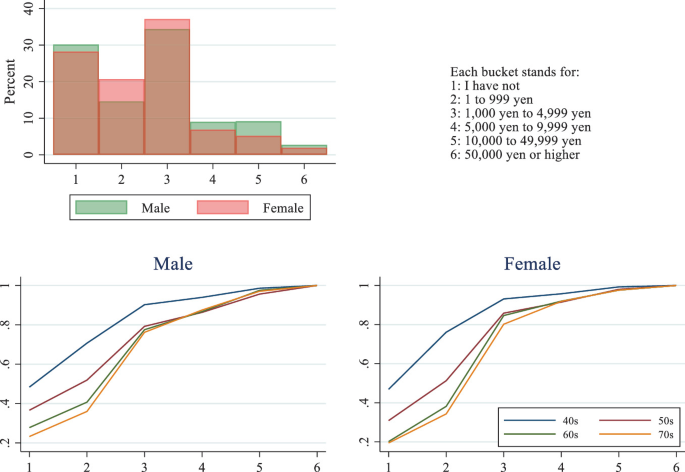
Donation (Q36)
Fig. 32 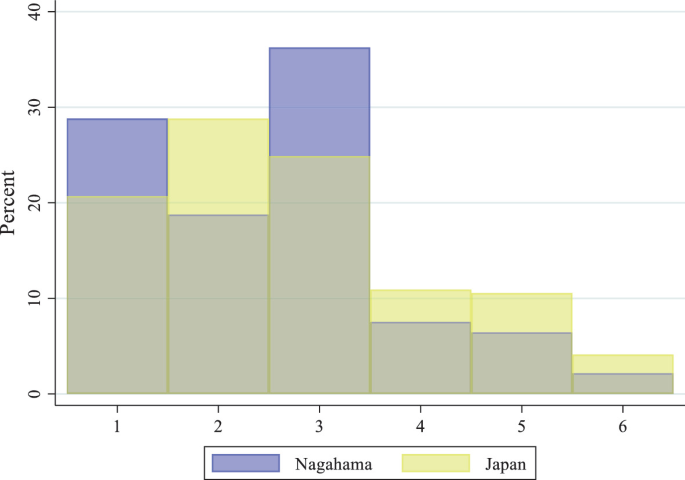
Donation (Q36), comparison with entire Japan
Fig. 33 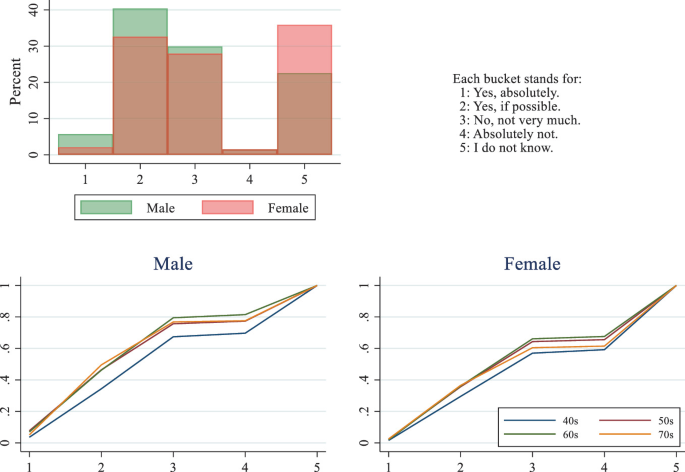
Readiness to contribute to community problems (Q40)
Fig. 34 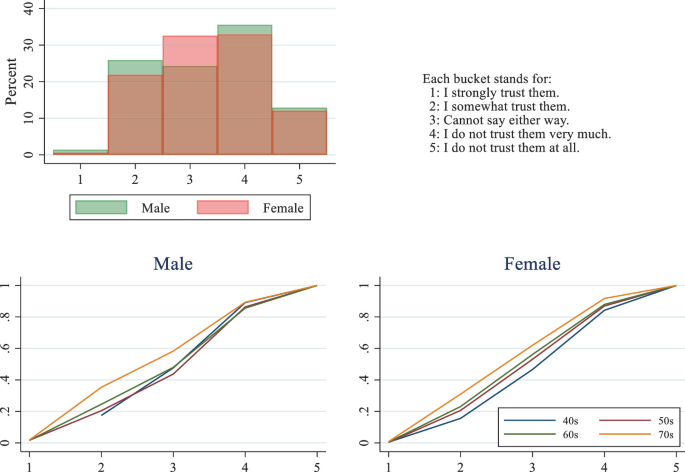
Trust in the Diet (Q41-1)
Fig. 35 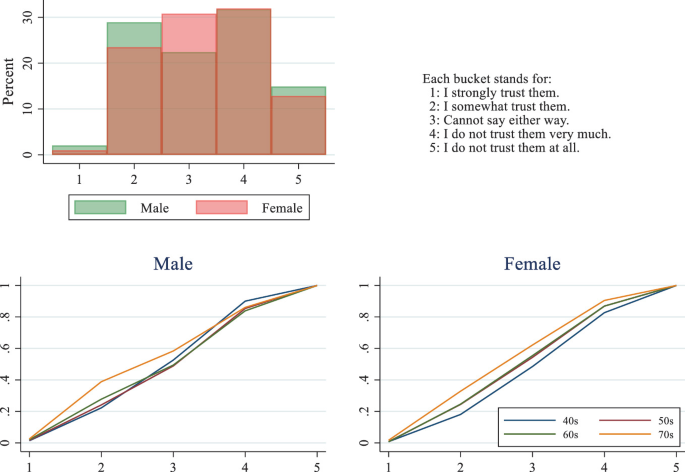
Trust in the government (Q41-2)
Fig. 36 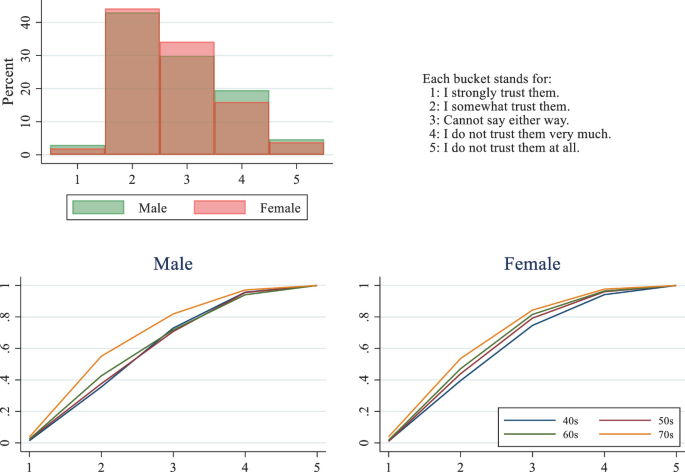
Trust in local governments (Q41-3)
Fig. 37 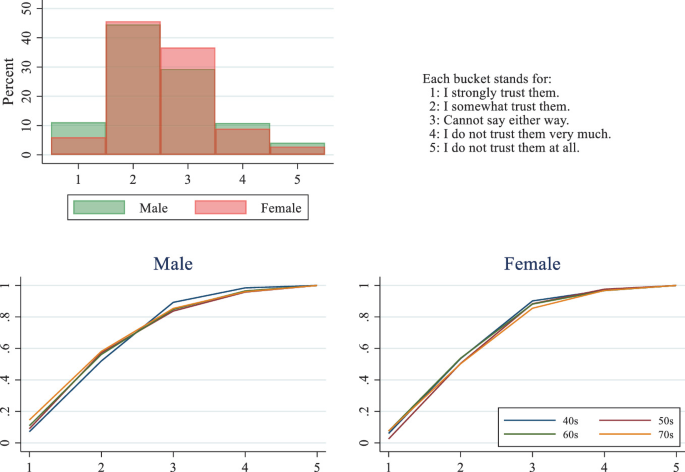
Trust in courts (Q41-4)
Fig. 38 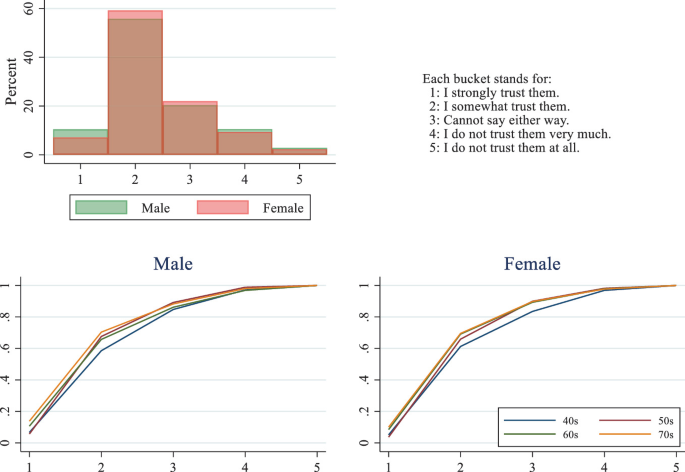
Trust in police (Q41-5)
Fig. 39 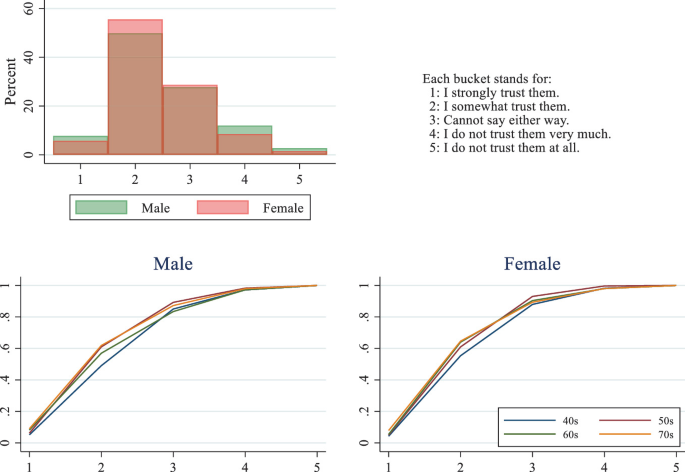
Trust in financial institutions (Q41-6)
-
4.
Trust and cooperative norms: In order to measure the amount of social capital representing trust and cooperative norms, we ask if a respondent thinks either that most people can be trusted or that he needs to be very careful in dealing with peopleFootnote 5 (Q30). We also ask his view on this question when he was 15 years old (Q31). Similarly, we ask if a respondent thinks either that others would try to take advantage of him if they got a chance or that they would try to be fair (Q32). For these questions, respondents are asked to rate his view from 1 through 10. We also measure social capital relating to trust and cooperative norms by means of reciprocity, or a social norm rewarding a positive action by returning a positive action similar in kind. That is, we ask if a respondent agrees that if he helps out others who need help, they will help me out when he is in need of help (Q42-1). We also ask if a respondent agrees that he is willing to carry a larger burden than now in order to let future generations, including children and grandchildren, have the same standard of living and same level of public services as he is having now (Q42-2). The alternatives for an answer to these two questions are: (1) strongly yes; (2) yes; (3) cannot say either; (4) no; (5) definitely, no; (6) I do not know. As Fig. 40 shows, the distribution of answers to Q32 does not vary between men and women very much. As Figs. 40, 41, 43 and 44 show, the distributions of answers to questions Q30, Q32, and Q42 are similar. That is, they tend to trust people, to find that people do not take advantage of others, and to think that good deeds are reciprocal. These views do not vary much across age groups. Figure 42 shows the distributions of answers to Q30 for Nagahama participants and for Japanese people as a whole.Footnote 6 The distributions are similar except that a much larger portion of Japanese people as a whole believe that others cannot be trusted at all than Nagahama participants. This may be because the Nagahama community is small and because its residents are more uniform. As Fig. 45 shows, older people think that they trust others more than when they were young. This agrees with our finding above on social capital relating personal relationships.
Fig. 40 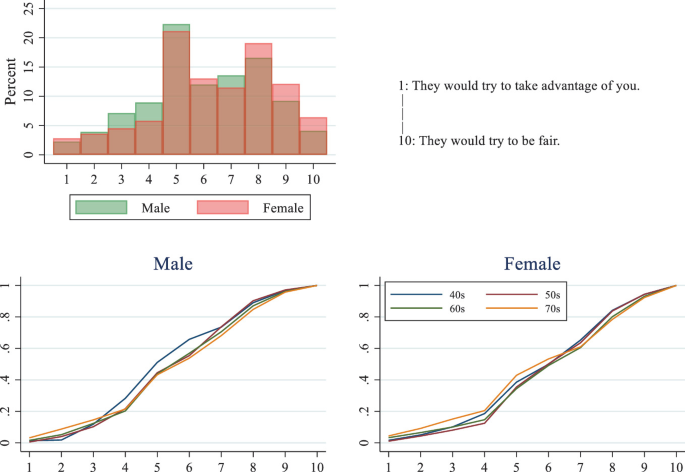
General trust (Q32)
Fig. 41 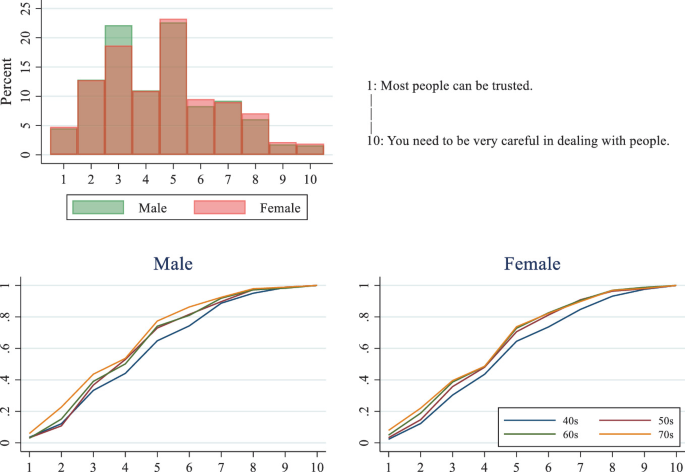
General trust (Q30)
Fig. 42 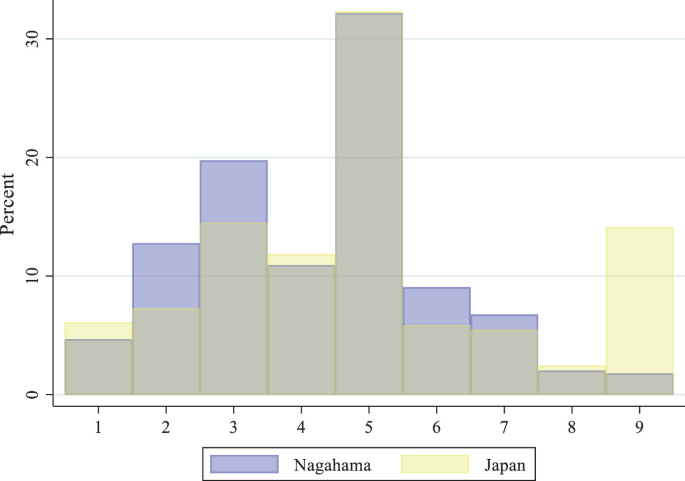
General trust (Q30), comparison with entire Japan
Fig. 43 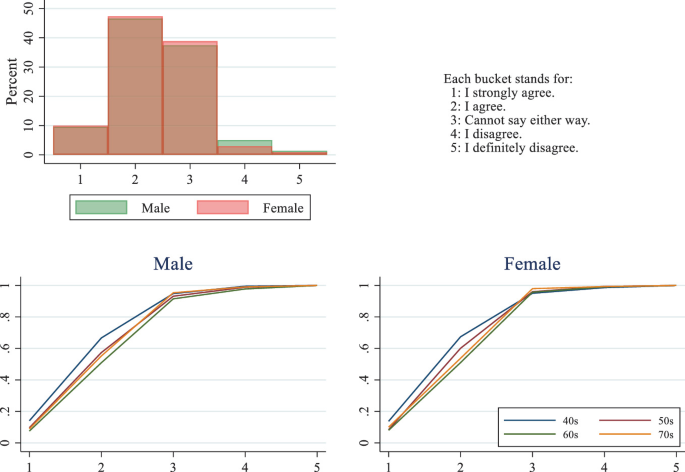
Attitudes on reciprocity (Q42-1)
Fig. 44 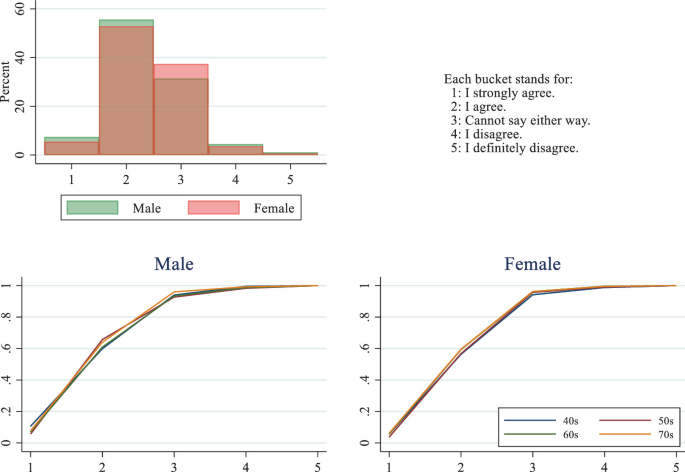
Attitudes on future generations (Q42-2)
Fig. 45 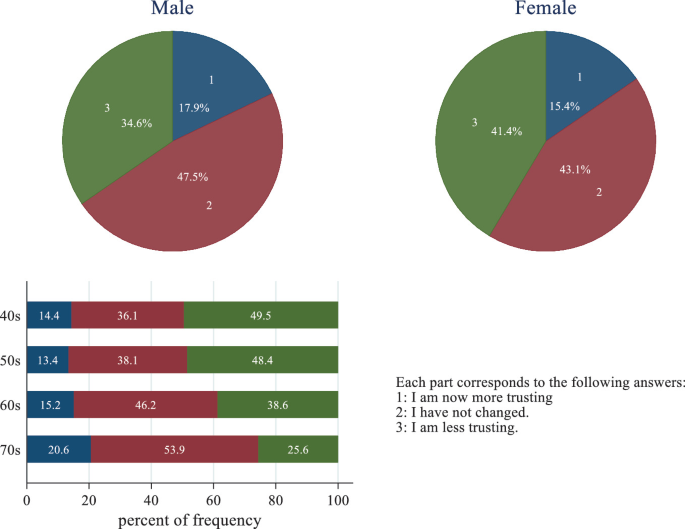
Change in general trust (Q31)


3.3 Attitudes Towards Risk
We intend to capture one’s risk attitudes by means of a straight self-evaluation and a risk-taking activity. In addition, we measure them by means of one’s tendency towards healthcare and involvement in risky asset holdings.
-
1.
Direct risk: In order to capture one’s self-evaluation on his risk attitudes, we ask if a respondent thinks either that he is fully prepared to take risks concerning all matters or that he always tries to avoid taking risks (Q15). A respondent is asked to rate his view from 1 to 10. We also intend to measure an individual’s risk aversion by a probabilistic thought experiment. That is, we ask which of the following two lotteries a respondent prefer. The first is a lottery by which he can receive 60,000 yen without fail. The second is a lottery by which he can receive 120,000 yen with a 30% chance (Q16). Moreover, we further ask a respondent who prefers the sure lottery to specify the minimum probability with which he would rather take the risky lottery. As Fig. 46 shows, people tend to be fairly risk averse; very few people think of themselves to be prepared to take a risk while many more people think of themselves as unwilling to take risks. At the same time, males are more willing to take risks than females. Moreover, older groups of people are less willing to take risks than younger, which is natural. As for the lottery of Q16, those who choose to take a chance of receiving 120,000 yen with probability 30% (which implies the expected value of 36,000 yen) over 60,000 yen are fairly risk loving. As Fig. 47 shows, men are much more inclined to take a chance than women. These findings from Q15 and Q16 are consistent, which suggests that the answers to Q15 accurately measure one’s risk aversion.
Fig. 46 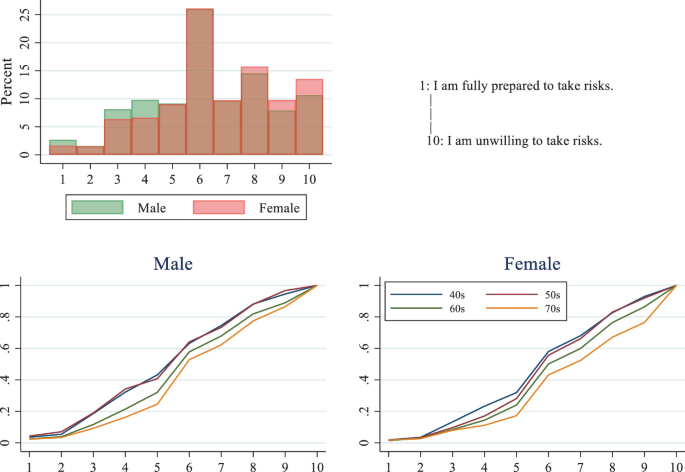
Attitude toward risks (Q15)
Fig. 47 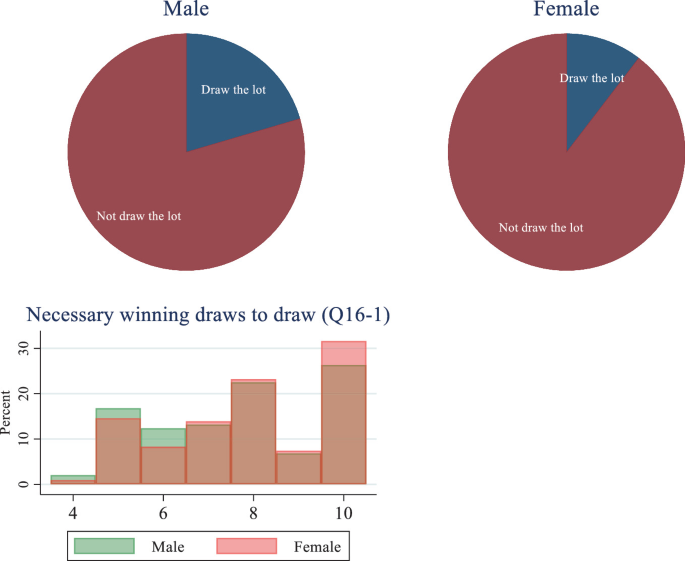
Lottery drawing (Q16, Q16-1)
-
2.
Health risk: Attitudes toward regular healthcare may be an indicator of one’s risk aversion. With this consideration, we ask several questions concerning a respondent’s regular healthcare. Answers to health-related questions are expected to be affected by one’s health. In order to control those effects, we measure a respondent’s personal evaluations on his physical healthFootnote 7 (Q5) and on his mental health; the latter is captured by the standard measure called K6Footnote 8 (Q27). The first question for measuring a risk aversion by means of health attitudes is if a respondent visits a dentist regularly (Q18). The alternatives for an answer are: (1) he visits only when he has a problem with his teeth; (2) he visits regularly. Furthermore, we ask those who make regular visits how often they do (Q18-1). The alternatives for an answer are: (1) at least every three months; (2) once every half year; (3) once every year; (4) once every two years; (5) once or less every three years. We also ask at what age he started making regular dentist visit (Q18-2). The second question is if a respondent regularly takes a health examination or a complete medical checkup (Q19). The alternatives for an answer are: (1) yes; (2) no. Moreover, we ask at what age he started a regular health examination (Q19-1). The third question is if a respondent takes nutritional supplement (Q22). The alternatives for an answer are: (1) yes; (2) no. We also ask those who answer yes how much money he spends month (Q22-1). The alternatives for an answer are: (1) up to 1000 yen; (2) 1,01–3,000 yen; (3) 3001–5000 yen; (4) 5001–10,000 yen; (5) 10,000–20,000 yen; (6) more than 20,000 yen. Figures 48, 49, and 50 illustrate the distributions of answers to these questions. As Fig. 48 shows, a majority of people answer (to Q5) that they do not have health problems; younger people are in general healthier. As Fig. 49 shows, few people have mental problems; this does not differ across age groups. As Fig. 50 shows, about one third of people visit dentists regularly for check-ups. More women make regular visits, which is consistent with the above finding that women are generally more risk averse (Q15). As the third and fourth panels show, males more often visit dentists and start taking dental care at a later stage of life than females; these may capture the fact that more males neglect daily care when they are young, which will cause problems when they become old. As Fig. 51 shows, interestingly, men and women are not so different with respect to regular medical check-ups; this may be because fewer women are employed than men, who are given regular medical check-ups at their workplaces under the law. As a result, the question on regular medical check-ups (Q19) may not be as good a measure for risk aversion as that on regular dental check-ups (Q18). Another interesting finding on health risk aversion is that the use of nutritional supplements may serve as a measure for risk aversion. As Fig. 52 shows, more women take nutritional supplements than men, which is consistent with our finding that women are more risk averse (Q15). Moreover, the group of people above and in their 50 s take more nutritional supplements than the younger group. These findings suggest that the question on supplements may constitute a good measure for risk aversion once age and health are controlled.
Fig. 48 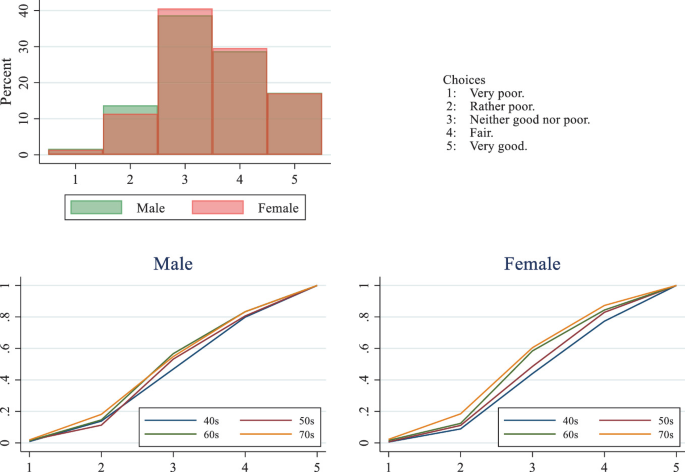
Self-rated health (Q5)
Fig. 49 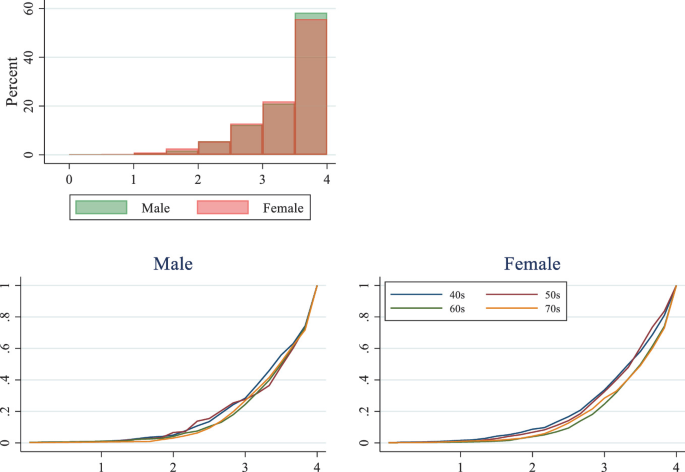
K6 index (mental health) (Q27)
Fig. 50 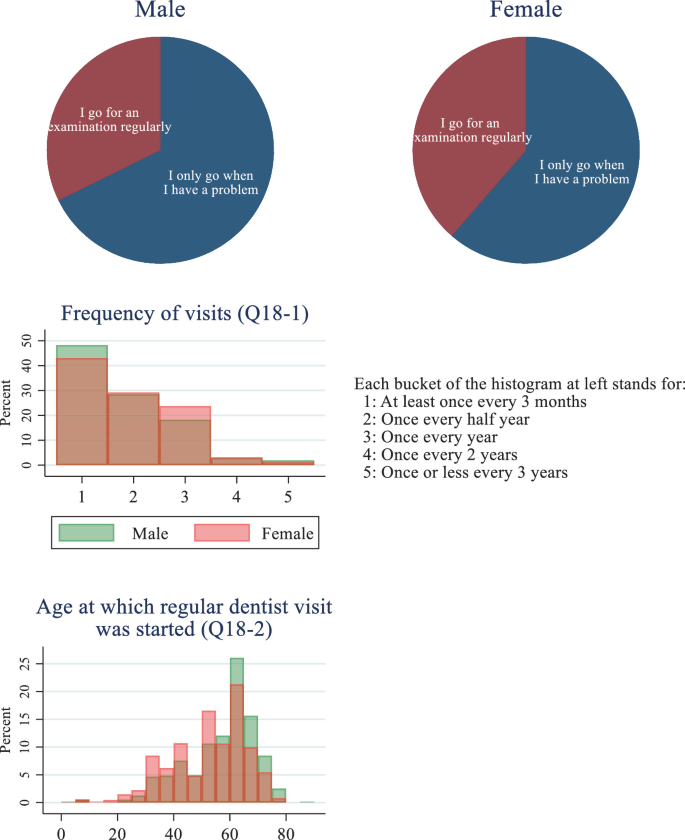
Dentist visit (Q18)
Fig. 51 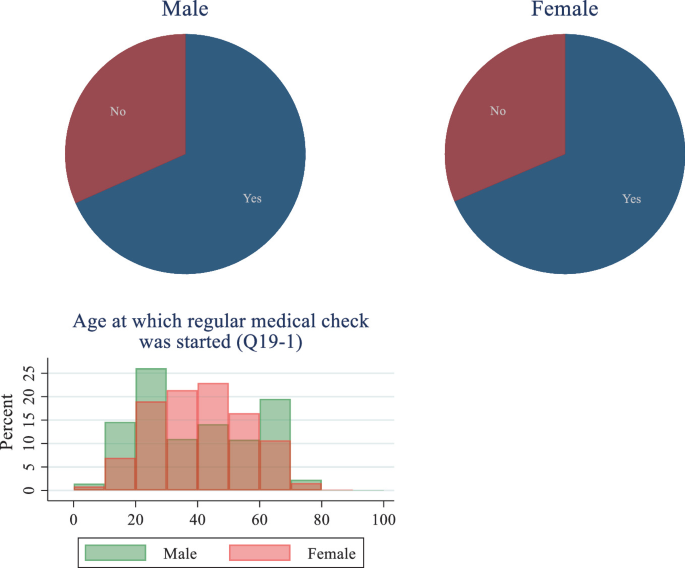
Medical checkup (Q19)
Fig. 52 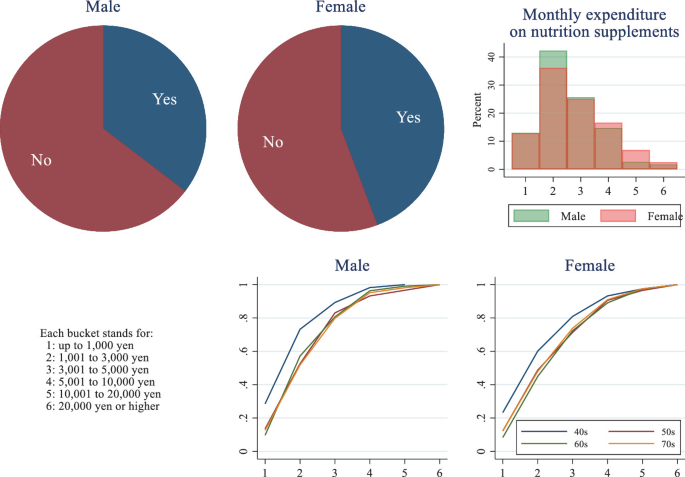
Ingestion of nutritional supplements (Q22)
-
3.
Financial risk: With respect to financial risks, we ask if a respondent has purchased risky financial assets such as shares, bonds, and foreign currencies (Q26). The alternatives for an answer are: (1) yes, and he owns currently; (2) yes, but he does not own any now; (3) no; (4) I do not want to answer or know. Moreover, we ask those who answer yes at what age they started purchasing those risky assets (Q26-1). As Fig. 53 shows, more men are involved in financial asset than women. This suggests that women might be more risk averse in this respect as well. At the same time, in many households, husbands are main income earners, who might control financial decisions. If this factor can be controlled, the question on risk assets holding may provide a measure for risk aversion.
Fig. 53 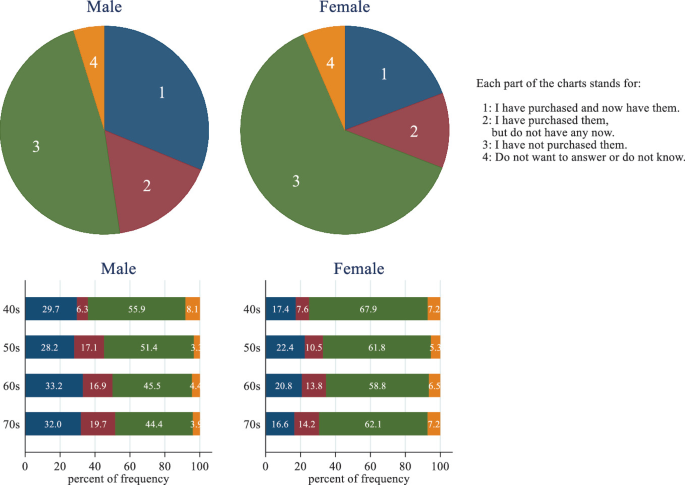
Possession of risk assets (Q26)


3.4 Happiness
We ask about various personal perceptions on life, concerning happiness, fairness and views on medical systems. With respect to one’s happiness, we ask how happy a respondent is (Q28) and how happy he thinks will be in five year (Q29). A respondent is asked to rate his happiness from 1 through 10. Figures 54 and 55 illustrate the distributions of answers to the questions on happiness. As Fig. 54 shows, more people are happy than not. Women tend to be happier than men. These findings do not vary much across age groups. As Fig. 55 shows, this does not change much between future and present happiness, although older people have less happy views on their future than younger people, which is natural.

Happiness (Q28)

Future happiness (Q29)
3.5 Fairness and Medical System
We also ask about what sorts of things respondents find fair and unfair by presenting several situations (Q25):
-
Q25-1. A certain store has been selling snow shovels for 1800 yen. The morning after a large snowstorm, the store raises the price to 2400 yen.
-
Q25-2. A company has been making a fair profit. As a recession goes on, the unemployment rate has risen, which made it easier to replace workers if they quit. For this reason, the company decides to reduce salaries and wages by 10% for all its employees.
-
Q25-3. A small factory is making kitchen tables. Because of changes in the price of materials, the cost of making each table has decreased by 2400 yen. But the factory does not lower the price for the tables.
-
Q25-4. The only store in a small rural town began to sell a new chocolate product for 800 yen. But a store in a nearby town that is about one-hour drive away sells the same chocolate for 500 yen.
These questions reflect the concept of fairness in market activities developed as a part of Yano’s market quality theory (Yano 2008, 2009). A respondent is asked to rate each of these statements. The alternatives for an answer are: (1) completely fair; (2) acceptable; (3) unfair; (4) very unfair. In Japan, the cost for national medical insurance is an important factor in fiscal debt. We ask about one’s views on Japanese medical system. Towards this end, we first ask the monthly medical expense for a respondent (Q20). We then ask if a respondent is aware of the “High-Cost Medical Expense System”, under which the government pays for a medical expense exceeding a set amount of payment (Q21). The alternatives for an answer are: (1) yes; (2) no. Moreover, we ask which of the following statements represents his view closest (Q23).
-
Q23-1. The level of medical care should be improved with the burden increased accordingly.
-
Q23-2. The level of medical care should be left unchanged with the burden remaining exactly at its present level.
-
Q23-3. The level of medical care should be reduced with the burden reduced in the future.
Finally, we ask about a respondent’s view on the introduction of expensive new medical technologies by asking which of the following statements represents his view closest (Q24).
-
Q24-1. Medical insurance premiums should be increased to include high cost medical care, so that everyone can receive it.
-
Q24-2. It should be excluded from public medical care insurance so that people who want it can receive it at their own expense.
Figures 56, 57, 58, and 59 illustrate the distributions of answers to the questions on fairness. As they show, more people find the situations described in Q25-1 and Q25-2 to be more disturbing than those in Q25-3 and Q25-4. Q25-1 is concerned with windfall profits, whereas Q25-2 with opportunistic behaviour, leading to intentional wage cuts by firing existing workers. It is highly interesting that, except for Q25-2, older people have significantly stronger views on unfair practices than younger people; views do not vary across gender. It is an important research theme to investigate why this is the case; our survey teaches us little on this theme. Figures 60 and 61 illustrate the distributions of answers to Q23 and Q24. It is difficult to interpret answers to the questions on medical system (Q23). The first and second panels in Fig. 60 describe that most males and females want to maintain the status quo of medical standards and burdens, but the percentage of males who want to raise both medical standards and burden is higher than that of females. The third panel shows that the older age group people are in, the less they want to raise both medical standards and burden. Question Q24 is concerned with so-called mixed medicine in Japan, strictly separating medical treatments on national health insurance and those on private expense; it is not permitted that a person pays part of treatments on particular illness on his own. As Fig. 61 shows, people’s views are mixed.

Sense of fairness (Q25-1)

Sense of fairness (Q25-2)

Sense of fairness (Q25-3)

Sense of fairness (Q25-4)

Attitude towards medical system (Q23)

Attitude towards very expensive medical technology (Q24)
Notes
- 1.
Data for the Japanese population are taken from the Ministry of Internal Affairs and Communications, “Employment Status Survey 2017.”.
- 2.
See Inaba (2014) for details.
- 3.
Since the alternatives in the Inaba survey are different from those in the Nagahama Study, the alternatives in the Inaba survey are recombined to be consistent with those in the Nagahama Study for this comparison.
- 4.
Since the alternatives in the Inaba survey are different from those in the Nagahama Study, the alternatives in the Inaba survey are recombined to be consistent with those in the Nagahama Study for this comparison.
- 5.
This question is commonly adopted in the literature on social capital. For example, it is used from the beginning of the World Value Survey started in 1981. See Inglehart et al. (2014) for details.
- 6.
For this question, the Nagahama Study requires an answer on a scale of 10, while the Inaba Survey requires an answer on a scale of 9. For this reason, the 5th and 6th alternatives in the Nagahama Study are combined for comparison.
- 7.
- 8.
For details, see Kessler et al. (2002).
References
Hirota S, Seto K, Yodo M, Yano M (2021) Socio-Life Scientific Survey on COVID-19. In Yano M et al. (eds.), Socio-life Science and the COVID-19 Outbreak: Public Health and Public Policy, Springer.
Idler EL, Angel RJ (1990) Self-rated health and mortality in the NHANES-I Epidemiologic Follow-up Study. Am J Public Health 80(4):446–452. https://doi.org/10.2105/AJPH.80.4.446
Inaba Y (2014) Has Japan’s Social-Relational Capital Been Damaged?: Changes in Social Relationship Capital from the 2001 National Survey and the 2013 National Survey (in Japanese). Seikei Kenkyu 51(1):1–30
Inglehart R, Haerpfer C, Moreno A, Welzel C, Kizilova K, Diez-Medrano J, Lagos M, Norris P, Ponarin E (eds.) BPea (2014) World Values Survey: All Rounds—Country-Pooled Datafile.
Kessler RC, Andrews G, Colpe LJ, Hiripi E, Mroczek DK, Normand SL, Walters EE, Zaslavsky AM (2002) Short screening scales to monitor population prevalences and trends in non-specific psychological distress. Psychol Med 32(6):959–976
Meiji-Yasuda Life Insurance Company (2019) Questionnaire Survey on Health (in Japanese), https://www.meijiyasuda.co.jp/profile/news/release/2019/pdf/20190905_01.pdf
Mossey JM, Shapiro E (1982) Self-rated health: a predictor of mortality among the elderly. Am J Public Health 72(8):800–808. https://doi.org/10.2105/AJPH.72.8.800
Scrivens K, Smith C (2013) Four Interpretations of Social Capital: An Agenda for Measurement. OECD Publishing; 2013. DOI https://doi.org/10.1787/5jzbcx010wmt-en
Setoh K, Matsuda F (2021) Cohort profile: The Nagahama Prospective Genome Cohort for Comprehensive Human Bioscience (The Nagahama Study). In Yano M et al. (eds.), Socio-life Science and the COVID-19 Outbreak: Public Health and Public Policy, Springer.
Yano M (2008) Competitive fairness and the concept of a fair price under Delaware law on M&A. International Journal of Economic Theory 4(2):175–190. https://doi.org/10.1111/j.1742-7363.2008.00082.x
Yano M (2009) The Foundation of Market Quality Economics. Jpn Econ Rev 60(1):1–32. https://doi.org/10.1111/j.1468-5876.2008.00471.x
Yodo M, Yano M, (2017) Household Income and the OECD's Four Types of Social Capital, RIETI Discussion Paper, 17-E-119.
Yodo M, Yano M (2021) The OECD’s Classification of Social Capital and Its Measures. mimeo., Kyoto University.
Author information
Authors and Affiliations
Corresponding author
Editor information
Editors and Affiliations
Appendix: The Nagahama Survey
Appendix: The Nagahama Survey
Questionnaire on Social and Economic Behavior
After answering, please send the questionnaire to the Zero-ji Health Promotion Club in the attached envelope. Participation in this survey is optional, but it is important to gain the cooperation of as many people as possible in order to conduct more accurate research, so please help us out. If the method of answering is not clear, please submit your inquiry to the Zero-ji Health Promotion Club.


Rights and permissions
Open Access This chapter is licensed under the terms of the Creative Commons Attribution-NonCommercial-NoDerivatives 4.0 International License (http://creativecommons.org/licenses/by-nc-nd/4.0/), which permits any noncommercial use, sharing, distribution and reproduction in any medium or format, as long as you give appropriate credit to the original author(s) and the source, provide a link to the Creative Commons license and indicate if you modified the licensed material. You do not have permission under this license to share adapted material derived from this chapter or parts of it.
The images or other third party material in this chapter are included in the chapter's Creative Commons license, unless indicated otherwise in a credit line to the material. If material is not included in the chapter's Creative Commons license and your intended use is not permitted by statutory regulation or exceeds the permitted use, you will need to obtain permission directly from the copyright holder.
Copyright information
© 2022 RIETI
About this chapter

Cite this chapter
Yano, M., Hirota, S., Yodo, M., Matsuda, F. (2022). Nagahama Survey on Social Science. In: Yano, M., Matsuda, F., Sakuntabhai, A., Hirota, S. (eds) Socio-Life Science and the COVID-19 Outbreak. Economics, Law, and Institutions in Asia Pacific. Springer, Singapore. https://doi.org/10.1007/978-981-16-5727-6_8
Download citation
DOI: https://doi.org/10.1007/978-981-16-5727-6_8
Published:
Publisher Name: Springer, Singapore
Print ISBN: 978-981-16-5726-9
Online ISBN: 978-981-16-5727-6
eBook Packages: Political Science and International StudiesPolitical Science and International Studies (R0)