
Abstract
The volume of the isolation ward is not large, so the air distribution is relative simple.
You have full access to this open access chapter, Download chapter PDF
Keywords
These keywords were added by machine and not by the authors. This process is experimental and the keywords may be updated as the learning algorithm improves.
4.1 Fundamental Principle of Air Distribution in Negative Pressure Isolation Ward
The volume of the isolation ward is not large, so the air distribution is relative simple. But the fundamental principle to control air pollution should be followed at first. The total trendy of air flow is consistent with the direction of gravitational deposition on pollutant, so that pollutant can be removed in the fastest way and in the shortest distance.
The size of the droplet nuclei aerosol generated by patient in the isolation ward is usually between 0.001 and 100 μm. Solid, liquid or the combined solid/liquid aerosol with the density ρ = 1 ~ 2 g/cm3 are much heavier than the air molecular. The transmission property of these aerosol is much likely.
Therefore, the air distribution schemes with up-supply and down-return (or exhaust), ceiling air supply and down-side wall air return (or exhaust), upside-side air supply and floor return (or exhaust) are usually adopted in the isolation ward.
It was recommended in the ASHRAE manual in 1991 that air supply outlet should be installed in the ceiling so that air can be supplied towards the sensitive area, the ultra-clean region and the seriously polluted region. Meanwhile, the surrounding exhaust air opening or the single exhaust outlet should be set near the floor. In this way, clean air could be supplied to the breathing zone and the working area, then downwards to the polluted floor area to be exhausted.
It was also pointed out by scholar Chan Fan during the research after SARS epidemic that the system with up-supply and down-return could effectively dilute and remove pollutant [1]. Simulation result with computational fluid dynamics showed that this kind of design could reduce the crossflow of the polluted air in the SARS ward. It was also found that in the breathing area of the medical personnel at the position 1.5 m above the floor, the particle concentration containing virus was greatly reduced.
The air distribution scheme with down-supply and up-return, which is usually used in the computer room, has never been adopted yet in air cleaning and pollution control techniques.
The air distribution scheme with upper-supply and upper-return is used in the corridor and applications where occupant activity is rare without generation of pollutant. But in air cleaning and pollution control technique, it is usually not recommended. From the above examples, at least the following aspects of shortcomings can be found.
-
(1)
The number of large particles with diameter 5 μm is relative large at the position with certain height (such as the breathing zone).
-
(2)
Air velocity in the working area is usually small.
-
(3)
The time for self-purification is long. Field test showed that it could be prolonged by one time.
-
(4)
Short circuit of flow will occur, so that part of the supplied air and the outdoor air have no effect in the room.
-
(5)
During the rising process, pollutant particles will cause pollution at places where they pass through.
This has also been noticed in “Guidelines for design and construction of hospital and health care facilities” by AIA in U.S.A. that when air supply outlet and air exhaust opening are placed on the ceiling or on the opposite side walls, short circuit will appear. In this way, the ventilation effect and the cooling/heating capacity are reduced in essence. The air distribution in the habitant room of the patient is of the same significance as the flow rate supplying into the room.
Next the detailed analysis for setting of the air supply and air exhaust openings will be presented in theory.
4.2 Velocity Field Near Return Air Opening
The key to the aforementioned problems is the position of the return air opening. Therefore, the basic understanding for the velocity field near the return air opening should be established.
Here the common analytic method is used to analyze the flow field near the return air opening.
Return air opening is the limited sink. At first, according to the fluid dynamics, when the size of the suction inlet is very small, it could be considered as “point sink”. When there is no resistance for the flow near the suction inlet, the working surface of the suction inlet is spherical. The air velocity V x at the distance x (m) from the suction inlet is
when V 0 is the average air velocity at the suction inlet and F 0 is the area of the suction inlet, we obtain
When the suction inlet is the return (or exhaust) air opening indoors, one side will be limited. The flow field is a half of the free sucked flow for the area 2F 0 [2]. In the above equation, F 0 is replaced by 2F 0.
Meanwhile, the flow will result in the resistance. Since the opening has a certain size, the actual iso-velocity surface will become ellipsoidal from spherical, which is shown in Fig. 4.1.

Flow field near the return air opening
Experiment has shown that the calculated flow field with the above equation is close to the measured value [2]. When x/d 0 > 0.5, Eq. (4.1) can be used to calculate the air velocity at each point. For circular air supply opening, d 0 is the diameter of air supply outlet. For rectangular air supply opening, d 0 is the length of the short side. When x/d 0 > 1.5, the actual attenuation rate of air velocity is larger than the calculation result [3].
Suppose the area of the room is 15 m2 and the height is 2.6 m. There is one door and one delivery window in the room. The flow rate of the exhaust air from the room is only 120 m3/h [3]. The size of two return air grilles is 2 m × 0.4 m × 0.4 m. Their shading coefficient is 0.9. The average air velocity of each return air grille is V 0 = 0.12 m/s. The corresponding air velocity is 0.2 m/s when the flow rate is 200 m3/h.
When the height of the breathing zone is 1.4 m, we obtained
So we obtain
The air velocity in the breathing zone because of the rising flow by the return air grille becomes from 0.2 to 0.33 cm/s. As mentioned before, the actual attenuation rate of air velocity may be larger than the calculated value. So the air velocity of the rising flow is less than 0.2–0.33 cm/s.
4.3 Velocity Decay Near Air Supply Outlet
Compared with the attenuation rate of air velocity near the return air opening, the attenuation rate of air velocity near the air supply outlet is much small. According to the calculation by Zhang Yan-guo, the simulated air velocities in a laboratory with area 8 m2 are shown in Figs. 4.2, 4.3, 4.4, 4.5, 4.6, 4.7, 4.8, 4.9, 4.10, 4.11, 4.12, 4.13, 4.14, 4.15, 4.16, 4.17, 4.18, 4.19 and 4.20 [4, 5]. In these figures, V a is the air velocity in the working area with height 0.8 m.

Measured attenuation of air velocity for the room with two air supply openings and with air cleanliness level 100,000

Measured attenuation of air velocity for the room with four air supply openings and with air cleanliness level 10,000

An air supply outlet with air change rate 10 h−1

Two air supply outlets with air change rate 10 h−1

Three air supply outlets with air change rate 10 h−1

Four air supply outlets with air change rate 10 h−1

One air supply outlet with air change rate 15 h−1

Two air supply outlets with air change rate 15 h−1

Three air supply outlets with air change rate 15 h−1

Four air supply outlets with air change rate 15 h−1

One air supply outlet with air change rate 25 h−1

Two air supply outlets with air change rate 25 h−1

Three air supply outlets with air change rate 25 h−1

Four air supply outlets with air change rate 25 h−1

One air supply outlet with air change rate 30 h−1

Two air supply outlets with air change rate 30 h−1

Three air supply outlets with air change rate 30 h−1

Four air supply outlets with air change rate 30 h−1

Comparison between experimental data and fitted result for attenuation rate of air velocity
From these figures, for the common number of air supply outlets, the air velocity will decay to be V a = 0.1–0.2 m/s after the supplied air reached the height 0.8 m (which is usually called the working area).
The attenuation relationship between the distance from the air supply opening and the air velocity can be found with the equation given by Liu [6], i.e.,
where x is the distance from the center of the air supply outlet and the wall; r is the equivalent radius of the air supply outlet.
For the common air supply outlet (which has smaller area than the case for local air cleanliness of one hundred, so the value of r is also small), the measured attenuation rate of air velocity is shown in Table 4.1.
In short, the air velocity in the working area with upper-supply and down-return scheme is more than that with upper-supply and upper-return (or exhaust) scheme by hundreds times.
4.4 The Following Speed and the Deposition Velocity
Under the action with three kinds of forces including the gravitational, inertial (mechanical) and diffusional forces, the velocity of the particle itself and the distance of movement are very small. For a particle with diameter 1 μm, the distances of movement per second are about 0.006, 0.0006 and 0.0004 cm. But the air velocity of indoor air (including the convective velocity of thermal flow) is usually more than 0.1 m/s. In the air flow, small particles are almost transmitted with the same velocity as the velocity of the air flow.
According to theoretical calculation, for particles with diameter 5 μm when the density ρ is 1 g/cm3, the following speed is equivalent to 90% of the velocity of air flow. For particles with diameter 1 μm, the following speed reaches 99.9% of the velocity of air flow [7]. Even when the density ρ is more than twice, the following speed reaches 90% of the former case. So for particles with diameter 5 μm with this density value, the following speed is still 80% of the air flow velocity.
Therefore, for many particles with diameter less than 5 μm, when air flows upwards (in upper-return or exhaust situation), particles will be exhausted upwards too. The difference between the trajectory of particles and the streamlines is very small, which is shown in Fig. 4.21 and Table 4.2.

Schematic of the following speed
For atmospheric dust with density ρ = 2 g/cm3, the deposition velocity V s of particles can be calculated as follows [8].
where d p is the particle diameter. When d p = 5 μm, V s = 0.15 cm/s.
It is shown that the upward rising velocity 0.2 cm/s at the working height 0.8 m is equivalent to the deposition velocity 0.15 cm/s. So the phenomenon for self-locking of particles is understandable.
4.5 Composition of Velocities and Vortex [9]
When particles are below the return (or exhaust) air opening, they will be influenced by the suction force by the return air opening, which is the carrying force by the upward air velocity. Meanwhile, they will also be affected by the gravitational force and the combined effect of the supplied air and the vortex. When the working area is not just below the return (or exhaust) air opening and it is located in one side of the room, the influence of vortex will be much larger.
When the force by supplied air is equivalent to that by return air, particles will have nearly horizontal air velocity, which is shown in Fig. 4.22. When the flow rate of supply air is larger than that of exhaust air and the air velocity in the working area reaches the magnitude of decimeter per minute, the direction of velocity on particles must be downward, which is shown in Fig. 4.23.

One schematic of force by airflow on particles

Another schematic of force by airflow on particles
Therefore, for particles with diameter less than 5 μm, although the deposition velocity is small, with the influence of air velocity only horizontal movement or rotating movement will appear. Upward rising movement will never occur. This means that these particles will wander around the breathing zone of occupant.
4.6 Position of Air Supply, Exhaust and Return Outlets in Isolation Ward
4.6.1 Fundamental Principle
It has been mentioned in the previous section that the fundamentals of air distribution in the isolation ward are that the total trend of air flow should be consistent with the deposition direction of pollutant by gravitational force. Therefore, the priority is the scheme with upper-supply and down-return.
With this general principle, there are many specific combination schemes for the positions of air supply and return (or exhaust) openings. This is the content which will be introduced in this section. First of all, the basic principle for this problem will be discussed.
The first basic principle is that unidirectional flow is easily realized with the designed positions of air supply and return (or exhaust) openings.
The concepts of directional flow and unidirectional flow in the air cleaning technology are different, which were confused before. The core of unidirectional flow is that the direction of flow is single, the streamlines are comparatively parallel, and the air velocities are relatively uniform. While the implication of unidirectional flow is that the total trend of airflow direction is fixed, which passes from the clean area towards the polluted area or through the clean area → potentially polluted area → polluted area. Streamlines are not required to be parallel, and air velocities are not required to be uniform. Figure 4.24 shows the unidirectional flow in the cleanroom. Figure 4.25 shows the directional flow in the cleanroom.

Schematic of unidirectional flow

Schematic of directional flow
It is shown that in the flow field of directional flow, local vortex could exist. But the total trend of airflow is fixed, which passes from the clean area (near the position below the air supply outlet) to the polluted area (near the operation table).
In the infectious isolation ward for microorganism pollution control, the CDC manual in U.S.A. published in 1994 clearly stated for the required directional flow that the ventilation system should be designed and balanced to force air passed through less polluted area (or relative clean area) to seriously polluted area (or relative unclean area). For example, air should flow from the corridor (relative clean area) to the isolation ward for pulmonary tuberculosis (unclean area), so that pollutant can be prevented from dispersing into other region. By setting relative low pressure in the area where air is supposed to flow into, the direction of airflow can be controlled.
Therefore, with the principle of directional flow, the scheme with exhaust air on single side wall is usually adopted.
Meanwhile, the manual from CDC provided specification on the positions of air supply and exhaust (or return) air openings based on the requirement of directional flow. One type of air distributions is to place the air supply opening at one side of the room, which is in the opposite direction facing the patient. Then air is exhausted at one side of the patient. Another kind of methods is that it is more efficient to supply air at lower temperature than that of the indoor air. In this case, air is supplied near the ceiling, and then it is exhausted near the floor.
Obviously the former method is the side air-supply and side air-exhaust scheme, and the latter is the top air-supply and down air-exhaust scheme.
For the side air-supply and side air-exhaust scheme (please refer to the figure later), ASHRAE manual has different opinions. It is believed that when air supply and exhaust openings are placed on the opposite side walls, short-circuit will occur from the supplied air to the exhausted air. This will reduce the ventilation performance and the cooling/heating capacity essentially. It can also be predicted that for upper air-supply and upper air-exhaust (or return), this shortcoming will be more obvious.
The second basic principle is that for more than one patient, they are not situated in upstream or downstream side of the airflow with the designed positions of air supply and return (or exhaust) openings. This is one important principle for prevention of cross-infection. For example, when two sickbeds are placed in parallel, and when air supply opening is placed at the left of the left sickbed while air exhaust opening is set at the right of the right sickbed, the right bed is located in the downstream of the left sickbed, which is prohibited.
The third basic principle is that it is beneficial to protect the medical personnel with the designed positions of air supply and return (or exhaust) openings, especially the potion of the air supply outlet. This has already been emphasized in the previous chapter.
As for as the air distribution is concerned, the CDC manual pointed out that in order to provide the optimal air distribution, the positions of the air supply and exhaust openings should be designed in such a way that clean air should flow through the possible working area of the medical personnel at first, and then flow through the pollution source, and enter into the exhaust air opening. In this case, the medical personnel will stay in the upstream of the airflow, although it is not possible to realize this kind of arrangement.
In the early version of ASHRAE manual in 1991, the necessity of directional flow with air supply from the breathing zone of the medical personnel at first has been pointed out. In usual condition, air is supplied from the air supply outlet installed on the ceiling, and then supplied to the sensitive ultra-clean area and the seriously polluted area, and exhausted by air exhaust opening near the floor. In this way, clean air flows through the breathing zone and the working area, and then flows downwards to the polluted flow area to be exhausted.
The forth basic principle is that the performance of the air distribution should be good enough for dilution purpose, and the draft sensation on patient should be avoided.
Three kinds of air opening positions were given in CDC manual (1994), which are shown in Figs. 4.26, 4.27 and 4.28. They are usually cited or imitated by researchers. It is required that the air exhaust (or return) openings are placed at the side wall near the head of patient (on the lower wall or middle of the wall). Meanwhile, the air supply openings are usually placed above the sickbed, or above the tail position of the sickbed, or on the wall near the tail of the sickbed. However, the issue of protecting the medical personnel is not considered in these schemes (Fig. 4.28).

One form of the air distribution recommended by CDC in U.S.A

The second form of the air distribution recommended by CDC in U.S.A

The third form of the air distribution recommended by CDC in U.S.A
Moreover, experiment was performed by Jinming Shen and Weipeng Deng for the single side top-supply and opposite side lower-exhaust scheme, which is shown in Fig. 4.29 [10].

The air distribution with the single side top-supply and opposite side lower-exhaust scheme
The theoretical analysis and numerical results on these schemes of air distribution by Deng [10] are summarized and presented in Table 4.3.
But among these schemes, how to prevent the unreasonable phenomenon shown in Fig. 3.28 is not considered.
It is firstly proposed the concept of protecting the medical personnel by the mainstream area in the research project on the isolation performance of the isolation ward [11].
4.6.2 Related Assessment Index
There are several assessment index for the performance of the combined positions of air supply and exhaust openings.
-
1.
The dimensionless height when the pollutant concentration above the patient mouth reduces to 1% of the concentration in the breathing zone of patient [4].
The larger the height is, the easier the indoor pollutant disperses into the breathing zone of the medical personnel, and the larger the risk on the medical personnel standing by is.
-
2.
The dimensionless average concentration indoors at certain height
This dimensionless concentration reflects the dispersion and dilution velocity of the exhaled pollutant from patient, as well as the influence of air distribution.
-
3.
The ventilation efficiency in whole room
This value reflects the ability for removal of indoor pollutant by airflow. The larger the value is, the better the removal efficiency is. In this case, the quantity of the dispersed pollutant indoors is less. The ventilation efficiency value could be larger than 1.
where E is the ventilation efficiency in whole room; N E is the pollutant concentration at the air exhaust (or return) opening; N S is the pollutant concentration at the air supply opening; N V is the average pollutant concentration indoors.
-
4.
Predicted percentage of dissatisfied due to draft PD [10]
The value of PD is based on the draft sensation on patient face. It reflects the decay rate of air velocity and the sensation for uniformity of airflow.
where PD is the percentage of dissatisfied due to draft in a position inside the room, %; t is the temperature at this place, °C; v is the air velocity at this place, m/s; T u is the turbulence intensity at this place, %. Usually T u can be set 5%.
For comfort air-conditioning system, the air velocity near the face of people should be less than 0.12 m/s. It is pointed out in ISO7730 that the value of PD should not exceed 15%, so that the draft sensation can be avoided.
4.6.3 Results from Numerical Simulation [10, 12]
-
1.
Geometric model of the isolation ward with single sickbed
The actual geometry of the isolation ward with single sickbed is 4.5 m × 3.15 m × 2.7 m. There is one sickbed inside (1.9 m × 0.9 m). The air supply outlet is placed on the ceiling (1 m × 0.32 m). The air return opening is set near the sickbed (0.5 m × 0.2 m). Given the actual condition occurred in the ward, the patient model was placed on the sickbed (During experiment, the model can stay with recumbent position. Aerosol can be exhaled from the nasal cavity), at each side of the sickbed one medical personnel model was placed.
Feng et al. proposed four schemes for positioning of air openings based on the principle of the mainstream area, and performed numerical simulation [12]. The relative positions of objects in these schemes are presented in Figs. 4.30, 4.31, 4.32, 4.33 and 4.34. The detailed information of these schemes are:

Schematic of scheme No. 1 with two return air openings. (Air supply opening B was placed above the tail position of the sickbed. Rectangular air return openings a and b were set at both side near the head of the sickbed)

Schematic of scheme No. 2-a with one return air opening. (Rectangular air supply opening A was placed above the standing position of the medical personnel. The position of air return opening b was the same as Scheme No. 1)

Schematic of scheme No. 2-b with two return air openings. (The position of air supply opening A was the same position in the above scheme. Rectangular air return openings a and b were set at positions as Scheme No. 1)

Schematic of scheme No. 3 with one return air opening. (Air supply opening C was placed on the ceiling above the door. Air return opening b was set the same place as Scheme No. 1)

Schematic of scheme No. 4 with one return air opening. (Air supply opening A and B were placed in the same places as Scheme No. 1 and No. 2. Air return opening b was set the same place as Scheme No. 1)
-
Scheme No. 1: Two air return openings. Air supply opening B, air return openings a and b, patient 2 and virtual medical personnel 1.
-
Scheme No. 2-a: One air return opening. Air supply opening A and air return opening b.
-
Scheme No. 2-b: Two air return openings. Air supply opening A and air return opening a and b.
-
Scheme No. 3: One air return opening. Air supply opening C and air return opening b.
-
Scheme No. 4: One air return opening. Air supply opening A and B, and air return opening b.
-
2.
Simulated results for single sickbed
-
(1)
Simulation condition
The air change rate was 12 h−1. The size of the mouth was 0.02 m × 0.02 m. The respiratory rate of patient was 8 L/min. The temperature on the surface of patient model was 37 °C. It is an unfavorable condition with the temperature 37 °C. It was the surface temperature during the quilt is uplifted for health examination when the patient caught the fever with high body temperature. If the temperatures on the surface of patient model were set the same as the air, the simulated result will be unrealistic.
-
(2)
Dimensionless height
Comprehensive comparison of dimensionless heights in various schemes is illustrated in Fig. 4.35, where the value of h is based on the position of patient mouth.

Comparison of dimensionless height when pollutant concentration decays to 1 % of that in the wound
From the figure, the dimensionless height for scheme No. 2-a with one return air opening is the smallest, which is the most favorable for protection of medical personnel.
-
(3)
Dimensionless concentration
It is the ratio of the average pollutant concentration indoors to that near the mouth of patient at certain height for various schemes, which is shown in Table 4.4. In the table, the height is based on the floor.
From Table 4.4, the dimensionless concentrations at certain height for scheme No. 2-a with one air return opening and No. 4 are the lowest.
It was found in simulation that for scheme No. 2-a with one air return opening, the area where dimensionless concentration was larger than 10% is the smallest, and the corresponding dimensionless height in the vertical direction is the lowest. But for scheme No. 2-bN with two air return openings, short-circuit appears for part of the airflow, which worsens the performance of the air distribution indoors and elevates the height for dispersion of pollutant by 16.8%.
-
(4)
Situation with two sickbeds
Simulated results show that for two sickbeds, under the condition of normal respiratory rate (8 L/min), the sickbed A has no influence on the sickbed B. When the respiratory rate exceeds 20 L/min, the heights of pollutant dispersion near the patient for all the schemes are larger than 1.5 m, which is beyond the breathing zone of the standing occupant. In this case, risk will be formed for the medical personnel.
When the respiratory rate exceeds 80 L/min, mutual influence will appear for exhaled pollutant in various schemes.
Therefore, under most conditions, the cross infection between multi-bed can be avoided.
-
(5)
Ventilation efficiency in the whole room
Based on the simulated result by Deng [10], the ventilation efficiencies with six different positions of air supply and return openings are shown in Table 4.5.
From Table 4.5, the ventilation efficiency with the up-supply and up-return scheme is the lowest, which is consistent with the conclusion in Sect. 4.1.
-
(6)
Perceived percentage of dissatisfied due to local draft
The perceived percentage of dissatisfied was obtained for six different positions of air openings by Deng [10], which is shown in Table 4.6.
From Table 4.6, when the perceived percentage of dissatisfied is required to be less than 5%, the air velocity near the face should not exceed 0.1 m/s.
According to the research by Shen, Deng and Tang [10, 13, 14], the ventilation performance with displacement effect for the double shutter is much better than that of other air openings. A certain angle of supplied air can be formed with the double shutter, which could reduce the draft sensation on the surface of patient (refer to the next section). When the angle between the upper louver and the horizontal plane is 60º and when the angle between the lower louver and the horizontal plane is 40º, the performance of air distribution is the best. In this case, the air distribution indoors is shown in Fig. 4.36. The schematic diagram for the dispersion of pollutant indoors from the coughing process of patient is shown in Fig. 4.37 [10].

Dispersion of airflow indoors with the double shutter

Dispersion of droplet indoors from coughing of patient with the double shutter
From all the figures shown in Sect. 4.3, when the air supply outlet is not above the face of patient, the relationship between the air velocity at the height 0.8 m and the air velocity at the air supply outlet can be obtained, which is shown in Table 4.7. With the conditions in the table, the air velocity near the face can be less than 0.1 m/s.
4.6.4 Experimental Validation on Performance of Opening Position
-
1.
Experimental method
The most effective and intuitive way to validate the air distribution is to perform microbiological measurement. Figure 4.38 shows the layout of the isolation ward in experiment. Figure 4.39 shows the profile of the air supply and exhaust openings.

Layout of the air supply and exhaust openings in simulated isolation ward

Profile of the simulated isolation ward
The effect of the air supply and exhaust openings is as follows.
-
(1)
Air supply or return opening with self-purification (No. 1, 4 and 5 in the figure). It can guaranteed the room to perform self-purification rapidly, and the background concentration can be the air cleanliness level 1000. In this way, the measurement error can be reduced.
-
(2)
The combination of air supply outlets A, B and C, together with air return (exhaust) openings a and b, forms the aforementioned four schemes in Sect. 4.6.3.
-
2.
Experimental result
-
(1)
Fig. 4.40 shows the sampling positions of the precipitating bacteria in the isolation ward. For sampling the bacterial concentration on bed, the sampling positions were on the bed, which is shown in Fig. 4.41. Other sampling positions were placed on the floor.
Fig. 4.40 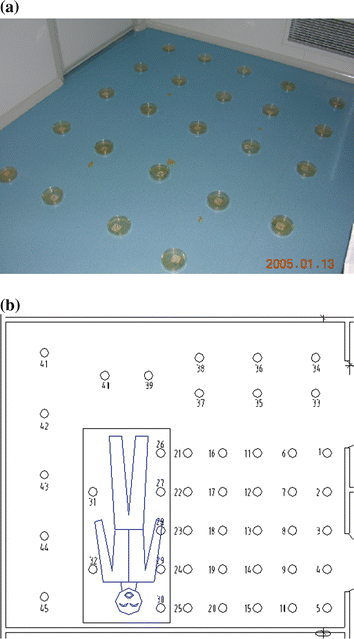
Schematic of the sampling positions. a Photo-of-Petri-dish-on-floor. b Location-of-sampling-positions-in-isolation-ward
Fig. 4.41 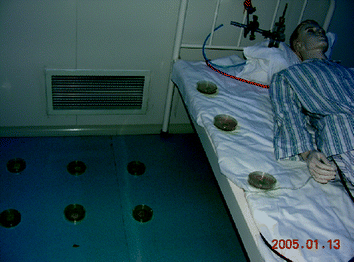
Schematic of the sampling positions on the bed
-
(2)
The distribution of the mixed bacteria is presented in Fig. 4.42.
Fig. 4.42 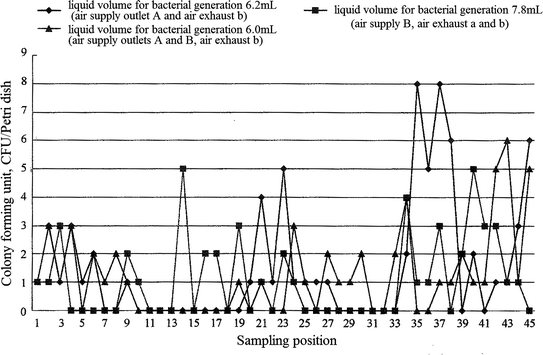
Distribution of the mixed bacteria in the isolation ward
From Fig. 4.42, for scheme No. 1 (Air supply outlet B with air return openings a and b), the average concentration of the mixed bacteria is 1.1 CFU/petri dish. For scheme No. 2-a (Air supply outlet A with air return opening b), the average concentration of the mixed bacteria is 1.6 CFU/petri dish. For scheme No. 4 (Air supply outlet A and B with air return opening b), the average concentration of the mixed bacteria is 1.3 CFU/petri dish.
-
(3)
The concentration of the experimental bacteria for different schemes in the isolation ward is shown in Fig. 4.43.
Fig. 4.43 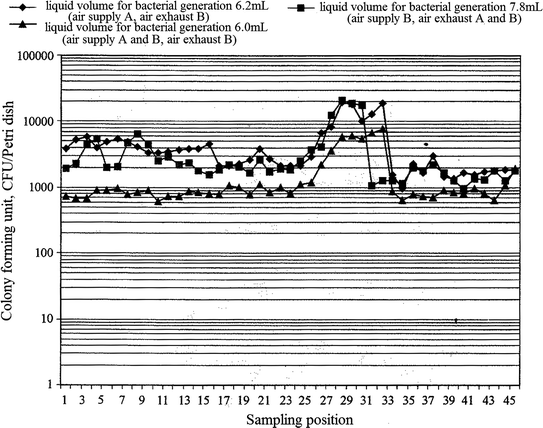
Distribution of the actual experimental bacteria with different schemes in the ward (n = 12 h−1, the concentration of the bacterial solution is 8 × 10⁻¹⁰ pc/mL)
-
(4)
The distribution for the concentration of the settlement bacteria in the region facing the operator is shown in Fig. 4.44.
Fig. 4.44 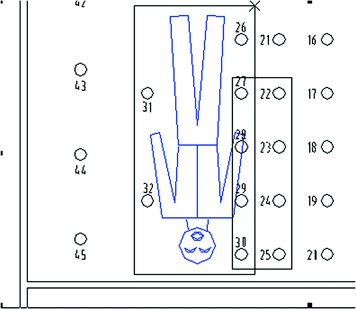
Distribution for the concentration of the settlement bacteria in the regions where operator stands or faces to


-
3.
Analysis
-
(1)
At first, three kinds of the upper-supply and lower-exhaust schemes play the same role in the cleaning of indoor air. Based on the data of the mixed bacteria shown in Fig. 4.42, the difference is not obvious for the concentration range 1.1–1.6 CFU/Petri dish. Moreover, under the condition of the air change rate 12 h−1 (which could corresponds to the air cleanliness level 100,000), the bacterial concentration reached the value within air cleanliness level from 1000 to 10,000. This means the isolation ward has a certain capacity of air cleaning.
-
(2)
Based on the principle of protecting the medical personnel, the experimental result for scheme No. 2-a (with one air return opening) is quite prominent.
The area of the sampling positions shown in the rectangular frame shown in Fig. 4.40 is in front of the patient, which includes the sampling points 22–25 and 27–30.
In this area, the average bacterial concentration for scheme No. 2-a (with one air return opening) is 8172 CFU/Petri dish. The average bacterial concentration for scheme No. 1 is 10007 CFU/Petri dish. The concentration for scheme No. 1 is larger than that for scheme No. 2-a (with one air return opening) by 22.5%. For sampling points 22–30, the concentration for scheme No. 1 is larger than that for scheme No. 2-a (with one air return opening) by 25%.
Therefore, it is meaningful to adopt scheme No. 2-a (with one air return opening) in this aspect. As mentioned before, this result has been proved by numerical simulation.
Although there is no experimental data for scheme No. 2-b with two air return openings and scheme No. 3, it is shown from numerical result shown in Table 4.4 that the concentrations in the breathing zone at the height 0.65–1.5 m for scheme No. 2-b with two air return openings and scheme No. 3 are larger than scheme No. 2-a with one air return opening and scheme No. 4.
It has been mentioned before that it is not important how much is the average indoor concentration, but the concentration in the working area of the medical personnel should be lowest. Therefore, the performance of scheme No. 2-a with one air return opening is superior to that of scheme No. 1, scheme No. 2-b with two air return openings and scheme No. 3.
-
(3)
Why the concentrations for sampling points 26–32 on the bed for various schemes are obviously larger than other sampling points? The concentration of scheme No. 2-a with one air return opening is larger than the indoor average concentration by two times, which is also larger than that for scheme No. 1 by three times and larger than that for scheme No. 4 by three and four times. This is because these petri dishes were placed on the bed, which is close to the pollutant source. This is understandable.
-
(4)
The whole performance measured for scheme No. 4 is superior to that of scheme No. 2-a with one return air opening and scheme 1, while the performances of the latter two schemes are better than other schemes by both measurement and simulation. Based on the simulated result by Weipeng Deng shown in Table 4.4, the performance for the scheme with one-side top-supply is the best. Therefore, it is easy to combine these findings for understanding purpose. Because of the advantages of these two schemes, they are widely used.
-
(5)
As mentioned in Sect. 3.3, the area of the air supply outlet can be enlarged until the air velocity at the air supply outlet is not less than 0.13 m/s.
-
(6)
Two air supply outlets can be placed separately as the scheme No. 4, on condition that the air supply velocity is not less than 0.13 m/s.
References
F. Chan, V. Cheung, Y. Li, A. Wong, R. Yau, L. Yang, Air distribution design in a SARS ward with multiple beds. Build. Energy Environ. 23(1), 21–33 (2004)
B.B. Бaтypин, Y. Liu, Fundamentals of Industrial Ventilation (China Industry Press, Beijing, 1965), p. 109
Y. Sun, Industrial Ventilation, 2nd edn. (China Architecture & Building Press, Beijing, 1985)
Z. Xu, Y. Zhang, Y. Zhang, Z. Mei, J. Shen, D. Guo, P. Jiang, H. Liu, Mechanism and performance of an air distribution pattern in clean spaces. J. HV&AC 30(3), 1–7 (2000)
Y. Zhang, Z. Xu, Y. Zhang, Z. Mei, J. Shen, D. Guo, P. Jiang, Numerical simulation analysis on concentration field in clean room with different air supply areas. Build. Sci. 15(6), 6–11 (1999)
H. Liu, Analysis on factors influencing air distribution of local clean zone with air cleanliness level 100 in clean space. China Academy of Building Research (2000)
Z. Xu, Fundamentals of Air Cleaning Technology (Springer, Berlin, 2014), p. 293
Z. Xu, Fundamentals of Air Cleaning Technology (Springer, Berlin, 2014), p. 311
Z. Xu, Y. Zhang, Y. Zhang, X. Yu, Discussion on the place of supply air outlet and return air inlet in biosafety laboratories. Contam. Control Air-Conditioning Technol. 4, 15–20 (2005)
W. Deng, The synthetic control measures and strategies for preventing the transmission and infection of SARS in hospitals. Tongji University (2005)
Z. Xu, Y. Zhang, Q. Wang, F. Wen, H. Liu, L. Zhao, X. Feng, Y. Zhang, R. Wang, W. Niu, Y. Di, X. Yu, X. Yi, Y. Ou, W. Lu, Study on isolation effects of isolation wards (1). J. HV&AC 36(3), 1–9 (2006)
X. Feng, Z. Xu, Y. Zhang, Q. Wang, H. Liu, F. Wen, X. Yu, L. Zhao, R. Wang, Y. Zhang, W. Niu, X. Yi, Y. Ou, W. Lu, Analyses of numerical simulation and the effect on air distribution of negative pressure isolation rooms. Build. Sci. 22(1), 35–41+45 (2006)
J. Shen, Multi-application isolation ward and its air conditioning technique without condensed water. Build. Energy Environ. 24(3), 22–26 (2005)
X. Tang, J. Shen, W. Deng, C. Li, Effects of supply-air outlet on unidirectional air distribution in contagious isolation wards. Build. Energy Environ. 24(4), 11–18 (2004)
Author information
Authors and Affiliations
Corresponding author
Rights and permissions
Copyright information
© 2017 Springer Nature Singapore Pte Ltd.
About this chapter
Cite this chapter
Xu, Z., Zhou, B. (2017). Air Distribution Design in Negative Pressure Isolation Ward. In: Dynamic Isolation Technologies in Negative Pressure Isolation Wards. Springer, Singapore. https://doi.org/10.1007/978-981-10-2923-3_4
Download citation
DOI: https://doi.org/10.1007/978-981-10-2923-3_4
Published:
Publisher Name: Springer, Singapore
Print ISBN: 978-981-10-2922-6
Online ISBN: 978-981-10-2923-3
eBook Packages: EngineeringEngineering (R0)