
Abstract
Radiocesium (Cs) contamination histories of the Japanese flounder, Paralichthys olivaceus, after the 2011 Fukushima Nuclear Power Plant (FNPP) accident were examined by analysis of the spatiotemporal changes in observed Cs concentrations, by comparison of the dynamics of the Cs concentrations in several year-classes of fish, and by simulation studies. Two contamination histories were revealed: (1) severe contamination by water that was directly released from the FNPP with extremely high Cs concentrations for a few months after the accident, which had a highly variable spatial distribution; and (2) long-duration contamination at relatively low concentrations resulting from consumption of contaminated food. These two histories were supported by three observations. First, high Cs concentrations with high variability were observed in the first year after the accident. Second, the highest values of the minimum Cs concentrations were observed in the autumn of 2011. Third, Cs concentrations were lower with smaller variation for fish from the 2011 year-class and younger, which were not exposed to the highly contaminated directly released water, than for fish from the 2010 year-class and older. Simulation studies also indicated that the Cs concentrations in some individuals that were exposed to the directly released water might not be in an equilibrium state even at 3 years after the accident. On the basis of these contamination histories, it can be expected that the Cs concentrations in most Japanese flounder will continue to decrease.
You have full access to this open access chapter, Download chapter PDF
Keywords
- Radiocesium
- Contamination history
- Paralichthys olivaceus
- Simulation
- Fukushima Nuclear Power Plant
- Directly released water
- Food
- Year-class
- Equilibrium
1 Introduction
The marine environment and animals living in it have been severely contaminated by radionuclides, including radiocesium (Cs; 134Cs + 137Cs), released from the Fukushima Nuclear Power Plant (FNPP) after the accident on 11 March 2011. The Japanese provisional regulatory limit for Cs in fish products was set at 500 Bq/kg-wet starting immediately after the accident and was enforced until March 2012; a limit of 100 Bq/kg-wet has been enforced since April 2012. After the accident, the landing of many commercially important fish species in Fukushima and neighboring prefectures was legally banned or voluntarily suspended, and the landing of many species in Fukushima Prefecture is still banned (Wada et al. 2013).
Marine fish take up Cs from seawater and food. The rate of intake is related to the Cs concentrations in seawater and food sources. Excretion from the body is related to the Cs concentration in the fish body. It has been suggested that the impact of contamination resulting from the FNPP accident has been temporally and spatially heterogeneous (Tateda et al. 2013; Wada et al. 2013). Marine animals are likely to have been severely contaminated for a few months after the accident, as a consequence of the direct release from the FNPP of massive amounts of water with extremely high Cs concentrations between 26 March and the end of April 2011 and the subsequent consumption of contaminated food (Tsumune et al. 2012; Tateda et al. 2013). The Cs concentrations were higher in the coastal waters south of the FNPP (Wada et al. 2013). An understanding of the contamination histories that produced the observed temporal changes and spatial variation in the intensity of contamination will facilitate prediction of the dynamics of Cs concentrations in fish and will guide decisions regarding the appropriate time to restart fishing operations.
The Japanese flounder Paralichthys olivaceus, the studied fish species in this chapter, is a bottom fish inhabiting coastal waters at depths of 150 m or less. They are given birth in summer (June–August). These fish reach 250–300 mm in total length (TL) during their first year, during which time most of them inhabit sandy coasts at depths of less than 20 m and feed on mysids and larval fish. After their first year, they move to deeper waters and feed exclusively on two bait fish, the Japanese anchovy Engraulis japonicus and the Japanese sand lance Ammodytes personatus (Tomiyama and Kurita 2011). The Japanese flounder is an end-member of the pelagic food chain (from phytoplankton through zooplankton and bait fish to fish feeder). They reach TLs of approximately 400 mm at 2 years and 500 mm at 3 years (Yoneda et al. 2007). The flounder inhabiting the waters off Miyagi, Fukushima, and Ibaraki Prefectures (an area that extends 110 km to the north and 200 km to the south of the FNPP; Fig. 11.1) are considered to be a subpopulation (Kurita et al. 2014), although movement within this area is somewhat limited (Kurita et al., unpublished data).

(a) Locations of areas I–VII and the Fukushima Nuclear Power Plant (FNPP, star) and (b–h) temporal changes in the concentrations of Cs (134Cs + 137Cs; Bq/kg-wet) in the muscle of the Japanese flounder Paralichthys olivaceus collected in the seven areas. Cs concentrations (circles) were measured by local governments and published by the Fisheries Agency of the Ministry of Agriculture, Forestry and Fisheries of Japan. Open circles indicate Cs concentrations that were less than the detection limit; in these cases, the plotted values correspond to the detection limit. In (e–g), arrows show the peaks in the lowest observed concentration in areas IV–VI, respectively. Cs concentrations of 1,610 Bq/kg-wet at 187 days after the FNPP accident (14 September 2011) in area IV (e) and 4,500 Bq/kg-wet at 250 days (16 November 2011) in area V (f) were omitted. Note that the y-axis scales in e and f differ from those of the other parts
In this chapter, we examine the temporal changes and spatial variation of Cs concentrations in Japanese flounder in detail and suggest contamination histories that would produce the observed variation. First, we analyzed Cs concentration data collected by local governments and published by the Fisheries Agency of the Ministry of Agriculture, Forestry and Fisheries (2014) to gain a rough understanding of the temporal changes and spatial variation of Cs concentrations (Sect. 11.2). We then investigated temporal changes in Cs concentrations among different year-classes of the flounder, specifically year-classes born before and after the accident, to understand temporal changes in the intensity of contamination (Sect. 11.3). Finally, we simulated the temporal changes in Cs concentration in an effort to understand how the observed Cs contamination distribution was produced (Sect. 11.4).
2 Spatiotemporal Distribution of Cs Concentrations in Japanese Flounder
For our analysis, we used Cs concentrations in the flounder monitored by local governments (Fisheries Agency 2014) in the region from 35°45′N to 40°25′N, which was subdivided into seven areas (Fig. 11.1). The sizes and ages of the flounder were not recorded, but almost all the data are expected to be from fish with a TL greater than 300 mm (corresponding to a minimum age of 1–1.5 years; Yoneda et al. 2007), which is the landing size limit for this flounder. The sample sizes for the data points in the figure are not known for certain, but most of the data points represent concentrations from more than three individuals, except in the areas immediately to the north and south of Fukushima Prefecture (areas IV and V; Fig. 11.1e, f); in these areas, most of the data points collected after October 2011 are for individuals.
Examination of the observed concentration data revealed the following features:
-
The Cs concentrations clearly differed among the areas (Fig. 11.1). In the far north (areas I and II) and the far south (area VII) from FNPP, the concentrations were low; only 1.1 % of the data exceeded 50 Bq/kg-wet. In contrast, 41.0 % of the data in the area around the FNPP (areas IV and V) exceeded 50 Bq/kg-wet. The average Cs concentrations in the seven areas during the period between 200 and 600 days after the accident decreased in the order V > IV > III = VI > I = II = VII.
-
The Cs concentrations were highly variable among individuals (or individual data points) within each area (Fig. 11.1). Some extremely high concentrations were observed, especially during the first year after the accident; for example, concentrations of 1,610 and 4,500 Bq/kg-wet, respectively, were observed on 14 September 2011 (187 days after the accident) in area IV and on 16 November 2011 (250 days) in area V (these two values were omitted in Fig. 11.1). The maximum:minimum ratio during October 2011 and March 2012 in area V was 375 (=4,500/12).
-
The dynamic patterns of the higher and lower concentrations differed from each other, especially in area VI (Fig. 11.2). Specifically, examination of the temporal changes in the concentration percentiles in area VI for six consecutive 6-month periods starting in April 2011 revealed that the upper concentration percentiles (75 %, 90 %, and 95 %) decreased steadily during the observed periods, and the lower percentiles (5 %, 10 %, 25 %, and 50 %) increased from April–September 2011 to October 2011–March 2012 and then decreased steadily.
Fig. 11.2 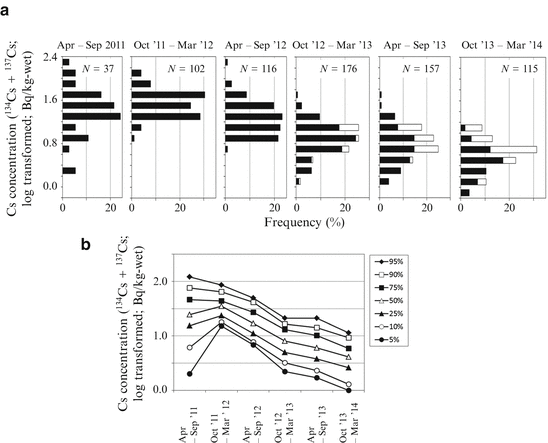
Temporal changes in the (a) frequency distribution and (b) percentiles of the concentrations of Cs (134Cs + 137Cs; Bq/kg-wet) in Japanese flounder Paralichthys olivaceus from area VI, April 2011–March 2014. Open bars in a indicate individuals with concentrations below the detection limit; the value of detection limit was used as the Cs concentration for these individuals. The concentrations of detection limits differ among monitored data. N number of samples for each period
-
The lowest observed concentrations increased slightly in areas IV, V, and VI (Fig. 11.1); specifically, the lowest observed concentrations peaked at around 200 days after the accident (September–October 2011; arrows in Fig. 11.1e–g) and then decreased. The peak values of the lowest observed concentrations were approximately 80, 80, and 30 Bq/kg-wet in areas IV, V, and VI, respectively. Although these peak values were clearly lower than the values of the higher percentiles, they were still higher than the concentrations before the accident (137Cs, 0.11–0.50 Bq/kg-wet during the period from 1984 to 1995; Kasamatsu and Ishikawa 1997).

These features, along with the results of previous studies of Cs contamination in the environment and in animals (Tsumune et al. 2012; Tateda et al. 2013; Wada et al. 2013), suggest two contamination histories for Japanese flounder. In the first, water released directly from the FNPP, which had extremely high Cs concentrations, contaminated the fish during a short period, probably from March to April 2011 (Tsumune et al. 2012). The spatial variation of the contamination intensity was high; some fish were severely contaminated, whereas others were only slightly contaminated. Second, consumption of bait fish contaminated with relatively low concentrations of Cs led to longer-duration contamination compared to that caused by the directly released water. All flounder can be expected to take up Cs from their food, which indicates that the variation in Cs concentration among individual flounders resulting from Cs in food was smaller than the variation from the Cs in the directly released water.
The first contamination history is supported by the large variation in Cs concentrations, even in the same area, and the occurrence of individuals with extremely high Cs concentrations in 2011 (Figs. 11.1 and 11.2). These individuals apparently were contaminated shortly after the accident, and the amount of additional contamination after that seems to have been relatively low. This history is also supported by the coincidence of the spatial variation of the Cs concentrations in fish bodies and the path of the extremely contaminated water released from the FNPP between 26 March and the end of April 2011; the high Cs concentrations in fish (Wada et al. 2013) and the path of the directly released water (Tsumune et al. 2012) were distributed along the coast to the south of the FNPP.
The second history is supported by the dynamics of the lower Cs concentrations, specifically the temporary increase in the lower percentiles in area VI and the peaking of the lowest concentrations at around 200 days after the accident in areas IV, V, and VI. These features indicate that all the fish were contaminated through the food web because the highly contaminated water was present in the study areas much earlier than the 200th day after the accident (Tsumune et al. 2012) and the contaminated water cannot explain the delayed peak (see also Sect. 11.4).
We validated these histories by comparison of the Cs concentrations in fish from different year-classes, that is, fish born before and after the accident (Sect. 11.3), and by conducting model simulations (Sect. 11.4).
3 Difference in Cs Concentrations Among Year-Classes Born Before and After the Accident
On the basis of the contamination histories described in the preceding section, we hypothesized that some of the individuals in the 2010 year-class and older would be heavily contaminated by the directly released water and that, in contrast, all the members of the 2011 year-class and younger would be less contaminated because the latter group of fish has not been exposed to the directly released water, and their main source of Cs contamination would have been their food, which contained Cs at much lower concentrations than the directly released water.
To validate this hypothesis, we compared the Cs concentrations among year-classes during the period from 250 to 950 days after the accident. Fish were collected in Sendai Bay (area III). Total length was measured, age was validated by otolith analysis (Yoneda et al. 2007), and Cs concentrations in the muscle of individual fish were measured individually. The muscle tissue specimens were packed tightly into plastic cylindrical containers, and specific gamma rays emitted from 134Cs (605 and 796 keV) and 137Cs (662 keV) were measured with a high-purity germanium semiconductor detector (ORTEC; GEM30-70-LB-C, 1.85 KeV/1.33 MeV resolution) with a multichannel analyzer. The concentrations of 134Cs and 137Cs were corrected back to the date of sampling for physical decay.
As expected, the Cs concentrations in the fish from the 2009 and 2010 year-classes varied widely, from 4.8 to 100.2 (0.68–2.00, log transformed) and from 1.3 to 118.8 (0.11–2.07, log transformed) Bq/kg-wet, respectively (Fig. 11.3). There were some sporadic outliers (that is, fish with Cs concentrations outside the values predicted by linear regression ± 2 SD). Except for these outliers, the Cs concentrations of each 2009 and 2010 year-class showed a decreasing tendency. In contrast, the Cs concentrations in the fish from the 2011 and 2012 year-classes were less than 10 (1.0 log transformed) Bq/kg-wet, and there were no outliers (that is, concentrations more than 2 SD from the mean). The Cs concentrations in fish from these year-classes between 644 and 841 days after the accident decreased in the order 2009 > 2010 > 2011 = 2012 year-class (Steel–Dwass test; p < 0.05).

Temporal changes in the concentrations of Cs (134Cs + 137Cs; Bq/kg-wet) in four year-classes of individual Japanese flounder Paralichthys olivaceus collected in area III (Sendai Bay). Regression lines for each year-class (yc) excluding outliers (see text) are shown; p < 0.01 for solid lines [2009 yc (thin line) and 2010 yc (bold line)] and p > 0.05 for broken lines [2011 yc (thin line) and 2012 yc (bold line)]
Differences in Cs concentrations among the year-classes were likely the result of differing exposures to the highly contaminated environment during the first few months after the accident at the different ages (Fig. 11.4a). Japanese flounder switch from eating mysids during the first year of life to eating bait fish as they age. Therefore, fish from the 2009 year-class experienced the accident when they were 1 year and 9 months old, at which point they were feeding on bait fish. Fish in the 2010 year-class were only 9 months old at the time of the accident, and most of them were inhabiting shallow areas (<20 m deep) and feeding on mysids until summer 2011, at which point they shifted to feeding on bait fish. Fish in the 2011 year-class were not born until 4 months after the accident.

Comparison of the concentrations of Cs (134Cs + 137Cs; Bq/kg-wet) in three year-classes of individual Japanese flounder Paralichthys olivaceus. (a) Scheme showing the birth time of each year class (yc), the date of the FNPP accident, and the period during which the fish were collected (644–841 days after the accident; black bars). Japanese flounder feed on mysids during their first year (gray bars) and then on bait fish (open and black bars). (b) Relationship between Cs concentration and total length of individual Japanese flounder by year-class
The Cs concentrations in fish caught during the period from December 2012 to June 2013 (644–841 days after the accident) from different year-classes are plotted against TL in Fig. 11.4b; the plot shows clear differences between the 2010 and 2011 year-classes, even in the same size range (344–420 mm TL; U test, p < 0.01). The major difference was that fish in the 2011 year-class were not exposed to the directly released water during March–April 2011 and thus were not heavily contaminated. Differences between the 2010 and 2009 year-classes were also observed within the overlapping size range (420–628 mm TL; U test, p < 0.01). Differences in habitat and growth rate after the accident are the likely causes of these differences.
4 Simulation
In the preceding sections, we described two possible contamination histories: short-duration extremely severe contamination caused by directly released water containing extremely high Cs concentrations, and long-duration relatively low-level contamination via the food chain. In this section, these two histories are tested by simulations.
Marine fish take up Cs both from seawater and from food in amounts that are proportional to the Cs concentrations in the seawater and food, respectively. In addition, the amount of Cs excreted from the body of a fish is proportional to the Cs concentration in the body. Therefore, the change in the Cs concentration in the body of a fish can be described by the following equation:
where C b, C w, and C f indicate the Cs concentrations (Bq/kg-wet) in fish muscle (as a proxy for the whole-body concentration), seawater, and food, respectively. The coefficients a, b, and c designate the constant rates (day−1) of intake and excretion. For simplicity’s sake, we ignored the effects of fish growth (Ugedal et al. 1995, 1997) and water temperature (Rowan and Rasmussen 1995), as well as the effect of physical radioactive decay. Coefficients b and c are given by the following equations:
where DR, AR, and BHL are daily food ration (kg food/kg body), the proportion of Cs in food absorbed by the gastrointestinal tract, and the biological half-life of the flounder (days), respectively.
In the simulation, we used the following seawater Cs concentrations (Fig. 11.5a): high Cs concentration (seawater A), moderate Cs concentration (seawater B), and Cs concentration of zero (seawater C) during the first 100 days after the accident and a moderate Cs concentration after the first 100 days that is common to all seawaters. The high Cs concentration for the initial 100 days was taken from the coastal monitoring data off Iwasawa, which is 16 km south of the FNPP (Tsumune et al. 2012; TEPCO 2014). As a proxy for moderately contaminated water, we used a value that was 1/10 of the high concentration (see Fig. 3 in Tateda et al. 2013). For the Cs concentrations in food consumed by fish ≥1 year old for six 6-month periods from March 2011 to February 2014, we used values of 80, 40, 10, 5, 2, and 1 Bq/kg-wet, which were based on monitoring data for Japanese sand lance and Japanese anchovy (bait fish) in the coastal waters off northern Fukushima Prefecture (northern half of area IV) (Fisheries Agency 2014) (Fig. 11.5b). For fish younger than 1 year old, we used food concentrations of 40, 20, 10, 5, 2, and 1 Bq/kg-wet for the same 6-month periods; these values were based on data for mysids in the same area (Sohtome et al. 2014). Fish in the 2009 year-class fed on bait fish throughout the simulation period; the fish in the 2010 year-class fed on mysids from March to August 2011 and then shifted to bait fish; and fish in the 2011 and 2012 year-classes fed on mysids during their first 12 months (Fig. 11.4). The coefficient for Cs intake from seawater (a) was set at 0.1 (approximately equal to the value of 0.11 reported by Tateda et al. 2013). DR and AR were set at 0.02 (Kurita et al., unpublished data) and 0.6 (between the value of 0.5 reported by Tateda et al. 2013 and the value of 0.78 reported by Kasamatsu et al. 2001), respectively. BHL was set at 104 days so that the saturated Cs concentration in the fish body was twice the Cs concentration in the food, which was the observed relationship between the concentrations in fish body and food in the equilibrium state before the accident (Kasamatsu and Ishikawa 1997).

Simulation of the temporal changes in the concentrations of Cs (134Cs + 137Cs; Bq/kg-wet) in Japanese flounder Paralichthys olivaceus with different contamination histories and from different year-classes. Temporal changes in Cs concentrations in seawater A and B (a) and in food (bait fish and mysids) (b). (c) Temporal changes in simulated Cs concentrations for fish in the 2009, 2010, 2011, and 2012 year-classes. Also shown are Cs concentrations in fish in the 2009 year-class (yc) that took up Cs from seawater A and food (A + F), seawater B and food (B + F), and seawater C and food (C + F). Ratios of Cs sources (food/total) are shown for the 2009 yc that took up Cs from seawater A and food (A + F) (d) and from seawater B and food (B + F) (e), and for the 2010 (f), 2011 (g), and 2012 (h) year-classes
In the simulations, we focused on three issues: variation of the Cs concentrations among individuals, the influence of the contamination history during the initial 100 days, and differences in Cs concentrations among the year-classes.
First, the effect of Cs concentration in the seawater was evaluated (Fig. 11.5c–e). The Cs concentrations in the fish body were simulated for fish in the 2009 year-class, which fed on bait fish and were exposed to seawater categories A, B, or C. Differences in the Cs intake levels from seawater during the initial 100 days after the accident produced large variations in the maximum Cs concentrations (Fig. 11.5c): 109 Bq/kg-wet (2.04 log transformed; sources of Cs were seawater C + food), 286 Bq/kg-wet (2.46 log transformed; seawater B + food), and 2,504 Bq/kg-wet (3.40 log transformed; seawater A + food). For fish that were exposed to directly released water (seawater A or B), the body Cs concentration peaked shortly after the accident, at 43 days (23 April 2011) and at 50 days (30 April 2011) for seawaters A and B, respectively, and then decreased rapidly. Even if fish did not take up Cs from seawater during the initial 100 days (seawater C), the body Cs concentration increased to 109 Bq/kg-wet at 184 days (11 September 2011), which corresponds to the peak period of the lowest observed concentrations (as described in Sect. 11.2). High individual variation and a gradual increase in the lowest concentrations until September were observed in the monitored data (Figs. 11.1 and 11.2). Contamination from seawater A was greater than contamination from food during the first 100 days after the accident and from seawater B during the first 50 days after the accident (Fig. 11.5d, e). The actual observed maximum value, 4,500 Bq/kg-wet, was comparable to the value obtained from the simulation.
Second, different exposures to contaminated seawater during the initial 100 days after the accident influenced the Cs concentration in the fish body for a long time after the accident. Specifically, the Cs concentrations in the bodies of fish that were exposed to seawaters A, B, and C for the initial 100 days (until the middle of June 2011) were 47.6, 21.5, and 18.6 Bq/kg-wet, respectively, at 2 years after the accident and 6.5, 4.2, and 4.0, respectively, at 3 years after the accident (Fig. 11.5c). These results indicate that the Cs concentrations in fish exposed to the directly released seawater, especially seawater A, have not been in the equilibrium state for more than 3 years.
Third, differences between year-classes were evaluated (Fig. 11.5c, f–h). Cs concentrations in fish bodies were simulated for the 2010, 2011, and 2012 year-classes on the assumption that the fish fed on prey and were exposed to seawater B. Fish in the 2010 year-class (purple line), which fed on mysids for the first 4 months after the accident and then shifted to bait fish, showed a temporal variation in Cs concentration that was similar to that for the 2009 year-class (dark blue line). In contrast, the Cs concentrations in the 2011 year-class (yellow line) and 2012 year-class (light blue line) were clearly lower than those in the older fish. The maximum values were 32 (1.51 log transformed) and 8 (0.90 log transformed) Bq/kg-wet for the 2011 and 2012 year-class, respectively, and peak concentrations occurred at 254 days old for both year-classes. Food was the greatest source of Cs for the 2011 and 2012 year-classes throughout their lives (Fig. 11.5g, h), which indicates less individual variation than in the older fish that were exposed to directly released water. The observed data for the year-classes (Fig. 11.3) were in agreement with the simulated results; that is, lower concentrations and less variability were observed for the 2011 and 2012 year-classes than for the older year-classes.
The observed features were reproduced by the simulations under the condition of the two possible contamination histories: fish were contaminated both by exposure to directly released seawater containing extremely high Cs concentrations, that showed high spatial variability and drastically decreased after May 2011, and by exposure via food, in which the Cs concentration was much lower than that in seawater and decreased slowly. The values of additional parameters should be evaluated in future quantitative studies. In particular, the effects of fish size and water temperature, as well as the effects of growth on the accumulation or dilution of Cs (growth accumulation/dilution), are critical because Japanese flounder grow fast and inhabit water with a wide range of temperatures.
5 Conclusions
Observed Cs concentration data showed high variation among individual fish, peaks in the lowest concentrations in autumn 2011 for the 2010 year-class and older fish, and lower concentrations with less variation for the 2011 year-class and younger fish. We suggest two major Cs contamination histories. The first involved contamination by directly released highly contaminated water during March and April in 2011. The Cs concentrations in this water showed high spatial variability, and the effects of seawater decreased drastically after the first few months following the FNPP accident. The other history involved contamination from food: mysids for fish younger than 1 year and bait fish for older fish. The maximum Cs concentrations in food were very low compared to those in the directly released water and decreased slowly. The existence of these two contamination histories was supported by simulation studies. These histories seem to be common to many other fish species (Tateda et al. 2013; Wada et al. 2013; Narimatsu et al. 2014).
The observation of major effects resulting from directly released seawater during the initial few months after the accident is characteristic of the FNPP accident. Most fish that showed high Cs concentrations in 2012 and later were likely to have taken up Cs in the initial few months after the accident but are currently taking up little Cs from food and are excreting Cs continuously. Therefore, it is important to recognize that the observed high Cs concentrations in some individuals may not have reached an equilibrium state, and the Cs concentrations in these individuals do not necessarily indicate the current intensity of contamination from the environment, but rather reflect contamination during the first few months after the accident.
On the basis of the proposed histories of contamination, the intensity of contamination should be low after the first few months following the accident. Even old fish that were exposed to the directly released water currently show low Cs concentrations, below the regulatory value for fish products, 100 Bq/kg-wet. In addition, the abundance of fish in the 2010 year-class and older is decreasing as these fish age and die. Therefore, the Cs concentrations in most fish will continue to decrease to less than 20 Bq/kg-wet, which is the present concentration (as of March 2014) in most of the 2010 year-class and older fish and all of the 2012 year-class and younger fish. The only potential problem is that individuals inhabiting the port in front of the FNPP still show higher Cs concentrations than those of fish inhabiting outside the port (Shigenobu et al. 2014; TEPCO 2014), which indicates that intense contamination is still occurring in the port, although the number of these fish is negligible relative to the overall stock in this area.
References
Fisheries Agency, Ministry of Agriculture, Forestry and Fisheries (2014) Results of the inspection on radioactivity materials in fisheries products. http://www.jfa.maff.go.jp/e/inspection/index.html. Accessed on 31 May 2014
Kasamatsu F, Ishikawa Y (1997) Natural variation of radionuclide 137Cs concentration in marine organisms with special reference to the effect of food habits and trophic level. Mar Ecol Prog Ser 160:109–120
Kasamatsu F, Nakamura M, Nakamura R, Suzuki Y, Kitagawa D (2001) Estimation of daily feeding rate of Japanese flounder Paralichthys olivaceus taken off Pacific coast of Aomori Prefecture by a radioisotope method. Nippon Suisan Gakkaishi 67:500–502
Kurita Y, Tamate T, Ito M (2014) Stock assessment and evaluation for Japanese flounder, north Pacific stock (fiscal year 2013). In: Marine fisheries stock assessment and evaluation for Japanese waters (fiscal year 2013/2014). Fisheries Agency and Fisheries Research Agency of Japan, Tokyo, pp 1373–1398 (in Japanese)
Narimatsu Y, Sohtome T, Yamada M, Shigenobu Y, Kurita Y, Hattori T, Inagawa R (2014) Why do the radionuclide concentrations of Pacific cod depend on the body size? In: Nakata K, Sugisaki H (eds) Impact of the Fukushima nuclear accident on fish and fishing grounds. Springer, Berlin (chapter 10 in this volume)
Rowan DJ, Rasmussen JB (1995) Bioaccumulation of radiocesium by fish: the influence of physicochemical factors and trophic structure. Can J Fish Aquat Sci 51:2388–2410
Shigenobu Y, Fujimoto K, Ambe D, Kaeriyama H, Ono T, Morinaga K, Nakata K, Morita T, Watanabe T (2014) Radiocesium contamination of greenlings (Hexagrammos otakii) off the coast of Fukushima. Sci Rep 4:6851
Sohtome T, Wada T, Mizuno T, Nemoto Y, Igarashi S, Nishimune A, Aono T, Ito Y, Kanda J, Ishimaru T (2014) Radiological impact of TEPCO’s Fukushima Dai-ichi Nuclear Power Plant accident on invertebrates in the coastal benthic food web. J Environ Radioact 138:106–115
Tateda Y, Tsumune D, Tsubono T (2013) Simulation of radioactive cesium transfer in the southern Fukushima coastal biota using a dynamic food chain transfer model. J Environ Radioact 124:1–12
TEPCO (2014) Monitoring by sampling. http://www.tepco.co.jp/en/nu/fukushima-np/f1/smp/index-e.html. Accessed on 30 May 2014
Tomiyama T, Kurita Y (2011) Seasonal and spatial variations in prey utilization and condition of a piscivorous flatfish Paralichthys olivaceus. Aquat Biol 11:279–288
Tsumune D, Tsubono T, Aoyama M, Hirose K (2012) Distribution of oceanic 137Cs from the Fukushima Dai-ichi Nuclear Power Plant simulated numerically by a regional ocean model. J Environ Radioact 111:100–108
Ugedal O, Forseth T, Jonsson B, Njåstad O (1995) Sources of variation in radiocaesium levels between individual fish from a Chernobyl contaminated Norwegian lake. J Appl Ecol 32:352–361
Ugedal O, Forseth T, Jonsson B (1997) A functional model of radiocesium turnover in brown trout. Ecol Appl 7:1002–1016
Wada T, Nemoto Y, Shimamura S, Fujita T, Mizuno T, Sohtaome T, Kamiayama K, Morita T, Igarashi S (2013) Effects of the nuclear disaster on marine products in Fukushima. J Environ Radioact 124:246–254
Yoneda M, Kurita Y, Kitagawa D, Ito M, Tomiyama T, Goto T, Takahashi K (2007) Age validation and growth variability of Japanese flounder Paralichthys olivaceus off the Pacific coast of northern Japan. Fish Sci 73:585–592
Acknowledgments
We are grateful to Kaoru Nakata and Adriaan Rijnsdorp for their valuable comments on an earlier version of this manuscript. We also thank Takami Morita, Yoji Narimatsu, Takuji Mizuno, and Tadahiro Sohtome for discussions and useful information. Thanks are also due to Hiroyuki Togashi, Yukinori Nakane, Yosuke Amano, and Tsuyoshi Tamate for their assistance in sampling fish and discussions. The crew of the R/V Wakataka-maru and the fishing vessels Seiko-maru and Daiei-maru are appreciated for assistance with fish sampling.Open Access This chapter is distributed under the terms of the Creative Commons Attribution Noncommercial License, which permits any noncommercial use, distribution, and reproduction in any medium, provided the original author(s) and source are credited.
Author information
Authors and Affiliations
Corresponding author
Editor information
Editors and Affiliations
Rights and permissions
Open Access This chapter is distributed under the terms of the Creative Commons Attribution Noncommercial License, which permits any noncommercial use, distribution, and reproduction in any medium, provided the original author(s) and source are credited.
Copyright information
© 2015 The Author(s)
About this chapter
Cite this chapter
Kurita, Y., Shigenobu, Y., Sakuma, T., Ito, Si. (2015). Radiocesium Contamination Histories of Japanese Flounder (Paralichthys olivaceus) After the 2011 Fukushima Nuclear Power Plant Accident. In: Nakata, K., Sugisaki, H. (eds) Impacts of the Fukushima Nuclear Accident on Fish and Fishing Grounds. Springer, Tokyo. https://doi.org/10.1007/978-4-431-55537-7_11
Download citation
DOI: https://doi.org/10.1007/978-4-431-55537-7_11
Publisher Name: Springer, Tokyo
Print ISBN: 978-4-431-55536-0
Online ISBN: 978-4-431-55537-7
eBook Packages: Biomedical and Life SciencesBiomedical and Life Sciences (R0)