
Abstract
This chapter investigates whether the level of happiness and integrated process of changes in happiness are the same. Using the daily data of two waves of 4 and 6 months each, we found that the level of happiness is stationary, whereas the integrated process of changes is non-stationary with a rising trend, implying that they are different series. An examination of the causes of the difference indicated that although adaptation completely influences the level of happiness, it only partially influences the change in happiness. This may be because the latter is based on a comparison between today and yesterday,
The original article first appeared in the Japanese Economic Review 63(1): 38–56, 2012. A newly written addendum has been added to this book chapter.
Access this chapter
Tax calculation will be finalised at checkout
Purchases are for personal use only
Notes
- 1.
Stevenson and Wolfers (2008) questioned the existence of the paradox in Japan and the EU.
- 2.
- 3.
We asked six questions on various elements, including personal and macro news, that may affect happiness in the survey, which are explained in Sect. 2.
- 4.
Regarding developments in the measurement of subjective happiness, refer to Kahneman and Krueger (2006).
- 5.
We also asked questions including valuations of personal and macro news (how good or bad they were) arriving on that day, as explained below.
- 6.
Most younger residents of Japan carry mobile phones that have the capability of connecting to the Internet and sending emails.
- 7.
The first wave started in 1 November 2006. However, the survey did not include a question on changes in happiness until December 2007.
- 8.
The second phase was initially planned to conclude at the end of March; however, it was extended until the end of June. This is the reason why the number of respondents decreased substantially. In fact, the number of respondents decreased from 47 in March to 41 in April.
- 9.
Questions 2, 3, 4, 6, and 8 are not used in this chapter; therefore, we have omitted their explanation.
- 10.
Since Osaka University has 26 school days from 1 January to 31 March (there is a spring vacation in February and March), this number implies that respondents attended most of the school days and responded to the questionnaire. In 2009-survey, the mean of NOCLASS is 0.58, implying that they attended classes for approximately 76 days out of the 81 school days from January to June. However, “Class” in the question includes experiments at laboratories in natural science and technology departments, which are conducted on days when school is not in session. Therefore, the above assessment is crude.
- 11.
In the web survey, respondents were also requested to report their hourly happiness on one day of their choice each month. We call this the hourly survey. The hourly survey essentially follows an experience sampling method (Csikszentmihalyi and Hunter 2003; Scollon et~al. 2003), which is better than the day reconstruction method by Kahneman et~al. (2004a, b), wherein respondents answer questions in real time, so that the responses are immune to memory biases. We do not explain the hourly survey in detail because we do not use the results in this chapter.
- 12.
Alternatively, we can first average CHANGE over respondents each day and then construct an integrated process of these averages. INTEG constructed in this way is smoother than that in Fig. 17.2, and it does not show an increase in volatility. This is because averaging CHANGE over respondents makes the variance much smaller (i.e., the variance is denominated by the number of respondents). However, it increases with time as in Fig. 17.2, so that the essential conclusions are unaltered. See footnote 14.
Fig. 17.2 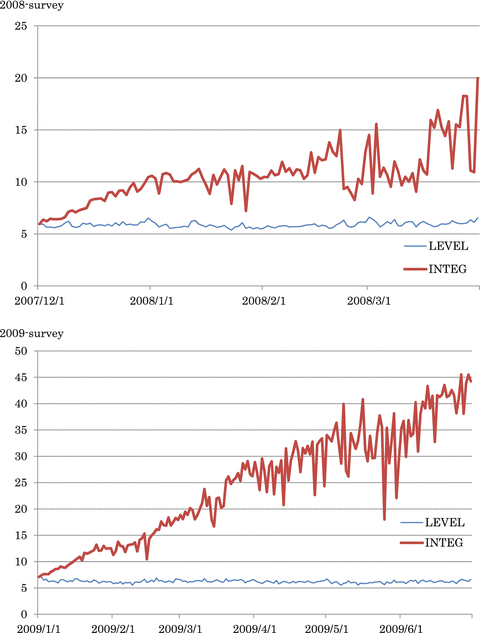
LEVEL and INTEG
- 13.
Comparing INTEG of the two phases, we found that the one in the 2009-survey grows more rapidly: in the 2008-survey, it reaches 20 in 4 months, whereas in the 2009-survey it reaches 40 in 6 months.
- 14.
This is because the disturbance term of the integrated process of an individual increases in proportion with time; therefore, its variance increases in the quadratic function of time.
- 15.
The number of lags of the lagged difference terms of the ADF test is selected according to Akaike information criterion (AIC) for each regression. The number of lags truncation in the KPSS tests is set at 12.
- 16.
Here, r is chosen arbitrarily.
- 17.
- 18.
We also depict the case of U = 7.5, L = 5.5, and r = 0.02. The graph is extended more; however, it does not show an increasing trend.
- 19.
In the figure, latent happiness is multiplied by 10 because the variation is too small to be observed otherwise.
- 20.
We selected the model based on the Hausman test.
- 21.
Kimball and Willis (2006) theoretically examined the relationship between them. Many economists think that comparison of subjective happiness among individuals lacks a solid basis, whereas researchers in the field of economics of happiness estimate the happiness function using data on subjective happiness.
- 22.
To be precise, “4. Do not know” is included in the options. In 2008 and 2009, the comparison is made with “a year ago” instead of “a few years ago.”
- 23.
Here, “consumption of household” is normalized so that the value of the first year equals 6.38, that is, the value of LEVEL in that year.
- 24.
When we use GDP instead of consumption of household, its coefficient is −0.49 with LEVEL and 0.40 with INTEG.
- 25.
Stevenson and Wolfers (2008) derived the same conclusion based on several other surveys. However, Di Tella and MacCulloch (2010) still support the view that once basic needs have been satisfied, there is full adaptation to further economic growth, although that process may take a long period of time. Thus, the controversy is not settled yet.

References
Bruni L, Porta PL (2005) Economics and happiness: framing the analysis. Oxford University Press, New York
Choi I (2001) Unit root tests for panel data. J Int Money Financ 20(2):249–272
Clark AE, Oswald AJ (1996) Satisfaction and comparison income. J Public Econ 61(3):359–381
Clark AE, Frijters P, Shields MA (2008) Relative income, happiness, and utility: an explanation for the Easterlin paradox and other puzzles. J Econ Lit 46(1):95–144
Csikszentmihalyi M, Hunter J (2003) Happiness in everyday life: the uses of experience sampling. J Happiness Stud 4:185–199
Deaton A (2008) Income, health, and well-being around the world: evidence from the Gallup World Poll. J Econ Perspect 22(2):53–72
Di Tella R, MacCulloch R (2010) Happiness adaptation to income beyond “basic needs”. In: Diener E, Helliwell J, Kahnemann D (eds) International differences in well-being. Oxford University Press, Oxford, pp 217–246, Chapter 8
Di Tella R, Haisken-DeNew J, MacCulloch RJ (2007) Happiness adaptation to income and to status in an individual panel, NBER working paper, no. 13159
Dickey DA, Fuller WA (1979) Distribution of the estimators for autoregressive time series with a unit root. J Am Stat Assoc 74(366):427–431
Dolan P, Peasgood T, White M (2008) Do we really know what makes us happy? A review of the economic literature on the factors associated with subjective well-being. J Econ Psychol 29(1):94–122
Duesenberry JS (1949) Income, savings, and the theory of consumer behaviour. Harvard University Press, Cambridge
Easterlin RA (1974) Does economic growth improve the human lot? Some empirical evidence. In: David PA, Reder MW (eds) Nations and households in economic growth: essays in Honor of Moses Abramowitz. Academic, New York, pp 89–125
Easterlin RA (2005) Building a better theory of well-being. In: Bruni L, Porta PL (eds) Economics and happiness. Oxford University Press, Oxford, pp 29–64
Frank RH (2005) Does absolute income matter? In: Bruni L, Porta PL (eds) Economics and happiness. Oxford University Press, Oxford, pp 65–90
Frey BS, Stutzer A (2002a) Happiness and economics. Princeton University Press, Princeton
Frey BS, Stutzer A (2002b) What can economists learn from happiness research? J Econ Lit 40(2):402–435
Graham C (2011) The pursuit of happiness. Brookings Institution Press, Washington, DC
Graham C, Chattopadhyay S, Picon M (2010) The Easterlin and other paradoxes: why both sides of the debate may be correct. In: Diener E, Helliwell J, Kahnemann D (eds) International differences in well-being. Oxford University Press, Oxford, pp 247–288, Chapter 9
Kahneman D, Krueger AB (2006) Developments in the measurement of subjective well-being. J Econ Perspect 20(1):3–24
Kahneman D, Krueger AB, Schkade D, Schwartz N, Stone AA (2004a) A survey method for characterizing daily life experience: the day reconstruction method. Science 306:1776–1780
Kahneman D, Krueger AB, Schkade D, Schwartz N, Stone AA (2004b) Toward National Well-Being Accounts. The American Economic Review 94(2): Papers and Proceedings: 429–439
Kimball M, Willis R (2006) Utility and happiness. mimeo
Knight J, Song L (2006) Subjective well-being and its determinants in rural China. China Econ Rev 20(4):635–649
Kwiatkowski D, Phillips PCB, Schmidt P, Shin Y (1992) Testing the null hypothesis of stationarity against the alternative of a unit root: how sure are we that economic time series have a unit root? J Econ 54(1–3):159–178
Scollon CN, Kim-Prieto C, Diener E (2003) Experience sampling: promises and pitfalls, strengths and weaknesses. J Happiness Stud 4:5–34
Stevenson B, Wolfers J (2008) Economic growth and subjective well-being: reassessing the Easterlin Paradox. Brookings Papers on Economic Activity, Spring 2008:1–102
Tsutsui Y, Ohtake F (2012) Asking about changes in happiness in a daily web survey and its implication for the Easterlin paradox. Jpn Econ Rev 63(1):38–56
Acknowledgments
We would like to extend our heartfelt gratitude to Masahiko Shibamoto and Frans van Winden for their comments and acknowledge financial support from the Global Center of Excellence (GCOE) program at Osaka University. This chapter was presented at Monetary Economics Workshop (MEW) and the 2011 Spring Meeting of the Japanese Economic Association.
Author information
Authors and Affiliations
Corresponding author
Editor information
Editors and Affiliations
Addendum: “Ladder of Life Question” from Gallop World Poll, and Easterlin Paradox
This addendum has been newly written for this book chapter.
Addendum: “Ladder of Life Question” from Gallop World Poll, and Easterlin Paradox
The Easterlin Paradox implies that the average happiness level of a country remains constant over a long period. However, the paradox is sometimes demonstrated using scatterplots of various countries’ GDP and average happiness. Figure 17.7 is an example. Among poor countries, higher income generally correlates with higher happiness, while among wealthier countries, no clear relation between per capita income and happiness is recognized. In a word, the figure reveals that happiness becomes independent of income where income exceeds a certain level; this is the Easterlin Paradox.

Scatterplots of various countries’ GDP and average happiness
However, in recent years, challenges to this paradox have appeared. For example, Deaton (2008) and Stevenson and Wolfers (2008), using the Gallop World Poll conducted in 2006 which investigated 132 countries, establish a clear positive link between average levels of subjective well-being and GDP per capita across countries, and find no evidence of a satiation point beyond which wealthier countries have no further increases in subjective well-being as income rises.Footnote 25
Graham (2011) sums up the reasons why this result is obtained from the Gallop World Poll as follows: First, it is reasonable that wealthier people are happier, and in addition, freedom, stable employment and good health are easier to come by in wealthier countries. Second, later surveys, including the Gallop World Poll, include many more observations from small poor countries than do earlier surveys. Third, the Gallop World Poll uses Cantril’s “ladder of life question,” (or “Self-Anchoring Striving Scale”), which asks: “Here is a picture of a ladder. Suppose that we say the top of the ladder represents the best possible life for you and the bottom represents the worst possible life for you. Where on the ladder do you feel you personally stand at the present time?” Comparing with usual question such as “In general, how happy would you say you are—very happy, fairly happy, or not very happy?” the “ladder of life question” asks respondents to make a relative comparison when they assess their lives.
What is important in this appendix is that Cantril’s “ladder of life question” strengthens the relationship between happiness and income because it requires respondents to make a comparison. On this point, Deaton (2008) argues that when people answer such questions, they must assess their life satisfaction relative to some benchmark, such as their own life in the past, or the lives of those around them. He also offers a simpler interpretation: “When asked to imagine the best and worst possible lives for themselves, people use a global standard.” Using data from Latin America, Graham et~al. (2010) report that differences in framing these questions can have important effects on the measured relationship between income and happiness. “Questions that provide more tangible economic or status frames seem to have a closer relationship with income than do more open-ended questions.” This result, as was argued in the text, suggests that the Easterlin Paradox emerges when questions are based on subjective happiness elicited by “overall questions”; once we introduce the element of “comparison” to the questions that measure happiness, happiness begins to correlate with income (standard of living).
Rights and permissions
Copyright information
© 2016 Springer Japan
About this chapter
Cite this chapter
Tsutsui, Y., Ohtake, F. (2016). Asking About Changes in Happiness in a Daily Web Survey and Its Implication for the Easterlin Paradox. In: Ikeda, S., Kato, H., Ohtake, F., Tsutsui, Y. (eds) Behavioral Economics of Preferences, Choices, and Happiness. Springer, Tokyo. https://doi.org/10.1007/978-4-431-55402-8_17
Download citation
DOI: https://doi.org/10.1007/978-4-431-55402-8_17
Publisher Name: Springer, Tokyo
Print ISBN: 978-4-431-55401-1
Online ISBN: 978-4-431-55402-8
eBook Packages: Economics and FinanceEconomics and Finance (R0)