
Abstract
This chapter details a series of dynamo models applicable to the sun and solar-type stars. After introducing the theoretical framework known as mean-field electrodynamics, a series of increasingly complex dynamo models are constructed, with the primary aim of reproducing the various basic observed characteristics of the solar magnetic activity cycle. Global and local magnetohydrodynamcial simulations of solar convection, and dynamo action therein, are also considered, and the resulting magnetic cycles compared and contrasted to those obtained in the simpler dynamo models. The focus throughout the chapter is on the sun, simply because the amount of available observational material on the solar magnetic field and its cycle dwarfs anything else in the astrophysical realm, in terms of spatial and temporal resolution, sensitivity, and time span.
Was einmal gedacht wurde,
kann nicht mehr zurückgenommen werden.
Friedrich Dürrenmatt
Die Physiker (1962)
Keywords
These keywords were added by machine and not by the authors. This process is experimental and the keywords may be updated as the learning algorithm improves.
The time has now come to put together everything (well... almost) we have learned so far to construct dynamo models for solar and stellar magnetic fields. In this and the following chapter we concentrate on the sun, for which the amount of available observational data constrains dynamo models to a degree much greater than for other stars. Dynamo action in stars other than the sun will be considered in Chap. 5, using solar dynamo models as skyhooks.
We begin (Sect. 3.1) by briefly reviewing the basic properties of the solar magnetic cycle, which are to be (hopefully) reproduced by the (relatively) simple dynamo models to be constructed in the remainder of this chapter. These dynamo models all share the shearing of a poloidal field by differential rotation (Sect. 2.2.4) as a source of toroidal field, and all invoke some sort of enhanced, “turbulent” magnetic diffusivity in the solar convective envelope (more on that very shortly!). They differ primarily in the choice they make regarding the physical mechanism responsible for the regeneration of the poloidal magnetic component.
The first stop in our modelling journey is a statistical-physical theory known as mean-field electrodynamics, which will allow us to construct (relatively) simple dynamo models in which the poloidal field is produced through the inductive action of convective turbulence, as described by mean-field electrodynamics (Sect. 3.2). We then look into what currently stands as their main “competitors”, namely solar cycle models based on poloidal field regeneration by the surface decay of active regions, more succinctly known as Babcock–Leighton models (Sect. 3.3). We then turn to cycle models relying on various hydrodynamical or MHD instabilities, which can under certain circumstances act as sources of poloidal magnetic fields (Sect. 3.4). We carry on with an overview of the current state of affairs with regards to investigations of the solar dynamo problem through large-scale MHD simulations of turbulent convection in a thick, stratified rotating shell (Sect. 3.5). The chapter closes (Sect. 3.6). with a brief look at some results from local MHD simulations of photospheric and subsurface convection, and what they can teach us regarding the possible multiplicity of dynamo mechanisms in the sun and stars.

The magnetically-induced Zeeman splitting in the spectrum of a sunspot. The vertical dark line on the left image is the slit having produced the vertical stack of spectra on the right image (with wavelength running horizontally). Reproduced from the 1919 paper by Hale et al. by permission of the AAS.
3.1 The Solar Magnetic Field
3.1.1 Sunspots and the Photospheric Magnetic Field
The sun is the first astronomical object (Earth excluded) in which a magnetic field was detected, through the epoch-making work of George Ellery Hale (1868–1938) and collaborators. In 1907–1908, by measuring the Zeeman splitting in magnetically sensitive lines in the spectra of sunspots and detecting the polarization of the split spectral components (see Fig. 3.1), Hale provided the first unambiguous and quantitative demonstration that sunspots are the seat of strong magnetic fields. Not only was this the first detection of a magnetic field outside the Earth, but the inferred magnetic field strength, 0.3 T, turned out a few thousand times greater than the Earth’s own magnetic field. It was subsequently realized that the Lorentz force associated with such strong magnetic fields would also impede convective energy transport from below, and therefore lead naturally to the lower temperatures observed within the sunspots, as compared to the surrounding photosphere.
The solar surface magnetic field outside of sunspots, although of much wea ker strength, is accessible to direct observation, usually by measuring Zeeman broadening of spectral lines, or the degree of linear or circular polarisation of light emitted from the solar photosphere. The first magnetic maps, or magnetograms, of the solar disk were obtained in the late 1950s by the father-and-son team of Harold D. Babcock (1882–1968) and Horace W. Babcock (1912–2003), and were little more than photographs of a few dozen horizontally stacked scans of the solar disk displayed on an oscilloscope. Figure 3.2 (top) is a modern equivalent in pixel form, with the gray scale coding the strength of the normal component of the magnetic field (mid-level gray, \(|\varvec{B}| \lesssim \ 1\,\)mT; going to white for positive normal field, and to black for negative, peaking around 0.4T in both cases). Comparison with a continuum image (bottom) reveals that the stronger magnetic fields coincide with sunspots, but hefty fields of a few \(10^{-2}\) tesla can be found within and around groups of sunspots. Away from these “magnetically active regions”, the magnetic field is weaker, concentrated into clumps that collectively make up a spatially fragmented magnetic network distributed evenly over the whole surface. Sunspots and active regions, in contrast, are restricted to heliographic latitudes \({\lesssim }\ 40^\circ \), and their number waxes and wanes on an 11 yr cycle, about which we’ll have a lot more to say in the next chapter.

Full disk line-of-sight magnetogram (top) and continuum intensity image (bottom) of the solar photosphere, both taken on 30 March 2001 by the MDI instrument onboard the SOHO satellite. The sun’s rotation axis is vertical on both images. Public domain images downloaded from the SOHO mission website: http://sohowww.nascom.nasa.gov.
Now then, to sum up: far from taking the form of a large-scale, smooth diffuse field as on the Earth, the solar photospheric magnetic field is very fragmented and topologically complex, and shows up concentrated in small magnetized regions, separated by field-free plasma. This dichotomy persists down to the smallest spatial scales that can be resolved with current observational techniques. It owes much to the fact that the outer 30% in radius of the sun is a fluid in a strongly turbulent state. Observations at high time-cadence and spatial resolutions of the solar small-scale magnetic field have shown that the associated photospheric magnetic flux is replenished on an hourly timescale, commensurate with the convective turnover time immediately below the photosphere. Such observations have also shown that the magnetic flux of small-scale magnetic structures visible at the solar surface distributed according to a power-law spanning over 5 orders of magnitude in flux, a remarkable instance of scale invariance. These observations offer strong support to a turbulent dynamo-based explanation for the solar small-scale magnetic field, of the type considered in the preceding chapter, away from active regions at least, although other explanations are also possible (more on these in Sect. 3.6 further below).
From here onwards, we focus mostly on the large-scale solar magnetic field, by which we mean the part of the sun’s magnetic field spatially organized on scales commensurate with the solar radius. While it may not be immediately obvious on Fig. 3.2, sunspots provide one of the better tracers of this large-scale magnetic component.
3.1.2 Hale’s Polarity Laws
Hale and his collaborators did much more than just measure magnetic fields in sunspots. Through painstaking observations and analyses spanning nearly two decades, they went on to demonstrate the existence of a number of regularities in the magnetic fields of sunspots, now known as Hale’s polarity laws. Having noted early on that large sunspots often appear grouped in pairs of opposite magnetic polarities, they could show that:
-
1.
At any given time, the polarity of the leading spots (with respect to the direction of solar rotation) of sunspot pairs is the same in a given solar hemisphere;
-
2.
At any given time, the polarity of the leading spots of sunspot pairs is opposite in the N and S hemispheres;
-
3.
Sunspot polarities reverse in each hemisphere from one 11-yr sunspot cycle to the next.

Schematic representation of a sunspot pair as the manifestation of an underlying toroidal flux rope having risen through the photosphere as an “\(\varOmega \)-loop”. At left, the flux tube lies in the azimuthal direction, before destabilisation and buoyant rise through the photosphere (at right). The magnetic fields impedes convective energy transport, so that cooling leads to a collapse of the magnetic field into two sunspots of opposite polarities. Diagram kindly provided by D. Passos.
This polarity ordering is fairly easy to discern on the magnetogram of Fig. 3.2. The most straightforward interpretation of this common opposite polarity grouping is that we are seeing the surface manifestation of a large-scale toroidal field residing somewhere below the photosphere, having risen upwards and pierced the photosphere in the form of a so-called “\(\varOmega \)-loop” (see Fig. 3.3), its intersection with the photosphere producing sunspot pairs of opposite polarities. If this is the case, and if the magnetic flux ropes have not suffered too much twisting about the axis defined by the trajectory of their apex, then the sign of the deep-seated toroidal component \(B_\phi \) is then given by the magnetic polarity of the trailing sunspots. This picture of sunspot pairs, taken in conjunction with Hale’s polarity laws, therefore indicate that the sun’s internal toroidal field is antisymmetric about the equator and reverses polarity from one sunspot cycle to the next.
Another pattern uncovered by Hale and collaborators is that the line segment joining two members of a sunspot pair tends to show a systematic tilt angle (\(\gamma \)) with respect to the East–West direction, the sunspot farther ahead (in the direction of solar rotation) being closer to the equator. Although there exists considerable variations in observed tilt angles, statistically the magnitude of the tilt increases with increasing heliocentric latitude. This is known as Joy’s law. Least-squares fits to observations yield a parametric representation of the form:
where \(\theta \) is the usual polar angle. This pattern plays an important role in some of the solar cycle models to be considered later in this chapter. This is because the existence of a finite, systematic tilt implies a net dipole moment, which can contribute to the solar poloidal field.
The hemispheric antisymmetry evidenced by Hale’s polarity laws can be readily produced by the shearing of a large-scale poloidal field by a differential rotation symmetric about the equatorial plane, exactly as we modeled already in Sect. 2.2.4. The very existence of Hale’s polarity laws thus suggests the presence of a large-scale poloidal component to the solar magnetic field; its detection was beyond the capability of Hale’s instruments, but later observations clearly established its existence, and its close connection to the internal magnetic field through the solar magnetic cycle.
3.1.3 The Magnetic Cycle
Figure 3.4 is a synoptic (time-latitude) diagram of the longitudinally-averaged photospheric radial magnetic field component, covering three sunspot cycles. Such a diagram is constructed by averaging magnetograms (like the one on Fig. 3.2) in longitude over each successive solar rotation, and stacking side-by-side the resulting latitudinal distribution of \(\phi \)-averaged magnetic field to form a temporal sequence. The most immediately striking global patterns apparent on Fig. 3.4 are certainly the cyclic variations on a \({\sim }\ 22\,\)yr period, accompanying polarity reversals, and the (anti)symmetry about the solar equator.

A synoptic magnetogram covering the last three sunspot cycles. The radial component of the sun’s magnetic field is azimuthally averaged over a solar rotation, and the resulting latitudinal strips stacked one against the other in the form of a time-latitude diagram. Recall that 1T \(\equiv 10^4\,\)gauss. Data and graphics courtesy of David Hathaway, NASA/MSFC, http://solarscience.msfc.nasa.gov/images/magbfly.jpg.
The magnetic signal present within the latitudinal band extending 30\(^{\circ }\) or so on either side of the equator is the magnetographic imprint of sunspots. Their strong magnetic fields (\({\sim }\ 0.1\,\)T) almost average out on such synoptic diagram, because, as already noted, they tend to appear in close pairs of opposite magnetic polarities with comparable (unsigned) magnetic flux. At the beginning of a sunspot cycle (e.g., 1976, 1986, 1996 on Fig. 3.4), sunspots are observed at relatively high (\({\sim }\ 40^\circ \)) heliocentric latitudes, but emerge at lower and lower latitudes as the cycle proceeds, until at the end of the cycle they are seen mostly near the equator, at which time spots announcing the onset of the next cycle begin to appear again at \({\sim }\ 40^\circ \) latitude. This results in the so-called “butterfly diagram” of sunspot distribution, about which we’ll have more to say in the following chapter. Cycle maximum (as measured by sunspot number) occurs about midway along each butterfly, when sunspot coverage is maximal at about 15\(^{\circ }\) latitude, here 1980, 1991 and 2002.
At high heliocentric latitude (\({\gtrsim } 50^\circ \)) the synoptic magnetograms are dominated by a well-defined dipole component, with strength \({\sim }\ 10^{-3}\,\)T, showing a clean pattern of polarity changes occurring at or near sunspot maximum. For example, during the 1976–1986 cycle the toroidal field was negative in the N-hemisphere, and the Northern polar field reversed from positive to negative magnetic polarity; taken at face value, Fig. 3.4 then indicates that the high latitude poloidal field lags the toroidal field by a phase interval \(\varDelta \varphi \simeq \pi /2\).
At mid-latitudes the most prominent feature is a fairly regular poleward drift of magnetic fields originating in sunspot latitudes, presumably released there by the decay of sunspot and active regions. It is quite possible that this poleward transport of magnetic flux from active region belts contributes to the polarity reversal of the polar fields.
A \({\sim }\ 10^{-3}\,\)T polar field pervading a polar cap of \({\sim }\ 30^\circ \) angular width, as on Fig. 3.4, adds up to a poloidal magnetic flux of \({\sim }\ 10^{14}\,\)Wb. The total unsigned flux emerging in active regions, taken to be representative of the solar internal toroidal magnetic component, adds up to a few \(10^{17}\,\)Wb over a full sunspot cycle. This is usually taken to indicate that the solar internal magnetic field is dominated by its toroidal magnetic component.
We will return to sunspots and their spatiotemporal variations in numbers in Sect. 4.1, when we consider the origin of fluctuations in the solar cycle. For the time being we will just concentrate on what they tell us about the strength of the sun’s internal magnetic field.
3.1.4 Sunspots as Tracers of the Sun’s Internal Magnetic Field
In translating the cartoon of Fig. 3.3 into a quantitative physical model, we have a number of issues that need to be clarified. The first is to identify the region(s) of the solar interior from which the flux ropes originate. The magnetic pressure (\(\propto \varvec{B}^2\)) within a strongly magnetized flux tube leads to a density deficit in order to reach pressure equilibrium with the surrounding plasma. The resulting upward buoyancy force can bring the tube to the surface, which is good and needed, but it turns out that for tubes located within the bulk of the convection zone the rise time is far too short to allow field amplification to a level commensurate with observed sunspot field strengths. This has led to the conclusion that the solar magnetic field is stored—maybe even produced—not in the convective envelope proper, but rather immediately below it, within the tachocline.
Considerable efforts have gone into making models of the storage, destabilization and buoyant rise of thin magnetic flux tubes through the solar convective envelope (see bibliography at the end of this chapter). In most cases, flux tubes are treated as structureless, flux-carrying material lines—the so-called thin flux tube approximation—and so these kinds of calculations cannot properly take into account the interaction of the tube with the surrounding turbulent fluid motions. With this caveat in mind, thin flux tube modelling has produced the following two important results:
-
1.
The flux ropes rise essentially radially if they have a field strength in excess of \(B\gtrsim 6\)–\(10\,\)T; otherwise the Coriolis force deflects the rising flux tubes to high latitudes;
-
2.
The flux ropes emerge without any significant tilt for \(B\gtrsim 20\,\)T, and with tilts compatible with Joy’s law for fields strengths in the range \(6\)–\(16\,\)T.
The basic physical mechanism underlying these two remarkable results is the same: if the rise time of the flux ropes is of the order of the solar rotation period, the Coriolis force has an important influence. It is the Coriolis force that, upon acting on the internal flow developing along the length of the flux rope during its rise, gives rise to the twist that, at emergence, manifests itself as Joy’s law. If the field is strong enough for the rise time to be much shorter than the rotation period, then the rising flux rope does not “feel” the rotation, rises radially, and emerges without a tilt. If on the other hand the magnetic field is too weak, the Coriolis force deflects the rising flux rope on a trajectory running parallel to the rotation axis, resulting in emergence at high heliographic latitudes.
Now, this is great stuff: the observed emergence of sunspots at low heliocentric latitudes puts a lower limit on the strength of the participating flux ropes; Joy’s law, on the other hand, translate into an upper limit on the field strength. One concludes that the sunspot-forming toroidal flux ropes must have magnetic field strengths in the rather narrow range
While some level of field amplification is likely during the (ill-understood) process of flux tube formation from the spatially diffuse large-scale magnetic field produced by the dynamo, these modelling results are usually taken to indicate that the large-scale toroidal magnetic field at or below the base of the convective envelope, where stability analyses indicate sunspots-forming toroidal flux rope are formed and stored, must have a strength in the range of a few tenths to a few tesla. By most estimates, the associated magnetic energy density is at least comparable, and perhaps quite a bit larger than the kinetic energy density of the turbulent fluid motions driving dynamo action.
3.1.5 A Solar Dynamo Shopping List
To close this brief overview, let’s now collect a short list of fundamental observational features that a physical model of the solar large-scale magnetic field should reproduce (anything related to amplitude fluctuation being deferred to Chap. 4):
-
1.
A large-scale magnetic field, axisymmetric to a good approximation and antisymmetric about the solar equatorial plane;
-
2.
A cyclic variation of this large-scale magnetic field, characterized by polarity reversals with a \({\sim }\ 20\,\)yr oscillation period;
-
3.
An internal toroidal field of strength \({\sim }\ 0.1\)–\(1\,\)T, concentrated at low solar latitudes (\({\lesssim }\ 45^\circ \), say), and migrating equatorward in the course of the cycle with minimal spatiotemporal overlap between successive cycles;
-
4.
A large-scale surface poloidal field of a few \(10^{-3}\,\)T, migrating poleward in the course of the cycle, and reversing polarity at sunspot maximum.
These properties do not square well with fast dynamo action in turbulent flow; in particular, the sun’s large-scale magnetic field component is characterized by a substantial signed (hemispheric) magnetic flux, for which something else than fast dynamo action is needed. It turns out that the turbulent nature of the flows in the solar convective envelope can still do the trick, but to examine this we will need to adopt a statistical approach to turbulence and to the associated flow-field interactions.
3.2 Mean-Field Dynamo Models
The “toy” dynamo flows considered in Sects. 2.5 and 2.6 exemplified the fact that high-\(\mathrm{R}_\mathrm{m}\) turbulent flows can be quite effective at producing a lot of small-scale magnetic fields, where “small-scales” is roughly \(\mathrm{R}_\mathrm{m}^{-1/2}\) times the length scale of the flow. At the solar surface, the latter is around \({\sim }\ 10^6\,\)m and \(\mathrm{R}_\mathrm{m}\sim 10^8\) (for granulation), which yields very small scales indeed, \({\sim }\ 100\,\)m! So, at some level, the small-scale magnetic fields on the sun and stars are already taken care of. It turns out that under certain conditions, solar/stellar convective turbulence can also produce magnetic fields with a mean component building up on large spatial scales. These mean-field dynamo models remain arguably the most “popular” descriptive models for dynamo action in the sun and stars, but also in planetary metallic cores, stellar accretion disks, and even galactic disks. Accordingly, we will look into the formulation of these models at some depth.Footnote 1
3.2.1 Mean-Field Electrodynamics
The fundamental idea on which mean field theory rests is the two scales approach, which consists of a decomposition of the field variables into mean and fluctuating parts. This process naturally implies that an averaging procedure can meaningfully be defined. The derivation of mean field theory can proceed equally from the choice of space averages, time averages or ensemble averages. In the context of axisymmetric dynamo models, longitudinal averages impose themselves rather naturally. For the time being let’s just define our averaging operator as:
We also assume that the velocity and magnetic field can be decomposed into a mean and fluctuating part so that
The decomposition (3.4) makes sense provided \(\langle {\varvec{u}^\prime }\rangle = \langle {\varvec{B}^\prime }\rangle = 0\). This is not a linearization, in that it involves no assumption regarding the relative magnitudes of the mean and fluctuating parts. The physical interpretation of (3.4) is as follows. The velocity and magnetic fields are characterized by a slowly varying component, \(\langle \varvec{u}\rangle \) and \(\langle {\varvec{B}}\rangle \), which vary on the characteristic large scale \(L\), plus rapidly fluctuating parts, \(\varvec{u}^\prime \) and \(\varvec{B}^\prime \), which vary on the much smaller scale \(\ell \). The volume averages are computed over some intermediate scale \(\lambda \) such that
Whenever (3.5) is satisfied we say that we have a “good” scale separation.
The objective of mean field theory is to produce a closed set of equations for the mean quantities. Substituting (3.4) into the induction equation (1.59), and averaging, we the obtain the equation for the mean magnetic field
Subtracting this expression from the full MHD induction equation, obtained by substitution of (3.4) into (1.59) without applying the averaging operator, yields the following evolutionary equation for the fluctuating part of the magnetic field:
where
The important thing is that (3.6) now contains a source term, \(\mathcal{\boldsymbol{\mathcal{E}}}\), associated with the average of products of fluctuations, which in general does not vanish upon averaging even though \(\varvec{u}^\prime \) and \(\varvec{B}^\prime \) individually do. The term \(\mathcal{\boldsymbol{\mathcal{E}}}\), which is called the mean electromotive force, or emf for short, plays a central role in this theory.
Now, the whole point of the mean-field procedure is to avoid having to deal explicitly with the small scales, so we do not want to be integrating Eq. (3.7) explicitly. But then we have a closure problem: Eq. (3.6) is a 3-component vector equation, for the six components of \(\langle {\varvec{B}}\rangle \) and \(\varvec{B}^\prime \) (leaving the flow out of the picture for the moment). Therefore it is clear that to solve (3.6), \(\mathcal{\boldsymbol{\mathcal{E}}}\) must be expressed as some function of \(\langle \varvec{u}\rangle \) and \(\langle {\varvec{B}}\rangle \).
In order to obtain the desired expression, we note that (3.7) is a linear equation for \(\varvec{B}^\prime \) with the term \(\nabla \times \bigl ( \varvec{u}^\prime \times \langle {\varvec{B}}\rangle \bigr )\) acting as a source. There must therefore exist a linear relationship between \(\varvec{B}\) and \(\varvec{B}^\prime \), and hence, one between \(\varvec{B}\) and \(\langle {\varvec{u}^\prime \times \varvec{B}^\prime \rangle }\). The latter relationship can be expressed formally by the following series
where the tensorial coefficients, \(\alpha \), \(\beta \), \(\gamma \), and so forth must depend on \(\langle \varvec{u}\rangle \), on what we might loosely term the statistics of the turbulent velocity fluctuations, \(\varvec{u}^\prime \), and perhaps on the diffusivity \(\eta \)—but not on \(\langle {\varvec{B}}\rangle \). In this sense, Eqs. (3.6) and (3.9) constitute a closed set of equations for the evolution of \(\langle {\varvec{B}}\rangle \). The convergence of the series representation provided by Eq. (3.9) can be anticipated in those cases where the good separation of scales applies. For in these cases each successive derivative in Eq. (3.9) is smaller than the previous one by approximately a factor of \(\ell / L \ll 1\). With any luck, we may expect Eq. (3.9) to be dominated by the first few terms.
3.2.2 The \(\alpha \)-Effect
We have already remarked that \(\mathcal{\boldsymbol{{\mathcal{E}}}}\) in (3.6) acts as a source term for the mean field. It is instructive to examine the contributions to \(\mathcal{\boldsymbol{{\mathcal{E}}}}\) deriving from the individual terms in the expansion (3.9). The first contribution is associated with the second-rank tensor, \(\alpha _{ij}\), thus
The first thing to note is that \(\alpha _{ij}\) must be a pseudo–tensor since it establishes a linear relationship between a polar vector—the mean emf, and an axial vector—the mean magnetic field. We can divide \(\alpha _{ij}\) into its symmetric and antisymmetric parts, thusFootnote 2
where \(2 a_k = - \varepsilon _{ijk} \alpha _{ij}\). From (3.10) we have
The effect of the antisymmetric part is to provide an additional advective velocity (not in general solenoidal), so that the effective mean velocity becomes \(\langle \varvec{u}\rangle + \varvec{a}\). It results in turbulent pumping of the large-scale magnetic component. The nature of the symmetric part is most easily illustrated in the case when \(\varvec{u}^\prime \) is an isotropic random field.Footnote 3 Then \(\varvec{a}\) is zero, \(\alpha _{ij}\) must be an isotropic tensor of the form \(\alpha _{ij} = \alpha \delta _{ij}\), and (3.12) reduces to
Using Ohm’s law, this component of the emf is found to generate a contribution to the mean current of the form
where \(\sigma _e\) is the electrical conductivity. For nonzero \(\alpha \), Eq. (3.14) implies the appearance of a mean current everywhere parallel to the mean magnetic field—the so-called \(\alpha \)–effect. This is in sharp contrast to the more conventional case where the induced current \(\sigma _e \bigl ( \varvec{u}\times \varvec{B}\bigr )\) is perpendicular to the magnetic field. We are used to thinking of electrical currents being the source of magnetic fields (think of the Biot–Savart law, or the pre-Maxwellian form of Ampère’s law); but a mechanically forced magnetic field can become a source of electrical current. That’s really what induction is all about.
In the context of axisymmetric large-scale astrophysical magnetic fields, the importance of the \(\alpha \)-effect is immediately apparent. We recall from our deliberations in Sect. 2.2.4 that a toroidal field could be generated from a poloidal one by differential rotation (velocity shear). The \(\alpha \)-effect makes it possible to drive a mean toroidal current parallel to the mean toroidal field, which, in turn will regenerate a poloidal field thereby closing the dynamo loop.
To appreciate the physical nature of the \(\alpha \)-effect we pause to examine the original 1955 physical picture put forth by E.N. Parker. We define a cyclonic event to be the rising of a fluid element associated with a definite twist, say anticlockwise when seen from below (see Fig. 3.5). In spherical geometry, we then consider the effect of many such events, distributed randomly in longitude and time, on an initially purely toroidal fieldline. Each cyclonic event creates an elemental loop of field with an associated current distribution that will have a component parallel to the initial field if the angle of rotation is less than \(\pi \) and antiparallel if it is greater. By assuming that the individual events are short lived we can rule out rotations of more than \(2 \pi \). It is clear that the combined effect of many such events is to give rise to a net current with a component along \(\langle {\varvec{B}}\rangle \).

A sketch of a magnetic line of force entrained by a cyclonic, rising fluid element in the frozen-in limit. Note that the resulting cyclonic loop can be viewed as resulting from an element of electric current flowing parallel to the original, uniform magnetic field. From Parker (1970), Fig. 1, by permission of the AAS.
An important property of \(\alpha \) is its pseudoscalar nature, i.e., \(\alpha \) changes sign under parity transformations. This implies that \(\alpha \) can be nonzero only if the statistics of \(\varvec{u}^\prime \) lacks reflectional symmetry. In other words, the velocity field must have a definite chirality. For example, on Fig. 3.5 there is a definite relationship between vertical displacements and sense of twist, set by the Coriolis force. This is similar to the Roberts cell flow, where the \(z\)-component changed sign in step with the sense of rotation in contiguous flow cells. In general the lack of reflectional symmetry of the fluid velocity manifests itself through a nonzero value of the mean fluid helicity \(\langle \varvec{u}^\prime \cdot ( \nabla \times \varvec{u}^\prime ) \rangle \), itself a pseudo scalar. The Roberts Cell and CP flows introduced in the preceding chapter are two examples of flows lacking reflectional symmetry. As we shall presently see, there is an important relation between fluid helicity and the \(\alpha \)-effect.
It is important to establish those cases in which \(\alpha \) can rigorously be computed from knowledge of \(\varvec{u}^\prime \). Not counting methods based on the direct numerical solutions of the induction equation, there are two distinct ways to proceed. In both cases the success of the approach depends on some simplification of Eq. (3.7). In one case the term \(\varvec{G}\) is neglected leading to the so-called first order smoothing approximation (FOSA). In the other, the term \(\eta \nabla ^2\varvec{B}^\prime \) is neglected, leading to the Lagrangian approximation. The two approaches are complementary in the sense that the former is applicable (for most physically relevant circumstances) when the diffusivity is large and the latter when it is small. Even these two most severe simplifying assumptions do not exactly lead to simple mathematics, and to add insult to injury, the parameter regimes for which they are expected to hold do not square well with what we think we know about solar interior conditions. The closest we can get to the sun and stars, in a tractable manner, is the so-called Second-order correlation approximation (SOCA), which neglects cross-correlations between the different velocity components but retains the possibility that the intensity of turbulence itself can vary with position. Under this assumption of near-isotropy, we then have
This leads to a simple diagonal form for the \(\alpha \) tensor:
where \(\tau _c\) is the correlation time for the turbulent flow. Equation (3.16) tells us that the \(\alpha \)-effect is a direct function of the helicity of the turbulent component of the flow; think back of Parker’s picture of twisted magnetic fieldlines (Fig. 3.5) and convince yourself that this is indeed how it should be for the “cartoon” to work.
If one assumes that the (mild) inhomogeneity arises from the stratification, the (mild) break of reflectional symmetry from the Coriolis force, and the lifetime of turbulent eddies is commensurate with their turnover time, then Eq. (3.16) can be brought to the form:
where \(u^\prime =\sqrt{\langle {\varvec{u}^\prime }^2 \rangle }\) is the local r.m.s. turbulent velocity, and \({\varvec{\varOmega }}\) is the angular velocity vector. With the turbulent velocity increasing outwards through the convective envelope faster than the density decreases, Eq. (3.17) would “predict” an \(\alpha \)-effect varying as \(\cos \theta \) and positive (negative) in the solar Northern (Southern) hemisphere. Such expression can be validated through MHD numerical simulations of turbulent flows including an externally-imposed weak magnetic field, and from the simulation statistics one can then compute the \(\alpha \)-tensor components by appropriate averaging.Footnote 4 There has been many such simulations, which, almost surprisingly, have corroborated the expressions obtained from SOCA.
The key parameter is the so-called Coriolis number, defined as the ratio of rotation period to convective turnover time:
equivalent to the inverse of the Rossby number of common usage in atmospheric sciences. The Coriolis number is a dimensionless measure of the ability of the Coriolis force to break the mirror symmetry of convective turbulence. Estimates for this quantity in the sun, with \(\tau _c\) taken from mixing length theory, yield \(\mathrm{Co}\ll 1\) in the outer convection envelope, up to \(\mathrm{Co}\sim 1\)–10 at its base. For \(\mathrm{Co}\sim 1\), the \(\alpha _{\phi \phi }\) component of the \(\alpha \)-tensor, which is the term responsible for poloidal field regeneration in axisymmetric mean-field models, does turn out positive in the bulk of the convection zone, with a \({\sim }\ \cos \theta \) latitudinal dependency. At larger rotation rate, the peak in \(\alpha _{\phi \phi }\) is displaced from the pole to lower latitudes, reaching \({\sim }\ 30^\circ \) at \(\mathrm{Co}\sim 10\). These simulations also produce a sign change in all components of the \(\alpha \)-tensor at the very base of the convective envelope, with the region of negative \(\alpha _{\phi \phi }\) growing in size as \(\mathrm{Co}\) increases from 1 to 10.
The above expressions for the \(\alpha \)-coefficients are predicated on the small-scale field \(\varvec{B}^\prime \) being much weaker than the mean-field \(\langle {\varvec{B}}\rangle \), a situation expected to hold only in the \(\mathrm{R}_\mathrm{m}\ll 1\) regime, or if the coherence time of the turbulent flow is much smaller than its turnover time. The first condition is the regime entirely opposite to that expected in solar/stellar interiors, while the second is at best marginally satisfied. High-\(\mathrm{R}_\mathrm{m}\) MHD turbulence simulations indicate that in this regime one has in fact \({\varvec{B}^\prime }\gtrsim \langle {\varvec{B}}\rangle \), and that Eq. (3.16) should be replaced by:
with \(\varvec{J}^\prime =(\nabla \times {\varvec{B}^\prime })/\mu _0\). Notice that the second term on the RHS, corresponding to the current helicity associated with the small-scale magnetic field, has a sign opposite to that of the kinetic helicity. This says once again, in essence, that the Lorentz force opposes the twisting of the large-scale magnetic field by the turbulent flow. This impact of current helicity on the \(\alpha \)-effect represents a potentially powerful quenching mechanism for the \(\alpha \)-effect, a topic we shall revisit further below.
3.2.3 Turbulent Pumping
The non-diagonal part of the \(\alpha \) tensor provides a contribution to the turbulent emf taking the form of a non-solenoidal advective velocity (second term on RHS of Eq. (3.12)). This is emphatically not a real flow, in the sense that it acts only on the large-scale magnetic component, and originates with the turbulent emf. Turbulent pumping can also be measured in numerical simulations, which indicate that the predominant effect is a downward pumping driven by the stratification, with magnetic fields being expelled from the high-diffusivity regions to the low diffusivity regions. In the presence of rotation, turbulent pumping also takes place in the latitudinal direction, with a velocity reaching values of the order of a few meters per second at high rotation rates (\(\mathrm{Co}=10\)).
Although turbulent pumping is seldom explicitly included in the simple mean-field dynamo models to be discussed presently, its impact on dynamo action in the sun and solar-type stars is likely important; this is because it can offset flux loss through magnetic buoyancy, and favors accumulation of magnetic fields in the tachocline, where the large shear and low magnetic diffusivity are conducive to the production of strong toroidal flux rope-like structures, believed to give rise to sunspots following their destabilization, buoyant rise through the convection zone and surface emergence.
3.2.4 The Turbulent Diffusivity
We now turn to the next term in the expansion (3.9), namely
The physical interpretation of the third-rank pseudotensor, \(\beta _{ijk}\), is again most easily gained when \(\varvec{u}^\prime \) is isotropic, in which case \(\beta _{ijk}=\beta \varepsilon _{ijk}\), where \(\beta \) is a scalar, and so we have
We recognize the scalar \(\beta \) as an additional contribution to the effective diffusivity of \(\langle {\varvec{B}}\rangle \), which thus becomes \(\eta _e \equiv \eta + \beta \). In cases where \(\beta \gg \eta \) one refers to \(\eta _e \approx \beta \) as the turbulent diffusivity. For homogeneous and isotropic turbulence, it can be formally related to the intensity of turbulence as
where \(\tau _c\) is once again the correlation time of the turbulent flow.Footnote 5 Equation (3.22) states that the turbulent diffusivity is more efficient when the turbulence is more vigorous, which makes intuitive sense since, as shown in Sect. 2.3, the rate at which magnetic fieldlines are folded and expelled from (turbulent) flow cells increases with the velocity of the flow.
Simple mixing length models of solar convection suggest \(u^\prime \sim 10\,\)m s\(^{-1}\) and \(\tau _c\sim 1\) month at the base of the convection zone (\(r/R\sim 0.7\)), which then leads to \(\beta \sim 10^8\,\)m\(^2\,\)s\(^{-1}\). This is very much larger than the ordinary magnetic diffusivity \(\eta \sim 1\,\)m\(^2\)s\(^{-1}\), so that we indeed expect \(\beta \gg \eta \). This is why, back in the previous chapter (Sects. 2.1.4 and 2.2.4), whenever trying to model the “real” sun we made use of a magnetic diffusivity profile characterized by a sharp increase when going from the radiative core to the overlying convective envelope (viz. Eq. (2.16) and dash-dotted line on Fig. 2.2). Note also that the magnetic diffusion time (1.63) obtained using the above numerical estimate \(\beta \) for the solar convection zone (with \(\ell \sim 0.3R\)) is now \({\sim }\ 10\,\)yr, which is commensurate to the solar cycle period, and suggests that (turbulent) dissipation can be expected to play an important role in solar cycle models.
3.2.5 The Mean-Field Dynamo Equations
In summary, our heuristic treatment of mean-field electrodynamics has led us to an evolution equation for the large-scale magnetic field, \(\langle {\varvec{B}}\rangle \), which takes account of coherences between fluctuation-fluctuation interactions of the small-scale turbulent magnetic and velocity fields. For homogeneous, stationary, and isotropic velocity turbulence, this equation assume the particularly elegant and physically intuitive form
which, according to SOCA, should remain valid in the case of mildly-inhomogeneous, mildly anisotropic turbulence as well, with \(\alpha \) and \(\beta \) then given by Eqs. (3.16) and (3.22). The fluctuation-fluctuation interactions enter this equation through the electromotive force described by the \(\alpha \)-effect, incarnating what we earlier called constructive folding, and the turbulent diffusion of the mean magnetic field accounted for by \(\beta \), tantamount to destructive folding. In principle, these coefficients can be calculated from the lowest-order statistics of the turbulent flow, namely the spatial distribution of turbulent intensity, as measured by \(\langle (\varvec{u}^\prime )^2 \rangle \).
The fact remains that more often than not, and certainly in all mean-field dynamo models to be considered in what follows, the mean-field coefficients \(\alpha \) and \(\beta \) will be chosen a priori, although we will take care to embody in these choices what we have learned from our brief excursion into mean-field theory. Consequently, the resulting dynamo models will have a descriptive, rather than predictive value. We will be picking numerically “reasonable” turbulent dynamo coefficient that “do the right thing” for the sun, and see how the resulting models behave as we change other aspects of the model, or, later on, apply them to stars other than the sun. Yet, as the following example will show, we can still learn a lot from mean-field electrodynamics, even though we have foregone strict physical determinism.
3.2.6 Dynamo Waves
As discussed already in Sect. 3.1 the shape of the sunspot butterfly diagram suggests that the sunspot-forming deep-seated toroidal magnetic flux system migrates equatorward in the course of the cycle. It turns out that this remarkable pattern can arise naturally in the context of cycle models based on mean-field electrodynamics.
Consider a local cartesian coordinate system oriented so that the direction \(y\) corresponds to an ignorable coordinate (\(\partial /\partial y=0\)), which we associate with the azimuthal direction in an axisymmetric spherical system, and with \(x\) and \(z\) mapping onto the latitudinal and radial directions, respectively. Consider now the action of a spatially constant \(\alpha \)-effect acting in conjunction with a vertically-sheared flow:
where \(\varOmega \) is a constant [units: s\(^{-1}\)]. We shall further assume that the mean-field coefficients \(\alpha \) [units: m s\(^{-1}\)] and \(\eta _e = \beta + \eta \) [units: m\(^2\) s\(^{-1}\)] are constant. The cartesian equivalent of Eq. (2.2) is now
Substitution of Eqs. (3.24) and (3.25) into our mean-field induction equation (3.23) leads to
The two terms on the RHS of this equation parameterize the \(\alpha \)-effect and the \(\varOmega \)-effect. Recall that the \(\varOmega \)-effect describes the generation of a toroidal magnetic field by the shearing of a poloidal field (as in Sect. 2.2.4). The (mean-field) \(\alpha \)-effect accounts for the regeneration of both poloidal and toroidal magnetic fields due to the chirality, or handedness, of the turbulent flow field. These two terms offer the possibility of dynamo action overcoming the magnetic diffusion term which resides on the LHS of this equation.
Equations (3.26) and (3.27) are again PDEs with constant coefficients. We can therefore seek elementary plane-wave solutions of the form
We may assume that \(k \ge 0\) and \(0 \le \vartheta \le 2\pi \) are prescribed (real) parameters, where the latter sets the orientation of the wave vector in the \([x,z]\) plane. If Eq. (3.28) is substituted into Eqs. (3.26)–(3.27), the requirement that there be nontrivial eigenvectors leads to the dispersion relation:
This is a quadratic (complex) polynomial in \(\lambda \), with the two solutions:
with proper care exerted in extracting the square root of complex number using the standard algebraic formulae. The \(\lambda _-\) solution can only produce a disturbance which decays with the passage of time, so our hope rests on the \(\lambda _+\) root, with dynamo action occurring when Re(\(\lambda _+) > 0\). Examination of Eq. (3.30) indicates that an exponentially growing dynamo wave is obtained when \(0 < k < k_\star \), where the critical wavenumber \(k_\star \) is one of the (six) roots of the equation,
If \(k_\star \rightarrow 0\) then the “window” for dynamo action disappears. This occurs when \(\alpha \rightarrow 0\), in agreement with Cowling’s theorem. From a physical perspective it makes a good deal of sense that the dynamo window inhabits the small-wavenumber, large-wavelength, end of the range of possible parameters. Clearly dynamo waves with rapid spatial fluctuations are susceptible to severe damping due to the enhanced diffusivity \(\eta _e \approx \beta \). On the other hand, if the spatial variations of \(\langle {\varvec{A}}\rangle \) are too large, then there is very little \(\langle {\varvec{B}}\rangle \) for the \(\alpha \)-effect to work on, and so the dynamo process again stalls as \(k \rightarrow 0\).
Equation (3.31) can be solved exactly as a cubic equation for \(\zeta \equiv k^2_\star \), but for our purposes it is sufficient to simply estimate \(k_\star \) by inspection of Eq. (3.31) in the limiting cases of “strong” shear, usually most relevant to dynamo action in the sun and stars:
We use the word “wave” to describe these exponentially growing solutions of the mean field equations, because it is clear from Eq. (3.30) that Im(\(\lambda _+) \ne 0\). Note also that the direction of propagation clearly depends upon the sign of the product of \(\alpha \) and \(\varOmega \), and that the largest growth rate will occur for \(\vartheta =\pi /2\), i.e., wave propagating in the “latitudinal” \(x\)-direction, which is a most excellent first step towards reproducing the sunspot butterfly diagram!
3.2.7 The Axisymmetric Mean-Field Dynamo Equations
We now proceed to reformulate the mean-field induction equation (3.23) into a form suitable for axisymmetric large-scale magnetic fields pervading a sphere of electrically conducting fluid. We proceed as we did way back in Sect. 2.4, which is to express the poloidal field as the curl of a toroidal vector potential, and restrict the large-scale flow to the axisymmetric forms given by Eq. (2.59), with the magnetic diffusivity restricted to vary at most only with \(r\). It will also prove convenient to express the resulting equations in nondimensional form.
Toward this end we opt to scale all lengths in terms of \(R\), and time in terms of the diffusion time \(\tau =R^2/\eta _e\) based on the (turbulent) diffusivity in the convective envelope, which we assume to be provided by the (scalar) \(\beta \)-term of mean-field electrodynamics. Henceforth dropping the averaging brackets for notational simplicity, the poloidal/toroidal separation procedure applied to the mean-field dynamo equation (3.23 ) now leads to
where the following three nondimensional numbers have materialized:
with \(\alpha _e\) (dimension m s\({}^{-1}\)), \(u_{e}\) (dimension m s\(^{-1}\)) and \(\varOmega _e\) (dimension s\({}^{-1}\)) as reference values for the \(\alpha \)-effect, meridional flow and differential rotation, respectively.
Remember that the functionals \(\alpha \), \(\eta \), \({\varvec{u}}_p\) and \(\varOmega \) are hereafter dimensionless. The quantities \(C_\alpha \) and \(C_\varOmega \) are dynamo numbers, measuring the importance of inductive versus diffusive effects on the RHS of Eqs. (3.33) and (3.34). The third dimensionless number, \(\mathrm{R}_\mathrm{m}\), is a magnetic Reynolds number, which here measures the relative importance of advection (by meridional circulation) versus diffusion in the transport of \(A\) and \(B\) in meridional planes. For simplicity of notation, we continue to use \(\eta \) for the total magnetic diffusivity, retaining the possibility of variation with depth and with the understanding that within the convective envelope this now includes the (dominant) contribution from the \(\beta \)-term of mean-field theory.
Equations (3.33) and (3.34) will hereafter be referred to as the dynamo equations (rather than the technically preferable but cumbersome “axisymmetric mean-field dynamo equations”). Structurally, they only differ from Eqs. (2.61) to (2.62) by the presence of not one but two new source terms on the RHS, both associated with the \(\alpha \)-effect. The appearance of this term in Eq. (3.33) is crucial, since this is what allows us to evade Cowling’s theorem. Acting in conjunction with the new \(\alpha \)-effect term in Eq. (3.34), it makes dynamo action possible in the absence of a large-scale shear, i.e., with \(\nabla \varOmega =0\) in Eq. (3.34). Such dynamos are known as \(\alpha ^2\) dynamos, and regenerate both the poloidal and toroidal magnetic fields entirely via the inductive action of small-scale turbulence. Traditionally, dynamo action in planetary cores has been assumed to belong to this variety (at least from the point of view of mean-field theory).
Another possibility is that the shearing terms entirely dominates over the \(\alpha \)-effect term, in which case the latter is altogether dropped out of Eq. (3.34). This leads to the \(\alpha \varOmega \) dynamo model, which is believed to be most appropriate to the sun and solar-type stars. Finally, retaining both source terms in Eq. (3.34) defines, you guessed it I hope, the \(\alpha ^2\varOmega \) dynamo model. This has received comparatively little attention in the context of solar/stellar dynamos, since (simple) a priori estimates of the dynamo numbers \(C_\alpha \) and \(C_\varOmega \) usually yield \(C_\alpha /C_\varOmega \ll 1\); caution is however warranted if dynamo action takes place in a thin shell, in which case the \(\alpha \)-term can still dominate toroidal field production.
In general, solutions are sought in a meridional plane of a sphere of radius \(R\), and as with the diffusive problem of Sect. 2.1, are matched to a potential field in the exterior (\(r/R>1\)), and regularity requires that \(A(r,0)=A(r,\pi )=0\) and \(B(r,0)=B(r,\pi )=0\) be imposed on the symmetry axis. In practice it is often useful to solve explicitly for modes having odd and even symmetry with respect to the equatorial plane. To do so, one simply solves the dynamo equations in a meridional quadrant, and imposes the following boundary conditions along the equatorial plane. For a dipole-like antisymmetric mode,
while for symmetric (quadrupole-like) modes one sets instead
We are now ready, if not to rock, at least to roll...
3.2.8 Linear \(\alpha \varOmega \) Dynamo Solutions
In constructing mean-field dynamos for the sun, it has been a common procedure to neglect meridional circulation, on the grounds that it is a very weak flow (but more on this further below), and to adopt the \(\alpha \varOmega \) model formulation, on the grounds that with \(R\simeq 7\times 10^{8}\,\)m, \(\varOmega _e\sim 10^{-6}\,\)rad s\({}^{-1}\), and \(\alpha _e\sim 1\,\)m s\({}^{-1}\), one finds \(C_\alpha /C_\varOmega \sim 10^{-3}\), independently of the assumed (and poorly constrained) value for the turbulent diffusivity. We also restrict the models to the kinematic regime, i.e., all flow fields posed a priori and deemed steady (\(\partial /\partial t=0\)). Equations (3.33) and (3.34) then reduce to the so-called \(\alpha \varOmega \) dynamo equations:
where \(\alpha \), \(\varOmega \) and \(\eta \) are now all dimensionless functions of spatial coordinates, remember. In the spirit of producing a model that is solar-like we use a fixed value \(C_\varOmega =2.5\times 10^4\), obtained assuming \(\varOmega _e\equiv \varOmega _{Eq}\sim 10^{-6}\,\)rad s\({}^{-1}\) and \(\eta _e=5\times 10^{7}\,\)m\(^2\)s\(^{-1}\), which leads to a diffusion time \(\tau =R^2/\eta _e\simeq 300\,\)yr.
In the parameter regime characterizing the strongly turbulent solar convection zone, the strength and spatial variation of the \(\alpha \)-effect cannot be computed in any reliable manner from first principles, so this will remain the major unknown of the model. In accordance with the \(\alpha \varOmega \) approximation of the dynamo equations, we restrict ourselves to cases where \(|C_\alpha |\ll C_\varOmega \). For the dimensionless functional \(\alpha (r,\theta )\) we use an expression of the form
where
This combination of error functions concentrates the \(\alpha \)-effect in the bottom half of the envelope, and lets it vanish smoothly below, just as the net magnetic diffusivity does (i.e., we again set \(r_c/R=0.7\) and \(w/R=0.05\)). Various lines of argument point to an \(\alpha \)-effect peaking at the bottom of the convective envelope, since there the convective turnover time is commensurate with the solar rotation period, a most favorable setup for the type of toroidal field twisting at the root of the \(\alpha \)-effect. Likewise, the hemispheric dependence of the Coriolis force suggests that the \(\alpha \)-effect should be positive in the Northern hemisphere, and change sign across the equator (\(\theta =\pi /2\)). The “minimal” latitudinal dependency is thus
The \(C_\alpha \) dimensionless number, measuring the strength of the \(\alpha \)-effect, is treated as a free parameter of the model. You may be shocked by the fact that we are, in a very cavalier manner, effectively treating the \(\alpha \)-effect as a (almost) free-function; this sorry situation is unfortunately the rule rather than the exception in mean-field dynamo modelling.Footnote 6
With \(\alpha \), \(\beta \) and the large-scale flow given, the \(\alpha \varOmega \) dynamo equations (3.40) and (3.41) become linear in the mean-field \(\varvec{B}.\) With none of the PDE coefficients depending explicitly on time, one can seek eigensolutions of the form
where the amplitudes \(a\) and \(b\) are in general complex quantities. Substituting Eq. (3.45) into the \(\alpha \varOmega \) dynamo equations yields a classical linear eigenvalue problem. It will prove convenient to write the eigenvalue explicitly as
so that \(\sigma \) is the growth rate and \(\omega \) the cyclic frequency, both expressed in terms of the inverse diffusion time \(\tau ^{-1}=\eta _e/R^2\). In a model for the (oscillatory) solar dynamo, we are looking for solutions where \(\sigma >0\) and \( \omega \ne 0\).
Armed (and dangerous) with the above model, we plow ahead and solve numerically the \(\alpha \omega \) dynamo equations as a 2D eigenvalue problem. We first produce a sequence of solutions for increasing values of \(|C_\alpha |\), holding \(C_\varOmega \) fixed at a its “solar” value \(2.5\times 10^4\), Fig. 3.6 shows the variation of the growth rate \(\sigma \) and frequency \(\varOmega \) as a function of \(C_\alpha \). Four sequences are shown, corresponding to modes that are either antisymmetric or symmetric with respect to the equatorial plane (“A” and “S” respectively), computed with either positive or negative \(C_\alpha \). For \(|C_\alpha |\) smaller than some threshold value, the induction terms make too small a contribution to the RHS of Eq. (3.40), leaving the dissipation terms dominant, so that solutions all have \(\sigma <0\), as per Cowling’s theorem. As \(|C_\alpha |\) increases, the growth rate eventually reaches \(\sigma =0\). At this point we also have \(\omega \not =0\), so that the corresponding solution oscillates with neither growth of decay of its amplitude. Further increases of \(|C_\alpha |\) lead to \(\sigma >0\). We are now finally in the dynamo regime, where a weak initial field is amplified exponentially in time.
Computing similar sequences for the same model but different values of \(C_\varOmega \) soon reveals that the onset of dynamo activity (\(\sigma >0\)) is controlled by the product of \(C_\alpha \) and \(C_\varOmega \):
The value of \(D\) for which \(\sigma =0\) is called the critical dynamo number (denoted \(D_\mathrm{crit}\)). This, at least, is similar to what we found for the analytical solution of Sect. 3.2.6. Modes having \(\sigma <0\) are called subcritical, and those having \(\sigma >0\) supercritical. Note on Fig. 3.6 how little the growth rate and dynamo frequency depend on the assumed solution parity.

Variations of the dynamo growth rate (top) and frequency (bottom) as a function of \(|C_\alpha |\) in the minimal \(\alpha \varOmega \) model with solar-like internal differential rotation. Sequences are shown for either positive or negative dynamo number (as labeled), and symmetric (triangles) or antisymmetric (dots) parity. Modes having \(\sigma <0\) are decaying, and modes with \(\sigma >0\) are exponentially growing. Here modes with A or S parity have very nearly identical eigenvalues. In this model the first mode to reach criticality is the negative \(C_\alpha \) mode, for which \(D_\mathrm{crit}=-0.9\times 10^5\). The positive \(C_\alpha \) mode reaches criticality at \(D_\mathrm{crit}= 1.1\times 10^5\). The diamonds on panel b correspond to the dynamo frequency measured in a nonlinear version of the same minimal \(\alpha \varOmega \) model, including algebraic \(\alpha \)-quenching, to be discussed in Sect. 3.2.10.
Here the first mode to become supercritical is the negative \(C_\alpha \) mode, for which \(D_\mathrm{crit}=-0.9\times 10^5\), followed shortly by the positive \(C_\alpha \) mode (\(D_\mathrm{crit}=-1.1\times 10^5\)). The dynamo frequency for these critical modes is \(\omega \simeq 300\), which corresponds to a full cycle period of \({\sim }\ 6\,\)yr. This is within a factor of four of the observed full solar cycle period. Once again we should not be too impressed by this, since we have quite a bit of margin of manoeuvre in specifying numerical values for \(\eta _e\) and \(C_\alpha \), and there is no reason to believe that the sun should be exactly at the critical threshold for dynamo action.
Figure 3.7 shows half a cycle of the dynamo solution, in the form of snapshots of the toroidal (color scale) and poloidal (fieldlines) eigenfunctions in a meridional plane, with the rotation/symmetry axis oriented vertically.Footnote 7 The four frames are separated by a phase interval \(\varphi =\pi /3\), so that panel (d) is identical to (a) except for reversed magnetic polarities in both magnetic components. Such linear eigensolutions leave the absolute magnitude of the magnetic field undetermined, but the relative magnitude of the poloidal to toroidal components is found to scale as \(\sim \ |C_\alpha /C_\varOmega |\).
The toroidal field peaks in the vicinity of the core–envelope interface, which is not surprising since, in view of Eqs. (2.27) and (2.28), the radial shear is maximal there and the magnetic diffusivity and \(\alpha \)-effect are undergoing their fastest variation with depth. But why is the amplitude of the dynamo mode vanishing so rapidly below the core–envelope interface? After all, the poloidal and toroidal diffusive eigenmodes investigated in Sect. 2.1 were truly global, and the adopted contrast in magnetic diffusivity between core and envelope should favor stronger fields in the lower diffusivity core. The crucial difference lies with the oscillatory nature of the solution: because the magnetic field produced in the vicinity of the core–envelope interface is oscillating with alternating polarities, its penetration depth in the core is limited by the electromagnetic skin depth\(\ell =\sqrt{2\eta _c/\omega }\) (Sect. 2.3), with \(\eta _c\) the core diffusivity. Having assumed \(\eta _e=5\times 10^{7}\,\)m\(^2\)s\(^{-1}\), we have \(\eta _c=\eta _e\varDelta \eta =5\times 10^6\,\)m\(^2\)s\(^{-1}\). A dimensionless dynamo frequency \(\omega \simeq 300\) corresponds to \(3\times 10^{-8}\,\)s\({}^{-1}\), so that \(\ell /R\simeq 0.026\), quite small indeed.

Four snapshots (a–d)in meridional planes of our minimal linear \(\alpha \varOmega \) dynamo solution with defining parameters \(C_\varOmega =25000\), \(\eta _e/\eta _c=10\), \(\eta _e=5\times 10^{7}\,\)m\(^2\) s\(^{-1}\). With \(C_\alpha =+5\), this is a mildly supercritical solution (cf. Fig. 3.6). The toroidal field is plotted as filled contours (green to blue for negative \(B\), yellow to red for positive \(B\), normalized to the peak strength and with increments \(\varDelta B=0.2\)), on which poloidal fieldlines are superimposed (blue for clockwise-oriented fieldlines, orange for counter-clockwise orientation). The dashed line is the core–envelope interface at \(r_c/R=0.7\). The four snapshots shown here cover half a magnetic cycle, i.e., panel d is identical to a except for reversed magnetic polarities.
Careful examination of Fig. 3.7a–d also reveals that the toroidal/poloidal flux systems present in the shear layer first show up at high-latitudes, and then migrate equatorward to finally disappear at mid-latitudes in the course of the half-cycle. If you haven’t already guessed it: what we are seeing on Fig. 3.7 is the spherical equivalent of the dynamo waves investigated in Sect. 3.2.6 for the cartesian case with uniform \(\alpha \)-effect and shear. In more general terms, the dynamo waves travel in a direction \(\varvec{s}\) given by
i.e., along isocontours of angular velocity. This result is known as the Parker–Yoshimura sign rule. Here with a negative \( \partial \varOmega /\partial r \) in the high-latitude region of the tachocline, a positive \(\alpha \)-effect results in an equatorward propagation of the dynamo wave.
3.2.9 Nonlinearities and \(\alpha \)-Quenching
Obviously, the exponential growth characterizing supercritical (\(\sigma >0\)) linear solutions must stop once the Lorentz force associated with the growing magnetic field becomes dynamically significant for the inductive flow. This magnetic backreaction can show up here in two distinct ways:
-
1.
Reduction of the differential rotation;
-
2.
Reduction of turbulent velocities, and therefore of the \(\alpha \)-effect (and perhaps also of the turbulent magnetic diffusivity).
Because the solar surface and internal differential rotation shows very little dependence on the phase of the solar cycle, it has been customary to assume that magnetic backreaction occurs at the level of the \(\alpha \)-effect. In the mean-field spirit of not solving dynamical equations for the small-scales, it is still a common practice to simply assume a dependence of \(\alpha \) on \(B\) that “does the right thing”, namely reducing the \(\alpha \)-effect once the magnetic field becomes “strong enough”, the latter usually taken to mean when the growing dynamo-generated mean magnetic field reaches a magnitude such that its energy per unit volume is comparable to the kinetic energy of the underlying turbulent fluid motions:
This expression defines the equipartition field strength, denoted \(B_\mathrm{eq}\), which varies from \({\sim }\ 1\,\)T at the base of the solar convective envelope, to \({\sim }\ 0.1\,\)T in the surface layers. It has become common practice to introduce an ad hoc algebraic nonlinear quenching of \(\alpha \) (and sometimes \(\eta _e\) as well) directly on the mean-toroidal field \(B\) by writing:
Needless to say, this remains an extreme oversimplification of the complex interaction between flow and field that is known to characterize MHD turbulence, but its wide usage in solar dynamo modelling makes it a good choice for the illustrative purpose of this section.
3.2.10 Kinematic \(\alpha \varOmega \) Models with \(\alpha \)-Quenching
With \(\alpha \)-quenching included in the poloidal source term, the mean-field \(\alpha \varOmega \) equations are now nonlinear, and are best solved as an initial-boundary-value problem. The initial condition is an arbitrary seed field of very low amplitude, in the sense that \(B\ll B_\mathrm{eq}\) everywhere in the domain. Boundary conditions remain the same as for the linear analysis of the preceding section.
Consider again the minimal \(\alpha \varOmega \) model of Sect. 3.2.8, where the \(\alpha \)-effect assumes its simplest possible latitudinal dependency, \(\propto \cos \theta \). We use again \(C_\varOmega =2.5\times 10^4\) and positive \(C_\alpha \ge 5\), so that the corresponding linear solutions are in the supercritical regime (see Fig. 3.6). With a very weak \(\varvec{B}\) as initial condition, early on the model is essentially linear and exponential growth is expected. This is indeed what is observed, as can be seen on Fig. 3.8, showing time series of the total magnetic energy in the simulation domain for increasing values of \(C_\alpha \), all above criticality. Eventually however, \(B\) starts to become comparable to \(B_\mathrm{eq}\) in the region where the \(\alpha \)-effect operates, leading to a break in exponential growth, and eventual saturation at some constant value of magnetic energy. Evidently, \(\alpha \)-quenching is doing what it was designed to do! Note how the saturation energy level increases with increasing \(C_\alpha \), an intuitively satisfying behavior since solutions with larger \(C_\alpha \) have a more powerful poloidal source term. The cycle frequency for these solutions is plotted as diamonds on Fig. 3.6b and, unlike in the linear solutions, now shows very little increase with increasing \(C_\alpha \). Moreover, the dynamo frequency of these \(\alpha \)-quenched solutions are found to be slightly smaller than the frequency of the linear critical mode (here by some 10–15%), a behavior that is typical of these models. Yet the overall form of the dynamo solutions closely resembles that of the linear eigenfunctions plotted on Fig. 3.7. Indeed, the full cycle period is here \(P/\tau \simeq 0.027\), which translates into 9 yr for our adopted \(\eta _e=5\times 10^{7}\,\)m\(^2\) s\(^{-1}\), i.e., a little over a factor of two shorter than the real thing. Not bad!

Time series of magnetic energy for a set of \(\alpha \varOmega \) dynamo solutions using our minimal \(\alpha \varOmega \) model including algebraic \(\alpha \)-quenching, and different values for \(C_\alpha \), as labeled. Magnetic energy is expressed in arbitrary units. The dashed line indicates the exponential growth phase characterizing the linear regime.
As a solar cycle model, these dynamo solutions do suffer from one obvious problem: magnetic activity is concentrated at too high latitudes (see Fig. 3.7). This is a direct consequence of the assumed \(\cos \theta \) dependency for the \(\alpha \)-effect. One obvious way to push the dynamo mode towards the equator is to concentrate the \(\alpha \)-effect at low latitude. This is not as ad hoc as one may think, given that the numerical simulation results discussed in Sect. 3.2.2 do indicate that in the high rotation regime (\(\mathrm{Co}\gtrsim 4\)), the peak in the \(\alpha \)-effect is indeed displaced to low latitudes. We therefore proceed using now a latitudinal dependency in \(\propto \sin ^2\theta \cos \theta \) for the \(\alpha \)-effect.
Figure 3.9 shows a selection of three \(\alpha \varOmega \) dynamo solutions, in the form of time-latitude diagrams of the toroidal field extracted at the core–envelope interface, here \(r_c/R=0.7\). If sunspot-producing toroidal flux ropes form in regions of peak toroidal field strength, and if those ropes rise radially to the surface, then such diagrams are directly comparable to the sunspot butterfly diagram. These three models all have \(C_\varOmega =25000\), \(|C_\alpha |=10\), \(\varDelta \eta =0.1\), and \(\eta _e=5\times 10^{7}\,\)m\(^2\) s\(^{-1}\). To facilitate comparison between solutions, antisymmetric parity is imposed via the boundary condition at the equator. On such diagrams, the latitudinal propagation of dynamo waves shows up as a “tilt” of the flux contours away from the vertical direction.

Northern hemisphere time-latitude (“butterfly”) diagrams for a selection (a–c) of nonlinear \(\alpha \varOmega \) dynamo solutions including \(\alpha \)-quenching, constructed at the depth \(r/R=0.7\) corresponding to the core–envelope interface. Isocontours of the toroidal field are normalized to their peak amplitudes, and plotted for increments \(\varDelta B/\mathrm{max}(B)=0.2\), with yellow-to-red (green-to-blue) contours corresponding to \(B>0\) (\(<0\)). The assumed latitudinal dependence of the \(\alpha \)-effect is given on each panel (a–c). Other model ingredients are the same as on Fig. 3.7. Note the co-existence of two distinct cycles in the solution shown on panel c, with periods differing by about 25%. Adapted from Living Review of Charbonneau (2010).
The first solution, on Fig. 3.9a, is once again our basic solution of Fig. 3.7, with an \(\alpha \)-effect varying in \(\cos \theta \). The other two use an \(\alpha \)-effect varying in \(\sin ^2\theta \cos \theta \), and so manage to produce dynamo action that materializes in two more or less distinct branches, one associated with the negative radial shear in the high latitude part of the tachocline, the other with the positive shear in the low-latitude tachocline. These two branches propagate in opposite directions, in agreement with the Parker–Yoshimura sign rule, since the \(\alpha \)-effect here does not change sign within an hemisphere, but the radial gradient of \(\varOmega \) does.
It is noteworthy that co-existing dynamo branches, as on Fig. 3.9b, c, can have distinct dynamo periods, which in nonlinearly saturated solutions leads to long-term amplitude modulation. Such modulations are typically not expected in dynamo models where the only nonlinearity present is a simple algebraic quenching formula such as Eq. (3.50). Note that this does not occur for the \(C_\alpha <0\) solution, where both branches propagate away from each other, but share a common latitude of origin and so are phased-locked at the onset (cf. Fig. 3.9b). We are seeing here a first example of potentially distinct dynamo modes interfering with one another, a direct consequence of the complex profile of solar internal differential rotation.
The solution of Fig. 3.9b is characterized by a low-latitude equatorially propagating branch, and a full cycle period of 16 yr, which is getting pretty close to the “target” 22 yr. But again the strong high-latitude, poleward-propagating branch has no counterpart in the sunspot butterfly diagram. This is often summarily dealt with by flatly zeroing out the \(\alpha \)-effect at latitudes higher than \({\sim }\ 40^\circ \), but this is clearly not a very satisfying approach. Let’s try something else instead.
3.2.11 Enters Meridional Circulation: Flux Transport Dynamos
Meridional circulation is unavoidable in turbulent, stratified rotating convection. It basically results from an imbalance between Reynolds stresses and buoyancy forces. The \({\sim }\ 15\,\)m s\(^{-1}\) poleward flow observed at the surface has been detected helioseismically, down to \(r/R\simeq 0.85\) without significant departure from the poleward direction, except locally and very close to the surface, in the vicinity of the active region belts. Mass conservation evidently requires an equatorward flow deeper down.
Meridional circulation can bodily transport the dynamo-generated magnetic field (terms \(\propto {\varvec{u}}_p\cdot \nabla \) in Eqs. (2.61) and (2.62)), and therefore, for a (presumably) solar-like equatorward return flow that is vigorous enough, can overpower the Parker–Yoshimura rule and produce equatorward propagation no matter what the sign of the \(\alpha \)-effect is. At low circulation speeds, the primary effect is a Doppler shift of the dynamo wave, leading to a small change in the cycle period. The behavioral turnover from dynamo wave-like solutions to circulation-dominated magnetic field transport sets in when the circulation speed in the dynamo region becomes comparable to the propagation speed of the dynamo wave. In the circulation-dominated regime, the cycle period loses sensitivity to the assumed turbulent diffusivity value, and becomes determined primarily by the circulation’s turnover time. Solar cycle models achieving equatorward propagation of the deep-seated toroidal field in this manner are often called flux transport dynamos.

Snapshots (a–i) covering half a cycle of an \(\alpha \varOmega \) dynamo solution including meridional circulation, starting at the time of polarity reversal in the polar surface field. Meridional circulation streamlines are plotted on panel a, the flow being poleward at the surface and equatorward at the core–envelope interface. Color coding of the toroidal field and poloidal fieldlines as on Fig. 3.7. This \(\alpha \)-quenched solution uses the same differential rotation, diffusivity, and \(\alpha \)-effect profiles as on Fig. 3.7, with parameter values \(C_\alpha =0.5\), \(C_\varOmega =5\times 10^5\), \(\varDelta \eta =0.1\), \(\mathrm{R}_\mathrm{m}=2500\). Note the strong amplification of the surface polar fields, the latitudinal stretching of poloidal fieldlines by the meridional flow at the core–envelope interface, and the weak, secondary dynamo mode in the equatorial region of the tachocline.
These properties of dynamo solutions with meridional flows can be cleanly demonstrated in simple \(\alpha \varOmega \) models using a purely radial shear at the core–envelope interface (see references in bibliography), but with a solar-like differential rotation profile, the situation turns out to be far more complex. Consider for example the three \(\alpha \varOmega \) dynamo solutions of Fig. 3.9, now recomputed including a meridional flow taking the form of a single cell per meridional quadrant, directed poleward in the outer convective envelope and with the equatorward return flow closing at the core–envelope interface, as illustrated on Fig. 3.10a.Footnote 8 As \(\mathrm{R}_\mathrm{m}\) is increased, for the solution of Fig. 3.9a, the dynamo is decaying in \(10^2\lesssim \mathrm{R}_\mathrm{m}\lesssim 600\), and then kicks in again at \(\mathrm{R}_\mathrm{m}\simeq 800\) with a double-branched structure in its butterfly diagram. The negative-\(C_\alpha \) solution (Fig. 3.9b), on the other hand transits to a steady mode around \(\mathrm{R}_\mathrm{m}\sim 10^2\) that persists at least up to \(\mathrm{R}_\mathrm{m}=5000\); the solution of Fig. 3.9c, develops a dominant equatorial branch at \(\mathrm{R}_\mathrm{m}\sim 200\), but a dominant high-latitude branch takes over from \(\mathrm{R}_\mathrm{m}\sim 10^3\) onward.
Figure 3.10b through i shows half a cycle of our \(\alpha \propto \cos \theta \) reference solution, now for parameter values \(C_\alpha =0.5\), \(C_\varOmega =5\times 10^5\), \(\varDelta \eta =0.1\), and \(\mathrm{R}_\mathrm{m}=2500\), which for an envelope diffusivity reduced to \(\eta _e=5\times 10^6\,\)m\(^2\,\)s\(^{-1}\) corresponds to a solar-like surface poleward flow and differential rotation. The transport of the magnetic field by meridional circulation is clearly apparent, and concentrates the toroidal field to low latitudes, which is great from the point of view of the sunspot butterfly diagram. Note also how poloidal fieldlines suffer very strong stretching in the latitudinal direction within the tachocline (panels c through f), a direct consequence of shearing—in addition to plain transport—by the equatorward flow. One interesting consequence is that induction of the toroidal field is now effected primarily by the latitudinal shear within the tachocline, with the radial shear, although larger in magnitude, playing a lesser role since \(B_r/B_\theta \ll 1\).
The meridional flow also has a profound impact on the magnetic field evolution at \(r=R\), as it concentrates the poloidal field in the polar regions. This leads to a large amplification factor through magnetic flux conservation, so that dynamo solutions such as shown on Fig. 3.10 are typically characterized by very large polar field strengths, here 0.07 T, for an equipartition field strength \(B_\mathrm{eq}=0.5\,\)T in Eq. (3.50). This is only a factor of 4 or so smaller than the toroidal field in the tachocline, even though we have here \(C_\alpha /C_\varOmega =10^{-6}\). This concentrated poloidal field, when advected downwards to the polar regions of the tachocline, is responsible for the strong polar branch often seen in the butterfly diagram of dynamo solutions including a rapid meridional flow.
It is noteworthy that to produce a butterfly-like time-latitude diagram of the toroidal field at the core–envelope interface, the required value of \(\mathrm{R}_\mathrm{m}\) in conjunction with the observed surface meridional flow speed and reasonable profile for the internal return flow, ends up requiring a rather low envelope magnetic diffusivity, \({\lesssim }\ 10^7\,\)m\(^2\,\)s\(^{-1}\), which stands at the very low end of the range suggested by mean-field estimates such as provided by Eq. (3.22). Still, kinematic \(\alpha \varOmega \) mean-field models including meridional circulation and simple algebraic \(\alpha \)-quenching can produce equatorially-concentrated and equatorially propagating dynamo modes with a period resembling that of the solar cycle for realistic, solar-like differential rotation and circulation profiles. Nice and fine, but it turns out we have another potential problem on our hands.
3.2.12 Interface Dynamos
The \(\alpha \)-quenching expression (Eq. 3.50) used in the two preceding sections amounts to saying that dynamo action saturates once the mean, dynamo-generated field reaches an energy density comparable to that of the driving turbulent fluid motions, i.e., \(B_\mathrm{eq}\sim \sqrt{\mu _0{\varrho }} u_t\), where \(u_t\) is the turbulent velocity amplitude. This appears eminently sensible, since from that point on a toroidal fieldline would have sufficient tension to resist deformation by cyclonic turbulence, and so could no longer feed the \(\alpha \)-effect. At the base of the solar convective envelope, one finds \(B_\mathrm{eq}\sim 1\,\)T, for \(u_t\sim 10\,\)m s\(^{-1}\), according to standard mixing length theory of convection. However, various calculations and numerical simulations have indicated that long before the mean toroidal field \(B\) reaches this strength, the helical turbulence reaches equipartition with the small-scale, turbulent component of the magnetic field. Such calculations also indicate that the ratio between the small-scale and mean magnetic components should itself scale as \(\mathrm{R}_\mathrm{m}^{1/2}\), where \(\mathrm{R}_\mathrm{m}=u_t\ell /\eta \) is a magnetic Reynolds number based on the turbulent speed \(u_t\) but microscopic magnetic diffusivity. This then leads to the alternate quenching expression
known in the literature as strong \(\alpha \) -quenching or catastrophic quenching. Since \(\mathrm{R}_\mathrm{m}\sim 10^{8}\) in the solar convection zone, this leads to quenching of the \(\alpha \)-effect for very low amplitudes of the mean magnetic field, of order \(10^{-5}\,\)T. Even though significant field amplification is likely in the formation of a toroidal flux rope from the dynamo-generated magnetic field, we are now a very long way from the 6–16 T demanded by simulations of buoyantly rising flux ropes and sunspot formation.
A way out of this difficulty was proposed by E.N. Parker in the form of interface dynamos. The idea is beautifully simple: if the toroidal field quenches the \(\alpha \)-effect, amplify and store the toroidal field away from where the \(\alpha \)-effect is operating! Parker showed that in a situation where a radial shear and the \(\alpha \)-effect are segregated on either side of a discontinuity in magnetic diffusivity taken to coincide with the core–envelope interface, the constant coefficient \(\alpha \varOmega \) dynamo equations considered already in Sect. 3.2.6 support solutions in the form of traveling surface waves localized on the discontinuity. The key aspect of Parker’s (linear, cartesian, analytical) solution is that for supercritical dynamo waves, the ratio of peak toroidal field strength on either side of the discontinuity surface is found to scale with the diffusivity ratio as
If the core diffusivity \(\eta _c\) assumes the microscopic value, and the envelope diffusivity (\(\eta _e\)) is of turbulent origin so that \(\eta _e\sim \ell u_t\), then the toroidal field strength ratio scales as \(\sim \ (u_t\ell /\eta _c)^{1/2}\equiv \mathrm{R}_\mathrm{m}^{1/2}\). This is precisely the factor needed to bypass strong \(\alpha \)-quenching, at least as embodied in Eq. (3.51).
As an illustrative example, Fig. 3.11a shows a series of radial cuts of the toroidal magnetic component at 15\(^\circ \) latitude, spanning half a cycle in a numerical interface solution with \(C_\varOmega =2.5\times 10^5\), \(C_\alpha =+10\), and a core-to-envelope diffusivity contrast \(\varDelta \eta =10^{-2}\). The differential rotation and magnetic diffusivity profiles are the same as before, but here the \(\alpha \)-effect is now (even more artificially) concentrated towards the equator, by imposing a latitudinal dependency \(\alpha \sim \sin (4\theta )\) for \(\pi /4\le \theta \le 3\pi /4\), and zero otherwise.

A representative interface dynamo model in spherical geometry. This solution has \(C_\varOmega =2.5\times 10^5\), \(C_\alpha =+10\), and a core-to-envelope diffusivity contrast of \(10^{-2}\). Panel a shows a series of radial cuts of the toroidal field at latitude \(15^\circ \). The (normalized) radial profiles of magnetic diffusivity, \(\alpha \)-effect, and radial shear are also shown, again at latitude \(15^\circ \). The core–envelope interface is again at \(r/R=0.7\) (dotted line), where the magnetic diffusivity varies near-discontinuously. Panels b and c show the variations of the core-to-envelope peak toroidal field strength and dynamo period with the diffusivity contrast, for a sequence of otherwise identical dynamo solutions. Adapted from Living Review of Charbonneau (2010).
This model does achieve the kind of toroidal field amplification one would like to see in interface dynamos. Notice how the toroidal field peaks below the core–envelope interface (vertical dotted line), well below the \(\alpha \)-effect region and near the peak in radial shear. Figure 3.11b shows how the ratio of peak toroidal field below and above \(r_c\) varies with the imposed diffusivity contrast \(\varDelta \eta \). The dashed line is the dependency expected from Eq. (3.52). For a relatively low diffusivity contrast, \(-1.5\le \log (\varDelta \eta )\lesssim \ 0\), both the toroidal field ratio and dynamo period increase as \(\sim \ (\varDelta \eta )^{-1/2}\). Below \(\log (\varDelta \eta )\sim -1.5\), the max\((B)\)-ratio increases more slowly, and the cycle period falls, as can be seen on Fig. 3.11c. This is basically an electromagnetic skin-depth effect; unlike in the original picture proposed by Parker, here the poloidal field must diffuse down a finite distance into the tachocline before shearing into a toroidal component can commence. With this distance set by our adopted profile of \(\varOmega (r,\theta )\), as \(\varDelta \eta \) becomes very small there comes a point where the dynamo period is such that the poloidal field cannot diffuse as deep as the peak in radial shear in the course of a half cycle. The dynamo then runs on a weaker shear, thus yielding a smaller field strength ratio and weaker overall cycle.
3.3 Babcock–Leighton Models
Solar cycle models based on what is now called the Babcock–Leighton mechanism were first developed in the early 1960s, yet they were temporarily eclipsed by the rise of mean-field electrodynamics a few years later. Their revival was motivated in part by the fact that synoptic magnetographic monitoring over solar cycles 21 and 22 has offered strong evidence that the surface polar field reversals are triggered by the decay of active regions (see Fig. 3.4). The crucial question is whether this is a mere side-effect of dynamo action taking place independently somewhere in the solar interior, or a dominant contribution to the dynamo process itself.
Figure 3.12 illustrates the basic idea of the Babcock–Leighton mechanism. Consider the bipolar magnetic regions (BMR) sketched on the left. Recall that each of these is the photospheric manifestation of a toroidal flux rope emerging as an \(\varOmega \)-loop (see Fig. 3.3). The leading (trailing) component of each BMR is that located ahead (behind) with respect to the direction of the sun’s rotation. Joy’s law states that, on average, the leading component is located at lower latitude than the trailing component, so that a line joining each component of the pair makes an angle with respect to the E–W line. Hale’s polarity law also informs us that the leading/trailing magnetic polarity pattern is opposite in each hemisphere, a reflection of the equatorial antisymmetry of the underlying toroidal flux system. Horace W. Babcock (1912–2003) demonstrated empirically from his early magnetographic observation of the sun’s surface magnetic field that as the BMRs decay (presumably under the influence of turbulent convection), the trailing components drift to higher latitudes, leaving the leading components at lower latitudes, as sketched on Fig. 3.12 (middle). Babcock also argued that the trailing polarity flux released to high latitude by the cumulative effects of the emergence and subsequent decay of many BMRs was responsible for the reversal of the sun’s large-scale dipolar field (right).

Cartoon of the Babcock–Leighton mechanism. At left, a number of bipolar magnetic regions (BMR) have emerged, with opposite leading/following polarity patterns in each hemisphere, as per Hale’s polarity law. After some time (middle), the BMRs have started decaying, with the leading components experiencing diffusive cancellation across the equator, while the trailing components have moved to higher latitudes. At later time, (right), the net effect is the buildup of an hemispheric flux of opposite polarity in the N and S hemisphere, i.e., a net dipole moment (see text). Diagram kindly provided by D. Passos.
More germane from the dynamo point of view, the Babcock–Leighton mechanism taps into the (formerly) toroidal flux in the BMRs to produce a poloidal magnetic component. To the degree that a positive dipole moment is being produced from a toroidal field that is positive in the N–hemisphere, this is a bit like a positive \(\alpha \)-effect in mean-field theory. In both cases the Coriolis force is the agent imparting a twist on a magnetic field; with the \(\alpha \)-effect this process occurs on the small spatial scales and operates on individual magnetic fieldlines. In contrast, the Babcock–Leighton mechanism operates on the large scales, the twist being imparted via the the Coriolis force acting on the flow generated along the axis of a buoyantly rising magnetic flux tube.
3.3.1 Sunspot Decay and the Babcock–Leighton Mechanism
Evidently this mechanism can operate as sketched on Fig. 3.12 provided the magnetic flux in the leading and trailing components of each (decaying) BMR are separated in latitude faster than they can diffusively cancel with one another. Moreover, the leading components must end up at low enough latitudes for diffusive cancellation to take place across the equator. This is not trivial to achieve, and we now take a more quantitative look at the Babcock–Leighton mechanism, first with a simple 2D numerical model.
The starting point of the model is the grand sweeping assumption that, once the sunspots making up the bipolar active region lose their cohesiveness, their subsequent evolution can be approximated by the passive advection and resistive decay of the radial magnetic field component. This drastic simplification does away with any dynamical effect associated with magnetic tension and pressure within the spots, as well as any anchoring with the underlying toroidal flux system. The model is further simplified by treating the evolution of \(B_r\) as a two-dimensional transport problem on a spherical surface corresponding to the solar photosphere. Consequently, no subduction of the radial field can take place.
Even under these simplifying assumptions, the evolution is still governed by the MHD induction equation, specifically its \(r\)-component. The imposed flow is made of an axisymmetric surface “meridional circulation”, basically a poleward-converging flow in the latitudinal direction on the sphere, and differential rotation in the azimuthal direction:
where \(\varOmega _S\) is the solar-like surface differential rotation profile used in the preceding chapter (see Eq. 2.28). Note that in general \(\nabla \cdot {\varvec{u}}\not =0\) here, a direct consequence of working on a spherical surface without possibility of subduction. The \(r\)-component of the induction equation is cast in non-dimensional form, by expressing length in units of the solar radius \(R\), and time in units of \(\tau _\mathrm{c}=R/u_{0}\), i.e., the advection time associated with the meridional flow. Introducing a new latitudinal variable \(\mu =\cos \theta \), neglecting all radial derivatives, and evaluating the resulting expression at \(r/R=1\) results inFootnote 9:
The solutions are defined in terms of the two nondimensional numbers:
with \(u_0\) a characteristic speed for the meridional flow, and \(\eta \) the net magnetic diffusivity, assumed constant over the spherical surface defining the solution domain. Using \(\varOmega _0=3\times 10^{-6}\,\)rad s\(^{-1}\), \(u_{0}=15\,\)m s\(^{-1}\), and \(\eta =6\times 10^{8}\,\)m\(^2\)s\(^{-1}\) yields \(\tau _\mathrm{c}\simeq 1.5\,\)yr, \(\mathrm{R}_\mathrm{m}\simeq 20\) and \(\mathrm{R}_\mathrm{u}\simeq 10^{-2}\). The former is really a measure of the (turbulent) magnetic diffusivity, and is the only free parameter of the model, as \(u_{0}\) is well constrained by surface Doppler measurements. The corresponding magnetic diffusion time is \(\tau _{\eta }=R^2/\eta \simeq 26\,\)yr, so that \(\tau _\mathrm{c}/\tau _{\eta }\ll 1\).

Evolution (a–f) of the surface radial magnetic field for two sets of four BMRs equally spaced in longitude, and initially located at latitudes \({\pm } 15^\circ \), with opposite polarity ordering in each hemisphere, as per Hale’s polarity laws. The surface field evolves in response to diffusion and advective transport by differential rotation and a poleward meridional flow, as described by the 2D advection-diffusion equation (3.54). Parameter values are \(\mathrm{R}_\mathrm{u}=10^{-2}\) and \(\mathrm{R}_\mathrm{m}=50\), with time given in units of the meridional flow’s characteristic time \(\tau _\mathrm{c}=R/u_{0}\).
Figure 3.13 shows a representative solution,Footnote 10 computed assuming a simple analytic form for the meridional flow, namely \(u_{\theta }(\theta )=2u_0\sin \theta \cos \theta \). The initial condition (panel a, \(t=0\)) describes a series of eight BMRs, four per hemisphere, equally spaced \(90^\circ \) apart at latitudes \(\pm 15^\circ \). Each BMR consists of two Gaussian profiles of opposite sign and adding up to zero net flux, with angular separation \(d=10^\circ \) and with a line joining the center of the two Gaussians tilted with respect to the E–W directionFootnote 11 by an angle \(\gamma \), itself related to the latitude \(\theta _0\) of the BMR’s midpoint according to the Joy law-like relation:
The symmetry of the flow and initial condition on \(B_r(\theta ,\phi )\) means that the problem can be solved in a single hemisphere with \(B_r=0\) enforced in the equatorial plane, in a \(90^\circ \) wide longitudinal wedge with periodic boundary conditions in \(\phi \).
The combined effect of circulation, diffusion and differential rotation is to concentrate the magnetic polarity of the trailing “spot” to high latitude. The polarity of the leading spot dominates at lower latitudes, but experiences diffusive cancellation with the opposite polarity leading flux from its “cousin” in the other solar hemisphere. It is this cross-equatorial diffusive cancellation that is ultimately responsible for the buildup of a net hemispheric flux. At mid-latitudes, the effect of differential rotation is to stretch longitudinally the unipolar regions originally associated with each member of the BMR, causing the development of thin banded structures of opposite magnetic polarities. This leads to thus enhanced dissipation, much like in the cellular flow problem considered earlier in Sect. 2.3.
The combined effects of these advection-diffusion processes is to separate in latitude the two polarities of the BMR. This is readily seen upon calculating the longitudinally averaged latitudinal profiles of \(B_r\), as shown on Fig. 3.14 for the same six successive epochs corresponding to the snapshots on Fig. 3.13. The poleward displacement of the trailing polarity “bump” is the equivalent to Babcock’s original cartoon (cf. Fig. 3.12). The time required to achieve this here is \(t/\tau _\mathrm{c}\sim 1\), and scales as \((\mathrm{R}_\mathrm{m}/\mathrm{R}_\mathrm{u})^{1/3}\). The significant amplification of the trailing polarity bump from \(t/\tau _\mathrm{c}\gtrsim 0.5\) onward is a direct consequence of magnetic flux conservation in the poleward-converging meridional flow. Notice also the strong latitudinal gradient in \(B_r\) at the equator (dotted line) early in the evolution; the associated trans-equatorial diffusive polarity cancellation affects preferentially the leading spots of each pairs, since the trailing spots are located slightly farther away from the equator.

Latitudinal profile of the longitudinally averaged vertical magnetic field, at the six epochs plotted on Fig. 3.13. The strong signal at \(t=0\) results entirely from the slight misalignment of the emerging BMRs with respect to the E–W direction. By one turnover time, two polar caps of oppositely-signed magnetic field have built up, amounting to a net dipole moment (see text).
Consider again the mean signed and unsigned magnetic flux:
where the averaging operator is now defined on the spherical surface, for the Northern and Southern hemispheres separately:
Figure 3.15 shows the time-evolution of the signed (\(\varPhi \), solid line) and unsigned (\(F\), dashed) fluxes in the Northern hemisphere, for the solution of Fig. 3.13. The unsigned flux decreases rapidly at first, then settles into a slower decay phase. Meanwhile a small but significant hemispheric signed flux is building up. This is a direct consequence of (negative) flux cancellation across the equator, mediated by diffusion, and is the Babcock–Leighton mechanism in action. Note the dual, conflicting role of diffusion here; it is needed for cross-hemispheric flux cancellation, yet must be small enough to allow the survival of a significant trailing polarity flux on timescales of order \(\tau _\mathrm{c}\).

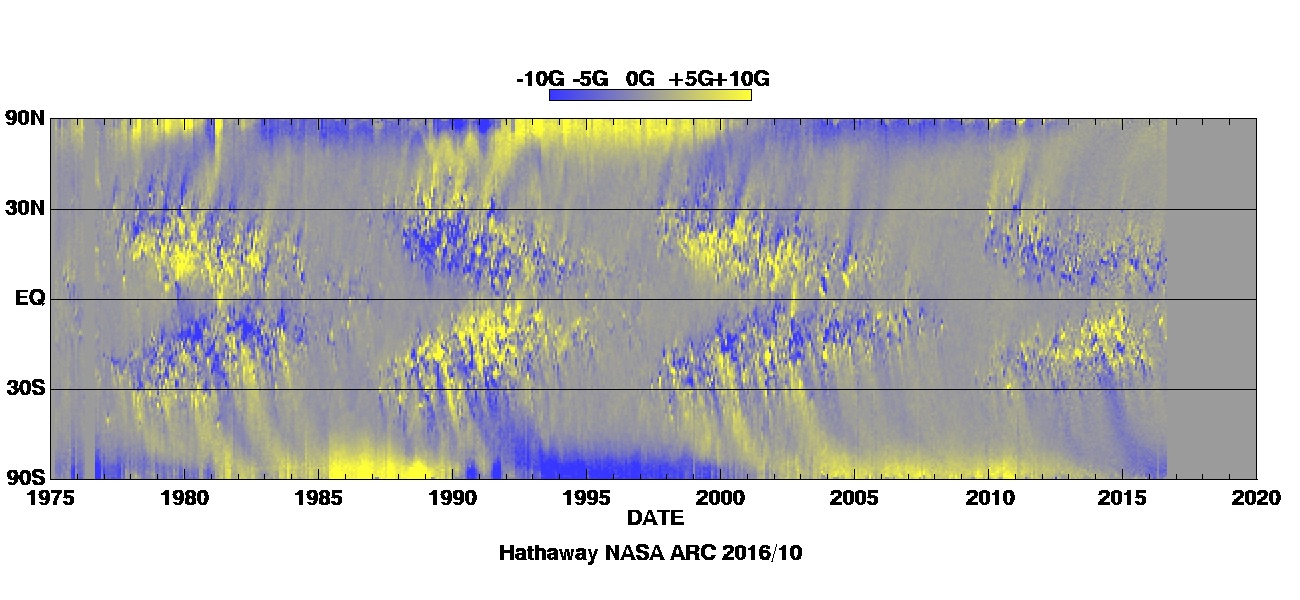
The efficiency (\(\varXi \)) of the Babcock–Leighton mechanism, i.e., converting toroidal to poloidal field, can be defined as the ratio of the signed flux at \(t=\tau _\mathrm{c}\) to the BMR’s initial unsigned flux:
Note that \(\varXi \) is independent of the assumed initial field strength of the BMRs since Eq. (3.54) is linear in \(B_r\). Looking back at Fig. 3.15, one would eyeball the efficiency at about 1% in converting the BMR flux to polar cap signed flux. This conversion efficiency turns out to be a rather complex function of BMR parameters; it is expected to grow as with increasing tilt \(\gamma \), and therefore should increase with latitudes as per Joy’s law, yet proximity to the equator favors trans-equatorial diffusive flux cancellation of the leading component; moreover, having \( \mathrm{d}u_{\theta } / \mathrm{d}\theta <0\) favors the separation of the two BMR components, thus minimizing diffusive flux cancellation between the leading and trailing components. These competing effects lead to a toroidal-to-poloidal conversion efficiency peaking for BMRs emerging at fairly low latitudes, the exact value depending on the latitudinal variation of the adopted surface meridional flow profile. At any rate, we noted already (Sect. 3.1) that the sun’s polar cap flux peaks at solar minimum, at a value amounting to \({\sim }\ 0.1\,\)% of the cycle-integrated active region (unsigned) flux; the efficiency required of the Babcock–Leighton mechanism is indeed quite modest.
3.3.2 Axisymmetrization Revisited
Take another look at Fig. 3.13; at \(t=0\) (panel a) the surface magnetic field distribution is highly non-axisymmetric. By \(t/\tau _\mathrm{c}=0.7\) (panel e), however, the field distribution shows a far less pronounced \(\phi \)-dependency, especially at high latitudes where in fact \(B_r\) is nearly axisymmetric, and by \(t/\tau _\mathrm{c}=1\) (panel f) there is little non-axisymmetric field left over the surface. This should remind you of something we encountered earlier: axisymmetrization of a non-axisymmetric magnetic field by an axisymmetric differential rotation (Sect. 2.3.5), the spherical analog of flux expulsion. In fact a closer look at the behavior of the unsigned flux on Fig. 3.15 (dashed line) already shows a hint of the two-timescale behavior we have come to expect of axisymmetrization: the rapid destruction of the non-axisymmetric flux component and slower (\({\sim }\ \tau _{\eta }\)) diffusive decay of the remaining axisymmetric flux distribution.
Since the spherical harmonics represent a complete and nicely orthonormal functional basis on the sphere, it follows that the initial condition for the simulation of Fig. 3.13 can be written as
where the \(Y_{lm}\)’s are the spherical harmonics:
and with the coefficients \(b_{lm}\) given by
where the “\(*\)” indicates complex conjugation. Now, axisymmetrization will wipe out all \(m\not =0\) modes, leaving only the \(m=0\) modes to decay away on the slower diffusive timescale.Footnote 12 Therefore, at the end of the axisymmetrization process, the radial field distribution now has the form:
which now describes an axisymmetric poloidal magnetic field.Footnote 13 Voilà!
3.3.3 Dynamo Models Based on the Babcock–Leighton Mechanism
So now we understand how the Babcock–Leighton mechanism can convert a toroidal magnetic field into a poloidal component, and therefore act as a poloidal source term in Eq. (2.61). Now we need to construct a solar cycle model based on this idea. One big difference with the \(\alpha \varOmega \) models considered in Sect. 3.2 is that the two source regions are now spatially segregated: production of the toroidal field takes place in the tachocline, as before, but now production of the poloidal field takes place in the surface layers.

Operation of a solar cycle model based on the Babcock–Leighton mechanism. The diagram is drawn in a meridional quadrant of the sun, with streamlines of meridional circulation plotted in blue. Poloidal field having accumulated in the surface polar regions (“A”) at cycle \(n\) must first be advected down to the core–envelope interface (dotted line) before production of the toroidal field for cycle \(n+1\) can take place (B\(\rightarrow \)C). Buoyant rise of flux rope to the surface (C\(\rightarrow \)D) is a process taking place on a much shorter timescale. From Living Review of Charbonneau (2010).
The mode of operation of a generic solar cycle model based on the Babcock–Leighton mechanism is illustrated in cartoon form on Fig. 3.16. Let \(P_n\) represent the amplitude of the high-latitude, surface (“A”) poloidal magnetic field in the late phases of cycle \(n\), i.e., after the polar field has reversed. The poloidal field \(P_n\) is advected downward by meridional circulation (A\(\rightarrow \)B), where it then starts to be sheared by the differential rotation while being also advected equatorward (B\(\rightarrow \)C). This leads to the growth of a new low-latitude (C) toroidal flux system, \(T_{n+1}\), which becomes buoyantly unstable (C\(\rightarrow \)D) and starts producing sunspots (D), which subsequently decay and release the poloidal flux \(P_{n+1}\) associated with the new cycle \(n+1\). Poleward advection and accumulation of this new flux at high latitudes (D\(\rightarrow \)A) then obliterates the old poloidal flux \(P_n\), and the above sequence of steps begins anew. Meridional circulation clearly plays a key role in this “conveyor belt” model of the solar cycle, by providing the needed link between the two spatially segregated source regions. Under this configuration, Babcock–Leighton solar cycle models operate as flux-transport dynamos.
3.3.4 The Babcock–Leighton Poloidal Source Term
The definition of the Babcock–Leighton source term \(S\) to be inserted in Eq. (2.61) is evidently the crux of the model. The dynamo solutions presented in what follows use the following:
with
where \(s_0\) is a numerical coefficient setting the strength of the source term (corresponding dynamo number being \(C_S=s_0R/\eta _e\)), and with the various remaining numerical coefficients taking the values \(r_2/R=0.95\), \(r_3/R=1\), \(d_2/R=d_3/R=10^{-2}\), \(B_1=6\), \(B_2=10\), \(w_1=2\), and \(w_2=8\), the latter four all measured in tesla. Note that the dependency on \(B\) is non-local, i.e., it involves the toroidal field evaluated at the core–envelope interface \(r_c\), (but at the same polar angle \(\theta \)). This nonlocality in \(B\) represents the fact that the strength of the source term is proportional to the field strength in the bipolar active region, itself presumably reflecting the strength of the diffuse toroidal field near the core–envelope interface, where the magnetic flux ropes eventually giving rise to the bipolar active region originate. The combination of error functions in Eq. (3.67) restricts the operating range of the model to a finite interval in toroidal field strength, and is motivated by simulations of the stability and buoyant rise of thin flux tubes, as discussed in Sect. 3.1.4. Other equally reasonable prescriptions and modelling approaches are of course possible (see bibliography at the end of this chapter).
At any rate, inserting this source term into Eq. (2.61) is what we need to bypass Cowling’s theorem and produce a viable dynamo model. The nonlocality of \(S\) notwithstanding, at this point the model equations are definitely mean-field like. Yet no averaging on small scales is involved. What is implicit in Eq. (3.64) is some sort of averaging process at least in longitude and time, over many BMR emergences.
3.3.5 A Sample Solution
Figure 3.17 shows a series of meridional quadrant snapshot of one such Babcock–Leighton dynamo solution, in the now usual format.Footnote 14 The figure covers a half-cycle, corresponding to one sunspot cycle, starting approximately at the time one would identify as sunspot minimum, with sunspot maximum (based on magnetic energy as a proxy for the sunspot number) occurring between panels (e) and (f), and reversal of the polar field shortly thereafter, between panels (f) and (g). As with the advection-dominated \(\alpha \varOmega \) solution of the preceding section, this solution is characterized by an equatorward propagation of the toroidal field in the tachocline driven by the meridional flow. The turnover time of the meridional flow is here again the primary determinant of the cycle period. With \(\eta _e=3\times 10^{7}\,\)m\(^2\,\)s\(^{-1}\), this solution has a nicely solar-like half-period of 12.4 yr. All in all, this is once again a reasonable representation of the cyclic spatiotemporal evolution of the solar large-scale magnetic field.
The strong toroidal fields building up within the polar regions of the tachocline in the course of the cycle (see panel c through g on Fig. 3.17) are entirely unrelated to the adopted latitudinal dependency of the Babcock–Leighton source term. It results instead from the strong polar field advected downwards by the meridional flow, inducing a toroidal component through the inductive action of both the latitudinal shear within the convective envelope, and the negative radial shear in the polar regions of the tachocline. Here this toroidal component mostly decays away under the influence of Ohmic dissipation, and contributes very little to the production of the next cycle’s poloidal component, which builds up at lower latitude (panel e) and is then carried poleward by the meridional flow (panels e\(\rightarrow \)h).

Snapshots (a–h) covering half a cycle of a Babcock–Leighton dynamo solution, as described in the text. Color coding of the toroidal field and poloidal fieldlines as on Fig. 3.7. This solution uses the same differential rotation, magnetic diffusivity and meridional circulation profile as for the advection-dominated \(\alpha \varOmega \) solution of Sect. 3.2.11, but now with the non-local surface source term defined through Eq. (3.64), with parameter values \(C_\alpha =5\), \(C_\varOmega =5\times 10^4\), \(\varDelta \eta =0.003\), \(\mathrm{R}_\mathrm{m}=840\). Note again the strong amplification of the surface polar fields, the latitudinal stretching of poloidal fieldlines by the meridional flow at the core–envelope interface.
Although it exhibits the desired equatorward propagation, the toroidal field butterfly diagram on Fig. 3.17 peaks at much higher latitude (\({\sim }\ 45^\circ \)) than the sunspot butterfly diagram (\({\sim }\ 15^\circ \)–\(20^\circ \)). This occurs because this is a solution with high magnetic diffusivity contrast, where meridional circulation closes at the core–envelope interface, so that the latitudinal component of differential rotation dominates the production of the toroidal field. This difficulty can be alleviated by letting the meridional circulation penetrate below the core–envelope interface, but this often leads to the production of a strong polar branch, again a consequence of both the strong radial shear present in the high-latitude portion of the tachocline, and of the concentration of the poloidal field taking place in the high latitude-surface layer prior to this field being advected down into the tachocline by meridional circulation (viz. Figs. 3.16 and 3.17). Another interesting option to avoid excessive polar field amplification is to rely on turbulent pumping to carry the surface field downward into the convection zone faster than it can accumulate at the poles.
A noteworthy property of this class of model is the dependency of the cycle period on model parameters; over a wide portion of parameter space, the meridional flow speed is found to be the primary determinant of the cycle period (\(P\)). This behavior arises because, in these models, the two source regions are spatially segregated, and the time required for circulation to carry the poloidal field generated at the surface down to the tachocline is what effectively sets the cycle period. The corresponding time delay introduced in the dynamo process has rich dynamical consequences, to be discussed in Sect. 4.4 below. On the other hand, \(P\) is found to depend very weakly on the assumed values of the source term amplitude \(s_0\), and turbulent diffusivity \(\eta _e\); this is very much unlike the behavior typically found in mean-field models, where \(P\) scales nearly as \(\eta _e^{-1}\) in \(\alpha \)-quenched \(\alpha \varOmega \) mean-field models.
3.4 Models Based on HD and MHD Instabilities
In the presence of stratification and rotation, a number of hydrodynamical (HD) and magnetohydrodynamical instabilities associated with the presence of a strong toroidal field in the stably stratified, radiative portion of the tachocline can lead to the growth of disturbances with a net kinetic helicity. Under suitable circumstances, such disturbances can act upon a pre-existing large-scale magnetic field component to produce a toroidal electromotive force, and therefore act as a source of poloidal field.
Different types of solar cycle models have been constructed in this manner, two promising ones being briefly reviewed in this section. In both cases the resulting dynamo models end up being described by something closely resembling our now well-known axisymmetric mean-field dynamo equations, the novel poloidal field regeneration mechanisms being once again subsumed in an \(\alpha \)-effect-like source term appearing of the RHS of Eq. (2.61).
3.4.1 Models Based on Shear Instabilities
Hydrodynamical stability analyses of the latitudinal shear profile in the solar tachocline indicate that the latter may be unstable to non-axisymmetric perturbations, with the instabilities planforms characterized by a net kinetic helicity. Loosely inspired by Eq. (3.16), this allows the construction of an azimuthally-averaged \(\alpha \)-effect-like source term that is directly proportional to the large-scale toroidal magnetic field component, just as in mean-field electrodynamics. The associated dynamo model is then described by the \(\alpha \varOmega \) form of the mean-field dynamo equations, including the meridional flow for the specific model considered here.

Time–latitude “butterfly” diagrams of the toroidal field at the core–envelope interface (top), and surface radial field (bottom) for a representative dynamo solution with the tachocline \(\alpha \)-effect of Dikpati and Gilman (2001). This solution has a solar-like half-period of 11 yr. Note how the deep toroidal field peaks at very low latitudes, in good agreement with the sunspot butterfly diagram. For this solution the equatorial deep toroidal field and polar surface radial field lag each other by \({\sim }\ \pi \), but other parameter settings can bring this lag closer to the observed \(\pi /2\). Diagrams kindly provided by M. Dikpati.
Figure 3.18 shows representative time-latitude diagrams of the toroidal magnetic field at the core–envelope interface, and surface radial field, for a flux transport dynamo solution based on this poloidal source mechanism. This is a solar-like solution with a mid-latitude surface meridional (poleward) flow speed of 17 m s\(^{-1}\), envelope diffusivity \(\eta _e=5\times 10^{7}\,\)m\(^2\) s\(^{-1}\), a core-to-envelope magnetic diffusivity contrast \(\varDelta \eta =10^{-3}\), and a simple \(\alpha \)-quenching-like amplitude-limiting nonlinearity.Footnote 15 Note the equatorward migration of the deep toroidal field, set here by the meridional flow in the deep envelope, and the poleward migration and intensification of the surface poloidal field, again a direct consequence of advection by meridional circulation, as in the mean-field dynamo models discussed in Sect. 3.2.11 in the advection-dominated, high \(\mathrm{R}_\mathrm{m}\) regime. The three-lobe structure of each spatiotemporal cycle in the butterfly diagram reflects the latitudinal structure in kinetic helicity profiles associated with the instability planforms.
The primary weakness of these models, in their present form, is their reliance on a linear stability analysis that altogether ignores the destabilizing effect of magnetic fields, especially since stability analyses have shown that the MHD version of the instability is easier to excite for toroidal field strengths of the magnitude believed to characterize the solar tachocline. Moreover, the planforms in the MHD version of the instability are highly dependent on the assumed underlying toroidal field profile, so that the kinetic helicity can be expected to (1) have a time-dependent latitudinal distribution, and (2) be intricately dependent on the mean toroidal field in a manner that is unlikely to be reproduced by a simple amplitude-limiting quenching formula.
3.4.2 Models Based on Flux-Tube Instabilities
As briefly discussed in Sect. 3.1, modelling of the rise of thin toroidal flux tubes (or ropes) throughout the solar convection zone has met with great success, in particular in reproducing the latitudes of emergence and tilt angles of bipolar sunspot pairs. It is also possible to use the thin-flux tube approximation to study the stability of toroidal flux ropes stored immediately below the base of the convection zone, to investigate the conditions under which they can actually be destabilized and give rise to sunspots. Once the tube destabilizes, calculations show that under the influence of rotation, the correlation between the flow and field perturbations is such as to yield a mean azimuthal electromotive force, equivalent to a positive \(\alpha \)-effect in the N–hemisphere.
Figure 3.19 shows a stability diagram for this flux tube instability, in the form of growth rate contours in a 2D parameter space comprised of flux tube strength and latitudinal position at the core–envelope interface. The key is now to identify regions where weak instability arises (growth rates \({\gtrsim } 1\,\)yr). In the case shown on Fig. 3.19, these regions are restricted to flux tube strengths in the approximate range 6–15 T.

Stability diagram for toroidal magnetic flux tubes located in the overshoot layer immediately beneath the core–envelope interface. The plot shows contours of growth rates in the latitude-field strength plane. The gray scale encodes the azimuthal wavenumber of the mode with largest growth rate, and regions left in white are stable. Dynamo action is associated with the regions with growth rates \({\sim }\ 1\,\)yr, here labeled I and II. Region III is associated with the rapid destabilisation, buoyant rise and emergence of magnetic flux, without significant dynamo action. Diagram kindly provided by A. Ferriz-Mas.
Although it has not yet been comprehensively studied, this dynamo mechanism has a number of very attractive properties. It operates without difficulty in the strong field regime (in fact in requires strong fields to operate). It also naturally yields dynamo action concentrated at low latitudes. Difficulties include the need of a relatively finely tuned magnetic diffusivity to achieve a solar-like dynamo period, and a relatively finely-tuned level of subadiabaticity in the overshoot layer for the instability to kick on and off at the appropriate toroidal field strengths.
The effects of meridional circulation in this class of dynamo models has yet to be investigated; this should be particularly interesting, since both analytic calculations and numerical simulations suggest a positive \(\alpha \)-effect in the Northern-hemisphere, which should then produce poleward propagation of the dynamo wave at low latitude. Meridional circulation could then perhaps produce equatorward propagation of the dynamo magnetic field even with a positive \(\alpha \)-effect, as it does in true mean-field models (cf. Sect. 3.2.11).
As an interesting aside, note on Fig. 3.19 how, except in a narrow range of field strengths around \({\sim }\ 7\,\)T, flux tubes located at high latitudes are always stable; this is due to the stabilizing effect of magnetic tension associated with high curvature of the toroidal flux ropes. Even if flux ropes were to form there, they may not necessarily show up at the surface as sunspots. This should be kept in mind when comparing time-latitudes diagrams produced by this or that dynamo model to the sunspot butterfly diagram; the two may not map onto one another as well as often implicitly assumed.
3.5 Global MHD Simulations
After this grand tour of (relatively) simple solar cycle models, it is worth briefly looking at the theoretical “real thing”, namely global MHD simulations of thermally-driven convection in a thick, stratified rotating spherical shell, across which a solar heat flux is forced to flow. We focus in what follows on a specific set of simulations carried out in the anelastic regime.Footnote 16 The simulation domain includes most of the convection zone (here \(0.718\lesssim t/R\lesssim 0.96\)), as well as a stably stratified fluid layer underneath (\(0.61\lesssim r/R\lesssim 0.718\)). The background stratification is solar-like, and covers 4 scale heights in density, and radiation is treated in the diffusion approximation, as in Eq. (1.81).

Time series of kinetic and magnetic energy densities in a 3D anelastic MHD simulation of thermally-driven convection in a thick, stratified rotating spherical shell. Part a is a closeup on the first 150 solar days (one solar day \(\equiv 30\) terrestrial days), and part b shows the evolution over 2,000 solar days (\({\equiv } 165\,\)yr). The phase of exponential growth in the magnetic energy (\(5\lesssim t\lesssim 15\), slanted dotted line segment) begins once the convection has attained a statistically stationary state. The slower growth kicking in at \(t\simeq 50\) is associated with the buildup of a large-scale magnetic component, which eventually develops cyclic polarity reversals, leading to the long-timescale modulation of the magnetic energy time series visible on part b.

Mollweide projections of the radial components of the flow velocity (top) and magnetic field (middle) on a spherical surface near the top of the simulation domain. Flow speeds are color-coded in m s\(^{-1}\), and field strengths in tesla. Note the asymmetry in the upflow/downflow structures, and the relatively small spatial scale of the subsurface magnetic field. The bottom Mollweide projection shows the zonal magnetic component immediately beneath the base of the convective envelope, where a strong and well-organized axisymmetric component is already building up after 200 solar days. Adapted from Ghizaru et al. (2010) by permission of the AAS.
Figure 3.20 shows time series of the kinetic and magnetic energies in a typical simulation, starting from a static, unmagnetized configuration (\(\varvec{u}=0\), \(\varvec{B}=0\)) with small random seed magnetic field and velocity perturbation introduced at \(t=0\). Thermal convection sets in very rapidly, and leads to a rapid growth of kinetic energy across the convectively unstable part of the simulation domain in the first few solar days (\(1\,\)sd \(\equiv 30\,\) Earth days). Once convection has reached a statistically stationary state, small-scale dynamo action powered by this turbulent flow commences, and leads to the exponential growth of magnetic energy. Here, this phase of exponential growth lasts up to \({\sim }\ 15\) solar days, after which the Lorentz force starts to backreact on the turbulent flow, leading to a saturation of the magnetic energy reminiscent of \(\alpha \)-quenching (cf. Fig. 3.8), and completed at \({\sim }\ 20\) solar days.
Figure 3.21 shows snapshots at \(t=100\,\)sd of the radial flow (top) and magnetic field (middle) components extracted near the top of the simulation domain. The morphological asymmetry between the broad, diffuse upflows and narrow concentrated downflows is quite typical of thermally-driven convection in a stratified environment. The magnetic field is swept horizontally in the broad areas of upflows and ends up preferentially concentrated in regions where downflow lanes meet, a feature that is typical of MHD convection. As with the CP flow solutions considered earlier, the subsurface magnetic field is spatially and temporally very intermittent, and is characterized by significant magnetic energy but very little net magnetic flux on large spatial scales.Footnote 17
By this time, at least on the basis of these energy time series, one would judge the system to have reached a statistically stationary state. However, integrating further in time reveals variations setting in on longer timescales, associated with the slow buildup of a large-scale magnetic field carrying a net flux on those scales. This slower buildup is already apparent on Fig. 3.20. By about 100 solar days, the large-scale component has reached a strength such that it begins to quench the differential rotation having built up in the earlier phases of the simulation through the action of turbulent Reynolds stresses. This leads to a \({\sim }\ 20\)% drop in the kinetic energy density, from \({\sim }\ 270\) to \(230\,\)J kg\(^{-1}\) at \(t\simeq 150\) solar days.
This spatially well-organized magnetic component is particularly prominent at and beneath the base of the convective envelope, where the significant differential rotation, stably stratified environment, and injection of magnetic fields from above by downward turbulent pumping, all conspire to favor the buildup and accumulation of magnetic flux. The bottom Mollweide projection on Fig. 3.21 shows the zonal magnetic component at a depth slightly below the base of the convective envelope, at a later time in the simulation. Here the zonally-averaged toroidal field is seen to be well-organized on the larger scales, and in particular shows a clear antisymmetry with respect to the equatorial plane, in agreement with inferences made on the basis of Hale’s polarity laws. Even though the stratification is convectively stable at this depth, convective undershoot from above introduces strong local fluctuations in the magnetic field, without however destroying its large-scale organization.

Top: Time–latitude diagram of the zonally-averaged toroidal magnetic field at a depth corresponding to the interface between the convectively unstable layers and the underlying stable region. Note the antisymmetry of the large-scale field about the equatorial plane, the regular polarity reversals fairly synchronous across hemispheres, and the hint of equatorward migration of the toroidal field in the course of each cycle. The middle panel shows a time–radius cut of the same at mid-latitudes in the Southern hemisphere, with the dashed line marking the base of the convecting shell. Although the toroidal field pervades the whole convecting layers, it becomes strongly concentrated immediately beneath the convecting layers. The bottom panel shows a time–latitude diagram for the surface radial component. The latter reveals a well-defined axisymmetric dipole moment, oscillating essentially in phase with the deep-seated toroidal component. The color scale codes the magnetic field strength, measured in tesla. Compare to Fig. 3.4. From Racine et al. (2011) by permission of the AAS.
What is truly remarkable is that this large-scale toroidal field undergoes fairly regular solar-like polarity reversals on multi-decadal timescales. This is shown on Fig. 3.22, in the form of a time–latitude diagram of the zonally-averaged toroidal magnetic component at the core–envelope interface (top), time–radius diagram of the same at 45\(^\circ \) in the Southern hemisphere (middle), and a time–latitude diagram of the zonally-averaged surface radial magnetic component (bottom). This simulation spans 336 yr, in the course of which 11 polarity reversals have taken place, with a mean (half-) period of almost exactly 30 yr here. Examination of the top panel on Fig. 3.22 reveals a tendency for equatorward migration in the course of each cycle. The middle panel reveals that the cycles begin well within the convective envelope, with later accumulation and intensification of the toroidal component at and immediately beneath the core–envelope interface, where the toroidal field strength can peak at almost half a tesla for the stronger cycles. The bottom panel on Fig. 3.22 also shows the existence of a well-defined dipole moment aligned with the rotational axis, reversing polarity approximately in phase with the deep-seated toroidal component. Note also how, despite significant fluctuations in the amplitude and timing of the cycle in each hemisphere, in general both hemispheres remain well-synchronized throughout the whole simulation. This is all extremely solar-like!

Zonally averaged angular velocity profiles plotted over a meridional plane, in a a hydrodynamical (unmagnetized) version of the simulation and b with the equivalent profiles in the MHD simulation. The rotation axis is oriented vertically, and the dashed circular arc indicates the base of the convectively unstable layers (\(r/R=0.718\)). Note the sharpness of the transition in angular velocity at this depth in the unmagnetized simulation and the much reduced pole-to-equator contrast in the MHD simulation.
What kind of dynamo could this be? To answer this question we need first to look in more detail at the flow fields. Figure 3.23 shows zonally averaged angular velocity profiles plotted in meridional \([r,\theta ]\) planes. Panel a shows the corresponding profile for an unmagnetized version of the simulation of Fig. 3.22, running in the same parameter regime and subjected to the same thermal forcing. The latter is characterized by a differential rotation profile that shows a number of helioseismically-inferred solar-like features, notably equatorial acceleration and polar decceleration with a \({\sim }\ 25\)% contrast, with near-radial \(\varOmega \)-isocontours at mid- to high latitudes. At these latitudes the latitudinal differential rotation vanishes abruptly in the stable layers, the transition taking place across a thin, tachocline-like shear layer coinciding with the base of the convecting layers. The most non-solar feature is the strong shear region prominent at low-latitudes within the convecting layers. The tendency for alignment of \(\varOmega \)-isocontours with with the rotation axis is a reflection of the Taylor–Proudman theorem, which states that in rotation-dominated systems (Coriolis term dominating over inertial and viscous terms on the RHS of Eq. (1.80)), the flow velocity cannot vary in the direction parallel to the rotation axis. In the MHD version of the simulation (Fig. 3.23b) equatorial acceleration remains, but the pole-to-equator angular velocity contrast falls to about one third of what is observed on the sun. This suggests that magnetically-mediated reduction of the large-scale flows is an important dynamo amplitude-limiting mechanism in this simulation, an inference supported by the fact that significant torsional oscillations are also present, varying on the same \({\sim }\ 30\,\)yr period as the large-scale magnetic field.
How about the regeneration of the large-scale poloidal component? In mean-field electrodynamics this takes place through the production of a mean electromotive force associated with the small-scale fluctuating flow and magnetic field. In the simulation considered here, the presence of a well-defined axisymmetric magnetic component suggests the definition of the “mean” flow and magnetic field through zonal averages:
The small-scale components then become defined by subtracting these mean quantities from the total flow and magnetic field vectors returned by the simulation:
(compare with Eq. (3.4)!). With \(\varvec{u}^\prime \) and \(\varvec{B}^\prime \) so defined, it is then a simple matter to calculate the mean emf directly via Eq. (3.8). With the mean emf and mean magnetic field in hand, one can then, at each grid point \((r_k,\theta _l)\) in the \([r,\theta ]\) plane, calculate the components of the \(\alpha \)-tensor through a simple least-square fit of the nine pairs of time series \(\{\mathcal{E }_i(t),\langle {B}\rangle _j(t)\}\). This is carried out by minimizing a residual defined as:

a The \({\phi \phi }\) component of the \(\alpha \)-tensor, as extracted from the numerical simulation. Note the hemispheric antisymmetry, and the sign change near the base of the convectively unstable shell. b The same, this time reconstructed according to Eq. (3.19), using the zonally-averaged kinetic helicity and current helicity profiles also extracted from the simulation and plotted on panels c and d, respectively. The two \(\alpha _{\phi \phi }\) components are remarkably similar here, even though this simulation is operating in a regime where the SOCA approximation is not expected to hold. From Racine et al. (2011) by permission of the AAS.
The result of this procedure is shown on Fig. 3.24a, for the \(\alpha _{\phi \phi }\) component, the primary source of large-scale poloidal fields in conventional mean-field models of the solar cycle. This components reproduces many of the features “predicted” by mean-field theory and also uncovered in local simulations of MHD turbulence with an imposed large-scale field: an \(\alpha \)-effect antisymmetric about the equatorial plane and positive in the Northern hemisphere, with a sign change in the bottom portion of the convecting layers. Moreover, the \(\alpha _{\phi \phi }\) tensor component is found to be proportional to the negative of kinetic helicity (plotted on panel c) to a good first approximation, in agreement with the prediction from mean-field theory in the SOCA approximation (cf. Eq. (3.16)). In fact, reconstructing the \(\alpha \)-tensor via Eq. (3.19), as shown on Fig. 3.24b, reveals that the current helicity (Fig. 3.24d) plays only a minor role here, with the kinetic helicity setting the spatial variations of the \(\alpha \)-tensor. This good agreement is quite surprising because the turbulence in this simulation is strongly inhomogeneous, strongly anisotropic, and is strongly influenced by the magnetic field, which violates the underlying assumptions on which SOCA is based.
The combination of a well-defined mean axisymmetric differential rotation and mean turbulent electromotive force producing a strong \(\alpha _{\phi \phi }\) tensor component would suggest that this simulation may be operating as the \(\alpha \varOmega \) dynamos considered earlier (Sect. 3.2). Moreover, the production of a positive dipole moment from a positive toroidal field in the Northern hemisphere (see Fig. 3.21) is indeed what one would associate in mean-field theory with a positive \(\alpha _{\phi \phi }\) in the Northern hemisphere. On the other hand, in this specific simulation the \(\alpha \)-tensor has all nine of its components showing comparable amplitudes, with significant turbulent pumping contributing to the spatiotemporal evolution of the large-scale magnetic field. This also reflects the fact that the poloidal component of the electromotive force is quite significant, having in fact here a magnitude comparable to the shearing term arising from differential rotation. This would then suggest the \(\alpha ^2\varOmega \) mode of dynamo action, although of a somewhat peculiar nature because here the large- and small-scale inductive contribution turn out to oppose each other throughout a large portion of the convection zone. This situation is not unique to this one specific simulation, having been noted already in other similar MHD simulations of solar/stellar convection using different modelling approaches.Footnote 18
3.6 Local MHD Simulations
Throughout this chapter we have encountered various dynamo models of the solar cycle, including a dynamically correct MHD simulation, each in their own way producing a large-scale magnetic field undergoing polarity reversals in a manner not too dissimilar to what is observed on the sun. We also argued in Sect. 2.7 that the small-scale magnetic field observed at the solar surface could well be produced by local, fast dynamo action powered by the vigorous surface and subsurface turbulent convection. Are we then in a situation where two distinct dynamos are operating in the solar convection zone, one producing the large-scale magnetic component traditionally associated with the solar cycle, and a second powering surface magnetism away from active regions?
Observational support for the idea of a local, subsurface dynamo mechanism can be found in the fact that a tally of observed solar surface magnetic structures reveals a frequency distribution taking the form of a power law spanning over five orders of magnitude in magnetic flux, with logarithmic slope \(-1.85\). This is a remarkable instance of scale invariance of the type most readily produced by fast dynamo action (cf. Fig. 2.19 and accompanying discussion). However, the presence of a scale-free distribution of magnetic structures at the solar surface does not necessarily imply fast dynamo action. Convective turbulence can reprocess magnetic flux originating elsewhere, be it deep in the convective envelope or through the decay of active regions. Likewise, surface flow can lead to the merging of magnetic structures, a process that is also self-similar and that can therefore, in principle, lead to a scale-free size distribution.
At and below the solar photosphere, the density scale height is small, convective velocities can approach the local sound speed, and radiation plays an important role in surface cooling; the anelastic approximation is no longer a viable option, and the MHD equations (1.79)–(1.82) must be solved in their fully compressible regime and with proper treatment of ionization and radiative transfer. Moreover, the spatial resolution must be high enough to capture granulation, the dominant surface convection pattern with a typical length scale of \({\sim }\ 10^3\,\)km, with intergranular downflow lanes an order of magnitude smaller (at least). This is well beyond the reach of the type of global dynamo simulations just discussed, but is accessible to local simulations modelling just a small portion of the convective envelope. Figure 3.25 gives an example of such a simulation, in the form of a snapshot of the “photosphere” showing emergent intensity (grayscale), on which are superimposed \(\pm 0.1\,\)T isocontours of vertical field strength. This is a \(1000\times 1000\times 490\) compressible MHD simulation, with \(48\,\)km horizontal resolution and going from the upper photosphere (optical depth 0.01) down to 20 Mm in depth. In this specific simulation, a uniform horizontal magnetic field of strength 0.1 T is advected into the simulation domain through the bottom boundary.
The granulation pattern is quite obvious on Fig. 3.25, with cells of hotter (brighter) rising fluids delineated by darker, narrow downflow lanes of colder fluid, the telltale signature typical of thermally-driven convection in a stratified environment. At this (relatively) late time in the simulation, some of the magnetic flux injected at the base has reached the photosphere. This magnetic field is swept horizontally by the granular flow and accumulates in intergranular lanes. Here the combination of flux emergence and surface evolution has managed to produce a few flux concentrations sufficiently large to impede convection and form the simulation’s equivalent of so-called pores (akin to small sunspots without penumbrae), where the strength of the vertical magnetic field reaches a few tenths of tesla. Notice also how many of the smaller magnetic structures, of size comparable to the width of downflow lanes and often seen where multiple downflow lanes meet, show an intensity excess above and beyond what is observed in the center of granules.

Snapshot of the \(48\times 48\,\)Mm top “horizontal” plane of a MHD numerical simulation of thermally-driven stratified turbulent convection, with a 0.1 T uniform, horizontal magnetic field injected at the base of the simulation box (depth 20 Mm). The gray scale codes the emergent radiative flux, on which contours of constant vertical magnetic field are superimposed (red/yellow for \(B_z=\pm 0.1\,\)T). Numerical simulation results kindly provided by R. F. Stein, Michigan State University.
Strictly speaking, this is not a dynamo, as magnetic flux is being continuously injected through the bottom boundary. In this simulation turbulent convection is mostly “reprocessing” this magnetic flux, through the now usual mechanisms of flux expulsion, constructive and destructive folding, shearing, stretching, etc. The formation of surface flux concentrations results from the accumulation of magnetic fields in convective downflow lanes, with associated merging or cancellation depending on the relative polarities of the field elements involved. The resulting distribution of surface magnetic flux is once again a power-law, and would be very hard to distinguish from that produced exclusively by fast dynamo action driven by turbulent convection, as discussed earlier in Sect. 2.7. This highlights the difficulty to distinguish observationally local subsurface dynamo action from reprocessing of flux generated elsewhere, be it by a deep-seated large-scale dynamo or through the decay of active regions. Whether there is one or two (or more!) distinct dynamos operating in the sun remains, at this writing, an open question.
Although global MHD simulations are just beginning to yield solar-like regular cyclic global magnetic polarity reversals, they remain extremely demanding computationally, and are still a long way from producing anything resembling a toroidal flux rope, let alone a sunspot—although the formation of active regions has now been simulated in local MHD simulations.Footnote 19 This is why the much simpler mean-field and mean-field-like cycle models described earlier in this chapter remain at this writing the favored modelling framework within which to investigate the observed characteristics of solar and stellar cycles, and in particular the origin of fluctuations in their amplitude and duration on long timescales. This is the topic to which we now turn.
Notes
- 1.
- 2.
Here, \(\varepsilon _{ijk}\) is the Levi–Civita tensor density, also known as the unit alternating tensor, and has the values \(\varepsilon _{ijk} = 0\) when \(i,j,k\) are not all different, \(\varepsilon _{ijk} = +1\) or \(- 1\) when \(i,j,k\) are all different and in cyclic, or acyclic order, respectively. A particularly useful formula is (Einstein summation over repeated indices in force):
$$\begin{aligned} \varepsilon _{ijk} \varepsilon _{klm}&= \delta _{il} \delta _{jm} - \delta _{im} \delta _{jl}\,, \end{aligned}$$where \(\delta _{ij}\) is the Kronecker–delta, and has the value \(\delta _{ij} = 0\) if \(i,j\) are different, and \(\delta _{ij} {=} 1\) when \(i{=}j\).
- 3.
Throughout the rest of this chapter, we will have cause to repeatedly refer to the statistical properties of the turbulent velocity field. In order to avoid confusion we state the following definitions: a (random) field is stationary if its probability density function (pdf) is time independent, it is homogeneous if its pdf is independent of position, it is isotropic if its pdf is independent of orientation (or equivalently, invariant under rotations), and it is reflectionally symmetric if its pdf is invariant under parity reversal. We should note that isotropy and reflectional symmetry are taken here to be distinct properties, although this protocol is not universally accepted.
- 4.
- 5.
This expression still holds under SOCA, in which case \(\beta \) becomes a function of position in the flow.
- 6.
References to some of the more noteworthy exceptions are provided in the bibliography at the end of this chapter.
- 7.
Animation of this solution, and another for its cousin with negative \(C_\alpha \), can be viewed on the course webpage http://obswww.unige.ch/SSAA/sf39/dynamos.
- 8.
An animation of this solution can be viewed on the course web-page.
- 9.
This expression is best obtained through the original form of the MHD induction equation (1.59), rather than the (usually) equivalent form where the \(-\nabla \times (\eta \nabla \times \varvec{B})\) is expressed as \(\eta \nabla ^2\varvec{B}\); the distinction hinges on the metric terms resulting from the application of the Laplacian operator on a vector quantity. Some have to be forced to zero if radial diffusion is explicitly ignored. More specifically, in the case considered here this would mean zeroing the \(-2B_r/r^2\) term in the diffusive term on the RHS of the \(r\)-component of the induction equation in spherical coordinates, as given in Appendix B.
- 10.
An animation of which can of course be viewed on the course web-page.
- 11.
Remember that this is meant to represent the result of a toroidal flux rope erupting through the surface, so that in this case the underlying toroidal field is positive in the Northern hemisphere, which is the polarity of the trailing “spot”, as measured with respect to the direction of rotation, from left to right here.
- 12.
With \(\varvec{u}=0\), the decay rate of those remaining modes are given by the eigenvalues of the 2D pure resistive decay problem, much like in Sect. 2.1.
- 13.
Note however that the above expression does not include the advective effect of the meridional flow, so that the axisymmetric distribution on Fig. 3.13f is more sharply peaked at high latitudes than what one would infer from Eq. (3.63) applied to the initial radial field profile plotted on Fig. 3.13a.
- 14.
...and guess where you have to go to view an animation of this solution...?
- 15.
See the Dikpati and Gilman (2001) paper cited in the bibliography for more details.
- 16.
- 17.
Various animations pertaining to this simulation can be viewed on the course web-page.
- 18.
See papers by Brown et al. (2010) cited in the bibliography at the end of this chapter.
- 19.
See the paper by Cheung et al. (2010) listed in the bibliography at the end of this chapter.
References
The observational literature on the solar magnetic field is immense, and many good review papers are available. One I particularly like is Solanki, S. K., Inhester, B., & Schüssler, M.: 2006, The solar magnetic field, Rep. Prog. Phys., 69, 563–668
Hale’s original papers on sunspots are still well worth reading. The two key papers are: Hale, G. E.: 1908, On the probable existence of a magnetic field in sun-spots, Astrophys. J., 28, 315–343
Hale, G. E, Ellerman, F., Nicholson, S.B., & Joy, A.H.: 1919, The magnetic polarity of sun-spots, Astrophys. J., 49, 153–178
The study of rising toroidal flux ropes, a proxy for the emergence of the solar internal toroidal field in the form of sunspot pairs, is a topic that has generated a voluminous literature. Among the many noteworthy contributions in this field, the following are recommended as starting points: Moreno-Insertis, F.: 1986, Nonlinear time-evolution of kink-unstable magnetic flux tubes in the convective zone of the sun. Astron. & Astrophys. 166, 291–305
Choudhuri, A. R., & Gilman, P. A.: 1987, The influence of the Coriolis force on flux tubes rising through the solar convection zone, Astrophys. J., 316, 788–800
Fan, Y., Fisher, G. H., & Deluca, E. E.: 1993, The origin of morphological asymmetries in bipolar active regions, Astrophys. J., 405, 390–401
D’Silva, S., & Choudhuri, A. R.: 1993, A theoretical model for tilts of bipolar magnetic regions, Astron. & Astrophys., 272, 621–633
Caligari, P., Moreno-Insertis, F., & Schüssler, M.: 1995, Emerging flux tubes in the solar convection zone. I: Asymmetry, tilt, and emergence latitude. Astrophys. J., 441, 886–902
The thin flux-tube approximation used in most of these calculations is due to Spruit, H. C.: 1981, Motion of magnetic flux tubes in the solar convection zone and chromosphere, Astron. & Astrophys., 98, 155–160
On the storage and stability of toroidal flux ropes below the solar convective envelope, see Ferriz-Mas, A., & Schüssler, M.: 1994, Waves and instabilities of a toroidal magnetic flux tube in a rotating star, Astrophys. J., 433, 852–866
Ferriz-Mas, A.: 1996, On the storage of magnetic flux tubes at the base of the solar convection zone, Astrophys. J. 458, 802–816
Considerable effort is currently being put into doing away with the thin flux tube approximation, in order to see which of the above results remains robust, once the flux tube is no longer treated as a one-dimensional object. This is a rapidly moving field, so for the latest see the following recent on-line review: Fan, Y.: 2009, Magnetic fields in the solar convection zone, Liv. Rev. Solar Phys., 6, 4, http://solarphysics.livingreviews.org/Articles/lrsp-2009-4/
The following three recent review papers jointly offer a good overview of dynamo models of the solar cycle: Charbonneau, P.: 2010, Dynamo models of the solar cycle, Liv. Rev. Solar Phys., 7, 3, http://solarphysics.livingreviews.org/Articles/lrsp-2010-3/
Ossendrijver, M.: 2003, The solar dynamo, Astron. & Astrophys. Rev., 11, 287–367
Hoyng, P.: 2003, The field, the mean, and the meaning, in Advances in Non-Linear Dynamos, Ferriz Mas, A., & Jiménez, M. M., eds., The Fluid Mechanics of Astrophysics and Geophysics, 9, Taylor & Francis, 1–36
Mean-field electrodynamics grew out of the original pioneering efforts of Parker, E. N.: 1955, Hydromagnetic dynamo models. Astrophys. J., 122, 293–314
Braginskii, S. I.: 1964, Self-excitation of a magnetic field during motion of a highly conducting fluid, Sov. Phys. JETP, 20, 726–735
Steenbeck, M., & Krause, F.: 1969, Zur Dynamotheorie stellarer und planetarer Magnetfelder. I. Berechnung sonnenähnlicher Wechselfeldgeneratoren, Astron. Nachr., 291, 49–84, in German
but the following three monographs are a better starting point for those wishing to dig deeper into the subject: Moffatt, H. K.: 1978, Magnetic Field Generation in Electrically Conducting Fluids, Cambridge University Press
Parker, E. N.: 1979, Cosmical Magnetic Fields: Their Origin and their Activity, Clarendon Press, chap. 18
Krause, F., & Rädler, K.-H.: 1980, Mean-Field Magnetohydrodynamics and Dynamo Theory, Pergamon Press
The sketch shown on Fig.3.5 is from Parker, E. N.: 1970, The generation of magnetic fields in astrophysical bodies. I. The dynamo equations, Astrophys. J., 162, 665–673
On empirical estimates of the \(\alpha \)-effect from numerical simulations of MHD turbulence, start with: Pouquet, A., Frisch, U., & Léorat, J.: 1976, Strong MHD helical turbulence and the nonlinear dynamo effect, J. Fluid Mech., 77, 321–354
Ossendrijver, M., Stix, M., & Brandenburg, A.: 2001, Magnetoconvection and dynamo coefficients: Dependence of the \(\alpha \) effect on rotation and magnetic field, Astron. & Astrophys., 376, 713–726
Käpylä, P. J., Korpi, M. J., Ossendrijver, M., & Stix, M.: 2006, Magnetoconvection and dynamo coefficients. III. \(\alpha \) -Effect and magnetic pumping in the rapid rotation regime, Astron. & Astrophys., 455, 401–412
Hubbard, A., Del Sordo, F., Käpylä, P. J., & Brandenburg, A.: 2009, The \(\alpha \) effect with imposed and dynamo-generated magnetic fields, Mon. Not. Roy. Astron. Soc., 398, 1891–1899
The technical literature on dynamo models of the solar cycle is truly immense. There are many hundreds of noteworthy papers out there! Those included below are just meant to be good entry points for those wishing to pursue in greater depth topics covered in this chapter. For a good overview of mean-field solar cycle models and their evolution in time, see Lerche, I., & Parker, E. N.: 1972, The generation of magnetic fields in astrophysical bodies. IX. A solar dynamo based on horizontal shear, Astrophys. J., 176, 213–223
Yoshimura, H.: 1975, Solar-cycle dynamo wave propagation, Astrophys. J., 201, 740–748
Ivanova, T. S., & Ruzmaikin, A. A.: 1976, A magnetohydrodynamic dynamo model of the solar cycle, Sov. Astron., 20, 227–233
Stix, M.: 1976, Differential rotation and the solar dynamo, Astron. & Astrophys., 47, 243–254
Rüdiger, G., & Brandenburg, A.: 1995, A solar dynamo in the overshoot layer: cycle period and butterfly diagram, Astron. & Astrophys., 296, 557–566
Moss, D., & Brooke, J.: 2000, Towards a model for the solar dynamo, Mon. Not. Roy. Astron. Soc., 315, 521–533
On the impact of meridional circulation on dynamo waves, see Bullard, E. C.: 1955, The magnetic fields of sunspots, Vistas in Astronomy 1, 685–691
Choudhuri, A. R., Schüssler, M., & Dikpati, M.: 1995, The solar dynamo with meridional circulation, Astron. & Astrophys., 303, L29–L32
Küker, M., Rüdiger, G., & Schultz, M.: 2001, Circulation-dominated solar shell dynamo models with positive alpha-effect, Astron. & Astrophys., 374, 301–308
Roberts, P. H., & Stix, M.: 1972, \(\alpha \) -Effect dynamos, by the Bullard-Gellman formalism, Astron. & Astrophys., 18, 453–466
The meridional circulation profile described in Sect. 3.2.1 is the creation of van Ballegooijen, A. A., & Choudhuri, A. R.: 1988, The possible role of meridional flows in suppressing magnetic buoyancy, Astrophys. J., 333, 965–977
On \(\alpha \)-quenching, standard versus catastrophic and related dynamical issues: Blackman, E. G., & Field, G. B.: 2000, Constraints on the magnitude of \(\alpha \) in dynamo theory, Astrophys. J., 534, 984–988
Cattaneo, F., & Hughes, D. W.: 1996, Nonlinear saturation of the turbulent \(\alpha \) effect, Phys. Rev. E, 54, R4532–R4535
Durney, B. R., De Young, D. S., & Roxburgh, I. W.: 1993, On the generation of the large-scale and turbulent magnetic fields in solar-type stars, Solar Phys. 145, 207–225
Rüdiger, G., & Kichatinov, L. L.: 1993, Alpha-effect and alpha-quenching, Astron. & Astrophys., 269, 581–588
Cattaneo, F., & Hughes, D. W.: 2009, Problems with kinematic mean field electrodynamics at high magnetic Reynolds numbers, Mon. Not. Roy. Astron. Soc., 395, L48–L51
On interface dynamos, see Charbonneau, P., & MacGregor, K. B.: 1996, On the generation of equipartition-strength magnetic fields by turbulent hydromagnetic dynamos, Astrophys. J. Lett., 473, L59–L62
MacGregor, K. B., & Charbonneau, P.: 1997, Solar interface dynamos. I. Linear, kinematic models in Cartesian geometry, Astrophys. J., 486, 484–501
Parker, E. N.: 1993, A solar dynamo surface wave at the interface between convection and nonuniform rotation, Astrophys. J., 408, 707–719
Petrovay, K., & Kerekes, A.: 2004, The effect of a meridional flow on Parker’s interface dynamo, Mon. Not. Roy. Astron. Soc., 351, L59–L62
Tobias, S. M.: 1996, Diffusivity quenching as a mechanism for Parker’s surface dynamo, Astrophys. J., 467, 870–880
on the energetics of thin layer dynamos: Steiner, O., & Ferriz-Mas, A.: 2005, Connecting solar radiance variability to the solar dynamo with the virial theorem, Astron. Nachr., 326, 190–193
What is now referred to as Babcock-Leighton solar-cycle models goes back to the following three seminal papers by H. W. Babcock and R. B. Leighton: Babcock, H. W.: 1961, The topology of the Sun’s magnetic field and the 22-year cycle, Astrophys. J., 133, 572–587
Leighton, R. B., 1964, Transport of magnetic fields on the Sun, Astrophys. J., 140, 1547–1562
Leighton, R. B.: 1969, A magneto-kinematic model of the solar cycle, Astrophys. J., 156, 1–26
Although some details of the model are different, the 2D surface simulations described in Sect. 3.3.1 basically follow Wang, Y.-M., Nash, A. G., & Sheeley, Jr., N. R.: 1989, Magnetic flux transport on the sun, Science, 245, 712–718
Wang, Y.-M., & Sheeley, Jr., N. R.: 1991, Magnetic flux transport and the sun’s dipole moment - New twists to the Babcock-Leighton model, Astrophys. J., 375, 761–770
but on this general topic of surface magnetic flux evolution, see also: Schrijver, C. J., Title, A. M., van Ballegooijen, A. A., Hagenaar, H. J., & Shine, R. A.: 1997, Sustaining the quiet photospheric network: the balance of flux emergence, fragmentation, merging, and cancellation, Astrophys. J., 487, 424–436
Schrijver, C. J.: 2001, Simulations of the photospheric magnetic activity and outer atmospheric radiative losses of cool stars based on characteristics of the solar magnetic field, Astrophys. J., 547, 475–490
Schrijver, C. J., & Title, A. M.: 2001, On the formation of polar spots in Sun-like stars, Astrophys. J., 551, 1099–1106
Schrijver, C. J., De Rosa, M. L., & Title, A. M.: 2002, What is missing from our understanding of long-term solar and heliospheric activity?, Astrophys. J., 577, 1006–1012
Baumann, I., Schmitt, D., Schüssler, M., & Solanki, S. K.: 2004, Evolution of the large-scale magnetic field on the solar surface: a parameter study, Astron. & Astrophys., 426, 1075–1091
The formulation of the Babcock-Leighton solar cycle model of Sect. 3.3 is identical to Charbonneau, P., St-Jean, C., & Zacharias, P.: 2005, Fluctuations in Babcock-Leighton dynamos. I. Period doubling and transition to chaos, Astrophys. J., 619, 613–622
For different modelling approaches, see Wang, Y.-M., Sheeley, Jr., N. R., & Nash, A. G.: 1991, A new solar cycle model including meridional circulation, Astrophys. J., 383, 431–442
Durney, B. R.: 1995, On a Babcock-Leighton dynamo model with a deep-seated generating layer for the toroidal magnetic field, Solar Phys., 160, 213–235
Dikpati, M., & Charbonneau, P.: 1999, A Babcock-Leighton flux transport dynamo with solar-like differential rotation, Astrophys. J., 518, 508–520
Nandy, D., & Choudhuri, A. R.: 2001, Toward a mean field formulation of the Babcock-Leighton type solar dynamo. I. \(\alpha \) -coefficient versus Durney’s double-ring approach, Astrophys. J., 551, 576–585
Guerrero, G., & de Gouveia Dal Pino, E. M.: 2008, Turbulent magnetic pumping in a Babcock-Leighton solar dynamo model, Astron. & Astrophys., 485, 267–273
Muñoz-Jaramillo, A., Nandy, D., Martens, P. C. H., & Yeates, A. R.: 2010, A double-ring algorithm for modeling solar active regions: unifying kinematic dynamo models and surface flux-transport simulations, Astrophys. J. Lett., 720, L20–L25
On the “tachocline \(\alpha \)-effect” dynamo model described in Sect. 3.4.1, and associated stability analyses, begin with: Dikpati, M., & Gilman, P. A.: 2001, Flux-transport dynamos with \(\alpha \) -effect from global instability of tachocline differential rotation: a solution for magnetic parity selection in the Sun, Astrophys. J., 559, 428–442
Dikpati, M., Gilman, P. A., & Rempel, M.: 2003, Stability analysis of tachocline latitudinal differential rotation and coexisting toroidal band using a shallow-water model, Astrophys. J., 596, 680–697
Gilman, P. A., & Fox, P. A.: 1997, Joint instability of latitudinal differential rotation and toroidal magnetic fields below the solar convection zone, Astrophys. J., 484, 439–454
and for the “flux tube \(\alpha \)-effect” dynamo model of Sect. 3.4.2, and associated stability analyses, try first: Ferriz-Mas, A., Schmitt, D.,& Schüssler, M.: 1994. A dynamo effect due to instability of magnetic flux tubes. Astron. & Astrophys., 289, 949–956
Ossendrijver, M. A. J. H.: 2000, The dynamo effect of magnetic flux tubes, Astron. & Astrophys., 359, 1205–1210
On the numerical simulations of global 3D MHD convection in thick, rotating stratified spherical shells, begin with Brun, A. S., Miesch, M. S., & Toomre, J.: 2004, Global-scale turbulent convection and magnetic dynamo action in the solar envelope, Astrophys. J., 614, 1073–1098
Browning, M. K., Miesch, M. S., Brun, A. S., & Toomre, J.: 2006, Dynamo action in the solar convection zone and tachocline: pumping and organization of toroidal fields, Astrophys. J. Lett., 648, L157–L160
Brown, B. P., Browning, M. K., Brun, A. S., Miesch, M. S., & Toomre, J.: 2010, Persistent magnetic wreaths in a rapidly rotating Sun, Astrophys. J., 711, 424–438
Brown, B. P., Miesch, M. S., Browning, M. K., Brun, A. S., & Toomre, J.: 2011, Magnetic cycles in a convective dynamo simulation of a young solar-type star, Astrophys. J., 731, id. 69
as well as the following two recent review articles: Miesch, M. S.: 2005, Large-scale dynamics of the convection zone and tachocline, Living Reviews Solar Phys., 2, 1, http://solarphysics.livingreviews.org/Articles/lrsp-2005-1/
Miesch, M. S., & Toomre, J.: 2009, Turbulence, Magnetism, and Shear in Stellar Interiors, Ann. Rev. Fluid Mech., 41, 317–345
See also the fascinating results presented in Cline, K. S., Brummell, N. H., & Cattaneo, F.: 2003, Dynamo action driven by shear and magnetic buoyancy, Astrophys. J., 599, 1449–1468
Käpylä, P. J., Korpi, M. J., Brandenburg, A., Mitra, D., & Tavakol, R.: 2010, Convective dynamos in spherical wedge geometry, Astron. Nachr., 331, 73–81
The production of solar-like magnetic cycles in such simulations is a recent breakthrough. The simulation results presented in Sect. 3.5 are taken from Ghizaru, M., Charbonneau, P., & Smolarkiewicz, P. K.: 2010, Magnetic cycles in global large-eddy simulations of solar convection, Astrophys. J. Lett., 715, L133–L137
Racine, É., Charbonneau, P., Ghizaru, M., Bouchat, A., & Smolarkiewicz, P. K.: 2011, On the mode of dynamo action in a global large-eddy simulation of solar convection, Astrophys. J., 735, id. 46
These simulations were computed with the MHD version, developed at the Université de Montréal, of the general purpose hydrodynamical simulation code EULAG; on the latter, Prusa, J. M., Smolarkiewicz, P. K., & Wyszogorodzki, A. A.: 2008, EULAG, a computational model for multi-scale flows, Comp. Fluids, 37, 1193–1207
as well as the EULAG web-page: http://www.mmm.ucar.edu/eulag/
The numerical simulation results displayed on Fig. 3.25 is publicly available at: http://steinr.pa.msu.edu/~bob/data.html
Explanatory notes describing the simulation framework are also provided there, and discussed in greated detail in Stein, R. F., Lagerfjärd, A., Nordlund, Å., & Georgobiani, D.: 2011, Solar flux emergence simulations, Solar Phys., 268, 271–282
In a similar vein, do not miss: Cheung, M. C. M., Rempel, M., Title, A. M., & Schüssler, M.: 2010, Simulation of the formation of a solar active region, Astrophys. J. 720, 233–244
On the observational measurements and characterization of small-scale solar surface magnetic structures, and the potential implications for dynamo processes, see Parnell, C. E., DeForest, C. E., Hagenaar, H. J., Johnston, B. A., Lamb, D. A., & Welsch, B. T.: 2009, A power-law distribution of solar magnetic fields over more than five decades in flux, Astrophys. J. 698, 75–82
and references therein. A simple diffusion-limited aggregation model, producing power-law distributions of magnetic structures with logarithmic slope comparable to observational inferences, is presented in Crouch, A. D., Charbonneau, P., & Thibault, K.: 2007, Supergranulation as an emergent length scale, Astrophys. J., 662, 715–729
Author information
Authors and Affiliations
Corresponding author
Editor information
Editors and Affiliations
Rights and permissions
Copyright information
© 2013 Springer-Verlag Berlin Heidelberg
About this chapter
Cite this chapter
Charbonneau, P. (2013). Dynamo Models of the Solar Cycle. In: Steiner, O. (eds) Solar and Stellar Dynamos. Saas-Fee Advanced Courses, vol 39. Springer, Berlin, Heidelberg. https://doi.org/10.1007/978-3-642-32093-4_3
Download citation
DOI: https://doi.org/10.1007/978-3-642-32093-4_3
Published:
Publisher Name: Springer, Berlin, Heidelberg
Print ISBN: 978-3-642-32092-7
Online ISBN: 978-3-642-32093-4
eBook Packages: Physics and AstronomyPhysics and Astronomy (R0)