
Abstract
Model-Driven Engineering (MDE) alleviates the cognitive complexity and effort through the refinement and abstraction of consecutive models. In MDE, models should accurately and completely accommodate the expected data, information and knowledge in requirement specification following a series of refinement and abstraction. Proper abstraction starting from Class Diagrams lays the foundation for effective reuse and efficient manipulation of contained data, information and knowledge. Most current model abstraction approaches assume the scenarios with interaction of stakeholders for providing the key entities and thereafter focus on the relationship abstraction. However few work is done on unguided abstraction where stakeholders don’t know the key entities. Towards resolving the abstraction covering both automatic locating of representative entities and abstracting of link among these entities in Class Diagrams, we proposed a combination of class rank algorithm which prioritizes classes and relationship abstraction rules which heuristically determine the representative semantics of relationships towards improving the efficiency and effectiveness of class abstraction.
You have full access to this open access chapter, Download conference paper PDF
Keywords
1 Introduction
Models and modeling are essential parts of every engineering endeavors [1]. Unified Modeling Language (UML) is a nonindustrial standard for object-oriented modeling [2]. UML Class Diagram is used to describe the static structure of a system. A Class Diagram could be very large if a system is huge and complex. Designers easily become overwhelmed with details when dealing with large Class Diagrams. Model transformation is an essential part of MDE [15]. UML Class Diagram abstraction transforms a low-level class diagram to a high-level Class Diagram [3]. Well-designed Class Diagrams can lead to an eased development process towards a more ensured result system since they can be understood by stakeholders easily. Most existing model abstraction approaches fit for the scenario that stakeholders decide a few key entities usually according to their understanding of the significance of the entities. These key entities are used to represent the other entities. Then the main task of the abstraction is to expose the direct relationships among the key entities through mostly relationship abstraction. However this scenario is not always true especially when stakeholders are not familiar with the modeling techniques and the global perspective of a project. Then abstract need to be done without input of key entities. We can this scenario as unguided abstraction. Towards resolving the abstraction covering both automatic locating of representative entities and abstracting of link among these entities in Class Diagrams, we proposed a combination of class rank algorithm which prioritizes classes similar to page rank algorithm [14]. Page rank algorithm works by counting the number and quality of links to a page to determine a rough estimate of how important the website is. The underlying assumption is that more important websites are likely to receive more links from other websites. We regard classes as pages, relationships between classes as hyperlinks between pages, so we can apply page rank algorithm to compute the importance of a class in a Class Diagram. After the locating of the key entities, we introduce the heuristic relationship abstraction rules from Dr. Egyed [4] which heuristically determine the representative semantics of relationships towards improving the efficiency and effectiveness of class abstraction. We validate our approach with case studies.
In the rest of this paper, we give an overview of this paper in Sect. 2 firstly. Then we elaborate class rank algorithm to compute class ranks in Sect. 3 and a method to compute correlations between classes in Sect. 4. Approaches to compute relationships between classes are represented in Sect. 5. The related works are elaborated in Sect. 6. We give our conclusions in Sect. 7.
2 Overview
We propose a method to abstract class diagrams based on a class rank algorithm and relationship abstraction rules as Fig. 1 shows. We map a Class Diagram to a graph with nodes and edges. Nodes in a graph stand for classes in a Class Diagram and edges stand for relationships. On a mapped graph we implement abstraction through following operations.

Process of Class Diagram abstraction
-
(1)
Compute ranks of classes: A rank of a class represents the importance of the class in a Class Diagram. Class with a high rank is important in a Class Diagram. We use class rank algorithm to calculate ranks of classes in a Class Diagram. Then we obtain a one-dimensional class rank vector R. We suppose that classes ranked in the top thirty percent are important classes and abstracted Class Diagram should only contain important classes. We need to get relationships between important classes and decide which relationships should be presented in the abstracted Class Diagram.
-
(2)
Compute correlations between classes: Correlation between two nodes is used to judge whether a strong association exists between them. If there is a strong association between two nodes, they can be connected through a line. We calculate correlations of two nodes based on the distance and relationships between them. Then we get a weighted graph G(V,E 1 ). V is a node set and E 1 is an edge set with weighted correlations. Relationship between two classes can be presented in an abstracted Class Diagram if the correlation between two classes is bigger than 0.4.
-
(3)
Compute the direct relationship between two classes: If there is a path between two classes, a direct relationship may exist between them. We use relationship abstraction rules to get the direct relationship. Then we can obtain a weighted graph G(V,E 2 ). E 2 is an edge set with weighted relationships.
-
(4)
Generate the abstracted graph: According to G(V,E 1 ), G(V,E 2 ) and R, we abstract G(V,E) and get the abstracted graph G 1 (V,E) which is the abstraction of original graph G(V,E). G 1 (V,E) only contains nodes that represent important classes and relationships between them.
-
(5)
Generate abstracted Class Diagram: We generate an abstracted Class Diagram based on graph G 1 (V,E). We generate classes and relationships of the abstracted Class Diagram according to nodes and edges in G 1 (V,E). The abstracted Class Diagram is the abstraction of original Class Diagram.
3 Calculate Ranks of Classes
We locate key entities in a Class Diagram by calculating ranks of classes. The concept of rank is firstly used in Google’s page rank algorithm to describe the importance of a page and rank pages [14]. We adopt the idea of page rank algorithm to calculate ranks of classes in a Class Diagram and name it class rank algorithm. Class rank algorithm works by counting the number and semantic influence of relationships of classes. We regard classes as pages and relationships between classes as links between pages. But there are some differences between links and relationships. Different relationships have different ranks and different semantic influence.
3.1 Definitions
Table 1 shows logograms of relevant relationships. For example, AG is an abbreviation for aggregation. An expression such as “A × AG × B” stands for “A aggregate B”. Class rank (Rc) is represented with a float value between [0, 1000]. The value of Rc stands for the importance of a class in a Class Diagram. A class is deemed as more important if the class is labeled with a greater value. Relationship rank (Rr) is represented with an integer value between [0, 10]. The value of Rr stands for the semantic influence of a relationship in a Class Diagram. For example, if the rank of GL is larger than that of AS, it indicates that GL is of higher semantic influence than AS. We set ranks for different relationships as Table 2 shows.
Transition probability (TP) represents the probability of a rank transition from one class to another. Transition probability between class i and class j is defined according to Eq. 1. Rr(i,j) is the relationship rank of edge (i,j). For example, Rr(i,j) is equal to 7 if the relationship of edge (i,j) is AG. Transition probability matrix represents all transition probabilities of class ranks from one class to another in a Class Diagram.
3.2 Calculate Class Ranks
We calculate the rank of a class based on its adjacent classes’ ranks and transition probabilities from the class to its adjacent classes. We calculate a class rank according to Eq. 2:
where Rc(i) is the class rank of class i. (i,j) is the edge from class i to class j. Rr(j,i) is the relationship rank of edge (j,i). The formulated rules of this article will be evaluated using class diagram of a shopping management system shown in Fig. 2 at the analysis phase. Process of computing class ranks is as following shows:
-
(1)
Set an initial vector of class ranks: There are 11 classes in the Class Diagram of shopping management system. Class rank is initialized to the same value for all classes. We suppose that the initial rank of each class is equal to 1000/11.
-
(2)
Calculate transition probability matrix (M): We construct transition probability matrix based on rank transition probabilities of any two different classes having relationship with each other.
-
(3)
Iteration: We use the last class rank vector to multiply the transition probability matrix and obtain a new class rank vector which is represented as Eq. 3:
$$ R_{i} = R_{i - 1} \bullet M . $$(3)

A low-level Class Diagram of shopping management system
where R i is the class rank vector after iterating i − 1 times. M is a constant transition probability matrix. In each iteration, a class will transfer its value of rank to its adjacent classes. After iterating i times, rank of a class tends to be stable. R i approximates R i−1 . We skip out of the iteration and get the final class rank R i . A class is deemed as more important if the class is labeled with a greater value of rank. We suppose that classes ranked in the top 30% are important classes. After computing, rank values of the 11 classes in Fig. 2 are shown in Table 3. So important classes in the Class Diagram of shopping management system are Order, Payment and Customer.
4 Compute Correlations Between Classes
In order to compute correlations between classes, we assume that two classes could be connected if the correlation between them is of high semantic influence. Correlation between two classes is related to the distance and relationships between them.
4.1 Definition
Correlation between two classes depends on paths between them. Paths between two classes contain intermediate classes and relationships between them. We use a line to connect two classes if the correlation between them is of high semantic influence. We suppose that correlation between classes is of high semantic influence if value of the correlation is bigger than 0.4. Strength of a relationship is similar to a relationship rank. We use strength of relationship to calculate the correlation of two classes. We give the strength of each relationship in Table 4. For example, correlation between class Customer and class Order is 0.5 because the relationship between them is AS.
4.2 Calculate the Correlation Between Two Classes
We need to compute the correlation if two classes are not directly connected with each other. In Fig. 3, class A and class D are not directly connected with each other. There are two intermediate classes that are class B and class C between them. Steps of computing correlation between class A and class D are as follows:
-
(1)
Find strength of intermediate relationships in the path: Correlation between class A and class B is 0.5 because the relationship between them is AS and strength of AS is 0.5. Correlation between class B and class C is 0.7 because the relationship between class B and class C is AG and strength of AG is 0.7. Correlation between class C and class D is 1.0 because the relationship between class C and D is GL and strength of GL is 1.0.
-
(2)
Multiply the strengths: We multiply strengths of AS, AG and GL. Then we get the correlation between class A and class D which is C(A,D). C(A,D) is equal to 0.35. We need to compute correlation of two classes in each path if there are multiple paths between them according to Eq. 5:
$$ C(i,j) = \mathop {Max}\limits_{Path(n) \in (i,j)} \left\{ {\prod\limits_{k \in Path(n)} {S(k)} } \right\} $$(5)where Path(n) is a path between class i and j. K is a relationship in Path(n) such as AG. S(k) is the strength of relationship k. In Fig. 4, there are two paths between class A and class D. For Path 1, correlation between class A and class D is C 1 (A,D) which is equal to 0.5(1.0 * 0.5). For Path 2, correlation between class A and class D is C 2 (A,D) which is equal to 0.56(0.8 * 0.7). We choose C 2 (A,D) as the correlation between class A and class D because C 2 (A,D) is bigger than C 1 (A,D).
Fig. 3. 
Different relationships in a path between two classes (
-
(3)
Calculate the correlation matrix of a Class Diagram: For any two classes in a Class Diagram, we compute the correlation between them and get a correlation matrix of the Class Diagram. Then we obtain graph G(V,E1) of the Class Diagram based on the correlation matrix. E1 is an edge set with weighted correlations. In this way, we get correlations between classes in Fig. 2 as Table 5 shows. Correlation between classes is of high semantic influence if value of the correlation is bigger than 0.4 for instance correlation between class Customer and Order.
Table 5. Correlations between classes


Multiple paths between two classes.
5 Compute Relationships Between Classes
Getting the direct relationship between two classes can ease the cognitive load of checking the consistency in a Class Diagram. If all intermediate relationships in the path between two classes are the same, it is easy to know the direct relationship between the two classes. On the left side of Fig. 5, class A inherits class C if class A inherits class B and class B inherits class C. Class A depends on class C if class A depends on class B and class B depends on class C. Class A aggregates class C if class A aggregates class B and class B aggregates class C. Class A associates with class C if class A associates with class B and class B associates with class C. However, it is not easy to obtain the direct relationship between class A and class C if different relationships are grouped together as shown on the right side of Fig. 5.

Combination of relationships
5.1 Abstraction Rules
Dr. Egyed proposed a series of abstraction rules for automatically getting direct relationships from relationship combinations as Fig. 6 shows. The left side depicts the class input patterns and the right side (after “equals”) depicts the class output patterns. Input and output patterns are allowed to be more complex as long as the output pattern is simpler than the input pattern. If not, the abstraction algorithm could be non-deterministic. We also analyzed the semantic dependencies between other classes and their relationships. Note that the direction of relations is indicated through their name. If the relation name is used with no add-on, then a forward relation (a relation from left to right) is meant. If the string “r” is added then a backward relation (a relation from right to left) is meant. The number following each rule indicates the reliability of result obtained from the implementation of this rule. For example, rule(30){AS × Class × DP equals DP 50} indicates that class A depends on class C if class A associates with class B and class B depends on class C. Value of the reliability of the result obtained from implementing rule(30) is equal to 0.5(50/100). According to rule(15), class A associates with class C if class A inherits class B and class B associates with class C. Value of the reliability of the result obtained from implementing rule(15) is 1.

Rules for abstraction
5.2 Compute the Relationship Between Classes
-
(1)
Compute direct relationship between two classes in a path: We can get all intermediate relationships in the path between two classes and form a one-dimensional array of relationships. For any two adjacent relationships in a relationship array, we can abstract them if they satisfy a rule as shown in Fig. 6. In Fig. 3, relationship array that we got from the path is equal to Arr = [AS, AG, GL]. For any two adjacent relationships in Arr, we judge whether they satisfy a rule. For example, AS and AG meets rule(2). AG and GL meets rule(27). Then we need to consider which rule should be executed firstly and whether different execution orders of rules will lead to different results. We get the final relationship between class A and class D which is AS if we execute rule(2) firstly following the first order shown in Fig. 7. Relationship array A = [AS, AG, GL] changes to A1 = [AS, GL] and relationship array A1 = [AS, GL] changes to A2 = [AS] if we execute rule(28) secondly. The final relationship between class A and class D is also equal to AS if we execute the rule(27) firstly following the second order shown in Fig. 7. Relationship array A = [AS, AG, GL] changes to A3 = [AS, AG] and relationship array A3 = [AS, AG] changes to A4 = [AS] if we execute rule(2) secondly.
Fig. 7. 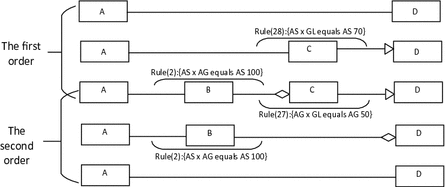
Execution orders of abstraction rules

In Fig. 7, result of execution following the first order is A2 = [AS] and result of execution following the second order is A4 = [AS]. Value of the reliability of A2 = [AS] is equal to 0.7. Value of the reliability of A4 = [AS] is equal to 0.5. We choose the relationship with a higher reliability. We need to consider whether different execution orders will lead to different relationship results and find a way to get a relationship result with the highest reliability. For a relationship array A = [X, Y, Z] which contains only 3 relationships, there are 343(7 * 7 * 7) types of A (e.g. [AS, AG, AS]). For each type of A, we analyzed two execution orders of A like Fig. 7 shows. We found that results of two execution orders are the same regardless of the type. Table 6 gives the analysis results of 343 relationship array types.
Invalid result means that combination of the latter two relationships in array A does not conform to any of the abstraction rules. For relationship array A[AS, GL, GLr] shown in Fig. 8, there is no rule that meets the two adjacent relationships GL and GLr. Thus, there is only one order for A to choose which leads to a unique result. We will get only one relationship result for the invalid type. We can conclude that there is only one relationship result no matter in which array type that contains 3 relationships. We apply heuristic abstraction rules to abstract relationships between two classes as algorithm 1 shows.

Execution orders of relationship array A[AS, GL, GLr]

Compute direct relationship between two classes if there are two or more paths: We will get more than one relationship result if there are multiple paths between two classes. We should consider which result to choose. Our approach is to choose result with the highest reliability. We choose result with the highest relationship rank if reliabilities of two different results are equal.
-
(2)
Calculate the relationship matrix of a Class Diagram: After computing direct relationship between any two classes in a Class Diagram, we create a relationship matrix of the Class Diagram and form graph G(V,E2). We obtain relationships between classes in Fig. 2 as Table 7 shows.
Table 7. Relationship between classes in Fig. 2
We set the level of abstraction by controlling requirements for the number of important classes and strength of relationships. We get four important classes if we suppose that classes ranked in the top 40% are important. They are Payment, Customer, Order and OrderDetail. We reduce the number of important classes to three if the standard that is set for the important classes is ranked in top 30%. We locate key entities by using class rank algorithm. From Tables 5 and 7 we can know the correlations and relationships between important classes. Therefore, we can get abstracted Class Diagrams of different levels of shopping management system as Fig. 9 shows which only contains important classes and relationships between them. The Class Diagram on the right side has a higher abstraction than the one on the left.

Abstracted Class Diagram of different levels
6 Related Work
It is more and more difficult for people to program, understand, and modify software with the increasingly complexity of a software system [13]. Dr. Eyged proposed a series of abstraction rules for Class Diagram which contain class abstraction rules and relationship abstraction rules. Direct relationship between any two classes in a Class Diagram can be calculated by using heuristic abstraction rules [4]. His abstraction method supports the scenario when key entities such as classes or instances are identified by stakeholders before an abstraction process or during interactions of a process. The pattern matching not only is costly [5] but also depends on the experience or project knowledge of the stakeholders in identifying the key entities/relationships. The scenario of abstraction without relying on the experience of stakeholders is a more challenging situation which need to be explored but not well addressed in existing literature. The first obstacle for unguided abstraction is to create or find the representative entities which can represent the trivial data, information and knowledge which are distributed in the mess of the trivial elements in model diagrams. Based on our hypothesis that some existing classes can represent the others properly, we uses class rank algorithm to calculate ranks of classes in a Class Diagram and use the ranks to represent the importance of the entities. During the implementation of the visualization [12], we adopted the hierarchical layout by Sugiyama to display our layered abstraction of UML Class Diagrams [6, 8] and also referred to the rank-direct layout method [9] which centers on higher ranked classes and clusters lower ranked classed to higher ranked classes. Harald found that various factors like layout quality, modeler experience, and diagram type led to significant differences in diagram reading strategies [10, 11]. Helen investigated the preference of UML modelers and found that joined inheritance arcs and directional indicators were preferred for Class Diagrams [7].
7 Conclusion
Well designed hierarchical abstraction can provide an effective means to efficiently understand and maintain complex models. Most existing model abstraction approaches assume that target classes are provided ahead. Thereafter the abstraction focuses on the abstraction at relationship level. Dr. Egyed had proposed a series of heuristic rules which are capable to efficiently fulfill the relationship abstraction. However unguided abstraction which doesn’t come with guided information such as predetermined target classes is not fully studied in existing literature. We analyzed that unguided abstraction requires automated recognition of target classes which represent important entity concepts of abstracted models. Then based on the hypothesis that some existing classes fit well to represent other classes, we proposed a class prioritizing algorithm to recognize these representative classes through ranking them with different values. We further integrate the entity abstraction with the heuristic relationship abstraction to form an approach of unguided automatic abstraction of models. In the future, we propose to explore the entity abstraction scenario where no existing classes fit as the representative entity for other classes through the data, information and knowledge recreation of existing classes and relationships with the introduction of knowledge graphs.
References
Blossfeld, H.P., Rohwer, G.: Techniques of event history modeling: new approaches to causal analysis. In: Techniques of event history modeling, pp. 236–238. Lawrence Erlbaum Associates (2002)
France, R.B., Kim, D.K., Ghosh, S., et al.: A UML-based pattern specification technique. IEEE Trans. Softw. Eng. 30, 193–206 (2004)
Egyed, A.: Automated abstraction of class diagrams. ACM Trans. Softw. Eng. Methodol. (TOSEM) 11, 449–491 (2002)
Egyed, A.: Semantic abstraction rules for class diagrams. In: Proceedings of the Fifteenth IEEE International Conference on Automated Software Engineering, ASE, pp. 301–304. IEEE Xplore (2000)
Fahmy, H., Holt, R.C.: Software architecture transformations. In: International Conference on IEEE Proceedings of the Software Maintenance, pp. 88–96. IEEE (2000)
Seemann, J.: Extending the Sugiyama algorithm for drawing UML class diagrams: Towards automatic layout of object-oriented software diagrams. In: DiBattista, G. (ed.) GD 1997. LNCS, vol. 1353, pp. 415–424. Springer, Heidelberg (1997). doi:10.1007/3-540-63938-1_86
Purchase, H.C., Allder, J.A., Carrington, D.: Graph layout aesthetics in UML diagrams: user preferences. J. Graph Algorithms Appl. 6, 255–279 (2002)
Sugiyama, K., Tagawa, S., Toda, M.: Methods for visual understanding of hierarchical system structures. IEEE Trans. Syst. Man Cybern. 11, 109–125 (1981)
Hu, H., Fang, J., Lu, Z., et al.: Rank-directed layout of UML class diagrams. In: Proceedings of of the First International Workshop on Software Mining. ACM (2012)
Maier, A.M., Stoerrle, H., Baltsen, N., et al.: On the impact of diagram layout: how are models actually read? In: Proceedings of the Joint Proceedings of MODELS 2014 Poster Session and the ACM Student Research Competition. ACM(2014)
Storrle, H.: On the impact of layout quality to understanding UML diagrams. In: Proceedings of the Visual Languages and Human-Centric Computing, pp. 135–142. IEEE (2011)
Ball, T., Eick, S.G.: Software visualization in the large. Computer 29, 33–43 (1996)
Bassi, S., Keller, R.K.: Software visualization tools: survey and analysis. In: Proceedings of International Workshop on Program Comprehension, vol. 2, pp. 7–17 (2001)
Page, L., Brin, S., Motwani, R., et al.: The PageRank Citation Ranking: Bringing Order to the Web. Stanford InfoLab (1999)
Duan, Y., Cheung, S.C., Fu, X.: A metamodel based model transformation approach. In: Proceedings of the Acis International Conference on Software Engineering Research, Management and Applications, pp. 184–191. IEEE (2005)
Acknowledgments
The authors acknowledge the support of NSFC of China (No. 61363007, 61662021 and 61661019) and Hainan NSF Key project (No. 2017xxxx).
Author information
Authors and Affiliations
Corresponding author
Editor information
Editors and Affiliations
Rights and permissions
Copyright information
© 2017 Springer International Publishing AG
About this paper
Cite this paper
Huang, L., Duan, Y., Zhou, Z., Shao, L., Sun, X., Hung, P.C.K. (2017). Enhancing UML Class Diagram Abstraction with Page Rank Algorithm and Relationship Abstraction Rules. In: Drira, K., et al. Service-Oriented Computing – ICSOC 2016 Workshops. ICSOC 2016. Lecture Notes in Computer Science(), vol 10380. Springer, Cham. https://doi.org/10.1007/978-3-319-68136-8_10
Download citation
DOI: https://doi.org/10.1007/978-3-319-68136-8_10
Published:
Publisher Name: Springer, Cham
Print ISBN: 978-3-319-68135-1
Online ISBN: 978-3-319-68136-8
eBook Packages: Computer ScienceComputer Science (R0)