Abstract
The author begins Chap. 2 with the general locations of rainforests (Afrotropical, Neotropical, and Indo-Pacific region) and outlines the specific countries that host rainforests. The author then provides a historical and current context of tropical rainforest deforestation and degradation. Maps are provided showing the forest cover loss from 2000 to 2014 in these select regions. The author then presents a more detailed discussion about the role of cattle, soybeans, and palm oil, along with the role of timber, pulp and paper, forest fires, population and consumption, and infrastructure. The author then concludes with an explanation of why tropical rainforests are important, such as due to their provisioning services, regulating services, habitat or supporting services, and cultural services.
You have full access to this open access chapter, Download chapter PDF
“The American consumer, seeking a good-quality hamburger at ‘reasonable,’ i.e. non-inflationary, price, is not aware of the spinoff consequences of his actions far away from his homeland.”
—Dr. Norman MyersFootnote 1
Where Are the World’s Tropical Rainforests?
Tropical rainforests are globally threatened and often rare ecosystems. According to The Nature Conservancy, only 2% of the world’s total surface area is home to rainforests, while rainforests are home to 50% of the world’s plants and animals. However, “every second, a slice of rainforest the size of a football field is mowed down. That’s 86,400 football fields of rainforest per day, or over 31 million football fields of rainforest each year.”Footnote 2 Thus the area destroyed each year is equal to an area greater than the size of the United Kingdom.
According to research by Dr. Claude Martin,
The area covered by tropical rainforests at that time {Humboldt and Bonpland’s expedition in 1799–1804} was still close to the 1.6 billion hectares believed to be the original maximum distribution areas {…}. Today less than half this area remains as undisturbed forest {less than 800 million hectares}—nobody knows exactly how much—and about another quarter survives as fragmented and degraded forest.Footnote 3
The world’s tropical rainforests are located along the equator and between the Southern Hemisphere’s Tropic of Capricorn (23°26′13.9″ South) and the Northern Hemisphere’s Tropic of Cancer (23°26′13.9″ North). Further, tropical rainforests can also be classified based on the Köppen classification of climatesFootnote 4 and the Food and Agricultural Organization (FAO) of the United Nations’ designation of tropical rainforest ecological zones (Fig. 2.1).Footnote 5
Tropical rainforests are biologically diverse, mostly evergreen forests that are located near the equator. There are also temperate rainforests which are located in countries far from the equator such as Canada, Russia, and in the Pacific Northwest of the United States. Rainforests annually receive rainfall in excess of 200 centimeters (80 inches).Footnote 6 It is important to note there are other types of forest ecosystems (i.e., mangrove forests), and not just rainforests, located around the equator.
The 3 main rainforest regions are Afrotropical, Neotropical, and Indo-Pacific. It is estimated that a total of 65–70 countries within these 3 regions have biomes classified as humid tropical forests or tropical moist forests.Footnote 7 , Footnote 8
Neotropical
The countries throughout the Neotropical region, which spans the Caribbean Sea, Central and South America, include (Fig. 2.2):
-
Argentina
-
Belize
-
Bolivia
-
Brazil
-
Colombia
-
Costa Rica
-
Cuba
-
Dominican Republic
-
Ecuador
-
El Salvador
-
Guatemala
-
Guiana (French overseas department)
-
Guyana
-
Haiti
-
Honduras
-
Jamaica
-
Mexico
-
Nicaragua
-
Panama
-
Paraguay
-
Peru
-
Suriname
-
Trinidad and Tobago
-
VenezuelaFootnote 9 , Footnote 10
Afrotropical
The countries throughout the Afrotropical region, which span throughout Sub-Saharan Africa from the Atlantic Ocean to the Indian Ocean, include (Fig. 2.3):
-
Angola and Cabinda
-
Benin
-
Burundi
-
Cameroon
-
Central African Republic
-
Côte d’Ivoire (Ivory Coast)
-
Democratic Republic of Congo
-
Djibouti
-
Equatorial Guinea
-
Gabon
-
Gambia
-
Ghana
-
Guinea
-
Guinea-Bissau
-
Kenya
-
Liberia
-
Madagascar
-
Malawi
-
Mauritius
-
Mozambique
-
Nigeria
-
Republic of the Congo
-
Réunion
-
Rwanda
-
São Tomé and Príncipe
-
Senegal
-
Seychelles
-
Sierra Leone
-
Somalia
-
Tanzania
-
Togo
-
Uganda
-
Zambia
-
ZimbabweFootnote 11 , Footnote 12
Indo-Pacific
The countries throughout the Indo-Pacific region, which spans across mainland Southeast Asia and throughout the various archipelagos, include the following countries. Please note there are thousands of islands in the Indo-Pacific region and the author apologizes to those islands that are not listed (Fig. 2.4):
-
Australia
-
Bangladesh
-
Bhutan
-
Brunei
-
Cambodia
-
China
-
Cook Islands
-
East Timor (Timor-Leste)
-
Fiji
-
Guam and Hawaii, United States
-
India
-
Indonesia
-
Laos
-
Malaysia
-
Marquesas Islands
-
Micronesia
-
Myanmar
-
Nepal
-
New Caledonia
-
Papua New Guinea
-
Philippines
-
Samoan Islands
-
Singapore
-
Solomon Islands
-
Sri Lanka
-
Taiwan
-
Thailand
-
Tonga Islands
-
Tuamotu Archipelago
-
Tubuai Islands
-
VietnamFootnote 13 , Footnote 14
The largest tropical rainforest in the world is the Amazon Rainforest, which is primarily located in Brazil . The second largest tropical rainforest is the Congo Basin, which is primary located in the Democratic Republic of the Congo (DRC). The next largest tropical rainforest is located in Australia and throughout Southeast Asia, particularly on the island of Borneo. For comparative purposes, the Amazon Rainforest, which is larger than the Congo and Indonesian Rainforests combined, is approximately the size of the contiguous United States.Footnote 15
The following table outlines the countries with the largest forest areas in hectares (ha) as of 2015, along with the extent of deforestation in hectares and as a percent for the time periods 2000–2010 and 2010–2015.Footnote 16 Please note these historical figures are to be taken as estimates because accurately measuring forest cover can be challenging, in part, due to different classifications or definitions of forest (Table 2.1).
While forests are largely privately owned in countries such as the United States, Japan, and the United Kingdom, “today, central governments own almost 80 percent of the remaining intact forests in developing countries.”Footnote 17 For instance:
-
United States: 179 million ha privately owned versus 130 million ha publicly owned;
-
Japan: 14.8 million ha privately owned versus 10.2 million ha publicly owned;
-
United Kingdom: 2.2 million ha privately owned versus 868,000 ha publicly owned;
-
Brazil : 102 million ha privately owned versus 308 million ha publicly owned;
-
Indonesia : 12 million ha privately owned versus 82 million ha publicly owned;
-
Democratic Republic of the Congo: 0 ha reported as privately owned versus 154 million ha publicly owned.Footnote 18
Forest ownership and management by central governments have sometimes resulted in “mismanagement, heavy political and economic pressures to allow cutting and immigration, and widespread corruption, cronyism, and illegal logging.”Footnote 19 As defined by the Organisation for Economic Co-operation and Development (OECD), central governments—also known as federal governments—are the governing body that has “the authority to impose taxes on all residents and non-resident units engaged in economic activities within the country.”Footnote 20 Subnational jurisdictions, in contrast with the central or federal government, have varying degrees of power depending on the host country. Subnational jurisdictions include state or provincial governments, municipal or county governments, and city governments.
Another important land steward is Indigenous Peoples “and other local communities {who} formally own or have legal rights to manage more than 270 million hectares of forest in Latin America—almost 40 percent of the total forest area. Indigenous Peoples have also claimed significant areas of forest that they do not yet have formal rights to.”Footnote 21 Historically, the forests managed by Indigenous Peoples often have lower rates of deforestation.
The following table presents for the top five largest tropical forest countries (Table 2.2):Footnote 22
-
The main economic threats of deforestation and degradation;Footnote 23
-
Their main exports;Footnote 24
-
The private landownership and public landownership in 2010;Footnote 25
-
The land designated for, or owned by, Indigenous Peoples and communities;Footnote 26 and
-
The land under protection in 2014.Footnote 27
It is also important to note that technology—including remote sensing and satellite imagery, advancements in data storage, transmission and computation, satellite phones, and drones for conservation—has greatly improved the world’s ability to quantify, assess, and monitor the world’s tropical rainforests. This includes, but is certainly not limited to, the Global Forest Watch platform,Footnote 28 the US Geological Survey’s Earth Resources Observation and Science (EROS) archive of free Landsat images,Footnote 29 and PRODES (Projeto de Monitoramento do Desflorestamento na Amazônia Legal or Legal Amazon Deforestation Monitoring Project in English), which is “the world’s most extensive national forest monitoring program.”Footnote 30
Where Did Tropical Rainforest Deforestation and Degradation Historically Occur?
For an excellent resource on the historical causes of deforestation and degradation across the tropics, please see Dr. Claude Martin’s book entitled, On the Edge: The State and Fate of the World’s Tropical Rainforests. The following excerpt is from Dr. Martin’s book:
Rice cultivation started to take a heavy toll when immigrant peasant farmers cleared large areas in the lowland forests of Myanmar, Thailand, Cambodia, Laos, and Vietnam. These countries became an important rice exporting region—the rice bowl of Asia. Other Southeast Asian countries followed, deforesting large areas of Sumatra and Java. Over ten million hectares of forests was cleared before 1920, although records of how this happened seem to be inconclusive. The Philippines, which had been under more than 300 years of Spanish colonial rule, also lost forest in the central places of Luzon, mainly to plantations of commercial crops such as tobacco and sugar cane. The colonial influence on the expansion of commercial crops was also noticeable in Assam, India where the British East India Company expanded its tea estates at the cost of tropical forests. In West Africa, mainly in Ghana and Nigeria, rainforests were cleared in the last quarter of the nineteenth century for some of the first commercial cocoa and oil palm plantations. The rainforests of Latin America, on the other hand, had hardly been affected by commercial agriculture before 1920, with the exception of some coffee plantations, for example in the areas northwest of São Paulo. Most of the deforestation in South and Central America was caused by shifting agriculture, which usually affected relatively small areas compared to cultivation in South and Southeast Asia. A notable exception to this pattern of moderate deforestation was the Brazilian Atlantic coastal forests, which had already been decimated in the initial phases of colonization in the Portuguese-controlled areas. {…}
At the global level, the level of deforestation remained modest until about 1920, as agricultural expansion happened mainly in temperate countries until that time. The world population had grown from 1 billion in 1800 to 1.9 billion by 1920. {…} Through the 1920s and 1930s, tropical deforestation accelerated massively to almost eight million hectares per year. {…} In the aftermath of World War II, from 1950 to 1980, tropical deforestation increased even further. An estimated eleven million hectares of tropical rainforest disappeared every year in the 1970s—at least, this was the widely cited figure from a first assessment published by the Food and Agriculture Organization of the United Nations (FAO) in 1976.Footnote 31
For another comprehensive resource on the historical overview of deforestation, see Deforesting the Earth: From Prehistory to Global Crisis, An Abridgment, by Michael Williams.Footnote 32
Where Is Tropical Rainforest Deforestation and Degradation Occurring Today?
Between 2000 and 2012, “the world has been losing about 0.43% of its remaining tropical rainforests per year: about 1.2 times the size of Switzerland (each year). If the decline in the global deforestation rate were to continue in a linear fashion, it would reach the level of current reforestation (about 0.13%) a few years after 2030 (Fig. 2.5).”Footnote 33
A root cause analysis of why this tropical rainforest deforestation and degradation is still occurring today reveals several compounding and interconnected factors. As Nigel Sizer, the former director of The Nature Conservancy’s (TNC) Forest Conservation program in Jakarta, Indonesia , explained, “There is not just one factor that is leading to this wholesale slaughter of the Indonesian forests; it’s a combination of weak governance, poor law enforcement, ill-advised government policies, and lack of alternative income opportunities for the rural poor.”Footnote 34
Similarly, after World War II, tropical rainforest deforestation and degradation accelerated due to a variety of forces including, but not limited to:
-
The creation of the Bretton Woods Institutions (i.e., the World Bank and the International Monetary Fund) and their early financing of megaprojects;
-
The establishment of many new, independent countries and their focus on import substitution industrialization (ISI) coupled with export-oriented economies of their raw commodities;
-
The oil embargoes of the 1970s and the ensuing third world debt crisis of the 1980s;
-
Rural-to-urban migration, rising incomes, and increasing consumption levels of beef and other consumer goods (e.g., chocolate, coffee, and paper);
-
Advancement of technology and machinery, including the advancement of earthmoving equipment for mining, road construction, and timber extraction.
For an excellent analysis of the role of megaprojects, import substitution industrialization (ISI), the oil embargoes of the 1970s and the ensuing third world debt crisis of the 1980s, and foreign debt’s contribution to commodity export-oriented economies, see Trouble in Paradise: Globalization and Environmental Crises in Latin America by J. Timmons Roberts and Nikki Demetria Thanos. Similarly and as explained by Dr. Thomas Lovejoy:
The forest has shrunk in the face of voracious appetites for tropical resources (hardwoods, fossil fuels, and minerals), advancing agricultural frontiers (no matter how ill-advised), and mostly ill-conceived settlement initiatives.
{…} much of Brazil’s Atlantic forests are gone, along with 20 percent of the Amazon and most of the lowland forests of Malaysia and Indonesia . The Congo Basin has suffered multiple inroads (for mining, oil and gas, timber, roads, and dams), and much of the West African forest has been obliterated. The picture, happily, is not entirely negative. More than half of the Amazon is now under some form of protection. Protected areas (however vulnerable) have been created in the Congo Basin, Southeast Asia, and Indonesia . National capacity in science and conservation has grown impressively.Footnote 35
Yet, tropical rainforest deforestation and degradation persists today and will surely continue in the future as the FAO:
{…} projects a 60 percent increase in the world demand for agricultural products between 2015 and 2050, a consequence of human population increase, urbanization, and dietary changes, particularly the rapid increase of meat and palm o il consumption in emerging economies. The world may literally eat up the tropical rainforests, these being the only large areas still available for agricultural expansion. Unfortunately, it is more profitable to produce a few tons of beef or animal feed per hectare than to maintain that hectare as intact tropical rainforest.Footnote 36
Much of this tropical rainforest deforestation and degradation is concentrated in select regions, such as Brazil’s Arc of Deforestation and within Indonesia’s Riau Province in Sumatra, and results from a few select agricultural soft commodities including cattle, soy , and palm oil . For example, “from 1996 to 2005 the Brazilian states in the arc of deforestation—Mato Grosso, Rondônia, and Pará—accounted for 85 percent of deforestation in the Amazônia Legal region, with an average of 1.66 million hectares of forest loss per year.”Footnote 37 Similarly, “it revealed that Sumatra and Kalimantan together lost 5.39 million hectares or 1.15 percent annually of forest cover between 2000 and 2008—more than the area of Costa Rica . Almost half this loss happened in just two provinces: Riau in Sumatra and Central Kalimantan.”Footnote 38 The following map depicts these deforestation fronts. The conservation financing instruments that will be outlined in this book should target these specific regions while also ensuring leakage does not displace such tropical rainforest deforestation and degradation to other places (Fig. 2.6).
Map of Deforestation Fronts (Credit: © WWF’s Living Forest Report 2015)Footnote
World Wildlife Fund. “WWF Living Forests Report: Chapter 5.” Accessed November 23, 2016. http://awsassets.panda.org/downloads/lfr_chapter_5_executive_summary_final.pdf
The following maps depict the extent of forest cover loss from 2000 to 2014 in the Neotropical, Afrotropical, and Indo-Pacific rainforests (Figs. 2.7, 2.8, 2.9):
Three main commodities primarily linked to tropical rainforest deforestation and degradation are cattle, palm oil , and soy (Fig. 2.10).
Global deforestation pressures (Credit: © WWF’s Living Forest Report 2015)Footnote
World Wildlife Fund. “WWF Living Forests Report: Chapter 5.” Accessed November 23, 2016. http://awsassets.panda.org/downloads/lfr_chapter_5_executive_summary_final.pdf
Cattle
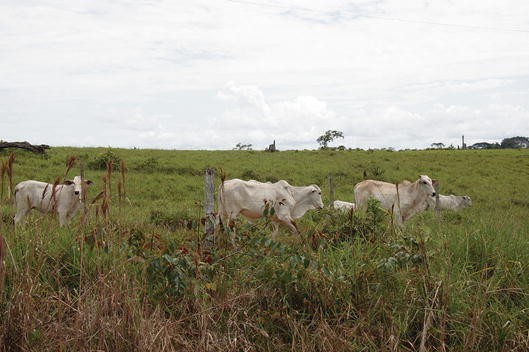
Especially throughout Central and South America, along with Southeast Asia, “{…} studies confirm that commercial agriculture, including cattle ranching, is now the most important proximate driver of deforestation and has overtaken subsistence agriculture everywhere except in Africa.”Footnote 41 Commercial agriculture’s role in tropical rainforest deforestation and degradation—as will be explained below—is mainly due to soybeans and palm oil (Fig. 2.11).
The world in 2014 had an estimated 1.5 billion head of cattle,Footnote 42 which collectively with other livestock (e.g., buffalo, chickens, and pigs), are responsible for approximately 14.5% of global greenhouse gas (GHGs) emissions, which is greater than the GHG emissions from the entire transportation sector.Footnote 43
Cattle ranching throughout Central and South America tends to result in the export of beef to Hong Kong, Russia, and the United States, or internally consumed in countries such as Argentina, Brazil , and Uruguay. Brazil is the second largest producer of beef in the world, and this cattle ranching is largely within the Arc of Deforestation including the states of Mato Grosso and Pará. The top 10 largest consumers of beef in 2015Footnote 44 were given in Table 2.3.
Soybeans
Similar to cattle, the largest region facing tropical rainforest deforestation and degradation as a result of soybean cultivation is the Brazilian Amazon and particularly the state of Mato Grosso. The expansion of soy into South America, particularly Brazil and Argentina, “{…} started in the early 1990s with the rapid increase of meat consumption and the demand for protein-rich feed for chickens, pigs, and cattle. Fish meal, an important cattle feed, was no longer available after the collapse of the Peruvian anchovy fisheries.”Footnote 45 In conjunction, “soy cultivation raised land prices and displaced cattle ranching deeper into the Amazon.”Footnote 46
The following table depicts the largest domestic consumers of soybeans in 2016Footnote 47 and the largest producers of soybeans in 2015 (Table 2.4)Footnote 48:
Palm Oil
The world’s largest producers of palm oil are Indonesia and Malaysia , which is often in direct conflict with the conservation of Southeast Asia’s tropical rainforests and peatlands. Since palm oil is in a wide variety of consumer products, the oil is increasingly consumed around the world and particularly in India. As Dr. Claude Martin explains:
Today, palm oil is everywhere; besides being used as cooking oil, it is used in thousands of products in the food industry and also in soap, detergent, lubricants, cosmetics, and as biofuel. It makes up the largest volume of vegetable oil produced, at 34 percent, and palm kernel oil adds another 4 percent to the global palm oil bounty. It is the cheapest edible oil and by far the most productive: plantations yield three to eight times as much oil by area than any other oil plant. Currently more than 70 percent of the world’s palm oil is used for food. The main producers, Indonesia and Malaysia , in addition to their exports, meet a large part of their domestic demand for vegetable oils with palm oil, but there are plans underway to convert millions of hectares of tropical rainforest into additional palm oil plantations, and a major driver for this is the demand for biofuels.Footnote 49
Rounding out the top 10 palm oil producing countriesFootnote 50 and consuming countriesFootnote 51 in 2016 were as follows (Table 2.5):
While some palm oil plantations are established on degraded lands, like the following picture illustrates, much of the palm oil plantations are at the expense of tropical rainforests (Fig. 2.12):
Large-scale commercial cultivation of palm oil is now beginning to expand into parts of Africa—such as Cameroon and Gabon—that will threaten the Congo Rainforest. For example, in December 2016:
Société Financière des Caoutchoucs SA (‘Socfin’), based in Luxembourg, raised €80 million in senior unsecured 4 percent 5-year debt to finance land-use expansion for its vertically integrated palm oil and rubber production in Africa and Asia.
In 2015, SocFin had 186,767 hectares under cultivation; 120,780 ha of oil palm trees and 65,987 ha of rubber trees. The company has operations in Liberia, Côte d’Ivoire, Nigeria, Cameroon , Congo DRC , Sierra Leone, Indonesia , Cambodia, Ghana, and Sao Tome.
These €80 million in funds are not ring-fenced and are assumed to be used to finance SocFin’s current expansion in Sierra Leone and elsewhere. ING facilitated this first public debt offering by SocFin. It is unknown if ING’s participation required SocFin to include climate and social risk safeguards into the use of funds. ING is a member of the Roundtable of Sustainable Palm Oil.Footnote 52
Timber, Pulp, and Paper
Pulp and paper are consumed around the world as toilet paper, paper towels, computer paper, packaging, and notepads. While such raw materials can be sourced from plantations or temperate forests, pulp and paper can also come from tropical rainforests.
There are concerns about planted, plantation forests due to the establishment of monocultures (i.e., especially if planted at the expense of biologically diverse, natural forests), water quantity and quality issues, and the use of petro-based chemicals (e.g., fertilizers, insecticides, and rodenticides). However, these plantation forests may reduce the pressure on natural forests, especially for paper, pulp, and timber. The following table outlines the countries with the largest area of planted forests as of 2015 (Table 2.6)Footnote 53:
The world’s largest exporters of wood, not necessarily tropical hardwoods, based on 2015 US dollar values, were as follows (Table 2.7)Footnote 54:
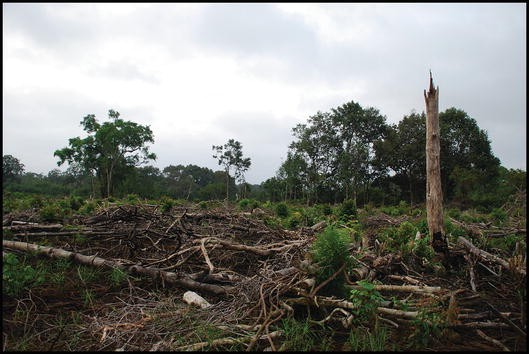
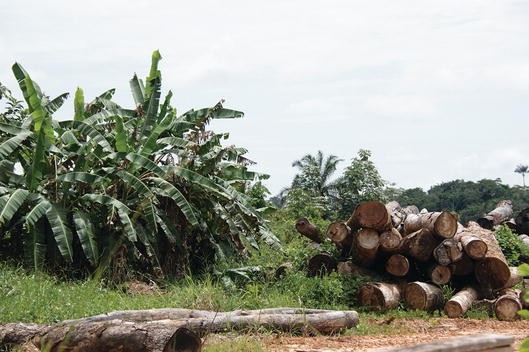
Although not ranked among the top 10 countries, timber, particularly hardwoods, is a large export commodity for many, unlisted tropical rainforest countries. Due to the low density and high diversity of tropical rainforests, only about 1 to 3 commercial hardwood trees are found per hectare throughout most tropical rainforests.Footnote 55 The extraction of such trees often subsidizes the resulting cattle ranch or palm oil plantation. In addition, while there are few commercial hardwoods per hectare, there are other trees that might be used for staging or other short-term uses (e.g., biofuel) which in turn subsidize access to the hardwoods and the future clearing for a cattle ranch or palm oil plantation (Fig. 2.13).
One issue with logging is that a significant portion of the globally traded tropical hardwoods are illegal. For instance:
A detailed study of illegal logging in five tropical countries (Indonesia , Malaysia , Ghana, Cameroon , and Brazil ) published by Chatham House in 2010 found that illegal logging has been declining since about 2004. But at the time this study was published, illegal harvesting still represented 35–72 percent of all logging in the Brazilian Amazon, 22–35 percent in Cameroon , 59–65 percent in Ghana, 40–61 percent in Indonesia , and 14–25 percent in Malaysia . Illegal logging affects not only tropical countries, but industrialized countries as well. Worldwide, more than one hundred million cubic meters of timber are still being cut illegally each year, leading to the degradation or destruction of five million hectares of forest. The economic damage of illegal logging is equally important; it is estimated at USD$ 10–15 billion worth of stolen timber per year, plus an additional USD$ 5 billion in lost royalties and taxes.Footnote 56
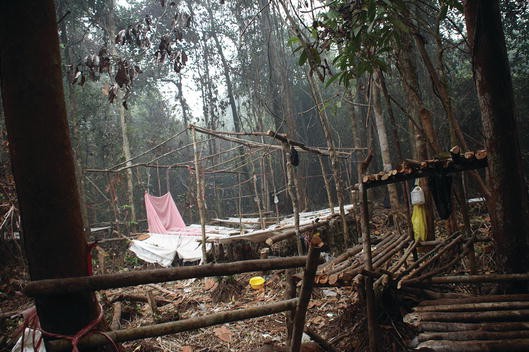
Below is a picture of a temporary camp established to illegally log hardwoods (Fig. 2.14):
Timber also plays a significant role in forest degradation and the ensuing GHG emissions. As reported by researchers from Winrock International:
We estimated annual emissions of 2.1 billion tons of carbon dioxide {from forest degradation}, of which 53% were derived from timber harvest, 30% from woodfuel harvest and 17% from forest fire. These percentages differed by region: timber harvest was as high as 69% in South and Central America and just 31% in Africa; woodfuel harvest was 35% in Asia, and just 10% in South and Central America; and fire ranged from 33% in Africa to only 5% in Asia. Of the total emissions from deforestation and forest degradation, forest degradation accounted for 25%. In 28 of the 74 countries, emissions from forest degradation exceeded those from deforestation.Footnote 57
Forest Fires
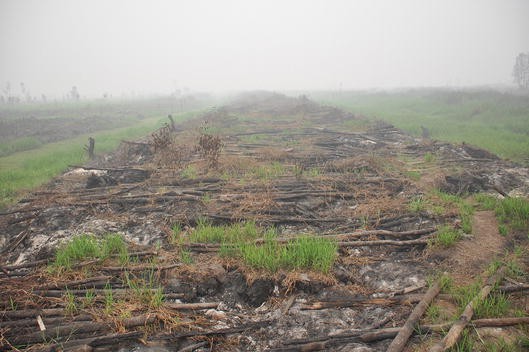
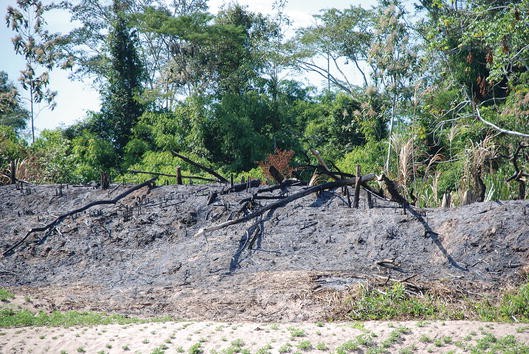
Forest fires—depending on the fire’s severity—are also another factor that can result in forest degradation or full-scale deforestation. While some of these forest fires are naturally started, many of the fires—as the picture below depicts—are started by people to clear land for agriculture (Fig. 2.15).
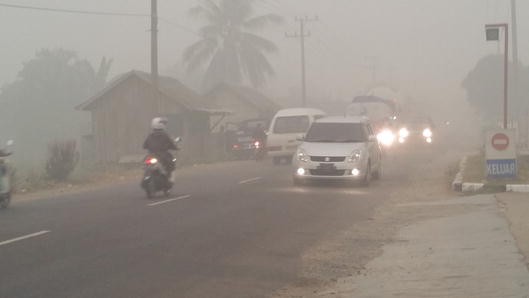
One of the worst cases of forest fires recently occurred in Indonesia . While there are some disputes over the exact figures,Footnote 58 it is largely accepted that from September to October 2015, the fires in Indonesia resulted in more daily greenhouse gas emissions than the entire European Union,Footnote 59 impacted millions of people, and cost the region an estimated USD$16 billion (Fig. 2.16).Footnote 60
More specifically, per Chain Reaction Research:
From July 1st to October 20th, 2015, 97,000 fires were detected in Indonesia , and over two million hectares of forest caught fire, one-third of which were High Carbon Stock peat forests.Footnote 61
In 2016, Harvard and Columbia Universities published estimates suggesting that the Southeast Asian 2015 forest fires and haze may have resulted in 100,000 fatalities in Indonesia , Malaysia , and Singapore. The study only focused on “fine particulate matter,” referred to as PM2.5. PM2.5 can penetrate the lungs and other organs, causing respiratory disease, birth defects, premature delivery of babies, premature death, asthmas, and lung cancer.
Often, but not always, palm oil plantations and smallholders clear existing forests using fire. These fires create haze, a toxic chemical soup that can include hundreds of airborne dangerous chemicals.
Other estimates suggest that during “fire season” in El Nino years, 11 percent of the population in SE {Southeast} Asia have been repeatedly exposed to pollution levels significantly above World Health Organization safety limits.
Competing figures compiled by SE Asian governments were significantly lower. The differences are due to many factors. Specifically, the number of deaths is based on complex estimates of the increases of potential PM2.5 related illnesses versus baseline.Footnote 62
Unfortunately, forest fires are not just a phenomenon of Southeast Asia. In 2015, there were more than 2.3 million fires detected in the Brazilian Amazon.Footnote 63 Similarly, between January and March 2016, an approximate total of 15,000 hectares (37,050 acres) were burned in the Republic of the Congo , representing one of the largest fires ever detected in the rainforests of Central Africa.Footnote 64
Population and Consumption
Another factor contributing to tropical rainforest deforestation and degradation is population. As explained by Dr. Claude Martin:
{…} population density is certainly not appropriate as a single indicator, but it is far from irrelevant. In the next thirty-five years population growth is projected to peak everywhere except in Africa, where the population will double from 1.17 billion in 2015 to 2.39 billion in 2052 and is expected to rise to 4.2 billion in 2100. Western, central, and eastern African countries show some of the highest growth rates at 2–3 percent.Footnote 65
The top 10 most populated countries in 2015,Footnote 66 along with the countries with the fastest population growth in 2015,Footnote 67 were as follows (Table 2.8):
It is important to understand that forests provide livelihoods to billions of people. If these people are no longer supported by forests—whether due to deforestation, forest degradation, or a depletion of local resources (e.g., food and water)—many of these people will be forced to move to nearby cities. Yet, this rural-to-urban migration will place further pressure on cities—many of which already lack adequate housing, employment opportunities, and water availability. This said, many of the world’s megacities are already located in developing countries with tropical rainforests such as Mexico City (Mexico ) and São Paulo (Brazil ), and the following table outlines the largest cities around the world (Table 2.9)Footnote 68:
While not technically in the top 20, two additional large cities located in tropical rainforest countries that should be noted are Jakarta, Indonesia , and Lima, Peru .
In addition to the population increase among rural communities living adjacent to tropical rainforests, there is also concern about the population increase among urban consumers of commodities that directly result in tropical rainforest deforestation and degradation.
Infrastructure
Infrastructure, such as roads, can have both a direct and indirect impact on tropical rainforests. For instance, it was reported in August 2017 that Bolivian “President Evo Morales enacted a new law opening the way for the 190-mile (300km) road through the Isiboro Sécure Indigenous Territory and National Park, known as Tipnis, its Spanish acronym. The road will divide the park in two and strip it of the protections won in 2011 {…}.”Footnote 69 A frequently seen fishbone pattern results where a main road is constructed and then side roads are built shortly thereafter. The main road, for example, may have been constructed to access a remote timber concession. Side roads are then often established by legal or illegal settlements and this increased access results in tropical rainforest deforestation and degradation. Interestingly,
The pattern of deforestation hot spots reveals that deforestation is largely determined by proximity to urban settlements and roads. The opening up of remote areas by timber concessions that can only be accessed on long-distance timber roads, on the other hand, does not lead to higher deforestation. Beyond a distance of nine to twelve hours of travel time from a city (not very far with the means of transportation available), deforestation in the Congo Basin drops to almost zero, showing that the theory of timber extraction always leads to deforestation by slash-and-burn farming does not hold true for remote forest areas in the Congo Basin.Footnote 70
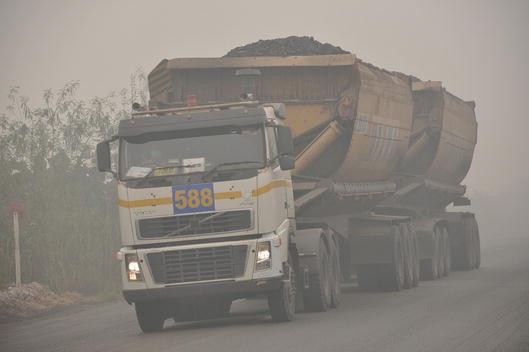
Such roads are not only built for timber access but also to connect different regions within a country or to connect countries (i.e., the Trans-Amazonia Highway or the Pan-American), along with to access mining and energy infrastructure (Fig. 2.17).
Large-scale, unsustainable infrastructure projects not only contribute to tropical rainforest deforestation and degradation, but they sometimes also infringe on the benefits of local communities and Indigenous Peoples.Footnote 71
Why Are Tropical Rainforests Valuable?
Tropical rainforests have inherent value as the most biologically diverse terrestrial ecosystem on Earth. Their beauty and complexity are unmatched, as is the human need to know that such wild places still exist today. Complementing such inherent value are the invaluable resources—such as water, oxygen, and medicine—that are generated by these rainforests for local communities to people living a half a world away (Fig. 2.18).
In the seminal article, entitled “The value of the world’s ecosystem services and natural capital,” the global extrinsic value of the biosphere was estimated to be in the range of USD$16–54 trillion per year, with an average value of USD$33 trillion per year. This average value is approximately twice the size of the US economy in 2015. Specifically looking at tropical forests and particularly due to their role in climate regulation, erosion control, nutrient cycling, waste treatment, raw material, and recreation, tropical forests were valued at USD$2,007 per hectare per year for a grand estimated, annual total of USD$3.813 trillion in ecosystem services.Footnote 72
According to The Economics of Ecosystems and Biodiversity (TEEB), ecosystem services can be categorized as provisioning services, regulating services, habitat or supporting services, and cultural services.Footnote 73 TEEB was initiated as a global study in 2007 by the G8+5 countries (Canada, France, Germany, Italy, Japan, Russia, the United Kingdom, and the United States, plus Brazil , China, India, Mexico , and South Africa) to analyze “the global economic benefit of biological diversity, the costs of the loss of biodiversity and the failure to take protective measures versus the costs of effective conservation.”Footnote 74 TEEB has now evolved to focus on country-level studies and on work around natural capital accounting for businesses.Footnote 75 TEEB for Business Coalition would later become the Natural Capital Coalition in 2014.Footnote 76
Provisioning Services
Provisioning services include the raw materials, freshwater, and medicinal resources.
Raw materials, such as timber, provide direct benefits to local communities for the construction of homes and canoes while also contributing billions of dollars in global trade. In addition to timber, there are a wide variety of non-timber forest products (NTFPs) such as fruits, vegetables, nuts, spices, and game meat. For example:
A number of research projects have attempted to compare the economics of sustainable extraction versus more destructive land uses. The most publicized study, a 1989 Nature piece by respected botanists Peters, Gentry, and Mendelson, cataloged the marketable fruits, cocoa, oils, rubber, and medicines from tiny rainforest patches in the Peruvian Amazon. The group reported that profits from harvest of these products are two to three times greater over time than logging or clearing the forest for pasture. Seventy-two species on the site yielded products with actual market values in the neighboring city of Iquitos, Peru . Factoring in heavy transport costs and the cost of saving 25 percent of fruit harvests for regeneration, Peters et al. found that one plot could sustainably net U.S.$322 per hectare per year. Studies of Açaí palm fruit harvesting near Belém have also shown sustainable profitability without cutting forests.Footnote 77
The Amazon Rainforest is the world’s largest tropical rainforest, and the Amazon River Basin is one of the largest sources of freshwater on Earth. It is estimated the Amazon River Basin contains “12–20 percent of the world’s freshwater. The Amazon biome drives atmospheric circulation in the tropics by absorbing energy and recycling about half the rainfall. This biosphere-atmosphere ‘pump’ is an important control mechanism for rainfall patterns in other parts of the continent, particularly its central and southern zones.”Footnote 78
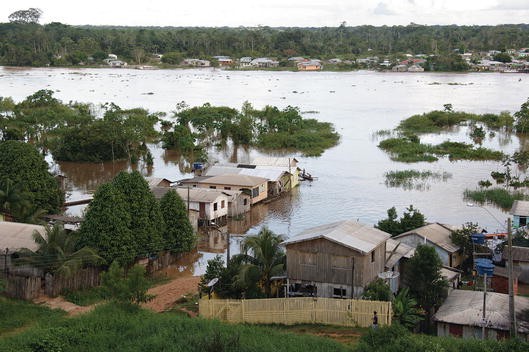
Rainforests also help regulate the water cycle as trees can act as a sponge to moderate the release of water. In some circumstances, as the following picture illustrates, deforestation and degradation can lead to the loss of top soil, erosion, and local flooding (Fig. 2.19).
There is an abundance of medicinal plants in tropical rainforests, including quite possibly numerous yet-to-be discovered species. In the tropical rainforests of Acre, Brazil —as throughout much of the world—local communities utilize the forests as a pharmacy, and these are some of the many species that are locally used:
-
Copaíba: This plant is an anti-inflammatory.
-
Quina-Quina: This plant has many uses including reducing fever and helping heal malaria.
-
Jatobá: This plant helps anemia by increasing red blood cells.
-
Andiroba: This plant can be used as a mosquito repellent and for gastrointestinal issues.
-
Casca do cedro: This plant helps to alleviate toothaches and fever.
Globally, “at least forty-seven major drugs had come from rain-forest plant species, with an accumulated net worth of $147 billion.”Footnote 79
Regulating Services
Regulating services, as described by TEEB, include the regulation of local climate and air quality, carbon sequestration and storage, moderation of extreme events, erosion prevention and maintenance of soil fertility, pollination, and biological control.
For instance, “all told, the harvest of about one in three food crops worldwide—from Alfalfa to watermelons—is possible thanks to the work of pollinators.”Footnote 80 Such pollinators include a wide variety of tropical species including bats, bees, birds, and insects. In addition to pollination is the critical work of seed dispersal done by birds, monkeys, tapirs, and elephants. In fact, the Brazilian biologist Dr. Patricia Medici refers to the tapir as the “Gardener of the Forest” for their seed dispersal role.Footnote 81
According to the Infectious Disease Emergence and Economics of Altered Landscapes (IDEEAL) Project of the EcoHealth Alliance,
Land-use change is a significant driver of emerging infectious disease. Over 60 percent of emerging infectious diseases over the past six decades, including SARS, H1N1/Swine Flu, and HIV-AIDS have originated in animals, with nearly half of these linked to changes in land-use.Footnote 82
The outbreak in 2013–2015 of the Ebola virus in West Africa is at least partially attributable to deforestation and forest fragmentation.Footnote 83
Furthermore, forests are both a source of GHG emissions and a sink for GHG emissions, in the sense that forests store a significant amount of carbon. It is estimated for “the decade 2001–2010, total GHG FOLU {Forestry and Other Land Use} emissions were 3.2 GtCO2eq/yr {3.2 Gigatons of carbon dioxide equivalent emissions per year} including deforestation (3.8 GtCO2eq/yr), forest degradation and forest management (−1.8 GtCO2eq/yr), biomass fires including peatland fires (0.3 GtCO2eq/yr), and drained peatlands (0.9 GtCO2eq/yr).”Footnote 84 This source of GHG emissions—much of which is from the conversion of tropical rainforests to commercial agriculture and cattle ranches—is second only to the power sector and has literally more emissions than the entire world’s transportation sector and all of its cars, buses, planes, and ships.
One of the world’s largest carbon sinks was just discovered in the Congo Basin. British researchers “found 145,000 square kilometres of peatland—an area larger than England—in the forests of the central Congo basin. The reservoir of compressed plant material holds at least 30 billion metric tons of carbon. And this pristine and undisturbed sink of peat is the equivalent of about two decades of fossil fuel combustion in the United States.”Footnote 85
Habitat or Supporting Services
Habitat or supporting services include habitat for species, along with the maintenance of genetic diversity. Tropical rainforests host the greatest abundance of terrestrial biodiversity on Earth. Yet,
Nature everywhere is under siege. Each year the world loses some 30 million acres of tropical forest, an area slightly larger than Pennsylvania. At this rate, the last rain-forest tree will bow out—dead on arrival at a sawmill or in a puff of smoke—around the middle of the twenty-first century. Biodiversity—short for biological diversity, the amazing variety of life on Earth—is being reduced to the lowest levels in human history. Homo sapiens has already wiped out one-quarter of all bird species, and an estimated 11 percent more are on the path to extinction, along with 24 percent of mammal and 11 percent of plant species. One-quarter of the world’s coral reefs have been destroyed, with many others undergoing serious decline.Footnote 86
Similarly, “throughout the world, with every passing hour an estimated two to three species are committed to extinction, mostly as victims of habitat destruction and the spread of non-native species, which kill or compete with natives.”Footnote 87 Sadly, we are currently in the sixth great extinction period known as the Holocene extinction period. The previous five periods of mass extinction took place during the following eras : Ordovician-Silurian, the Late Devonian, Permian, Triassic-Jurassic, and Cretaceous-Tertiary.Footnote 88 The last mass extinction prior to the arrival of humans was known as the Cretaceous-Tertiary, which took place approximately 65 million years ago and resulted in the end of the dinosaurs.
These species have inherent value, but are also valued by local communities as a source of food and are valued by people around the world as demonstrated by the money spent on tourism, movies (e.g., Lorax), books (The Jungle Book), and school visits to zoos and aquariums. Yet, as proclaimed by Dr. E.O. Wilson of Harvard University, “this mass extinction is the folly our descendants will be least likely to forgive.”Footnote 89
As described by WWF, “ecoregions that represented the most distinctive examples of biodiversity for a given major habitat type were identified within each biogeographic realm. They were chosen based on the following parameters:
-
Species richness;
-
Endemism;
-
Higher taxonomic uniqueness (e.g., unique genera or families, relict species or communities, primitive lineages);
-
Extraordinary ecological or evolutionary phenomena (e.g., extraordinary adaptive radiations, intact large vertebrate assemblages, presence of migrations of large vertebrates); and
-
Global rarity of the major habitat type.”Footnote 90
Such WWF ecoregions include the world’s tropical rainforests, and similarly, Conservation International has designated 36 biodiversity hotspots (Fig. 2.20).
Biodiversity hotspots (Open Source Map—Credit: Conservation International)Footnote
Naturevolution. “Who We Are.” Accessed November 23, 2016. http://www.naturevolution.org/en/qui-sommes-nous/
Many of these biodiversity hotspots include tropical rainforests such as the Caribbean Islands, Indo-Burma, Mesoamerica, Tumbes-Chocó-Magdalena, and Sundaland.
Cultural Services
Cultural services include recreation, mental, and physical health; tourism; aesthetic appreciation and inspiration for culture, art, and design; spiritual experience; and sense of place.
As Dr. Martin asks, “Are these not the places where our closest relatives still survive?”Footnote 92 Likewise, chimpanzees, orangutans, and gorillas live among these tropical rainforests and are under increasing threats due to tropical rainforest deforestation and degradation.
Furthermore, if the tropical rainforest are lost, we will lose a great number of Indigenous Peoples and forest-dependent peoples. At least, “sixty-seven uncontacted tribes have been identified in Amazonia indigenous reservations,”Footnote 93 and “linguists have recognized 850 indigenous languages, which makes the country {Papua New Guinea} the most linguistically diverse country in the world by far.”Footnote 94
Other Resources on the Context of Deforestation and Degradation
Amazon Deforestation, Once Tamed, Comes Roaring Backhttps://www.nytimes.com/2017/02/24/business/energy-environment/deforestation-brazil-bolivia-south-america.htmlCall for Parks Red Listhttps://martynmurray.wordpress.com/2016/06/30/call-for-a-parks-red-list/Chain Reaction Research
Code REDD Videos
Conservation Biology Institute’s Data Basin
Forest Geo-Wiki
Global Footprint Network
Global Forest Watch
GRID-Arendal
The Little Book of Big Deforestation Drivers
-
Executive Summary: http://d6.globalcanopy.org/materials/little-book-big-deforestation-drivers-executive-summary
-
Full Report: http://d6.globalcanopy.org/LittleBookofDrivers
Tools for Landscapes for People, Food and Nature
United Nations Environment Programme’s Global Information Resource Database (GIRD)
United States Department of Agriculture’s Economic Research Service
United States Department of Agriculture’s Foreign Agricultural Service
WWF’s Database for Jurisdictional Risk Assessment
Notes
- 1.
Myers. The Sinking Ark. 144.
- 2.
The Nature Conservancy. “Rainforests: Exotic, Diverse and Highly Threatened.” Accessed November 23, 2016. http://www.nature.org/ourinitiatives/urgentissues/rainforests/rainforests-facts.xml
- 3.
Martin. On the Edge. XXI.
- 4.
Peel, M.C., B.L. Finlayson and T.A. McMahon. “Updated World Map of the Köppen-Geiger Climate Classification.” Hydrol. Earth Syst. Sci. 11. 2007. 1633–1644.
- 5.
Food and Agriculture Organization of the United Nations. “Ecological Zones: Brazil.” Accessed November 23, 2016. http://www.fao.org/forestry/country/19971/en/bra/
- 6.
National Geographic. “Encyclopedia: Rain Forest.” Accessed February 19, 2017. http://www.nationalgeographic.org/encyclopedia/rain-forest/
- 7.
Sommer, Adrian. “Attempt at an Assessment of the World’s Tropical Moist Forests.” Food and Agriculture Organization of the United Nations. Accessed November 23, 2016. http://www.fao.org/docrep/k0050e/k0050e03.htm#attempt%20at%20an%20assessment%20of%20the%20world%27s%20tropical%20moist%20forests
- 8.
Martin. On the Edge. 14.
- 9.
Sommer, Adrian. “Attempt at an Assessment of the World’s Tropical Moist Forests.” Food and Agriculture Organization of the United Nations. Accessed November 23, 2016. http://www.fao.org/docrep/k0050e/k0050e03.htm#attempt%20at%20an%20assessment%20of%20the%20world%27s%20tropical%20moist%20forests
Note. “In general, only those countries entirely located within the geographical tropical zone (exceptions are Australia, Argentina, and Paraguay) have been included. Some other countries in the subtropical zone (part of China, Bhutan, and Nepal), partially covered by a kind of moist tropical forest, have not been taken into account. On the other land, India and Burma have been included as a whole, with their subtropical part.”
- 10.
Butler, Rhett. “Where Rainforests are Located: Biogeographical Tropical Forest Realms.” Last modified July 22, 2007. Accessed April 9, 2017. http://rainforests.mongabay.com/0102.htm
- 11.
Sommer, Adrian. “Attempt at an Assessment of the World’s Tropical Moist Forests.” Food and Agriculture Organization of the United Nations. Accessed November 23, 2016. http://www.fao.org/docrep/k0050e/k0050e03.htm#attempt%20at%20an%20assessment%20of%20the%20world%27s%20tropical%20moist%20forests
Note. “In general, only those countries entirely located within the geographical tropical zone (exceptions are Australia, Argentina, and Paraguay) have been included. Some other countries in the subtropical zone (part of China, Bhutan, and Nepal), partially covered by a kind of moist tropical forest, have not been taken into account. On the other land, India and Burma have been included as a whole, with their subtropical part.”
- 12.
Butler, Rhett. “Where Rainforests are Located: Biogeographical Tropical Forest Realms.” Last modified July 22, 2007. Accessed April 9, 2017. http://rainforests.mongabay.com/0102.htm
- 13.
Sommer, Adrian. “Attempt at an Assessment of the World’s Tropical Moist Forests.” Food and Agriculture Organization of the United Nations. Accessed November 23, 2016. http://www.fao.org/docrep/k0050e/k0050e03.htm#attempt%20at%20an%20assessment%20of%20the%20world%27s%20tropical%20moist%20forests
Note. “In general, only those countries entirely located within the geographical tropical zone (exceptions are Australia, Argentina, and Paraguay) have been included. Some other countries in the subtropical zone (part of China, Bhutan, and Nepal), partially covered by a kind of moist tropical forest, have not been taken into account. On the other land, India and Burma have been included as a whole. With their subtropical part.”
- 14.
Butler, Rhett. “Where Rainforests are Located: Biogeographical Tropical Forest Realms.” Last modified July 22, 2007. Accessed April 9, 2017. http://rainforests.mongabay.com/0102.htm
- 15.
Mongabay. “10 Facts about the Amazon Rainforest.” Last modified January 23, 2016. http://rainforests.mongabay.com/amazon/amazon-rainforest-facts.html
- 16.
Food and Agriculture Organization of the United Nations. “Global Forest Resources Assessment 2015: Desk Reference.” Accessed November 23, 2016. http://www.fao.org/3/a-i4808e.pdf. 9–14.
- 17.
Speth, James Gustave and Peter M. Haas. Global Environmental Governance. 30.
- 18.
Food and Agriculture Organization of the United Nations. “Global Forest Resources Assessment 2015: Desk Reference.” Accessed November 23, 2016. http://www.fao.org/3/a-i4808e.pdf. 235–240.
- 19.
Speth, James Gustave and Peter M. Haas. Global Environmental Governance. 30.
- 20.
OECD. “Glossary of Terms: Central Government.” Last modified April 8, 2013. https://stats.oecd.org/glossary/detail.asp?ID=306
- 21.
Kaimowitz, David. “Indigenous Peoples and Deforestation in Latin America.” In On the Edge, written by Claude Martin. Berkeley: Greystone Books, 2015. 168.
- 22.
Butler, Rhett. “Largest Area of Tropical Forest, by Country.” Last modified January 11, 2016. Accessed April 10, 2017. http://rainforests.mongabay.com/deforestation_forest.html
- 23.
Thoumi, Gabriel. “Economic Drivers Of Deforestation: Sectors Exposed To Sustainability And Financial Risks.” Nasdaq, August 3, 2016. Accessed February 20, 2017. http://www.nasdaq.com/article/economic-drivers-of-deforestation-sectors-exposed-to-sustainability-and-financial-risks-cm660031
- 24.
US Central Intelligence Agency. “The World Factbook.” Accessed December 1, 2016. https://www.cia.gov/library/publications/the-world-factbook/geos/br.html; https://www.cia.gov/library/publications/the-world-factbook/geos/cg.html; https://www.cia.gov/library/publications/the-world-factbook/geos/id.html; https://www.cia.gov/library/publications/the-world-factbook/geos/pe.html; https://www.cia.gov/library/publications/the-world-factbook/geos/in.html
- 25.
Food and Agriculture Organization of the United Nations. “Global Forest Resources Assessment 2015: Desk Reference.” Accessed November 23, 2016. http://www.fao.org/3/a-i4808e.pdf. 235–240.
- 26.
Rights and Resources Initiative. Who Owns the World’s Land? A Global Baseline of Formally Recognized Indigenous and Community Land Rights. Washington, DC: RRI. 2015. Accessed March 29, 2017. http://www.rightsandresources.org/wp-content/uploads/GlobalBaseline_web.pdf. 6–8.
- 27.
World Bank. “Terrestrial Protected Areas (% of Total Land Area).” Accessed February 20, 2017. http://data.worldbank.org/indicator/ER.LND.PTLD.ZS?name_desc=false
- 28.
Global Forest Watch. “About.” Accessed December 6, 2016. http://www.globalforestwatch.org/about
- 29.
US Geological Society. “Earth Resources Observation and Science (EROS) Center: Find Data.” Accessed December 6, 2016. http://eros.usgs.gov/find-data
- 30.
Martin. On the Edge. 33.
- 31.
Martin. On the Edge. 3–4.
- 32.
Williams, Michael. Deforesting the Earth: From Prehistoric to Global Crisis, An Abridgement. Illinois: The University of Chicago Press, 2006.
- 33.
Martin, On the Edge. 247.
- 34.
Ginn. Investing in Nature. 108.
- 35.
Lovejoy, Thomas. E. “Foreword.” In On the Edge, written by Claude Martin. Berkeley: Greystone Books, 2015. IX–X.
- 36.
Martin. On the Edge. xviii
- 37.
Martin. On the Edge. 100.
- 38.
Martin. On the Edge. 48.
- 39.
World Wildlife Fund. “WWF Living Forests Report: Chapter 5.” Accessed November 23, 2016. http://awsassets.panda.org/downloads/lfr_chapter_5_executive_summary_final.pdf
- 40.
World Wildlife Fund. “WWF Living Forests Report: Chapter 5.” Accessed November 23, 2016. http://awsassets.panda.org/downloads/lfr_chapter_5_executive_summary_final.pdf
- 41.
Martin. On the Edge. 66.
- 42.
FAO. “Live Animals: World + (Total): Cattle: 2014.” Accessed April 13, 2017. http://www.fao.org/faostat/en/#data/QA
- 43.
Gerber, P.J., H. Steinfeld, B. Henderson, A. Mottet, C. Opio, J. Dijkman, A. Falcucci and G. Tempio. “Tackling Climate Change through Livestock—A Global Assessment of Emissions and Mitigation Opportunities.” Food and Agriculture Organization of the United Nations (FAO), Rome. 2013. Accessed April 13, 2017. http://www.fao.org/3/i3437e.pdf. 15.
- 44.
OECD. “Meat Consumption.” Accessed February 20, 2017. https://data.oecd.org/agroutput/meat-consumption.htm
- 45.
Martin. On the Edge. 97.
- 46.
Martin. On the Edge. 98.
- 47.
IndexMundi. “Soybean Oil Domestic Consumption by Country in 1000 MT.” Accessed February 20, 2017. http://www.indexmundi.com/agriculture/?commodity=soybean-oil&graph=domestic-consumption
- 48.
OECD. “Crop Production: Soybean, Thousand Tonnes, 2015.” Accessed February 20, 2017. https://data.oecd.org/agroutput/crop-production.htm#indicator-chart
- 49.
Martin. On the Edge. 91.
- 50.
IndexMundi. “Palm Oil Production by Country in 1000 MT.” Accessed February 20, 2017. http://www.indexmundi.com/agriculture/?commodity=palm-oil
- 51.
IndexMundi. “Palm Oil Domestic Consumption by Country in 1000 MT.” Accessed February 20, 2017. http://www.indexmundi.com/agriculture/?commodity=palm-oil&graph=domestic-consumption
- 52.
Thoumi, Gabriel. “The Chain: Indonesia Strengthens Peatlands Moratorium; ING Places €80 Million in Debt for SocFin’s Palm Oil and Rubber Expansion.” Chain Reaction Research. Last modified December 7, 2016. https://chainreactionresearch.com/2016/12/07/the-chain-indonesia-strengthens-peatlands-moratorium-ing-places-e80-million-in-debt-for-socfins-palm-oil-and-rubber-expansion/
- 53.
Food and Agriculture Organization of the United Nations. “Global Forest Resources Assessment 2015: Desk Reference.” Accessed March 24, 2017. http://www.fao.org/3/a-i4808e.pdf. 52–57.
- 54.
World Bank’s World Integrated Trade Solution. “Wood.” Accessed February 20, 2017. http://wits.worldbank.org/CountryProfile/en/Country/WLD/Year/2015/TradeFlow/Export/Partner/by-country/Product/44-49_Wood
- 55.
Martin. On the Edge. 72.
- 56.
Martin. On the Edge. 78.
- 57.
Pearson, Timothy R. H., Sandra Brown, Lara Murray and Gabriel Sidman. “Greenhouse Gas Emissions from Tropical Forest Degradation: An Underestimated Source.” Carbon Balance and Management. 12(3). 2017. 1. doi:10.1186/s13021-017-0072-2. http://rdcu.be/pfzy
- 58.
Eco-Business. “Indonesia Study Disputes UN Data on Peat Fire Emissions.” Last modified July 25, 2016. http://www.eco-business.com/news/indonesia-study-disputes-un-data-on-peat-fire-emissions/?utm_medium=email&utm_campaign=July%2027%20newsletter&utm_content=July%2027%20newsletter+Version+B+CID_3967427e26718a3032e32d81092a4c21&utm_source=Campaign%20Monitor&utm_term=Indonesia%20study%20disputes%20UN%20data%20on%20peat%20fire%20emissions
- 59.
Huijnen, V., M. J. Wooster, J. W. Kaiser, D. L. A. Gaveau, J. Flemming, M. Parrington, A. Inness, D. Murdiyarso, B. Main and M. van Weele. “Fire Carbon Emissions Over Maritime Southeast Asia in 2015 Largest Since 1997.” Scientific Reports 6, Article number: 26886 (2016). doi:10.1038/srep26886.
- 60.
World Bank. “The Cost of Fire: An Economic Analysis of Indonesia’s 2015 Fire Crisis.” Accessed February 2016. http://documents.worldbank.org/curated/en/776101467990969768/pdf/103668-BRI-Cost-of-Fires-Knowledge-Note-PUBLIC-ADD-NEW-SERIES-Indonesia-Sustainable-Landscapes-Knowledge-Note.pdf. 1.
- 61.
Wakker, Eric, Jan Willem van Gelder, Joel Finkelstein and Ben Cushing. “New Analysis: Fires Burn Southeast Asian Assets.” Last modified December 1, 2015. Chain Reaction Research. https://chainreactionresearch.com/2015/12/01/indonesia-fires-analysis/
- 62.
Thoumi, Gabriel. “The Chain: BlackRock Calls Out Deforestation as Climate Risk; SE Asia 2015 Haze Death Toll Could Top 100,000; Sime Darby Launches Responsible Agriculture Charter.” Chain Reaction Research. Last modified September 22, 2016. https://chainreactionresearch.com/2016/09/22/the-chain-blackrock-calls-out-deforestation-as-climate-risk-se-asia-2015-haze-death-toll-could-top-100000-sime-darby-launches-responsible-agriculture-charter/
- 63.
Rodrigues de Mello, Natália Girão. “The Alarming Number of Fires in the Brazilian Amazon.” Mongabay. Last modified September 8, 2016. https://news.mongabay.com/2016/09/the-alarming-number-of-fires-in-the-brazilian-amazon/
- 64.
Erickson-Davis, Morgan. “Massive Wildfire Rips through Congo Rainforest—Is Logging to Blame?” Mongabay. Last modified March 23, 2016. https://news.mongabay.com/2016/03/massive-wildfire-rips-through-congo-rainforest-is-logging-to-blame/
- 65.
Martin. On the Edge. 249.
- 66.
World Bank. “Population, Total.” Accessed February 20, 2017. http://data.worldbank.org/indicator/SP.POP.TOTL?order=wbapi_data_value_2011+wbapi_data_value+wbapi_data_value-last&sort=desc&year_high_desc=true
- 67.
World Bank. “Population Growth (Annual %).” Accessed February 20, 2017. http://data.worldbank.org/indicator/SP.POP.GROW?order=wbapi_data_value_2011+wbapi_data_value+wbapi_data_value-last&sort=desc&year_high_desc=true
- 68.
United Nations Data Booklet. “The World’s Cities in 2016.” Accessed March 15, 2017. http://www.un.org/en/development/desa/population/publications/pdf/urbanization/the_worlds_cities_in_2016_data_booklet.pdf. 4.
- 69.
Collyns, Dan. “Bolivia approves highway through Amazon biodiversity hotspot.” The Guardian. August 15, 2017. https://www.theguardian.com/environment/2017/aug/15/bolivia-approves-highway-in-amazon-biodiversity-hotspot-as-big-as-jamaica.
- 70.
Martin. On the Edge. 70.
- 71.
Sullivan, Zoe. “Brazil’s Dispossessed: Belo Monte Dam Ruinous for Indigenous Cultures.” Mongabay. December 6, 2016. https://news.mongabay.com/2016/12/brazils-dispossessed-belo-monte-dam-ruinous-for-indigenous-cultures/
- 72.
Costanza, Robert, Ralph d’Arge, Rudolf de Groot, Stephen Farber, Monica Grasso, Bruce Hannon, Karin Limburg, Shahid Naeem, Robert V. O’Neill, Jose Paruelo, Robert G. Raskin, Paul Sutton and Marjan van den Belt. “The Value of the World’s Ecosystem Services and Natural Capital.” Nature. 387. 15 May 1997. http://www.esd.ornl.gov/benefits_conference/nature_paper.pdf. 253–260.
- 73.
The Economics of Ecosystems and Biodiversity. “Ecosystem Services.” Accessed November 23, 2016. http://www.teebweb.org/resources/ecosystem-services/
- 74.
TEEB. “The Initiative.” Accessed February 20, 2017. http://www.teebweb.org/about/the-initiative/
- 75.
TEEB. “Areas of Work.” Accessed February 20, 2017. http://www.teebweb.org/areas-of-work/
- 76.
Natural Capital Coalition. “History, Vision & Mission.” Accessed December 13, 2016. http://naturalcapitalcoalition.org/who/history-vision-mission/
- 77.
Roberts, J. Timmons and Nikki Demetria Thanos. Trouble in Paradise. 139–140.
- 78.
Maretti, Cláudio. “The Amazon: There is Hope!—If We All Do the Right Thing.” In On the Edge, written by Claude Martin. Berkeley: Greystone Books, 2015. 204–205.
- 79.
Daily, Gretchen C. and Katherine Ellison. The New Economy of Nature. 172.
- 80.
Daily, Gretchen C. and Katherine Ellison. The New Economy of Nature. 6.
- 81.
Blue Channel 24. “The Tapir or Danta, the Unknown Gardener from South American Forests.” Last modified December 22, 2011. https://bluechannel24web.wordpress.com/2011/12/22/the-tapir-or-danta-the-unknown-gardener-from-south-american-forests/
- 82.
EcoHealth Alliance. “IDEEAL.” Accessed March 23, 2017. http://www.ecohealthalliance.org/program/ideeal
- 83.
Rulli, Maria Cristina, Monia Santini, David T. S. Hayman and Paolo D’Odorico. “The Nexus between Forest Fragmentation in Africa and Ebola Virus Disease Outbreaks.” Scientific Reports. 7. Article Number: 41613 (2017). doi:10.1038/srep41613. http://www.nature.com/articles/srep41613
- 84.
Smith, P., M. Bustamante, H. Ahammad, H. Clark, H. Dong, E.A. Elsiddig, H. Haberl, R. Harper, J. House, M. Jafari, O. Masera, C. Mbow, N.H. Ravindranath, C.W. Rice, C. Robledo Abad, A. Romanovskaya, F. Sperling and F. Tubiello. “Agriculture, Forestry and Other Land Use (AFOLU).” In Climate Change 2014: Mitigation of Climate Change. Contribution of Working Group III to the Fifth Assessment Report of the Intergovernmental Panel on Climate Change, edited by Edenhofer, O., R. Pichs-Madruga, Y. Sokona, E. Farahani, S. Kadner, K. Seyboth, A. Adler, I. Baum, S. Brunner, P. Eickemeier, B. Kriemann, J. Savolainen, S. Schlömer, C. von Stechow, T. Zwickel and J.C. Minx. Cambridge, United Kingdom and New York, NY, USA: Cambridge University Press, 2014. 829. https://www.ipcc.ch/pdf/assessment-report/ar5/wg3/ipcc_wg3_ar5_chapter11.pdf
- 85.
Radford, Time. “Vast Carbon Sink Found in Congo Basin.” Climate News Network. Last modified January 15, 2017. http://climatenewsnetwork.net/20810-2/
- 86.
Daily, Gretchen C. and Katherine Ellison. The New Economy of Nature. 7–8.
- 87.
Daily, Gretchen C. and Katherine Ellison. The New Economy of Nature. 143.
- 88.
BBC Nature. “Big Five Mass Extinction Events.” Accessed March 29, 2017. http://www.bbc.co.uk/nature/extinction_events
- 89.
Daily, Gretchen C. and Katherine Ellison. The New Economy of Nature. 157.
- 90.
World Wildlife Fund. “Role of the Global Ecoregions and How They are Selected.” Accessed November 23, 2016. http://wwf.panda.org/about_our_earth/ecoregions/about/role/
- 91.
Naturevolution. “Who We Are.” Accessed November 23, 2016. http://www.naturevolution.org/en/qui-sommes-nous/
- 92.
Martin. On the Edge. XVII.
- 93.
Martin. On The Edge. XX.
- 94.
Martin. On The Edge. 87.
Author information
Authors and Affiliations
Rights and permissions
Copyright information
© 2018 The Author(s)
About this chapter
Cite this chapter
McFarland, B.J. (2018). The Context of Tropical Rainforest Deforestation and Degradation. In: Conservation of Tropical Rainforests. Palgrave Studies in Environmental Policy and Regulation . Palgrave Macmillan, Cham. https://doi.org/10.1007/978-3-319-63236-0_2
Download citation
DOI: https://doi.org/10.1007/978-3-319-63236-0_2
Published:
Publisher Name: Palgrave Macmillan, Cham
Print ISBN: 978-3-319-63235-3
Online ISBN: 978-3-319-63236-0
eBook Packages: Social SciencesSocial Sciences (R0)


