
Abstract
Virtual Reality (VR) had a banner year in 2016. VR has attracted a lot of media attention because many companies have launched Head Mounted Displays (HMDs) and other related products. As a result, the term “immersive feeling” has become more widely known. In this study, we evaluated immersive feeling using HMD. For that purpose, we created two types of content: one expected to generate high immersive feeling and another expected to generate low immersive feeling.
You have full access to this open access chapter, Download conference paper PDF
Keywords
1 Introduction
Virtual Reality (VR) had a banner year in 2016 and has attracted a lot of media attention because many companies have launched Head Mounted Displays (HMDs) and other related products. [1]. As a result, the term “immersive feeling” has become more widely known. In previous studies, immersive feeling was evaluated using 2D or 3D displays [2, 3]. However, those displays can show only a frontal scene. On the other hand, HMD can provide a stereoscopic scene in all directions. Therefore, using HMD would give more a more immersive feeling than 2D or 3D displays. Thus, we planned to evaluate immersive feeling using HMD by creating VR content. We performed an impression survey of the term “immersive feeling,” and performed factor analysis to create VR content and to determine question items for evaluation. We experimentally evaluated immersive feeling in VR systems using HMD with the two created pieces of content. The experimental result suggests a strong correlation between immersive feeling and a sense of excitement.
2 Impression Survey of Immersive Feeling
2.1 Method
The objective is to create VR content giving a high immersive feeling and VR content giving a low immersive feeling.
We created a questionnaire by referencing previous research [4] as follows.
-
1.
Do you know the term “Virtual Reality (VR)”? (yes/no)
-
2.
Do you know the term “Immersive feeling”? (yes/no)
-
3.
If the answer to question 2) is “yes”, go to question 3).
-
4.
Which factors are necessary to give an immersive feeling?
We used a five-point Likert scale (−2 to +2) for this question. The following are the 12 pairs of adjectives used in this question:
-
Dark - Bright
-
Narrow - Wide
-
Extraordinary - Ordinary
-
Stressful - Relaxing
-
Unease - Ease
-
Natural - Artificial
-
Planar - Stereoscopic
-
Vague - Clear
-
Static - Dynamic
-
Boring - Exciting
-
Complex - Simple
-
Not thrilling – Thrilling
2.2 Results and Discussion
The impression survey on immersive feeling was conducted with 84 volunteers in their 20 s. Figure 1 shows results for questions 1 and 2. For question 1, 75 out of 84 (89%) answered yes. Therefore, it can be said that the term VR is generally recognized. For question 2, 35 out of 84 (42%) answered yes, which means that recognition of the term immersive feeling was much lower than that of VR.

Results of awareness of VR and immersive feeling
Table 1 shows descriptive statistics of answers to question 3. We analyzed the results of question 3, and Table 2 presents the results of the factor analysis. Three factors were extracted from the analysis. The main components of these factors are as follows.
-
1.
Ease, Relaxing, Ordinary, Natural
-
2.
Artificial, Clear, Dynamic, Bright
-
3.
Stereoscopic, Thrilling, Complex
Then, we named these factors “Relaxing”, “Active” and “Exciting,” respectively. Figure 2 shows ratios of answers for question 3 for each factor. As shown in Fig. 2, many volunteers answered that the Exciting factor was necessary. Therefore, we focused on the Exciting factor and created content.

Ratios of answers for question 3 in adjective pairs
3 Experimental Method
3.1 System and Content
The purpose of this experiment is to evaluate the degree of immersive feeling in the VR system with HMD.
Figure 3 shows our experimental system.

Experimental system
We created two pieces of VR content based on the results of the impression survey of immersive feeling as follows.
-
Roller coaster content (Fig. 4)
Fig. 4. 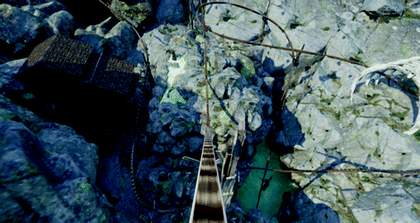
Roller coaster content

This is content that we expect to have high scores for Exciting factor. It contains falling and turning fast.
-
Grassland content (Fig. 5)
Fig. 5. 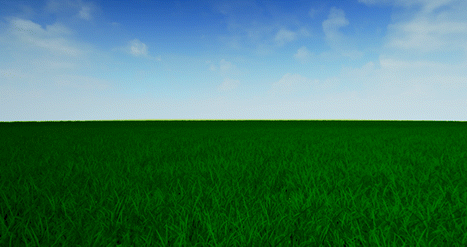
Grassland content

This is content that we expect to have low scores for Exciting factor. It contains only straight, flat forward motion.
We created a questionnaire by referencing previous research [2, 5].
The questionnaire consists of questions related to VR content (Q1~Q6) and immersive feeling (Q7~Q17) as follows.
-
Q1.
I was thrilled by the content.
-
Q2.
I felt the content stereoscopically.
-
Q3.
I felt the content to be simple.
-
Q4.
I felt a response delay in the content.
-
Q5.
I found the sound of the content strange.
-
Q6.
I found the event in the content unnatural.
-
Q7.
I found the content boring.
-
Q8.
I enjoyed the content.
-
Q9.
I was interested to know what might be happening around me.
-
Q10.
I was able to concentrate on content experiences.
-
Q11.
I felt detached from the outside world.
-
Q12.
It felt like only a very short amount of time had passed.
-
Q13.
I felt like I was going forward.
-
Q14.
When I took off the HMD, I was confused.
-
Q15.
I was interested in seeing how the game’s events would progress.
-
Q16.
I enjoyed the graphics and imagery of the game.
-
Q17.
I was immersed in the content.
Evaluation was carried out using a five-point Likert scale (−2 to +2) and free description.
4 Experimental Results
4.1 Experimental
We performed an experiment with eight male participants in their 20 s. The experiment took about 40 min per participant. Each participant experienced the roller coaster content and grassland content, respectively. The order of experiencing content was counter-balanced. Figure 6 shows a scene of the experiment.

Experimental scene
4.2 Experimental Results and Discussion
Based on the results of the questionnaire, we performed a difference test. Figures 7 and 8 show the averages for each question. There were significant differences between the two pieces of content in three items (“Q1~Q3”) for Exciting factor and in eight items out of 11 for immersive feeling. As expected, the roller coaster content had higher scores for Exciting factor and immersive feeling than the grassland content. Table 3 shows the result of correlation analysis for questions related to exciting factor (Q1~Q3) and immersive feeling (Q7~Q17). There are strong correlations between Q1 and nine items out of 11 for immersive feeling (Q7~Q17). There were strong correlations between Q3 and in six items out of 11 for immersive feeling (Q7~Q17). However, there is a strong correlation only between Q2 and (Q7~Q17) (Fig. 8) .

Averages of questionnaire items related to VR

Averages of questionnaire items related to immersive feeling
5 Conclusion and Future Work
We performed an impression survey for the term “immersive feeling,” and performed factor analysis to create VR content and to determine question items for evaluation. We experimentally evaluated immersive feeling in VR systems using an HMD with two pieces of content we created. The experimental results show that the immersive feelings of the two pieces of content differed significantly, along with their impression of “exciting feelings” for users. This result suggests a strong correlation between immersive feeling and excitement. We also performed another experiment with measuring functional near-infrared spectroscopy (fNIRS). Analysis of the experimental results including fNIRS data remains as future work.
References
2016: The Year of VR? - Virtual Reality. Virtual Reality Society. http://www.vrs.org.uk/news/2016-the-year-of-vr
Jennetta, C., et al.: Measuring and defining the experience of immersion in games. Int. J. Human-Comput. Stud. 66(9), 641–661 (2008)
Sakamoto, K., Sakashita, S., Yamashita, K., Okada, A.: Evaluating emotional state during 3DTV viewing using psychophysiological measurements. In: Kurosu, M. (ed.) HCI 2013. LNCS, vol. 8008, pp. 353–361. Springer, Heidelberg (2013). doi:10.1007/978-3-642-39342-6_39
Kohei Iimura et al: The experimental of quantification and assessment of senses of presence and reality, IEICE Technical report, vol. 112, no. 106, pp. 61–66 (2012) (In Japanese)
Witmer, B.G., Singer, M.J.: Measuring Presence in Virtual Environments: A Presence Questionnaire. Presence Teleoperators Virtual Environ. 7(3), 225–240 (1998)
Author information
Authors and Affiliations
Corresponding author
Editor information
Editors and Affiliations
Rights and permissions
Copyright information
© 2017 Springer International Publishing AG
About this paper
Cite this paper
Koinuma, Y., Miyamoto, K., Ohkura, M. (2017). Experimental Evaluation of Immersive Feeling in VR System with HMD. In: Kurosu, M. (eds) Human-Computer Interaction. Interaction Contexts. HCI 2017. Lecture Notes in Computer Science(), vol 10272. Springer, Cham. https://doi.org/10.1007/978-3-319-58077-7_52
Download citation
DOI: https://doi.org/10.1007/978-3-319-58077-7_52
Published:
Publisher Name: Springer, Cham
Print ISBN: 978-3-319-58076-0
Online ISBN: 978-3-319-58077-7
eBook Packages: Computer ScienceComputer Science (R0)