
Abstract
When a block design is needed for controlling the effects of nuisance factors, but the blocks cannot be made sufficiently large to accommodate all the treatments, incomplete block designs can be used instead. Basic design issues of block size, connectedness, and randomization are discussed in this chapter. Balanced incomplete block designs, group divisible designs, and cyclic designs, which are three efficient types of incomplete block designs, are described in greater detail. Formulas for the analysis of incomplete block designs are given, including simplifications for balanced incomplete block designs and group divisible designs. A specific experiment designed as a cyclic group divisible design is described and analyzed. A discussion of sample size calculation and factorial experiments in incomplete block designs is also included. The concepts introduced in this chapter are illustrated through several real experiments. The use of SAS and R software is illustrated for both the design and analysis of incomplete block designs.
Access this chapter
Tax calculation will be finalised at checkout
Purchases are for personal use only
Author information
Authors and Affiliations
Corresponding author
Exercises
Exercises
-
1.
Connectedness and estimability
-
(a)
For each of the three block designs in Table 11.27, draw the connectivity graph for the design, and determine whether the design is connected.
-
(b)
If the design is connected, determine whether or not it is a balanced incomplete block design.
-
(c)
For designs II and III, determine graphically whether or not \(\tau _1-\tau _5\) and \(\tau _1-\tau _6\) are estimable.
-
(d)
For design III, use expected values to show that \(\tau _1-\tau _8\) is estimable.
-
(a)
-
2.
Connectedness
-
(a)
Determine whether or not the cyclic design with initial block (1, 3, 5) is a connected design if \(v=8\) or \(v=9\).
-
(b)
Determine whether or not the cyclic design with initial block (1, 4, 7) is a connected design if \(v=8\) or \(v=9\).
-
(a)
-
3.
Randomization
Conduct a block design randomization for design II in Table 11.27.
-
4.
Cyclic designs
Determine whether or not the cyclic design obtained from each initial block below is a balanced incomplete block design or a group divisible design or neither.
-
(a)
Initial block: 1, 3, 4; \(v=7\).
-
(b)
Initial block: 1, 2, 4, 8; \(v=8\).
-
(c)
Initial block: 1, 2, 4; \(v=5\).
-
(a)
-
5.
Balanced incomplete block design
In the following questions, consider an experiment to compare \(v=7\) treatments in blocks of size \(k=5\).
-
(a)
Show that, for this experiment, a necessary condition for a balanced incomplete block design to exist is that r is a multiple of 5 and b is a multiple of 7.
-
(b)
Show that r must be at least 15.
-
(c)
Taking all possible combinations of five treatments from seven gives a balanced incomplete block design with \(r=15\). Calculate the number of blocks that must be in this design.
-
(a)
-
6.
Sample sizes
Consider an experiment to compare 7 treatments in blocks of size 5, with an anticipated error variance of at most 30 squared units.
-
(a)
Assuming that a balanced incomplete block design will be used, how many observations would be needed for the minimum significant difference to be about 50 units for a pairwise comparison using Tukey’s method and a 95% simultaneous confidence level?
-
(b)
Repeat part (a) for a minimum significant difference of 25 units.
-
(c)
Repeat part (a) using Dunnett’s method for treatment versus control comparisons.
-
(a)
-
7.
Least squares estimator, detergent experiment, continued
Consider the balanced incomplete block design in Table 11.8, p. 361, used for the detergent experiment in Sect. 11.4.4.
-
(a)
Show that the least squares estimator \(\hat{\tau }_4-\hat{\tau }_6\) is an unbiased estimator of \(\tau _4-\tau _6\) under the block–treatment model (11.4.2), p. 356 (that is, show that \(E[\hat{\tau }_4-\hat{\tau }_6] = \tau _4-\tau _6\)).
-
(b)
Calculate a confidence interval for \({\tau }_4-{\tau }_6\) as part of a 95% set of simultaneous confidence intervals for pairwise comparisons, using Tukey’s method.
-
(a)
-
8.
Rust experiment
The rust experiment investigated the effect of temperature on the percentage of surface area of a metal sheet exhibiting rust after a given length of time exposed to certain weathering conditions. Five temperatures were examined in the experiment, but only three could be examined at any one time under identical experimental conditions. A balanced incomplete block design was used, formed from two cyclic designs with initial blocks (1, 2, 3) and (1, 2, 4). The data and design are shown in Table 11.28.
-
(a)
Write down a model for this experiment and test the hypothesis of no difference in the effects of the temperature on the percentage of rust, against the alternative hypothesis that at least two temperatures differ. Use a significance level of 0.01.
-
(b)
What does “a significance level of 0.01” in part (a) mean?
-
(c)
Was blocking worthwhile in this experiment?
-
(d)
Give a formula for a 95% set of simultaneous confidence intervals for pairwise comparisons among the temperatures in this experiment. Calculate, by hand, the interval comparing temperatures 5 and 4 (that is, \(\tau _5-\tau _4\)) for illustration. Compare your answer with that obtained from your computer output.
-
(e)
Test the hypothesis that there is no linear trend in the percentage of rust as the temperature increases.
-
(a)
-
9.
Balanced incomplete block design
An experiment is to be run to compare the effects of four different formulations of a drug to relieve an allergy. In a pilot experiment, four subjects are to be used, and each is to be given a sequence of three of the four drugs. The measurements are the number of minutes that the subject appears to be free of allergy symptoms. Suppose the design shown in Table 11.29 is selected for the experiment.
-
(a)
Check that this design is a balanced incomplete block design. (Show what you are checking.)
-
(b)
Show a randomization of this design, explaining the steps of your randomization.
-
(c)
The experiment was run as described, and the block–treatment model (11.4.2), p. 356, was used to analyze it. Some information for the analysis is shown in Table 11.29. Using this information and (11.4.7), p. 358, show that \(Q_1, Q_2, Q_3, Q_4 \) are \(-79.333\), 81.667, \(-158.667\), 156.333, respectively.
-
(d)
Using the information in part (c), give a confidence interval for \(\tau _3 - \tau _2\) assuming that it is part of a set of 95% Tukey confidence intervals.
-
(e)
Test the hypothesis that there is no difference between the effects of the drugs.
-
(f)
The typical model and analysis for a balanced incomplete block design is that of parts (c)–(e). Do you think this is a reasonable model and analysis for the experiment described? Why or why not? (Hint: think about the terms in, and assumptions on, the model.)
-
(a)
-
10.
Step experiment, continued
The step experiment was described in Example 11.7.1 and the data are shown in Table 11.15, p. 373.
-
(a)
Prepare a plot of the treatment averages and examine the linear trends in the heart rate due to step frequency at each level of step height.
-
(b)
Fit a block–treatment model to the data with \(v=6\) treatments representing the six treatment combinations.
-
(c)
Estimate the linear trends in the heart rate due to step frequency at each level of step height separately, and calculate confidence intervals for these.
-
(d)
Write down a contrast that compares the linear trends in part (c) and test the hypothesis that the linear trends are the same against the alternative hypothesis that they are different.
-
(a)
-
11.
Beef experiment
Cochran and Cox (1957) describe experiment that was run to compare the effects of cold storage on the tenderness of beef roasts. Six periods of storage (0, 1, 2, 4, 9, and 18 days) were tested and coded 1–6. It was believed that roasts from similar positions on the two sides of the animal would be similar, and therefore the experiment was run in \(b=15\) blocks of size \(k=2\). The response \(y_{hi}\) from treatment i in block h is the tenderness score. The maximum score is 40, indicating very tender beef. The design and responses are shown in Table 11.30.
-
(a)
What is the value of \(\lambda \) for this balanced incomplete block design?
-
(b)
What benefit do you think the experimenters expected to gain by using a block design instead of a completely randomized design?
-
(c)
Calculate the least squares estimate of \(\tau _6 - \tau _1\) and its corresponding variance.
-
(d)
Calculate a confidence interval for \(\tau _6 - \tau _1\) as though it were part of a set of 95% confidence intervals using Tukey’s method of multiple comparisons.
-
(e)
Calculate a confidence interval for the difference of averages contrast
$$ \frac{1}{3}(\tau _4 + \tau _5 + \tau _6) - \frac{1}{3}(\tau _1 + \tau _2 + \tau _3)\,, $$assuming that you want the overall level of this interval together with the intervals in part (d) to be at least 94%. What does your interval tell you about storage time and tenderness of beef?
Table 11.30 Design and data for the beef experiment -
(a)
-
12.
Balanced incomplete block design
-
(a)
Explain under what circumstances you would choose to use a block design rather than a completely randomized design.
-
(b)
For a balanced incomplete block design, why is it incorrect to estimate the difference in the effects of treatments i and p as \(\overline{y}_{.i}-\overline{y}_{.p}\)? What is the formula for the correct least squares estimate and its corresponding variance if the design of Table 11.2, p. 351, is used?
-
(c)
Suppose that the design of Table 11.2 is used for an experiment with \(v=7\) treatments and \(b=3\) blocks of size \(k=3\), and suppose that
$$ \hat{\tau }_1=31.6,~ \hat{\tau }_2=22.4,~ \hat{\tau }_3=17.9,~ \hat{\tau }_4=21.5,~ \hat{\tau }_5=30.2,~ \hat{\tau }_6=18.6,~ \hat{\tau }_7=25.5\,. $$Calculate a set of 99% confidence intervals for comparing the effect of treatment 1 with the effects of the other treatments. State your conclusions.
-
(a)
-
13.
Lithium bioavailability experiment
An experiment described by W. J. Westlake (Biometrics, 1974) used a balanced incomplete block design to compare the amount of four formulations of lithium carbonate that were present in the blood serum of subjects several hours after administration. The four levels of the factor “formulation” consisted of 300 mg capsule (level 1), 250 mg capsule with different inert ingredients (level 2), 450mg delayed release capsule (level 3), 300 mg in solution (level 4). Level 4 is the standard (control) treatment. Table 11.31 shows the amounts of lithium carbonate in the blood serum after 3 hours, measured in mEq (milliequivalent which is a measure of the quantity of ions in an electrolyte fluid). There were 12 subjects, each of whom was given two formulations (one week apart).
-
(a)
Verify that the design in Table 11.31 is a balanced incomplete block design.
-
(b)
Plot the observations on the treatments adjusted for the block (subject) effects), and explain what the plot shows.
-
(c)
Test, at level .01, the hypothesis that the four formulations have the same effect on the amount of lithium carbonate in the blood serum after 3 hours.
-
(d)
Calculate a set of 99% simultaneous confidence intervals for the pairwise comparisons of the formulations and state your conclusion.
-
(e)
Calculate a set of 99% simultaneous confidence intervals for the comparisons of the three test formulations with the control (level 4). State your conclusion.
-
(a)
-
14.
Plasma experiment, continued
In the plasma experiment of Sect. 11.5, the experimenters used the cyclic design for six treatments generated by 1, 4, 5.
-
(a)
Show that the cyclic design is also a group divisible design by determining the groups and the values of \(\lambda _1\) and \(\lambda _2\).
-
(b)
The design for day one of the experiment consisted of the following three blocks of size three: (1, 4, 5); (2, 5, 6); (3, 6, 1). Show that this design is connected by drawing the connectivity graph of the design.
-
(a)
-
15.
Group divisible design
-
(a)
Show that the design in Table 11.32 with \(v=12\) treatments and \(b=9\) blocks of size \(k=4\) is a group divisible design with \(g=4\) groups of size \(\ell =3\). Find the groups and calculate \(\lambda _1\) and \(\lambda _2\).
-
(b)
Using the values of \(\lambda _1\) and \(\lambda _2\) in part (a), show that the requirements in Sect. 11.3.2, p. 354, for a group divisible design are met.
-
(c)
Fit model (11.4.2), p. 356, to these data and check the assumptions on the error variables by plotting the residuals.
-
(d)
Treatment 1 is the control treatment. Using the formulae in Sect. 11.4.5, p. 365, calculate the two possible variances of \(\hat{\tau }_1-\hat{\tau }_p\), \(p=2, \ldots , 12\).
-
(e)
Calculate the two possible lengths of 99% confidence intervals for treatment versus control contrasts using Scheffé’s method, and verify your calculations using a computer program.
-
(f)
What can you conclude about the control treatment in this experiment?
-
(g)
Using (4.2.4), p. 73, find the linear trend coefficients for 12 equally spaced treatment levels. If the treatment code corresponds to milliliters of added sugar to a product, and the response is a taste score, test the hypothesis that the linear trend in score as the amount of sugar increases is negligible. Use a significance level of \(\alpha =0.01\) and a two-sided alternative hyothesis.
-
(a)
-
16.
Fabric stain experiment
The experiment was run by M. Nelson, T. Blake, D. Sullivan, A. Kemme and J. Jia in 2008 to examine how best to remove a stain caused by black waterproof drawing ink. There were three factors under consideration as follows. Factor A was type of cloth (1 \(=\) cotton, 2 \(=\) polyester), Factor B was type of pre-treatment (1 \(=\) gel stain remover, 2 \(=\) antibacterial dish soap, 3 \(=\) no pre-treatment), and Factor C was time between staining and washing (0, 1, 2 days, coded as levels 1, 2, 3). The experiment was run in several blocks; in some blocks the washing machine was set to the hot wash setting, and the others to the cold wash setting.
Thirty six pieces of fabric of each type were prepared of approximately the same size. The amount of ink applied to each piece of cloth was held constant, as was the amount of detergent used in each wash. The stained fabric samples were evaluated by a single experimenter using a “Gray Scale” (cf. Chapter 10, Exercise 14) both before and after the wash. The differences between the pairs of evaluations formed the responses and are shown in Table 11.33. The order of the samples was randomized and unknown to the evaluator.
-
(a)
Show that, for this design, pairs of treatments occur together in \(\lambda _1\) or \(\lambda _2\) or \(\lambda _3\) blocks, where these values are different. (This means that there are three different lengths of confidence intervals for treatment contrasts). Thus, argue that the design cannot be a balanced incomplete block design or a group divisible design.
-
(b)
For the standard block–treatment model (11.4.2), p. 356, with \(b=6\) blocks and \(v=18\) treatments, write down the contrast coefficient lists for the following contrasts:
-
(i)
the comparison of treating the stain immediately as compared with the average of the 1 and 2 day delays,
-
(ii)
the comparison of no pre-treatment versus the average of the two types of pre-treatment,
-
(iii)
the comparison of a 1 or 2 day delay for each level of pre-treatment separately.
-
(i)
-
(c)
Prepare an analysis of variance table and test the hypothesis that each contrast in part (b) is negligible. Use an overall significance level of not more than 0.1. State your conclusions.
-
(d)
Using Scheffé’s method of multiple comparisons at confidence level 95%, state which pairs of treatments are significantly different and give the confidence intervals for these.
-
(e)
From Scheffé’s multiple comparisons calculated in part (d), verify that the confidence intervals for \(\tau _1-\tau _p\), for \(p=2, \ldots , 18\), are of three different lengths, and that the shorter lengths correspond to larger values of \(\lambda _i\).
-
(f)
Using a factorial model for the treatment effects, prepare an analysis of variance table. State your conclusions and, repeat part (c) for the first two contrasts in (b). Use the mapping of treatment labels to levels of A, B, C as:
$$ \begin{array}{rrrrrr} 1=111&{} 2=112&{} 3=113&{} 4=121&{} 5=122&{} 6=123\\ 7=131&{} 8=132&{} 9=133&{} 10=211&{} 11=212&{} 12=213\\ 13=221&{} 14=222&{} 15=223&{}16=231&{} 17=232&{} 18=233 \end{array}$$ -
(g)
Does this design have “factorial structure” as defined in Sect. 11.7.1?
-
(a)
-
17.
Air rifle experiment
This is a dangerous experiment that should not be copied! It requires proper facilities and expert safety supervision.
An experiment was run in 1995 by C.-Y. Li, D. Ranson, T. Schneider, T. Walsh, and P.-J. Zhang to examine the accuracy of an air rifle shooting at a target. The two treatment factors of interest were the projectile type (factor A at levels 1 and 2) and the number of pumps of the rifle (factor B, 2, 6, and 10 pumps, coded 1, 2, 3). The paper covering the target had to be changed after every four observations, and since there were \(v=6\) treatment combinations, coded 11, 12, 13, 21, 22, 23), an incomplete block design was selected.
Two copies of the following incomplete block design (called a generalized cyclic design) were used:
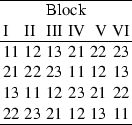
The total of 12 blocks were randomly ordered, as were the treatment combinations within each block. The data, shown in Table 11.34, are distances from the center of the target measured in millimeters.
-
(a)
Write down a suitable model for this experiment.
-
(b)
Check that the assumptions on your model are satisfied.
-
(c)
The experimenters expected to see a difference in accuracy of the two projectile types. Using a computer package, analyze the data and determine whether or not this was the case.
-
(d)
For each projectile type separately, examine the linear and quadratic trends in the effects of the number of pumps. State your conclusions.
-
(a)

Rights and permissions
Copyright information
© 2017 Springer International Publishing AG
About this chapter
Cite this chapter
Dean, A., Voss, D., Draguljić, D. (2017). Incomplete Block Designs. In: Design and Analysis of Experiments. Springer Texts in Statistics. Springer, Cham. https://doi.org/10.1007/978-3-319-52250-0_11
Download citation
DOI: https://doi.org/10.1007/978-3-319-52250-0_11
Published:
Publisher Name: Springer, Cham
Print ISBN: 978-3-319-52248-7
Online ISBN: 978-3-319-52250-0
eBook Packages: Mathematics and StatisticsMathematics and Statistics (R0)