
Abstract
This chapter provides a profile of Europe’s neighbouring territories. It highlights the role of transport and energy networks, which draw the delineation of the region. Europe is the centre of this area, and dominates the exchanges in a core-periphery pattern with its neighbours. Yet, we show that the European influence in the region is declining, especially in the Middle East, and in Eastern Europe where Russia is recreating its former area of influence thanks to its Eurasian customs union. What prospective can be figured out? The neighbourhoods offer key opportunities to Europe in terms of workforce, markets and business opportunities. Energy, too, is a major field of potential cooperation and win-win opportunities with the neighbours; but it could also prove worrisome if we cannot implement collectively the energy transition –air pollution does not stop at EU borders. Moreover, Europe has to confront many challenges in its neighbourhoods: environmental risks, water scarcity, non-inclusive growth, political unrest. The prerequisite to turn ignorance into cooperation is changing the Europeans’ vision on their neighbours. For the moment, European press pays scant attention to them, as is underlined in the last section.
You have full access to this open access chapter, Download chapter PDF
Keywords
These keywords were added by machine and not by the authors. This process is experimental and the keywords may be updated as the learning algorithm improves.
2.1 Overview
2.1.1 Main Figures
Climatic conditions constitute a major component of the neighbouring regions, when it comes to the issue of transport in the North or to solar electricity potential in the South. Settlement is largely explained by climatic constraint, with low density in the northernmost and in the southernmost areas (Map 2.1). In Russia the severe continental climate contributes to explain an overall low density, even at what is usually called “temperate” latitudes. In the Near East and in North Africa the littoral band hosts the vast majority of the population, yet the desert extends to the littoral in Libya between Tripolitania and Cyrenaique, and between the latter and the Nile delta. Huge demographic concentration can be seen on the Near East littoral from Gaza, Israel, Lebanon, western Syria up to southern Turkey around Iskenderun; and of course in the very large cities of the neighbour countries: Moscow, Istanbul and its Marmara’s urban region, to a much lesser extent the Maghreb large cities. But no place in the neighbourhoods displays a bigger demographic concentration than the Nile valley, from Luxor to the Mediterranean coast.

Population at (S)NUTS 3 level, 2010
These countries include 508 million inhabitants (2011, national scale i.e. including whole Russia here see Table 2.1), with a rapid growth in the Mediterranean neighbourhood and a decrease of the population in the other neighbourhoods. As a whole the neighbourhoods’ share of the world population is decreasing but their share in the world’s GDP has been rising in the last fifteen years, thanks to the recovery of the former Soviet countries after the difficult phase of transition, and to quite strong economic growth in the Mediterranean neighbourhood especially in Turkey. The overall GDP per capita of the neighbourhoods has increased from US$ 2000 in 1994 to 8000 in 2011; this means that Europe is surrounded by regions which represent important market opportunities. As the demographic transition is deeply advanced in all these countries including the Arab countries, the social structures and issues (“oldies boom” namely) are converging with that of the EU.
In terms of the environment, the issues are very important (climate change, pollution, energy resources and transition …) and diversified in such a vast area. This can be seen with the greenhouse gas figures, which range from 0.5 t per capita in the occupied Palestinian territory to more than 15 t in Russia. The poorest of these countries have the lowest figures but they are rising rapidly which makes environment a stake common to Europe and its neighbours.
The land cover map (Map 2.2) shows the different typologies of vegetation cover in EU and the neighbourhoods. EU borders separate continuous biotopes, even if the vegetal cover decreases rapidly southward. Due to the large geographic coverage, there are many types of land areas present, from harsh climatic regions in the North and South extremes with tundra and desert to temperate areas with croplands and forests. Desert is the biggest feature of all the area with about 30 % of the entire surface, whereas croplands come second with 20 %. These croplands are concentrated between 43 and 55° of latitude and extend eastward but with a decreasing gradient. This highlights the potential of the neighbourhoods for primary sectors such as agriculture and energy generation.

Land cover, 2000
2.1.2 Transport and Energy Networks Make the Region
We provide here, for the first time, a thorough cartography of the transport network of the greater European region ca 2010. Map 2.3 displays the network density: all the European territory is meshed, to varying degrees but meshed nonetheless, including eastern Europe up to Moscow and including Turkey on its European territory up to central Anatolia. In the Arab neighbour countries, the network is much more limited, for geo-climatic reasons as well as economic reasons.

Demographic density and main transport network in the greater European region, ca 2010
The road network is less dense than in the EU. This is especially true for most remote Russian regions and for the desert areas in North Africa and eastern Mediterranean. The network is dense in the Eastern Mediterranean coast but rapidly becomes sparser when moving away from the coast, except in the Nile valley, where it is fairly good up to Aswan. A similar pattern exists in the Maghreb, with good road provision near the coast that worsens when moving far away from it. The quality of the networks is also quite different, as the number of high capacity roads with lane separation is much smaller in all the neighbourhoods; they only are significant in Turkey, part of the Eastern Mediterranean coast and part of the Maghreb. Some borders are closed and crossing others involves long administrative delays; this happens mainly in the southern (in particular between Morocco and Algeria) and eastern Mediterranean countries (due to the political unrest in the Near East), but also, to a minor extent, between Russia and Ukraine.
The rail network is sparser and patchier than the road network, and of lower quality than in the EU, with a very limited network in the Maghreb, the Eastern Mediterranean and Turkey. Especially noticeable is the absence of a rail network in most of Libya. The Eastern neighbourhood however, especially Russia and Ukraine, has a relatively good provision. While there are almost no barriers for crossing countries by rail in the EU, many neighbour countries have borders that are difficult to cross or even completely closed, such as those between Morocco and Algeria or Palestine and Israel. In some cases links are missing making it impossible to move between neighbouring regions, as for example in the Turkey-Syria or Israel-Jordan borders. The rail network has some additional continuity problems across the neighbourhood as there are incompatibilities between systems in terms of gauge and electrification. High speed rail is currently non-existent throughout all the neighbourhoods, although several projects are at the design stage. Morocco intends to create 1500 km of high-speed rail in the two coming decades, to thoroughly modernise its old inter-city network; a first line will follow the Atlantic coast from Agadir to Tangier and, when financially and politically possible, Algeria.
Thanks to the Euromed Transport Forum, which gathers ministers of transports of both sides of the Mediterranean, some transnational projects aim to give continuity to the networks, thus improving relations between countries. One of those is a high level transport infrastructure (high-speed rail and motorway) that would one day link the Maghreb coast from Casablanca to Tripoli in Libya.
Maps 2.4 and 2.5 give the resulting transport connectivity and accessibility in the greater European region. The number of persons accessible within a time-span of three hours (possible return trip in the day which is an approximation for business needs for interaction) displays a harsh contrast between western Europe and its outskirts. A striking feature is that, along with western Turkey, the northern part of Maghreb is linked to the European territory in terms of accessibility. Another area of important demographic accessibility is the Nile valley but due to dramatic local demographic density and without any connection to Europe. The Eastern neighbourhood but also, more surprisingly, the Western Balkans, are areas of medium to quite low accessibility, due limited local density and/or poor access to western Europe.

Transport connectivity

Accessible population within 3 h
The contrast between Europe and its Mediterranean neighbours is particularly striking in the field of energy networks, including those countries which are important energy providers, such as Algeria and Libya. This shows that their role, on the greater region’s scale, remains basically that of raw material suppliers with low local territorial development.
Map 2.6 shows the high density of gas networks in the North Sea, eastern and central Europe. It also shows the presence of LNG export terminals in the Maghreb; it is related to the growing “spot market” strategy of these countries, at the expense of long-term deliveries thanks to long-term contracts in respect of which the European Commission shows increasing reluctance. Along with the presence of major gas fields in the North Sea, eastern Europe and Maghreb, recent discoveries in the eastern Mediterranean have revived the disputes about maritime boundaries in the area (Israel-Lebanon-Cyprus). The numerous projects of natural gas pipelines in the Balkans could make them an interface between Russia and western Europe. Lastly, the Trans-Saharan gas pipeline project linking Algeria with gas fields in the Gulf of Guinea shows that “neighbours of the neighbours” have to be increasingly taken into account.

Energy networks in the greater European region, ca 2010
The main features for oil are the presence of pipelines in the neighbouring countries (Russia, Maghreb, Near East, Caucasus), and again the numerous projects of crude oil pipelines in the Balkans.
The main features for electricity are the numerous nuclear power plants in western Europe especially Germany, France and Belgium; the very high voltage network in Russia; the high density of the electricity grid in the centre of the EU, decreases with distance from European metropolitan areas. The “Medring” project is a key project for improved electricity connection between the North and the South of the Mediterranean. It aims at connecting the North African countries between themselves and with European countries (Spain, Italy) using high voltage lines; a connection already exists between Maghreb and western Europe, but at a low voltage.
2.1.3 The (Relative) Importance of Neighbours for Europe
In this section, we assess the regional integration between the EU space (plus Iceland, Liechtenstein, Norway and Switzerland) and the neighbour countries. The driving question is to know if interaction (economic flows, human and migratory flows, energy supply) shows a trend toward integration or rather de-integration. Our answer is threefold. Starting from the EU perspective, we first assess the importance of neighbourhoods for the EU in comparison to other world regions. Then taking the reverse perspective, we assess whether the EU is important for neighbouring countries and, moreover, how this importance has evolved across time. Finally, changing the scale of analysis, we assess the geographical diversity of relations between European and neighbouring countries, showing that the latter have privileged relations with specific European countries.
Europe’s influence around the world has dramatically declined over the years (Van Hamme 2012). It is increasingly limited to its immediate neighbourhood. However, this does not mean that the neighbourhoods are the most important partners for the EU.
From an economic point view, we first assess the growth potential for the EU in the decade 2010–2020 on the basis of a simple model: we extend the average growth rate of the years 2000–2010 to the next decade; in a second step we assess what it means for the EU, considering the current geography of its trade (the basic idea is that EU will benefit more from growth in areas where the EU currently has more market shares). By far, the EU is the major source of potential growth for itself in the next decade. Then we have three major market growth potentials: the US, around 11 % of the growth potential of the EU; China, with 9 % in current $ and 19 % in PPS; and the neighbourhoods, with shares very similar to the US. However, more than half of this potential growth is toward the East (eastern neighbours and Russia, Map 2.7); Turkey also plays a significant role, while the other neighbourhoods remain marginal for the EU growth potential because of their marginal economic weight.

Growth markets potential for the EU, 2010–2020
In trade and FDI (Table 2.2), the importance of neighbourhoods is limited. The reason is that most trade and FDI are internal in Europe. When these internal flows are excluded, the neighbourhoods appear as the main trade partner of the EU, though they remain very marginal in investment flows. Indeed, 7.5 % of EU trade takes place with the neighbourhoods, while the US only accounts for 6.2 and China for 2.2 % of the European trade. Half of the trade toward the neighbourhoods is with Russia and other European former Soviet Republics, while the rest is dispersed among the different neighbourhoods.
Human flows can be tackled from two different perspectives: airflows, which mainly take into account short-term mobility for medium and long distances, and migrations toward Europe. Short-term mobility (airflows) is mainly intra-European since 80 % of all movements are within European countries. Flows with neighbourhoods, equally toward Turkey, former Soviet republics and Maghreb, account for more than 7 % of the flows, more than any other part of the world. It indicates a clear distance effect. Regarding migrations, neighbourhoods account for 30 % of the stocks of migrants in Europe, while Europeans themselves only account for 38 %. Hence, Europe and its neighbourhoods account for most of the origins of migrants present in Europe.
Finally, neighbourhoods play also a major role for energy supply in Europe. Europe provides 42 % of its energy while neighbourhoods provide 32.5 %, two thirds from Russia and the rest from Maghreb, mostly Algeria and Libya. Oil and gas producers of the Middle East play a limited role in comparison, with 9 % of the energy supply for Europe.
What results from the figures is that neighbourhoods play an important role in two domains: migrations and energy supply. The ENP focuses on these aspects as well as security matters (Richard 2012). In contrast, neighbourhoods are not considered as strategic economic partners (only 7.5 % in the EU trade in goods), as well as in many other domains such as scientific cooperation.
2.1.4 The Strong but Declining Importance of Europe for Neighbours
We now take the reverse perspective: what is the importance of Europe within relations of the whole set of neighbour countries with the world? Most figures illustrate the declining importance of the EU in neighbours’ flows. The share of the EU in neighbours’ trade is declining for all neighbours except the Eastern neighbourhood (including Russia) which has become a key partner in energy. In air flows, the EU is increasingly important for Maghreb and the Western Balkans and the opposite trend for the Near East and Eastern neighbours.
If we now turn to the relations of the neighbours with themselves, we find very poor integration, with the notable exception of the Eastern neighbourhood which has a moderate and declining economic integration but intense human and related air flows. In the Maghreb, the integration is poor and stagnant. A similar pattern is found in the Near East despite an important increase in human flows.
Europe is by far the main if not hegemonic partner for Western Balkans and Maghreb—to a lesser extent for Algeria, the result of a political choice to sell oil resources not only to Europe but also to the US. European dominance is similar for Croatia (with figures prior to EU membership); in contrast to the Maghreb however, Croatia maintains important relations with the neighbouring Balkans, notably through trade and flight connections. For the former USSR, the persistence of flows between former USSR republics explains the lower importance of Europe; Map 2.8 illustrates this situation for Ukraine for which relations are balanced between Europe and Russia. When it comes to Russia, polarisation toward western Europe is more intense, except for migratory stocks because of the presence of Russians in all former USSR republics.

The geography of relations of Ukraine, around 2010
In the Near East, the low share of Europe in global flows is the result of the European decline versus the increasing importance of the oil powers of the Gulf. The Jordan case illustrates this importance of Gulf countries, even if the EU remains an important partner for trade and the second largest donor of development aid behind the US. For Egypt, economic flows are still dominated by Europe; however, in terms of flight connections and migrations, relations with the Middle East have become central. Finally, Turkey is strongly polarised toward Europe though a little less than before (Map 2.9).

The geography of relations of Turkey, around 2010
Recent trends confirm the declining role of Europe for the international flows of its neighbours. In the case of container flows by global vessel movements in 1996 and 2006, North Africa, the Black Sea and the Russian Baltic areas made rather moderate volumes in absolute terms but the share of Europe in their total traffic was the highest. However, in ten years this European share has reduced from over 50 % to between 30 and 50 % due to the import of manufactured goods from Asian countries rather than from Europe. A similar pattern is obtained when considering all commodity flows (containers but also bulks, vehicles, general cargo) for the year 2004: more than 50 % of North Africa and the Black Sea/Russian Baltic areas’ traffics was with European countries, but this time with higher absolute volumes due to the great importance of liquid bulk traffics such as natural gas, crude oil, and refined oil, the rest of such traffic being imported by Europe through pipelines and therefore not being counted in maritime flows. Data for containers and bulks in 2004 and 2011 confirm the drastic shrink of Europe’s external maritime influence globally but with a maintained dominance in its nearest regions, those of Eastern and Southern neighbourhoods.
Looking to the 1990–2012 period, we observe similarities with the evolution of flight connections. The most striking changes take place in the Near East: in the last two decades, we observe a reorientation of flows toward the Middle East mainly to the disadvantage of western Europe for Jordan, Syria and Lebanon. There has also been a rapid decline in western Europe for flight connections with Israel and Turkey, though this results from diversification rather than the emergence of a new polarisation.
2.1.5 The Prevailing Core-Periphery Pattern
Most EU neighbours can be considered as semi-peripheral or peripheral countries (Van Hamme and Pion 2012). It reflects the dependence on Europe in qualitative and quantitative terms. Europe is more important to its neighbours than the neighbours are for Europe. Moreover, the exchanges are unequal in their nature: the EU buys primary or low added value manufactured products while selling products with medium and high technological content. Some countries tend to move from a pure peripheral position, mainly selling primary goods, toward specialisation in low added value manufacturing goods: Turkey and Tunisia are the best examples; Egypt is less clearly engaged in this path while Morocco is still highly specialized in mining and agricultural products. Last, qualified labour force is attracted to western Europe while tourist flows take the reverse direction (Grasland and Van Hamme 2010; Van Hamme 2012).
Let us detail the cases of Tunisia and Turkey’s trade, two typical examples. With western Europe, by far their main partner, both countries show a negative balance in all sophisticated products (chemical, mechanical industry etc.) and a positive balance in agro-food and textile goods; with more peripheral countries (North African neighbours for Tunisia or Gulf countries for Turkey), both countries show positive balances in all types of products except primary goods. A similar pattern is observed for the Ukraine, buying sophisticated goods in western and central Europe, while having a positive balance in these goods with Russia, their first trade partner. More peripheral positions are also observed as in the case of Morocco: the country has a positive trade balance in textile and primary goods and negative balances in other types of products, whichever region Morocco is trading with.
2.1.6 Neighbours’ Preferential Relations with Specific EU Countries
In Map 2.10 on air connections, development aid, migratory stocks and trade around 2010, countries are classified according to the relative intensity of their relations. Countries of Europe and of the neighbourhoods are grouped together if their relations are more intense than expected on the base of their respective size:
-
The first coherent area includes south-western Europe and the Maghreb; the precise limits of this group vary according to the flows considered but it always includes France, Morocco, Algeria and Tunisia. It confirms the strong polarisation of the Maghreb toward this part of Europe, along with low interrelations between countries of the Maghreb.
-
Former USS republics are always grouped together forming a second coherent area.
-
Germany also forms a third coherent area with central-eastern European countries. In the case of air and cooperation flows, this area is grouped together with former USSR.
Map 2.10 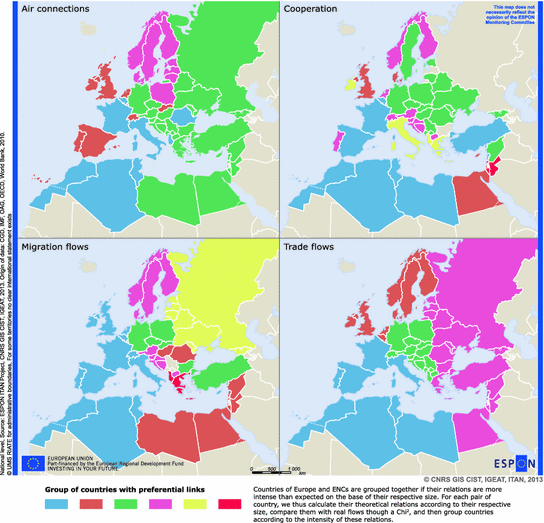
Privileged relations within the greater European region, 2010. Note countries of Europe and neighbour countries are grouped together if their relations are more intense than expected on the base of their respective size. For each pair of country, we thus calculate their theoretical relations according to their respective size, compare them with real flows through a Chi2, and then group countries according to the intensity of these relations

All these geographical analyses drive to the following synthesis:
-
The former USSR is the only part of the neighbourhoods which forms a cohesive area, with declining, though important, interrelations. As a result, Russian neighbours such as the Ukraine, Moldavia or Belarus are equally polarised by Russia and the European Union;
-
The Western Balkans, though maintaining important internal relations, are nearly exclusively turned towards the EU, mainly central Europe but also, in relative terms, Nordic countries;
-
The Maghreb remains highly polarised toward Europe, mainly south-western Europe. Unlike the former USSR, countries of the Maghreb have poor internal relations, each country being strongly polarised toward Europe;
-
Turkey is strongly, though decreasingly, oriented toward Europe in its external relations but does not belong to any cohesive regional area;
-
The Near East, including Egypt, is decreasingly oriented toward Europe and has seen the influence of the Gulf powers increase considerably in the last decade.
2.2 The Neighbourhoods: Opportunities and Challenges for Europe
In this section, we compare the greater European region to other world leading regions, namely East Asia and North America. Within the European region we distinguished between western Europe and the new member states (who became members in 2004 and 2007) because these former European neighbours constitute a useful comparison for the actual neighbours.
2.2.1 Opportunities: Labour Forces, Markets, Investment
For European actors, the neighbourhoods constitute opportunities because of their natural resources, but there are other reasons. Neighbourhoods are opportunities thanks to their demographic and economic size, which is increasing, in particular in the Mediterranean neighbourhood, although the previous section showed that European investment there is low and declining. Here we seek to understand the statement from the previous section: that the neighbourhoods could represent more than 11 % of the global potential growth for Europe in the coming decade.
2.2.1.1 Population Dynamic and Rising Role of Diasporas
The 508 million population of the neighbour countries (2011) increases rapidly in the South, mostly in the eastern Mediterranean. Turkey is a transitional country in many senses. The demographic transition is largely advanced there, and the national territory is split into demographically rising territories and declining territories. For a small part of their national territories, this is also beginning to happen in Tunisia and in Morocco, with an overall strong demographic growth. Conversely, the demographic decline of almost all the Balkans and Eastern neighbour territories is striking (Map 2.11).

The demographic growth in the greater European region, 2000–2010
Map 2.12 shows that the young people of the region are concentrated in the Near East and in some southern parts of North Africa. The older population—considered as an asset when it comes to know-how or as a burden when it comes to pension funding issues—is concentrated in Europe, the Eastern neighbourhood included.

Today’s and tomorrow’s demographic growth, children under 15 in the greater region, 2010

Dependency ratio in the greater European region, a typology
Another demographic asset has to be emphasised: Europe benefits from an important diaspora coming from its neighbourhoods (Fig. 2.1). Given the growing role of diasporas in economic and cultural development, it is important for European public opinion to consider migrants in a new way: they used to be all too often regarded as a social problem (integration, education…), they should be regarded as a solution, even more so given that their level of education is rising. It is of utmost relevance to think in terms of “mobility” rather than of “migration”, because the actual economy is based on the former much more than on the latter. People who live in western Europe as foreigners increasingly come from the neighbourhoods, namely the Mediterranean, and from Sub-Saharan Africa which is an extension of the European area of influence. This is an asset to rely on, given the foreseen development of Africa in the coming century—which, for the moment, mostly benefits world players other than Europe (Map 2.13).

Europe benefits from an important diaspora from its neighbours
2.2.1.2 Markets
Figure 2.2 on world markets shows several meanings of the “European region”: EU (plus Iceland, Liechtenstein, Norway, Switzerland) plus Western Balkans, plus the Eastern neighbours, plus the Mediterranean neighbours, plus sub-Saharan Africa. In all cases, the contrast of its declining share of the world’s GDP is striking vis-à-vis the huge rise of the East Asian share. But indeed, the larger the European region, the higher its place in the world economy.

World markets: can we cope with the rise of the East Asian region?
Figure 2.3 compares the GDP growth since 1980 in the various neighbourhoods of Europe. Almost all of these neighbourhoods have impressive economic growth, expressed in constant currency; this is undeniably an asset for Europe. Second, the economic hierarchy has dramatically changed: previously, the Eastern neighbourhood was first and the new member states second, they are now in third and fourth position, whilst the Mediterranean and Middle-East neighbourhoods have become first and second; the Western Balkans are now lagging behind.

The neighbourhoods, a driver for European economic growth
This analysis has to be tempered by several facts: (i) the huge transition experienced by the former Socialist countries, with much better growth rates in the 2000s of course; (ii) the driving role of Israel and Turkey among the Mediterranean neighbours, whose performance is much lower if one takes into account the sole Arab countries; (iii) the Arab countries performance is dampened by on-going unrest and wars. Before the beginning of the Arab Spring, the World Bank was forecasting growth rates in 2011 of 4 % in Morocco, Jordan and Algeria, 5 % in Tunisia and Syria, 6 % in Egypt, 7 % in Lebanon; the real rates have been much lower, and nobody knows how long this difficult political transition will last. Still, it has to be highlighted that the European neighbourhoods' growth is experiencing a long term shift from East to South, which is due to continue given the demographic figures presented in the previous section.
The previous section has shown the declining economic integration between Europe and its neighbours. Beyond the European case, the general trend throughout the world is that of a slowing down of economic integration within the major regions over the 2000s, due to the booming importance of a new global player: China, which has become a major trade partner of the countries of the world whichever region they belong to. Should we conclude that the regional integration era is over? Certainly not, because the long run remains in favour of the regionalisation thesis. In the 1960s, only one third of the trade of European countries occurred between themselves and trading links were lower still between the United States, Canada and Mexico. The respective regions are far more integrated today. The major difference between Japan or the US and Europe is that the latter trades very much within the EU and very little with the emerging countries of its neighbourhood (Fig. 2.4).
Over the three last decades, the new European member states have drastically reoriented their trade towards western Europe, instead of the former Soviet bloc. But the reverse is true for the neighbourhoods, which confirms that EU membership is a driver to regional trade integration whereas a neighbour’s status leads to declining integration with Europe. All neighbourhoods of Europe, in the widest sense, including sub-Saharan Africa and Gulf states, send a decreasing share of their exports to Europe and European products represent a decreasing share of their imports. This can be considered good news if it means a wider insertion of these countries in the global economy. This can also be regarded as bad news for Europe’s influence which remains high in its neighbourhoods though undoubtedly declining. The rising markets of the neighbourhoods are an opportunity for Europe to regain its economic influence over them.

The role of the developing neighbours is high in East Asian and American regions
2.2.1.3 Investment
The East Asian region’s boom is based on the complementarity between its national economies: highly developed (Japan), developed (Dragons), and emerging (China…). The developed countries have found growth drivers in their emerging neighbourhood. Figure 2.5 shows this clearly for the investment rate in the Asian region. The complementarities are less obvious between the US and Latin America but nevertheless do exist. In the European region this is the case for Morocco, for instance, but not for Egypt, whilst Ukraine shows a chaotic path. Moreover, since the Arab spring, investment in the Mediterranean neighbourhood has diminished.

Investments in the peripheries of the Triad, slowdown in the centres
The Mediterranean neighbours remain marginal players in the world’s FDI flows. North Africa attracts less than 1 % of the world’s FDI inflows, the Arab Near East (i.e. Near-East excluding Israel and Turkey) less than 0.5 %. Turkey is rising but attracts less than 0.8 %. Altogether the Western Balkans and the Eastern neighbourhood attracted 1.1 % of the world’s FDI inflows in the 1990s and 4.3 % in the 2000s. But these figures remain far removed from Asian records. Under the impetus of Japanese enterprises, emerging East Asia attracted 7 % of the world’s FDI inflows in the 1970s, 9 % in the 1990s and 15.5 % (China’s boom) in the 2000s. The post-crisis period confirms this mega trend: in 2007 China attracted US$85 bn, in 2011 the figure reached US$125 bn; the other emerging countries of East Asia US$150 bn and US$210 bn. As a whole, in 2011, the emerging East Asian countries attracted 22 % of the world’s FDI inflows—far ahead of Latin America (10 %), not to speak of the European neighbour countries. In 2014 the figure for emerging East Asian countries reached… 34 % of the world FDI inflows, and was under 7 % for the European neighbourhoods (Map 2.14).

FDI inflows and share in GDP in the 2000s
The low attention paid by the European investors to their neighbourhoods is at stake (Fig. 2.6). At the end of the 2000s, the emerging countries of the region attracted 21 % of Japan FDI outflows, 10 % of US FDI outflows, but only 4 % of European FDI outflows—much less in the Mediterranean neighbourhood despite the fact that many of its territories are experiencing rapid growth.

Europeans do not invest in their neighbourhoods
Seen from the emerging countries’ standpoint, the geography of FDI flows is different, because they rely heavily on investments originating from their developed neighbours. For example Morocco, Tunisia or even Turkey FDI inflows come principally from Europe: 85 % for Morocco, 57 % for Tunisia and 77 % for Turkey at the end of the 2000s. What is the evolution? Again, the role of Europe as FDI provider for the Mediterranean neighbours is declining: from more than 50 % at the beginning of the 2000s to 30 % in 2010 (whilst the figure is 20 % for the Gulf as the origin of FDI invested in the Mediterranean neighbourhood).
In the other regions the figures are similar: half of FDI flows in Mexico come from the US; the bulk of FDI flows in China or Thailand comes from Japan and the Dragons (along with Caribbean tax havens) (Maps 2.15 and 2.16).

Where do FDI in-flows come from? The case of Turkey, Egypt and Morocco, 2006–2008

Where do FDI in-flows come from? The case of Mexico, Thailand and China 2006–2008
Map 2.17 displays the FDI inflows in the European neighbourhoods at local scale. Russia, Israel and Turkey are the main targets, despite the latter showing a per capita record lower than expected; Maghreb is less targeted than the Near East, which highlights the potential in the Maghreb countries. Some peculiar territories appear here and there, for instance Ukrainian Ivano-Frankivskiy oblast at the border of Slovakia, with rising FDI since 2008 in the fields of chemistry and food business, mostly from western European countries (60 %) and from the Russian economic area of influence (Russia, Serbia, Cyprus and… Virgin Islands: 40 %)—a symbol of the contest between the European Union and Russia upon Ukraine.

The FDI inflows in the neighbourhoods, SNUTS 2
2.2.2 Energy: Threat or Opportunity?
2.2.2.1 Strategic Complementarities
The EU’s energy dependency will reach 65 % by 2025; for gas it will reach 80 %. Unlike the EU, the European neighbour countries possess a large amount of the world’s resources:
-
notwithstanding the Arctic potential resources (see Map 2.18), the Eastern neighbourhood possesses an impressive part of the world’s energy; Russia alone holds 32 % of world proven natural gas reserves, 12 % of the proven oil reserves and 10 % of the explored coal reserves. It procures a third of the hydrocarbons imported by Europe and a quarter of its coal imports. Other countries of the area such as Azerbaijan and Turkmenistan also hold some hydrocarbons reserves.
Map 2.18 
Main natural resources and sea ice extent in the Arctic
-
Mediterranean neighbours possess 5 % of the world’s oil resources and 3 % of its gas; they supply one third of the gas and one quarter of the oil consumed in Europe, as well as transit (Turkey, from both Russian and Gulf production). Production and transit countries are similarly dependent on European consumer markets: 70 % of North Africa’s oil exports and 90 % of its gas exports are sent to Europe, despite the aforementioned rising share of the US in Algerian sales. The potential for energy collaboration in the Mediterranean is therefore strategic. It could be the basis of an ambitious social (employment), industrial, technological and environmental partnership.

2.2.2.2 How the EU Tries to Reduce Its Dependence upon Russia and How It Barely Manages
Here we focus on the gas issue, for two reasons. One is the rising share of gas in the energy mix of Europe and its neighbours (lower greenhouse gas emission than oil). Two is the strong geographical dimension of gas delivery since oil is mostly delivered on the spot market (by boat) whereas gas is mostly delivered by pipes which can hardly be longer than 3–4000 km for cost and safety reasons.
The security of energy supplies is a particular concern in the EU because most of the EU member states rely on energy imports from Russia. Moreover, Russian interests rise in European gas distribution and production. For instance Russian firms own one third of Estonia’s and Latvia’s and 37 % of Lithuania’s energy firms. The high dependency on Russian procurement sometimes crosses the line for autonomy, especially in central Europe like in the Baltic States where 100 % of natural gas and almost of oil imports come from Russia.
The EU has been seeking to limit Russia’s influence on the European energy market, in connection with the gas supply disruptions of 2006 and 2009 by the Russian export monopoly Gazprom. Although the situation has now stabilized somewhat, the uneasy relations of the transit countries, Ukraine and Belarus, with Russia are a serious factor in the instability of energy supply in the region. In the light of these events, Russia is developing new pipelines to the EU by-passing Ukraine and Belarus, which would secure stability of energy exports to the EU and avoid dependency on transit countries.
The Nord Stream pipeline transports gas from Russia through the Baltic Sea directly to Germany, by-passing the Baltic States. The pipeline runs through the waters of five countries in the Baltic Sea region: Finland, Sweden, Denmark, Germany and Russia. It started operations in 2011 after fierce criticism from Estonia for environmental and safety reasons, claiming that hosting a strategic Russian asset could create a security threat for the Baltic countries.
Some analysts argue that with new pipelines and seaports projects, Russia is attempting to re-establish its geopolitical influence in the former Soviet countries and in Europe at large. Others argue that the Atlanticist powers (mainly US and UK) are seeking to promote Russophobia in Europe in order to “prevent the rise of the European Union as a powerful competitor, partly with the strategic aim of preventing the integration of a Great Eurasian space extending from Vladivostok to Lisbon” (Eskelinen et al. 2013, p. 119). According to this interpretation, the new pipelines are seen as means to unite Europe. Active lobbying of the US against the new pipelines, as well as American support for the colour revolutions in Ukraine and Georgia are among the arguments supporting this view. There is also a third opinion, according to which Russia is more likely to be driven by solely economic interests.
A new energy strategy for Europe 2011–2020 contributes to limiting EU dependence on Russian energy sources. The strategy seeks to promote a more widespread use of renewable energy and reduce oil and natural gas consumption in the long run. Secondly, it seeks to diversify the EU’s energy imports in order to avoid dependency on a single supplier. For this reason the EU has supported several projects by-passing Russian territory, such as Baku-Tbilisi-Ceyhan oil pipeline and the planned Nabucco gas pipeline. The Nabucco project was initially intended to secure gas from Iraq and Iran, but given the current political and economic instabilities in the two countries it adjusted, with main potential suppliers being Azerbaijan and Turkmenistan, and Romania since the discovery in 2012 of a large gas field in the Black Sea. The Nabucco project was originally backed by several European Union member states and by the United States, and was seen as a rival to the Russian South Stream pipeline project (Russian pipeline under the Black Sea to south-eastern Europe, construction started in December 2012). Since then, Azerbaijan has stated that the gas will be transported only through those routes which would be commercially most attractive, which means not necessarily by Nabucco; also the opening of the Central Asia-China gas pipeline and the agreements to build the Russian South Stream pipeline have provoked the abandoning of the Nabucco project in 2014.
2.2.2.3 The Two Drivers of a Common Energy Policy Between Europe and the Neighbour Countries
The maps below synthesise the main energy issue in the region. Map 2.19 shows the importance of Eastern neighbourhood—read Russia—in the primary energy consumed in Europe. Russia is the main provider of crude oil and natural gas with more than a third of the EU imports. Europe itself stands second (Norway provide 14 % of the crude oil and 28 % of the natural gas imported by the EU) but as said, this ratio decreases rapidly. The Mediterranean neighbourhood stands in the third place (Libya with 10 % of the crude oil imports and Algeria with 14 % of the natural gas). Oil and gas fields in northern Africa have not yet been fully developed, and in the near future they might become the primary source of oil and gas for Europe; Algeria might also become a transit country for the gas coming from Nigeria if the Trans-Saharan pipeline were to be built.

Energy consumed in the European Union: the key role of the neighbourhoods
Map 2.20 demonstrates the complementarities between Europe and its neighbours: trade deficits (except Norway) in Europe, trade surpluses in most in the neighbourhoods—even though some neighbours are confronted to deficits: Western Balkans, Morocco, Tunisia, Near East except Syria, Moldova and Ukraine.

Energy net trade: the complementary between Europe and its neighbours, 2011
Map 2.21 shows the huge rise of energy demand in the southern neighbourhoods. This means at the same time, (i) huge potential markets for European energy enterprises which could find opportunities in these booming countries; in particular, in the coming decades no area in the world will experience a more rapid electricity demand growth than the South Mediterranean. And (ii) a threat if this boom is managed with low energy efficiency and high greenhouse gas emissions. Map 2.22 speaks about the threat: these booming southern neighbours depend very much on hydrocarbons. As this is also the case in the Eastern neighbourhood, the map displays a striking contrast between the EU where the energy transition has really begun, and the neighbourhoods. The consequence is given in Map 2.23: greenhouse gas emissions have been booming in the southern neighbours. Indeed they started with a low level of emission but they are clearly catching up.

The huge rise in energy demand in the neighbourhoods, 1990–2011

Share of fossil fuels in energy consumption, 2011

Mediterranean neighbours are catching up: greenhouse gas emission, 1990–2010
The conclusion is clear. An in-depth cooperation with the neighbourhoods in the field of energy would provide Europe with two key advantages: one is the security of procurements; two is a common policy in favour of energy transition and the fight against greenhouse gas.
2.2.3 Challenges: Environmental Risks, Water Scarcity, Non-inclusive Growth, Political Unrest
2.2.3.1 Environmental Risks
It is impossible to give a comprehensive view of all the environmental challenges of all the neighbourhoods. Here we briefly highlight some examples, taken in two neighbourhoods and in the fields of earthquakes, climate change and water—which have direct impacts on the EU territory.
In the Eastern neighbourhood several environmental issues have direct impacts on the EU territory: the consequences of the Chernobyl nuclear tragedy in 1986, environmental problems linked to industrial processes, military heritage, radioactive and toxic waste, poor status of the water environment, and the pollution of the Black and Baltic seas.
The Western Balkans have to deal with the legacy of pollution inherited from the socialist period: concentration of highly polluted zones in industrial centres or exploitation of mineral raw materials now closed are the major sources of unsolved solid waste and other environmental problems. Even if in the 1990s conflict and the economic crisis reduced the pollution from agriculture and industry, the rehabilitation of all polluted industrial and mining-energy sites remains one of the main issues. In contrast, the Balkan countries benefit from exceptional landscape diversity and biodiversity; for example, Albania has a concentration of 30 % of European plant species. This potential needs to be protected, but in 2007 only 6.5 % of the overall Balkans territory was placed under protected areas, ranging from 0.8 % of the territory in Bosnia and Herzegovina to 10.4 % in Albania (EEA 2010).
In the last two decades, the Western Balkans were confronted with two rising issues:
-
(i)
Waste management of both industrial activities and municipalities, which threatens the quality of soils and water. The generation of municipal waste has risen steadily, and it is more and more convergent with EU levels.
-
(ii)
The risk management of floods and droughts, which requires international cooperation. The area seems to be one of the most vulnerable to climate change with significant floods in the northern part (Danube river basin) and severe droughts in the southern part. The international cooperation is enhanced by the International Commission for the Protection of the River Danube.
Other projects have stressed the coming impact of climate change on the Black Sea area and in particular on Ukraine. The different scenarios of the Envirogrid project are not convergent with the impact on agriculture, but they are convergent with the rising scarcity of water (Map 2.24).

Black Sea catchment: water stress days and their changes in the 21st century
Concerning the Mediterranean neighbourhood, we illustrate the environmental stakes through the earthquakes issue and the water issue. The numerous earthquakes in the Mediterranean and historic tsunamis prove that the threat remains high. This calls for a cooperation between Europe and its neighbours (which has largely begun e.g. between Greece and Turkey) in the three domains of (i) common alert system, training and exchanges of experiences in the field of crisis management or insurance issues; (ii) concerted actual crisis management; (iii) post-crisis reconstruction (Map 2.25).

Earthquakes in the Euro-Mediterranean area since the beginning of the 20th century
Along with north-western India, the Mediterranean is the region of the world for which climate change scenarios converge the most seriously. The water shortage will particularly impact Egypt (Fig. 2.7). The water exploitation index is high in the water basins of the Mediterranean, and not only on the southern side: compared to available water resources, withdrawals have been historically high in previous decades, especially in the Near East, in Libya and Tunisia but also in Greece and Spain: the water issue is not only a neighbour concern (Map 2.26). The available water resources are not sustainable in the South, because of their considerable reliance on groundwater.

Mediterranean neighbourhood: water deficit at horizon 2050

Water resource per inhabitant, 2000s
As an example, in Tunisia, which is one of the most efficient of the Arab countries in the field of water and sanitation, improvement in drinkable water (Map 2.27) and sewage (Map 2.28) raises various problems: (i) ecological, since the water resources are taken from non-renewed groundwater. (ii) managerial, since the know-how is lacking in both the governance and technical aspects. (iii) political, since the modernisation of the water service would need an increase of the water tariffs that the government cannot undertake. (iv) financial, since the needs for modernisation of the water and, above all, the sanitation infrastructure remain huge. (v) territorial, since the North-West of the country (water and sewage) and the South (sanitation) are lagging behind the North-East. The water issue is one of the most important corner stones for an enhanced cooperation between Europe and its neighbours.

Is the progress in access to drinkable water sustainable? The case of Tunisia

Low progress in sewage. The case of Tunisia
2.2.3.2 Non-inclusive Growth
The issue of inclusive growth is at stake at many scales:
-
locally because of the poor quality of development, access to universal services such as water, and people participation in the neighbour territories’ governance;
-
at national scale because the regional disparities are rising in particular in countries such as Tunisia or Turkey;
-
at the scale of the greater European region, where the discontinuities are not sustainable. Figure 2.8 compares the GDP per capita in purchasing power parity (PPP) in the three major world regions. In East Asia, the Dragons have clearly caught up with Japan, and the emerging countries (including China) are progressively bridging the gap. In the Americas, the emerging Latin America does not fill the gap vis-à-vis the USA, but (i) the US experienced a rapid growth of their GDP per capita, and (ii) Latin America is at level 25 (Mexico excluded, 100 = USA). In the European region, apart from Israel and Turkey, the gap remains huge: the Arab Mediterranean neighbour countries hardly reach a level of 20 (Eurozone = 100).
Fig. 2.8 
The gap of development does not decrease between Europe and its neighbours

The ITAN composite indicators provide several key pieces of information to assess the insufficiently inclusive development of the neighbourhoods. To begin with, simple classic indicators such as demographic evolution, education and income shed light on sharp territorial disparities.
Map 2.29 on the demographic evolution in the 2000s displays the major discontinuities in the greater region. Except in south-eastern Europe vis-à-vis Turkey, major discontinuities are not that significant between Europe and its neighbours than within the neighbourhoods. Between Europe and the Eastern neighbourhood, there is rather a progressive gradient from positive demographic growth in the westernmost Europe to a mixed situation in Germany and a negative growth when one crosses the external borders eastward and lastly a very clear decline in many Russian territories. Within Russia, a strong discontinuity appears between the Moscow urban area and its surrounding regions. In Ukraine, apart from Kyiv City, all territories are demographically declining.

Demographic evolution in Europe and in the neighbourhoods
Within the Western Balkans, globally in demographic decline, discontinuities appear in Serbia and between Kosovo and the Fyrom: the demographic issue is indubitably one of the stakes of the Western Balkans territories. Discontinuities also appear vis-à-vis the EU territories of northern Greece and western Bulgaria. In the Mediterranean neighbourhood, major discontinuities appear within Morocco, within Algeria, within Tunisia, within Egypt, within Israel, and, mainly, within Turkey, because these countries are experiencing a rapid urbanisation process as well as an economic transition with severe contrasts between developing areas and left behind territories. Here, the stake would rather be to transfer European know-how in the fields of territorial planning and regional policy, to the neighbourhoods. It seems to be particularly important in the case of Turkey.
Another stake of the greater region is education. The Mediterranean neighbours have managed rapid progress in school enrolment. Yet, many difficulties remain, in particular in rural areas, in particular for women, in particular for those over 30 years. But an unexpected concern appears also for young girls: in secondary school, many more of them are enrolled than their elders and their male counterparts, because at this stage boys all too often drop out. The contrast is incredibly high between over-representation of girls in secondary school and under-representation of women on the labour market, in particular outside of metropolitan areas. This suggest a future rising concern for South Mediterranean women, namely in the non-metropolitan areas, when these now very numerous educated girls will have become young women looking for—lacking—jobs. In the field of education, the contrast between Europe and the Mediterranean neighbourhood is one of the highest among all the indicators (Map 2.30), which also means that potential cooperation in that field seems boundless between Europe and its neighbours.

High education level in the European region, 2000s
Very much related to the previous indicator is the income issue. Map 2.31 shows the gap between the Russian, Israeli and western Turkish territories on the one hand, and almost all the other neighbour countries on the other. Again, the issue of internal inequality proves relevant, particularly in Turkey, Egypt, Algeria and Tunisia where the contrast between the littoral or the capital city area and the inner country is impressive. In the Near East, the contrast between Israel and the rest of the area is a part of the geopolitical mix (see below Sect. 6.1.3). In the Western Balkans, Bosnia and Herzegovina and Albania appear as the most unequal countries (we do not have regional income data for Serbia). In Ukraine the contrast is strong between the capital city and the rest of the country where income seems evenly low. Section 4.4 below explains that these rising inter-regional disparities within Ukraine are a key factor of the on-going civil war there.

Income per capita in the neighbourhoods, ca 2010
The evolution of Human development sums up the previous analyses and provides further information. The ITAN project carried out an analysis at macro-regional scale, at national scale and at local scale thanks to the local Human Development Index (HDI) defined in Sect. 1.3.2. The Eastern neighbourhood is recovering after its harsh 1990s decade, and the Mediterranean neighbours keep on improving (Map 2.32). As a whole, the divide between Europe and its neighbours has rather decreased in the 2000s. The Mediterranean neighbours seem to benefit from their long run effort in education, even though many shortcomings remain. Life expectancy is improving in the Eastern neighbourhoods but for Russia only and at a low level, in particular for men.

Evolution of the human development index, national scale, 2000–2011
Map 2.33 gives an idea of the added value of ITAN thanks to the calculation of local HDI. Its first output is to confirm that local realities rely very much on national structures, especially in human development where national public policies are determinant for health and education. In Russia, Ukraine and Egypt, local records more or less equal the national values, despite some peculiarities such as the Belgorod Russian oblast at the immediate north-eastern periphery of Ukraine (this territory hosts energy and in particular nuclear activities, with high salaries and educated people). But in other countries, internal disparities are confirmed, especially in Tunisia and Turkey. Map 2.34 uses a simpler way to express the indicator, and stresses the discontinuities.

Local human development typology, 2010

Local human development, index and discontinuities in the neighbourhoods, 2010
Map 2.35 gives the cartographic output of another ITAN composite indicator: territorial dynamics. The typology set up here keeps the distinction between demographic evolution (very much in favour of the Mediterranean territories and not at all of Eastern) and economic evolution. As a whole, the dynamic is confirmed to be rather in the South than in the East, despite some Mediterranean neighbour countries are very worrisome because their strong dynamic is demographically driven and not economically sustained (see southern Algeria for instance). The situation of greater Cairo in Egypt is not easily readable given the delineation of the Egyptian governorates.

Territorial dynamics, 2000–2010
But when it comes to territorial potential, the last composite indicator of the ITAN project, the advantages seem to be clearly in the East—read Russia and not Ukraine—rather than in the South, with Turkey in an intermediate position and with, again, great internal heterogeneity. Here, the Moscow and Israeli territories are far ahead, but several territories in upper Nile Egypt show up. Maghreb, meanwhile, is lagging behind (Map 2.36). The Map also shows that at the beginning of the 2010s, Syria's record was not so bad; one can imagine its collapse after four years of civil war.

Territorial potential, 2010
2.2.3.3 Political Challenges
They are many. They sometimes have direct territorial impacts or origin. Table A in annex gives an overview of the contested territories in the neighbourhoods. One of these challenges is related to the minority issue—long a cultural treasure of the greater region, of course, but undoubtedly it is a component of many of the contested territories. Due to the lack of reliable information, it would require a whole research project per se to gather the minority needed data. And such a project would prove hard: Arab states’ censuses increasingly delete questions about religion or “ethnicity”, because these issues are increasingly sensitive—not to mention the Lebanese case where the census is postponed for decades so as to avoid any question on Christians and Muslims' demography.
2.2.4 The Neighbours’ International Openness as a Major Stake for Interaction with Europe
The methodology of the ITAN International openness index distinguishes two approaches, one weighted by time-distance to international transport facilities which highlights accessibility; and one non-weighted, which highlights the agglomeration effects.
The maps below show the three components of (non-weighted) international openness and then their synthetic index (Maps 2.37, 2.38, 2.39 and 2.40). There are two keys of interpretation of this final synthetic indicator of international openness: country effect and metropolitan effect. First, bigger and/or more developed countries have, in general, higher internationalisation; this was an expected result. However, the strong concentration in the capital city of the country is tempered by the geography of the major ports, often located in another city, which is an important pattern of the neighbourhoods’ geography.

Foreign direct investments, 2008–2012

International air traffic, 2012

International port traffic, 2011

Geography of local international openness index, around 2010
In the synthesis map, we also take into account the demographic size of the territorial units. This highlights the international openness of Israeli territories, and the low international openness of the North African territories although we saw that their potential accessibility to the European territory is very high. This suggests important avenues for territorial development there, to take better advantage of these North African territories’ international situation. The strong position of the Istanbul area is all the more impressive as it is not only due to maritime flows but also to air flight and foreign investment. In Russia, the overarching dominance of Moscow appears clearly on the map.
Maps 2.41 and 2.42 show the two components of openness which have been weighted by time-distance to transport facilities: air and maritime connexions. What is striking is the low performance, again, of Maghreb territories except in northern Morocco, but also of the Western Balkans (except Croatia for maritime openness). This reveals important avenues for further transport development in these parts of the neighbourhoods.

International air traffic, 2012. Values weighted by time-distance to the airports

International port traffic, 2012. Values weighted by time-distance to the ports
2.3 Do Europeans Care About Their Neighbourhoods? An Analysis of Media Data
This section analyses the European representation about the neighbourhoods as seen by the European press. It gives a first overview of the tremendous advantage than researchers can take from the media databases and their geographical treatment. They can provide a robust picture of spatial representation and mental images—a tricky field, all too often analysed through a limited number of data or interviews. To start with, we explain our choice for a panel of five generalist newspapers and five business newspapers from different European countries within the Factiva database.
2.3.1 The Choice of Our Corpus of European Newspapers
From Factiva we have constructed our own database translating the spatial vision of a part of the European press. We selected national flagship reference media in Europe which regularly and comprehensively reference their articles and have a wide audience. In order to compare them, we selected two types of press: general media, open to a wide cross-section of the public; and a more specialised press focused on business, for two reasons: (i) the economic potential of the neighbourhoods is widely under-estimated by European stakeholders beyond oil and gas procurements, and (ii) business newspapers make a quite homogenous corpus whereas generalist newspapers necessarily show a wider variety of thematic subjects from one media to another. We chose one generalist newspaper and one business newspaper in five major European countries (only economic for the Czech media, see Table 2.3), under the assumption that the French, Italian and Spanish media would rather report on Mediterranean neighbourhood’s events, the German and Czech media rather on East neighbourhood’s ones. Not least than 2.4 million international (i.e. excluding the articles on the newspaper’s country) press articles were analysed, over two periods: 1998–2000 so as to cover, in particular, the on-going change in the Eastern neighbourhood in transition, and 2010–2012 so as to cover, in particular, the Arab spring.
2.3.2 Silence and Noise in the European Media Regarding Neighbourhoods
The first result is that European newspapers pay a small and declining attention to the neighbourhoods. Over the two periods, 1998–2000 and 2010–2012, 15 % of the 2.4 million analysed international articles focussed on at least one neighbour country. 17 % of the articles in general newspapers include a reference to these countries, whilst the percentage is only 13.5 % for economic newspapers. This confirms that the European business milieu pays rather scant attention to the neighbourhoods.
French newspapers make a relatively large effort to report information from there: on average, in our sample 21 % of French international articles addressed this area; then come British newspapers with 19 %. A striking difference is that the French generalist newspaper reports many events whereas the French business newspaper reports on the neighbourhoods in only 11 % of its articles. The British business newspaper shows much more interest in the neighbourhoods; even the German business newspaper reports more on the neighbourhoods than its French or Spanish counterparts (Fig. 2.9).
Another concern comes from the evolution, since media attention to neighbour countries has rather declined between the two periods: 18.4 % in 1998–2000 but 15.7 % in 2010–2012. Here the figures differ according to the type of newspaper: for general newspapers they went from 25 to 15 %, for economic newspapers from 13 to 14 %. This suggests a progressive awareness of the European business milieu. It also differs according to the reported countries. From the first period (1998–2000) to the second (2010–2012) the spatial breakdown shows the decline of media coverage of the Western Balkans, for the benefit of two Arab countries in transition: Tunisia and Libya. The map pictures a—relatively—growing interest of the Mediterranean .

Share of articles on neighbour countries in ITAN international articles’ sample, 1998–00 and 2010–12
By country, Russia achieves the highest coverage level with 3.5 % of our sample. A small group of countries receive a 1–1.5 % amount of media coverage due either to the magnitude of the events taking place (Egypt and Serbia) or to the business and political ties with the European Union (Turkey and Israel). All other neighbour countries are under 1 %.
Analysis by nationality of the considered newspaper brings further information:
-
As we expected the French press is more open to the Mediterranean than the other European media. The specificity of the French generalist newspaper is that it covers the whole neighbourhoods, with a focus on Russia and Turkey. The neighbourhoods geography of the business French newspaper is quite similar to that of its European counterparts.
-
The coverage of the Italian media is concentrated on a small number of countries: Russia and Turkey, and Libya for the business newspaper. Conversely and surprisingly, Italy neglects some countries in close Western Balkans such as Kosovo and Serbia.
-
Spain has a quite balanced coverage, with its business newspaper being focused on Russia, Turkey and Maghreb especially Morocco.
-
The British press, including business, holds little interest in the Maghreb events and more (along with Russia) in countries such as Turkey, Egypt, Libya and Serbia, but not that much, for the business newspaper, in the English speaking Near East.
-
The general German newspaper concentrates on Russia and Turkey, the business one has a wider outlook including Tunisia—where the German enterprises have recently significantly invested, but not the Western Balkans.
-
The press in the Czech Republic pays attention to a quite wide range of countries, and, compared with the other newspapers, less to the most important countries elsewhere: Turkey and…Russia—a surprising result.
The last result is that when we remove the demographic and economic effects, war areas and the Mediterranean show up. The following maps calculate a media coverage factor that is independent of the neighbour countries’ demographic (Map 2.43) and economic (Map 2.44) weight. Per capita, Near East becomes the major area under European press scrutiny along with Western Balkans and Libya, that is to say the area of recent or actual unrest. Two further smaller focus areas can be added: Georgia and Tunisia. We can conclude that the primary thing that interests European readers in the neighbourhoods is political threat.

Number (per capita) of articles on each neighbour country in ITAN international articles’ sample, 1998–2000 and 2010–2012

Number (per GDP) of articles on each neighbour country in ITAN international articles’ sample, 1998–2000 and 2010–2012
When measured per GDP, the result changes. The poorest countries receive better media coverage: Kosovo and Montenegro, Georgia, Libya and even Jordan. Conversely, some countries with higher GDP like Russia or Israel receive fewer mentions in the newspapers. Only Turkey stands out. According to this per GDP indicator, Belarus, Algeria, Morocco, Serbia and even Croatia show very lowly interesting to European readers.
References
EEA. 2010. Environmental trends and perspectives in the Western Balkans: future production and consumption patterns. European Environment Agency, Report n°1:2010, Copenhagen.
Eskelinen, H., I. Liikanen, and J.W. Scott. 2013. The EU-Russia borderland. Next contexts for regional co-operation. Oxford: BASEES/Routledge Series on Russian and East European Studies.
Grasland, C., G. Van Hamme. 2010. La relocalisation des activités industrielles: une approche centre-périphérie des dynamiques mondiale et européenne. L’Espace géographique 39(1):1–19. Available at: www.cairn.info/revue-espace-geographique-2010-1-page-1.htm.
Richard, Y. 2012. Political cooperation of the EU. A geographical assessment. In Van Hamme et al. Territorial Impact of Globalisation for Europe and its Regions (ESPON TIGER project), Draft Final Report, 2012, ESPON, http://www.espon.eu/main/Menu_Projects/Menu_AppliedResearch/tiger.html.
Van Hamme, G., G. Pion. 2012. The relevance of the world-system approach in the era of globalisation of economic flows and networks. Geografiska Annaler: Series B, Human Geography, 94(1):65–81 (Sweden).
Author information
Authors and Affiliations
Corresponding author
Editor information
Editors and Affiliations
Rights and permissions
Open Access This chapter is distributed under the terms of the Creative Commons Attribution-Noncommercial 2.5 License (http://creativecommons.org/licenses/by-nc/2.5/) which permits any noncommercial use, distribution, and reproduction in any medium, provided the original author(s) and source are credited. The images or other third party material in this chapter are included in the work’s Creative Commons license, unless indicated otherwise in the credit line; if such material is not included in the work’s Creative Commons license and the respective action is not permitted by statutory regulation, users will need to obtain permission from the license holder to duplicate, adapt or reproduce the material.
Copyright information
© 2016 The Author(s)
About this chapter
Cite this chapter
Beckouche, P., Emsellem, K., Van Hamme, G. (2016). Presentation of the European Neighbouring Space. In: Beckouche, P., Besnard, P., Pecout, H. (eds) Atlas of Challenges and Opportunities in European Neighbourhoods. Springer, Cham. https://doi.org/10.1007/978-3-319-28521-4_2
Download citation
DOI: https://doi.org/10.1007/978-3-319-28521-4_2
Published:
Publisher Name: Springer, Cham
Print ISBN: 978-3-319-28520-7
Online ISBN: 978-3-319-28521-4
eBook Packages: Social SciencesSocial Sciences (R0)