
Abstract
Decision Support System (DSS) is an interactive software-based tool that has been realized in the framework of the project “Development and application of mitigation and adaptation strategies for counteracting the global Urban Heat Islands phenomenon (UHI)” implemented through CE programme 2007–2013 co-financed by the ERDF. DSS is a simplified database management tool that allow the use of the project deliverables uploaded on the web sites with a user-friendly approach.
Users can access to the needed project’s output through knowledge’s needs oriented pathway.
You have full access to this open access chapter, Download chapter PDF
Keywords
1 Introduction
The construction of Decision Support System (DSS) has been realized in the framework of the Work Package 6 (WP6), in particular with the action 6.1.
The main activity of the WP6 was the UHIs simulation of future alternative scenarios related to the development of the urban areas chosen for the eight pilot actions.
In addition, WP6 was intended to define and realize a set of support actions for fostering the implementation of urban & spatial planning strategies in each involved region.
In particular, it was foreseen a progressive integration of mitigation and adaptation strategies in current urban planning tools.
Furthermore, DSS is designed to address policies in actions of mitigation and adaptation in the framework of the Urban Heat Island phenomenon.
2 Development of the UHI Project’s DSS
During the project implementation the partners agreed to choose the hypothesis described below:
A simplified database management tool that allow the use of the project deliverables uploaded on the web sites with a user-friendly approach.
In this case users can access to the needed project’s output through knowledge’s needs oriented pathway.
To manage the urban development it is compulsory to manage a multitude of purposes and address many different goals, often conflicting, to satisfy the needs of different stakeholders. This poses considerable challenges to policy makers and urban planner. The need for enhanced urban plan decision support systems is evident in the same complexity of the UHI phenomenon.
In the following paragraphs is described the operation of the DSS chosen within the project on UHI.
3 UHI’s Decision Support System
3.1 Structure
The UHI DSS is composed by a structure of html, javascript and php files that allows, via communication with a database, the end users to remotely access the project deliverables produced by UHI partners. In fact, considering the type of files and its structure, the software is a website, that can be installed and run on any platform that provides services http and MySQL.
The logical structure of the files is likely (Fig. 5.1):


UHI DSS logical structure of the files
From the home page (index.html) you can access to:
-
the logical framework of the project, which is a presentation of the UHI project; with a specific links to the official website of the project ;
-
the Decision Support System, which allows, through a logical structure, obtaining a specific report based on the user’s requests;;
-
the Consultation Tool, which is a grid with specific questions about the results of the project deliverables produced by the partners; this tool is useful for users who know in advance what kind of information they are looking for.
The two php files (query.php and print.php) shall only be used to query the database that stores the data that is composing the report: in this case, query.php is part of the communication AJAX of the page consultation.html (through script.js); while print.php dynamically creates a page report based on the choices you make, whether they come from the DSS or from the Consultation Tool.
The database named db_dss_uhi is composed of five separate tables:
-
intervention_type: stores data regarding the various types of intervention carried out in the pilot actions;
-
legislation: containing the legislative framework for each region involved in the project UHI *;
-
pilot_actions: the table with a detailed description of all pilot projects related to UHI project *;
-
skills: the list (provided by partners) of the experts who have contributed to the UHI project with a short description of them and their personal contacts;
-
software: a list of tools used by partners with a short description;
3.2 The Interface
This paragraph shows the real functioning of the DSS as was finally built with the help of the below pictures.
The link of the DSS can be found on the homepage of the UHI website (Fig. 5.2).


UHI project website
By clicking on the link highlighted above, the first page of the DSS appears like this (Fig. 5.3):


First page of the DSS
As the user can immediately see, from this page you can enter other three links to three different tools:
-
Logical framework (magnifying glass)
-
Consultation tool (open book)
-
Decision Support System (right arrow)
3.3 Project Logical Framework
Clicking on the left icon below, the user can have an overview of the entire UHI project (Fig. 5.4).


Link to the project logical framework
As shown in the picture below in this page the user can find: a brief description of the project; the partnership; the framework analysis; the establishment of a UHI monitoring network; mitigation and adaptation strategies; pilot and capitalization actions for limiting UHI’s effects (Fig. 5.5).


Logical framework of the project
3.4 The Consultation Tool
The interface of the Consultation Tool consists of 7 menus, multiple choice or drop-down menu, in which user is asked to select some areas of interest (Fig. 5.6).


Link to the consultation tool
-
Climate long term perspective, where the user can see through a map the following data:
-
change in annual mean temperature;
-
heat wave frequency;
-
changes in annual near-surface temperature.
-
-
The Urban Heat Island phenomenon, where the user can select a city name in the drop-down menu between the various European cities that have been studied during the project:
-
Budapest;
-
Modena;
-
Warsaw;
-
Padua;
-
Stuttgart;
-
Ljubljana;
-
Wien;
-
Prague.
-
-
Spatial and urban planning, where the user can, through the menu, select the following items of the interested area:
-
local rules and regulation;
-
incentives, financing, regulatory action;
-
E.U. rules and regulation.
-
-
Mitigation strategies, where there is the possibility to choose the mitigation action you want to deepen and find out its benefits on UHI. This sub section is divided into three items:
-
Buildings
-
Cool roofs;
-
Green roofs
-
Green facades;
-
Facade surface and construction selection/retrofit;
-
Geometry of Urban Canyon.
-
-
Pavements
-
Cool pavements;
-
Pervious pavements.
-
-
Green areas
-
Planting trees within the urban canyon;
-
Park, green areas.
-
-
-
Pilot areas, where the user can choose one of the eight pilot actions have been implemented that he wants to deepen:
-
Padua/Venice –Italy;
-
Modena/Bologna – Italy;
-
Wien – Austria;
-
Stuttgart – Germany;
-
Warsaw – Poland; Prague –
-
Czech Republic; Ljubljana – Slovenia;
-
Budapest – Hungary.
-
-
Skills, where the user can choose the skill which is interested in:
-
Meteoclimatology;
-
Biometeoclimatology;
-
Urban planning;
-
Health;
-
Municipality;
-
Innovation;
-
Engineering;
-
Building skill;
-
Environment;
-
Communication.
-
-
Simulation tools, where the user can, simulating the effect of a mitigation action in the urban area object of the pilot, choose the aspect that he is interested in deepening.
-
Global scale
-
Weather forecast;
-
Climate of your region;
-
Future climatic scenarios;
-
Weather risks for your region due to climate change.
-
-
Urban/district scale
-
Urban micrometeorology;
-
Influence of land use on urban climate;
-
Effectcs of street characteristics (orientation, width, buildings height, etc.) on urban climate;
-
Effects of urban topography on climate;
-
Influence of land use on urban climate;
-
Influence of different kind of roofs on urban climate;
-
Influence of different kind of pavements on urban climate;
-
-
Human perception of climate;
-
Knowing how land use influences the human state of wellness.
-
-
Building
-
Influence of different kind of roof on building;
-
Effects on micrometeorological variables due to different materials and properties of the building;
-
Influence of good/bad adopted measures on human health/wellness at building scale.
-
-
The following pictures show how are graphically displayed the contents above outlined (Figs. 5.7, 5.8 and 5.9).


The first three menus of the consultation tool


The subsequent three menus


The simulation tool
Once required the information requested by the user, the software searches in the documents produced in the WPs of the project the material/documentation or deliverable (re-organized in a logical framework); this content has been revised in order to obtain a final compact document with all the information selected. The results are finally displayed in html pages for instant opening for a quick reference, then the user can print it as a pdf.
3.5 The DSS
By clicking the icon in the middle of the screen, user is led within the DSS.
By clicking on the different menu items the user can simulate the approach to his pilot study based on the data we gathered in our 8 pilot tests (Fig. 5.10).


Link to the UHI’s DSS
This section has 5 menus:
-
Location: an interactive Central Europe Map allows the user to select the region of interest, as shown the picture below (Fig. 5.11)
Fig. 5.11 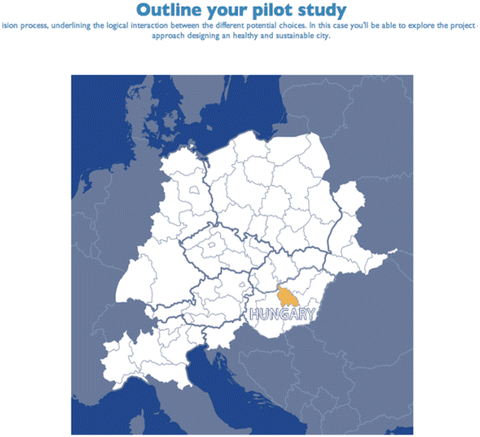
Interactive map
-
Scale of intervention: the user can choose between two option, building or urban;
-
Typology of intervention: the choice here is between:
-
Menu item A)
-
Existing structure;
-
New construction.
-
-
Menu item B)
-
-
Facedes;
-
Roofs;
-
Surface lots;
-
Urban structure;
-
Urban green.
-
-
Economic assessment: here the user can choose the action he would like to undertake between:
-
Cool roofs;
-
Green roofs
-
Green facades;
-
Facade surface and construction selection/retrofit;
-
Geometry of Urban Canyon.
-
Cool pavements;
-
Pervious pavements.
-
Planting trees within the urban canyon;
-
Park, green areas.
-


After entering a few data, the software proceeds a quick calculation of the action selected.
-
Skills, where the user can choose the skill which is interested in:
-
Meteoclimatology;
-
Biometeoclimatology;
-
Urban planning;
-
Health;
-
Municipality;
-
Innovation;
-
Engineering;
-
Building skill;
-
Environment;
-
Communication;
-
The selections made in the menus help to match with the material presented above, relating them in a logical way.
This tool aims at presenting the same data of the Consultation Tool but in a more organic way: a combination of a raw data and documents selected shape a report and finally a model.
Indeed the choices are collected and reported in a final html page as a report.
4 DSS Input
The inputs of the DSS are all data stored in the database that contribute for processing the final information. In our case inputs are established based on the work developed in the previous Work Packages: WP3, WP4, and WP5.
From the above-cited WPs here follows a synthesis of the most important aspects necessary to set up the DSS.
4.1 WP3
WP3 was divided in 2 main actions:
-
Action 3.1 was basically a review action in which one has collected different studies about the Urban Heat Island phenomenon. Action 3.1 was split in sub-actions. This analysis focused on anthropogenic causes that generate the UHI phenomenon and the survey techniques used to study it.
The analysis take into account both (1) technical-scientific issues and (2) urban planning and land use regulation.
-
1.
Technical-scientific issues
-
1.a. reviewing knowledge (causes and related factors: anthropogenic causes that generate UHI phenomenon i.e. peculiar urban and building characteristics, particular industrial activities, etc.; the patterning of UHI phenomenon; the measures adopted to fight the intensification of UHI; the survey techniques used to study the phenomenon). Many relationships were found in literature to assess the UHI phenomenon based on different kinds of data. Namely we have a collection of indices to establish the increase of temperature and the maximal increase of temperature based on:
-
Population data;
-
Urban geometric factors of buildings as well as infrastructures;
-
Meteorological data.
-
-
1.b. scheduling of existing infrastructures to meteorological and environment data assessment in different project areas. A big range of methods can be adopted in order to study the UHI phenomenon. For each project area different data can be available. Based on this availability or lack of information DSS is able to provide as much as possible of accuracy in the results.
-
-
2.
Urban planning and land use regulation
Urban planning and land use regulation assume an important role to regulate the possible actions of adaptation and mitigation. DSS take into account these in order to formulate answers. Of course these are not static and can be supported by the DSS to assess and to plan in a better way the urban development taking into account in particular:
-
2.a. Review of different rules and regulation set up by involved local government (reviewing of the local main rules and regulations to plan the urban development and the land use; incentives and regulatory actions in support of environmental restoration, energy conservation and to fight climate change put in act from the different local authorities).
-
2.b. Review of the main European legislation concerning urban and spatial planning and concerned issues.
-
-
Action 3.2. approaches the problem of UHI vs Climate Change: it aims to study the interaction between UHI and climate change phenomena as well as to understand the influences and correlations between them. Thanks to this Action have been set up indicators establishing relations among urban planning and human activities (main causes of UHI) with climate change trends, estimated on the basis of temperature shifting and other parameters. Regional climate model simulations are able to provide an estimation of the future climate scenarios (temperature, humidity, precipitation, wind speed, cloud cover, etc.) which may serve as outer conditions for the assessment of UHI phenomenon in the CE cities. The simulations can be made with WRF, e.g., for a time slice of 10 years and statistical output on means and standard deviations of the meteorological variables can be supplied. Afterwards a downscaling to regional/town scales is required. Regional climate model uses available boundary conditions provided by existing global climate model. Climate change has the potential to alter shifts in average temperature, cloud cover, wind, speed and precipitation. The strong relationship between wind speed and cloud cover and UHI imply that changes in the magnitude of the UHI effect over the current century will depend at least in part on how cloud cover and wind speed change. Higher temperature might increase evaporation demand and may indirectly create a positive feedback, augmenting the temperature difference between city and rural setting. Though the magnitude of urban–suburban differences may not increase, the population affected by severe pollution episodes may increase as UHI-like conditions become more frequent in outlying suburban locations, presenting additional challenges for policy-makers.
In summary, tasks of WP3 were to provide the collection of techniques to assess the UHI phenomenon from which a selection have been chosen to be implemented in DSS. Moreover WP3 analyzes the European and local legislation within which decisions can be taken and from which DSS development is dependent.
Another important topic is the connection between UHI and climate change. Climate change will amplify the UHI phenomenon and its consequences for environment and human health have to be carefully taken into account. DSS has to consider then the projections to future scenarios to manage more useful information for administrators and stakeholders.
4.2 WP4
A large work to be implemented in DSS comes also from WP4 that is divided in three main actions.
-
Within Action 4.1. a permanent Transnational Network (TN) among experts scientific and institutional involved was set up. TN monitors UHI in CE area; in addition it develops shared and coordinated strategies in urban planning and land using. Task of the Transnational Focus Groups was to manage the knowledge flow between partners and stakeholders and to share competence and knowledge on thematic issues with Local Working Groups.
-
Action 4.2. Methodology and areas definition: definition of sensible indicators, sampling procedures and analysis tools are fundamental issues that need to be shared for a common methodology and compare different characteristics of urban areas. A gold standard in assessment of UHIs and in the respective data sampling, accessing and processing has been defined. Cities without a monitoring network suitable for monitoring UHI should take gold standard as a prototype in creating a new monitoring system. Cities with already existing monitoring systems was asked to adapt their systems to this gold standard, to allow a better coverage of phenomenon and to enhance the comparability between different cities.
-
Action 4.3. CE UHIs web database and Atlas: the shared web databases implemented through input from existing local partners/institutions allows to monitor the specific situation. Here, the measurements and data obtained and analysed have been designed to describe as well as possible the intensity of phenomenon and its characteristics. Direct surveys conducted by applying both traditional urban biometeorology techniques and remote sensing techniques, allowed to collect many data and information about the micro–macro meteorological conditions. CE Atlas implementation foresees digitalization and geo-referencing of data collected. Creation of a GIS based data processing tool, where all information about detected UHIs of CE area where loaded and put in relation with meteorological and climatic data and trends as well as to spatial planning information.
In summary from WP4 we acquired for DSS the gold standard to define and to monitor UHIs with common and accepted rules. Moreover Act. 4.3 gave rise to the web database from which DSS will acquire information for model running.
4.3 WP5 Mitigation and Adaptation Strategies
Starting from scientific and institutional framework and from assessment tools provided by previous WPs 3, 4, WP5 was focused on approaches to model for long-terms mitigation strategies and short-medium-term adaptation strategies to encounter UHI.
WP5 deals with the following specific questions: Given the results of WPs 3 and 4:
-
What are the common and differential features of the UHI that effect the regions studied?
-
What set of mitigation and adaptation measures and options should be considered as potentially effective and subjected to detailed modelling studies?
How could “top-down” (low-resolution) meteorological prediction models and bottom-up (high-resolution) building models be combined to provide an environment modelling for parametric study of the aforementioned mitigation and adaptation measures and strategies?
Having identified a coupled top-down and bottom-up UHI modelling environment, what would be the outcome and implications (recommendations, guidelines) of the parametric modelling studies of alternative mitigation and adaptation measures?
Three Actions are developed in the WP5 framework: Act. 5.1, 5.2, and 5.3.
-
Action 5.1. Extent of UHI effects and corresponding potential Mitigation and Adaptation (M&A) measures: Within the framework of this action, the common and differential features of UHI effects in the selected regions have been identified by the corresponding partners. A set of candidate (potentially effective) M&A measures have been collected and reviewed by the interdisciplinary and transnational research team. Thereby, the mitigation strategies provide the definition and application of urban& spatial-planning approaches (e.g. widening of green areas and rows, spread distribution of populated areas preferring short buildings surrounded by gardens, canyon effect) that prevent UHIs emergences. Likewise, relevant construction parameters for buildings (e.g. surfaces characteristics of external building components) have been considered. As to adaptation strategies, the phenomenon of summer bioclimatic discomfort has been addressed by setting up warning and prevention systems. Mitigation strategies, already mentioned in report 3.1.1., can be divided into three main categories, namely buildings, pavements and vegetation. For buildings one can work on directly either on their heat exchange material properties (valid for new and old buildings), or on the building/street geometry in order to modify the intensity of the so called canyon effect (valid only for new buildings). To the first category belong the following actions:
-
Cool roofs/façades: By applying building materials with high solar reflectance (high albedo) and high infrared emittance (cool materials) one can reduce the cooling load of a building, and thus one can limit the heat emitted by the use of air conditioning facilities to the building’s surroundings. Though cool materials can be applied for both roof and façade surfaces, it is usually easier and cheaper to apply them to existing roofs, making the method of “cool roof” creation more prevalent in daily practice.
-
Green roofs: a green roof means a roof covered by a vegetative layer of variable width. Compared to traditional high absorptive roof surfaces, green roofs bringing about lower surface temperatures, thus leading to lower cooling loads in the building itself. Irrigation of these roofs can reduce the air temperature next to the roof, as an outcome of the evapotranspiration effect of the vegetative layer. When applied to a large group of buildings, green roof are believed to have a significant effect of urban air temperature.
-
Green façades: vegetation can also be used as an overlaying layer for facades, either by enabling the growth of climber plants directly on the façade surface (thus shading parts of it) or by adding a more substantial bedding “wall” which connects to the façade and functions also as an insulating and evapotranspiration layer similar to that of a green roof.
-
Street geometry, which is defined by the shape of the buildings and their orientation, might also have an impact on UHI intensity levels by increasing air flow rate through the street, thus replacing the warmer air “trapped” between buildings. Although changing the geometry of existing streets is limited, large urban projects regularly introduce the opportunity to increase the effects of advection by a careful design of their geometry.
-
Pavements play also an important role in the formation of the UHI phenomenon, since conventional paving materials (mainly concrete and asphalt) tend to absorb large amounts of solar radiation during daytime and to release it to the cooler surrounding air (cool pavements). Another property of these paving materials is their limited permeability to water, which prevents the absorption of water in the ground and thus reduces the evaporation potential of the ground surface which may help in reducing air temperatures (pervious pavements).
-
Cool pavements are built of materials which have higher albedo (higher solar reflectance) values than conventional paving materials, usually because of their lighter color.
-
Pervious pavements: pavements of pervious materials which enable the draining of water through the porous pavement surface. The water is thus absorbed in the subsoil and evaporates when the paving material is heated, resulting in lower surface temperatures of the pavement. Pervious pavements are also helpful for the storm water management, and then for the prevention from floods.
-
-
Vegetation: trees and vegetation reduces ambient air temperature by evapotranspiration and shading and is therefore expected to help in mitigating UHI intensity levels (Kurn et al. 1994). The common practices within this scope are the planting of trees and vegetation in existing urban fabric (mainly city streets), or the creation or preservation of wider green areas (parks, groves) within the urban fabric.
-
-
Action 5.2. Establishment of an effective UHI modelling environment. The purpose of this action is to establish a coupled “top-down” (meteorological) and bottom-up (built environment) computational modelling environment. Thereby, low-resolution (large-grid) meteorological models provide data on large-scale UHI effects. This data are subsequently used as boundary conditions for medium-small scale thermal modelling tools of the built environment. For this scope, the potential of transfer functions has been explored. These functions derive from weather station data, high-resolution micro-climatic conditions at immediate proximity of built structures. The available simulation tools, used by the project partners are listed. These models and their coupling are the core of the DSS elaboration.
-
Action 5.3. Definition of mitigation and adaptation strategies. Given the above coupled modelling environment, the relative performance (predicted degree of success) for various alternative M&A strategies and measures could be examined and numerically described. A set of strategies are formulated to be applied at national and transnational scales to address the UHI phenomena. Such M&A measures portfolio includes specific urban and spatial planning guidelines as well as risk management recommendations.
5 Main Acronyms
- CE::
-
Central Europe
- DSS::
-
Decision Support System
- LP::
-
Lead Partner
- WP::
-
Work Package
- AF::
-
Application Form
- UHI::
-
Urban Heat Island
- ACT::
-
Action
- DBMS::
-
Database Management Software
- MBMS::
-
Model Base Management Software
- DGMS::
-
Dialogue Generation Management Software
- SMS::
-
Short Message Service
- TN::
-
Transnational Network
- M&A::
-
Mitigation and Adaptation
Open Access This chapter is distributed under the terms of the Creative Commons Attribution 4.0 International License (http://creativecommons.org/licenses/by/4.0/), which permits use, duplication, adaptation, distribution and reproduction in any medium or format, as long as you give appropriate credit to the original author(s) and the source, a link is provided to the Creative Commons license and any changes made are indicated.The images or other third party material in this chapter are included in the work’s Creative Commons license, unless indicated otherwise in the credit line; if such material is not included in the work’s Creative Commons license and the respective action is not permitted by statutory regulation, users will need to obtain permission from the license holder to duplicate, adapt or reproduce the material.
Reference
Kurn, D., Bretz, S., Huang. B., & Akbari, H. (1994). The potential for reducing urban air temperatures and energy consumption through vegetative cooling. In ACEEE summer study on energy efficiency in buildings. Pacific Grove: American Council for an Energy Efficient Economy.
Author information
Authors and Affiliations
Corresponding author
Editor information
Editors and Affiliations
Rights and permissions
This chapter is distributed under the terms of the Creative Commons Attribution 4.0 International License (http://creativecommons.org/licenses/by/4.0/), which permits use, duplication, adaptation, distribution and reproduction in any medium or format, as long as you give appropriate credit to the original author(s) and the source, a link is provided to the Creative Commons license and any changes made are indicated.
The images or other third party material in this chapter are included in the work’s Creative Commons license, unless indicated otherwise in the credit line; if such material is not included in the work’s Creative Commons license and the respective action is not permitted by statutory regulation, users will need to obtain permission from the license holder to duplicate, adapt or reproduce the material.
Copyright information
© 2016 The Author(s)
About this chapter
Cite this chapter
Fava, D., Guaragno, G., Dall’Olio, C. (2016). Decision Support Systems for Urban Planning. In: Musco, F. (eds) Counteracting Urban Heat Island Effects in a Global Climate Change Scenario. Springer, Cham. https://doi.org/10.1007/978-3-319-10425-6_5
Download citation
DOI: https://doi.org/10.1007/978-3-319-10425-6_5
Publisher Name: Springer, Cham
Print ISBN: 978-3-319-10424-9
Online ISBN: 978-3-319-10425-6
eBook Packages: Earth and Environmental ScienceEarth and Environmental Science (R0)