
Abstract
This chapter presents a cost-effective system for indoor localization and navigation that does not require the use of satellite positioning or data communication networks. The system, implemented as a smartphone app, relies on QR codes that are pre-generated and attached to the walls inside the building. By utilizing the information from these codes and the smartphone's inertial motion unit (IMU) sensors processed by the Pedestrian Dead-Reckoning (PDR) algorithm, the user's current position can be determined. The Dijkstra navigation algorithm is then used to guide the user to the desired destination. The smartphone app can also be used as a healthcare logistics service in mass-casualty incidents for collecting and reporting georeferenced triage decisions to the cloud.
You have full access to this open access chapter, Download chapter PDF
1 Introduction
The basic idea was to create a proof of concept demonstrating that the indoor navigation and localisation is possible using only passive tags. For this purpose, a smartphone navigation app was developed to be used in inner parts of the buildings and which can operate with no satellite positioning service available and no communication network present. The satellite navigation systems (GPS, GLONASS, Galileo, BeiDou, QZSS, IRNSS) inside buildings, at least on lower floors and cellars, in central parts, and away from windows, usually do not work, or their accuracy is very reduced due to a small number of visible satellites. The communication networks (WiFi, LTE, 5G…) might not be available in some circumstances such as catastrophic incidents, power reductions, or similar, which disables the localisation systems based on them.
The purpose of the smartphone app was twofold. First, to develop a reliable, simple-to-use, and cheap indoor navigation system that could be used in large buildings like hospitals, shopping malls, trade centres, fairs, etc. where no other positioning service is available. Second, to develop an indoor position reporting system that can be used in accidents and mass-casualty incidents for reporting triage decisions to the server. Both functionalities are based on the QR codes [1] holding all the information needed.
2 Encoding Information in QR
The QR codes must hold all the information needed for the navigation. Two types of QRs were created:
-
1.
Floor QR codes placed at the entrance to each floor include:
-
A compressed floor plan presented as edge list (Fig. 1). A python script was created for automatic generation of such items from raster images of floor plans.
Fig. 1 
A test floor plan saved in the floor QR after reconstruction
-
The navigation graph with coordinates of the destinations and navigation points with description labels of all destinations (Fig. 2).
Fig. 2 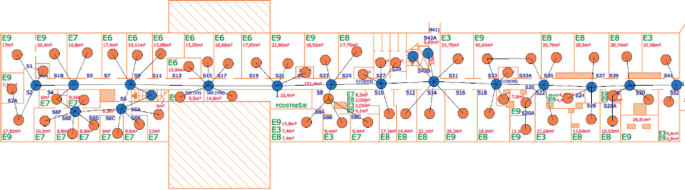
Example of a navigation graph for a testing floor with all possible destinations (orange circles) and navigation points (blue circles) depicted on the original floor plan raster image
-


The two items are separated from each other with the ‘|’ character. Since the maximal storage space within the QR is very limited (3 kB) the data were first encoded with the base64 encoder and then compressed with the gzip algorithm [2]. The generated QRs of this type are very dense thus slowing down the recognition process. In less than optimal lighting conditions, the captured image may not be robustly recognized by the decoding routine, despite being supported by the AI/ML mechanism. Through our experiments, we gradually increased the size of the printed QR code from A5 to A3, with 2 sizes (one half and one full) for each format. We then tested each image under 3 different lighting conditions, ranging from poor to excellent artificial and natural light. Our findings suggest that using a full A3 paper size to provide a larger and clearer image for the decoding routine can significantly improve the recognition accuracy of the captured image.
-
2.
Location QR codes placed at destinations, intersections, and other navigation points which include the location in GPS (latitude, longitude) and in metric UTM (northing, easting) coordinates and some additional data about this location (room label, residents etc.). The data size is much smaller (3–4 times) compared to the floor QRs and the printed codes are not so dense. We conducted experiments following the same methodology used for the floor QR codes, and found that A4 or even A5 paper sizes are suitable for achieving robust recognition of the QR codes. Our findings suggest that smaller paper sizes can still provide accurate recognition results, making it possible to use the system in various settings where larger paper sizes may not be practical.
An example of both QR types is shown in Fig. 3.

Example of the floor QR (left) and location QR (right)
3 Navigation
Navigation itself within the floor is performed by first scanning the floor QR, selecting the destination and then Dijkstra’s algorithm [3] calculates the shortest path to the destination which is then visualized on the floor plan (Fig. 4). The user’s current position is clearly marked and updated by the PDR algorithm [4] which determines steps converting them into distance according to chosen stride length, and direction of motion from IMU sensors. The smartphone orientation is also shown to facilitate determination of the user’s current orientation.

Visualised path from the start (blue square) to the destination (green square) and user's current location and orientation (black circle with red pointer)
4 Local to Global Coordinates
The localization is done in global outdoor coordinates commonly referred to as GPS coordinates. This is desired for compatibility with publicly available maps and commercial outdoor satellite navigation systems like google maps. Since the current user’s location is tracked by the smartphone IMU sensors and determined in meters by the PDR algorithm we needed to transform the local coordinates into global ones. Two approaches were considered:
-
Inverse Transverse Mercator Projection (ITMP)
-
Bilinear Interpolation (BI)
Transverse Mercator Projection (TMP) refers to the manner in which geographic coordinates are transformed into plane coordinates and basically projects a sphere or ellipsoid earth model to a cylinder which is then rolled out to a plane. In our case we needed to transform plane metric coordinates to geographic ones therefore the inverse TMP. This approach is known to be more accurate than other methods, but it is also more computationally demanding.
Bilinear interpolation is a method for interpolating functions of two variables using repeated linear interpolation. In our case, we consider latitude and longitude as functions over x and y, and we can calculate their values for each x and y from the known values in the vertices of the rectangle representing the floor. These known values can be read out from google maps. In the case of a non-rectangular floor shape, an apparent rectangle that encloses all destinations within the floor should be chosen. This approach is simple and less accurate than other methods, but it is also easier to implement.
Both approaches were tested and the results were very similar as depicted in Fig. 5. We first manually measured 52 locations on the test floor in a metric coordinate system aligned with the building orientation which we then rotated and scaled into UTM (Universal Transverse Mercator) coordinate system. We then made both conversions with this data. For the actual implementation, we then used BI since computations are much simpler compared to ITMP.

Comparison of the two conversion methods from the local (metric) coordinates to GPS ones plotted on google maps. The green ones are calculated by the bilinear interpolation and the blue ones by ITMP
5 Triage
The app supports the following triage scenario. First responders locate each casualty, decide on the emergency level, and then using the app’s menu select the triage decision and send it together with the location in GPS coordinates to the server using REST API interface and GeoJSON data format (Fig. 6) [5].

The app’s screen for triage decisions (left), confirmation of the data to be sent (middle) and during sending them to the server (right)
In case the communication network is not available the data is saved to a local JSON based database and sent to the cloud later when the communication is restored which is reported to the user as shown in Fig. 7.

If triage message was not successfully sent (left) the status of unsent messages is depicted on triage selection screen (right)
The data sent is encoded in GeoJSON data format for compatibility with the server-side software. An example of a red triage message (immediate, life-threatening status) is shown below.

6 Future Work
The described indoor navigation and localization system retrieves all the data needed from the QR codes which must be prepared and placed in appropriate locations in advance. The creation and placement of the codes demand a certain amount of time-consuming optimization due to the reduced storage space available. Also, the use of the system is not very user-friendly because users must locate the QRs without any help which is sometimes hard especially in catastrophic conditions when some QRs might be destroyed, occluded, or not accessible at all. In real life, the conditions when the communication network is destroyed or not available are very rare. The navigation itself was meant from the beginning to be used in normal daily circumstances. Therefore, it is reasonable to assume that users could access the navigation data for a certain complex of buildings from a designated server or cloud instead of from the QRs. This means that all the data needed is not size limited and can be transferred at once to a smartphone beforehand the user visits a desired building or complex. In this case, the organization of the data can be different. For example, all possible final destinations within a hospital are available in advance (not only when a particular floor is reached) and connected to a proper building, floor and wing. The navigation could be visualized and described in text even before the user reaches the entrance. Similarly, the starting point for indoor navigation (building entrance) can be determined from the smartphone’s built-in satellite positioning technology which eliminates any scanning at the destination site.
7 Conclusions
We have developed an indoor navigation and localization system that is both simple and cost-effective, using QR codes and a smartphone as a proof of concept. One of the system's main advantages is that all necessary information is stored in the passive QR codes, requiring no additional information source. However, a potential drawback is that scanning and recognizing the QR codes can be cumbersome and time-consuming, particularly in emergency situations or under poor lighting conditions. To address the limitations of the system, we continue to explore potential improvements, including the integration of more advanced algorithms and technologies to enhance the scanning and recognition process. The availability of the navigation data on the cloud for use in normal daily conditions where communication networks are available is also considered. Additionally, we have developed and tested a triage support feature to be used in healthcare logistics services, demonstrating the versatility of the system beyond navigation and localization. Overall, this simple and inexpensive system shows promise for indoor navigation and localization, and with continued development, it has the potential to revolutionize indoor navigation and logistics.
References
QR Codes: What Are They And How Do They Work? https://www.fastprint.co.uk/blog/quick-response-codes-what-are-they-and-how-do-they-work.html. Accessed 22 Jan 2023
Umaria, M.M., Jethava, G.B.: Enhancing the data storage capacity in QR code using compression algorithm and achieving security and further data storage capacity improvement using multiplexing. In: 2015 International Conference on Computational Intelligence and Communication Networks (CICN), Jabalpur, India, pp. 1094–1096 (2015). https://doi.org/10.1109/CICN.2015.215
Dijkstra, E.W.: A note on two problems in connexion with graphs. Numerische Mathematik 1(1), 269–71 (1959). https://doi.org/10.1007/BF01386390. S2CID 123284777
Hou, X., Bergmann, J.: Pedestrian dead reckoning with wearable sensors: a systematic review. IEEE Sens. J. 21(1), 143–152 (2021). https://doi.org/10.1109/JSEN.2020.3014955
van de Laar, F., Klabunde, K.: Location Awareness in HealthCare. InSecTT Book (2023)
Author information
Authors and Affiliations
Corresponding author
Editor information
Editors and Affiliations
Rights and permissions
Open Access This chapter is licensed under the terms of the Creative Commons Attribution 4.0 International License (http://creativecommons.org/licenses/by/4.0/), which permits use, sharing, adaptation, distribution and reproduction in any medium or format, as long as you give appropriate credit to the original author(s) and the source, provide a link to the Creative Commons license and indicate if changes were made.
The images or other third party material in this chapter are included in the chapter's Creative Commons license, unless indicated otherwise in a credit line to the material. If material is not included in the chapter's Creative Commons license and your intended use is not permitted by statutory regulation or exceeds the permitted use, you will need to obtain permission directly from the copyright holder.
Copyright information
© 2024 The Author(s)
About this chapter

Cite this chapter
Torkar, D. (2024). Indoor Navigation with a Smartphone. In: Karner, M., Peltola, J., Jerne, M., Kulas, L., Priller, P. (eds) Intelligent Secure Trustable Things. Studies in Computational Intelligence, vol 1147. Springer, Cham. https://doi.org/10.1007/978-3-031-54049-3_8
Download citation
DOI: https://doi.org/10.1007/978-3-031-54049-3_8
Published:
Publisher Name: Springer, Cham
Print ISBN: 978-3-031-54048-6
Online ISBN: 978-3-031-54049-3
eBook Packages: Intelligent Technologies and RoboticsIntelligent Technologies and Robotics (R0)