
Abstract
This chapter summarizes key information about the sulfur cycle and stable sulfur isotope biogeochemistry. The overview includes a description of the range of the stable sulfur isotope compositions in natural environments, potential pollutants and fertilizers used in agriculture. The primary focus is on the generation, transport, and mixing of sulfate and on its stable sulfur and oxygen isotope compositions that can be used as tracers. Several case studies that apply stable sulfate isotope analyses for the identification and quantification of pollutants in natural environments are used to provide an overview of successful applications and highlight major challenges. These are followed by the principles of sulfate sampling and analytical techniques.
You have full access to this open access chapter, Download chapter PDF
6.1 Overview of Stable Sulfur Isotope Biogeochemistry
Sulfur, as one of the macro-elements (H, C, N, O and S) is required for the biosynthesis of methionine and cysteine, two canonical amino acids that are incorporated into proteins (Brosnan and Brosnan 2006) and therefore is essential for the biosphere. Sulfur exists in natural environments at several oxidation states, but the most common are −2, +2, +4, and +6. The highest oxidation state (+6) is the most important for sulfur assimilation by plants because sulfur is mainly taken up as the sulfate ion, SO42− (Davidian and Kopriva 2010). Sulfate is also an abundant ion (~2.7 g/L) in marine environments (Andrulionis and Zavialov 2019), but some terrestrial ecosystems can be sulfur limited, despite a highly dynamic sulfur cycle and significant exchanges between land and sea (Fig. 6.1). The sulfate budget of the global ocean is controlled by: (1) river discharge (Burke et al. 2018); (2) sulfate reduction and sulfide re-oxidation; and (3) burial of sulfur-bearing minerals (Jørgensen et al. 2019). The terrestrial sulfur budget reflects primary inputs from (1) oceans via the atmosphere as inorganic sulfate and biogenic origin dimethylsulfide (Alon et al. 2013); (2) rock erosion resulting in sulfate dissolution and sulfide oxidation (Szynkiewicz et al. 2015b); and (3) organic matter decomposition (Schroth et al. 2007; Joo et al. 2022). In addition to these natural sources, the sulfur pool in agrosystems is supplemented by various anthropogenic sources, such as: (1) industrial outputs (Górka et al. 2017); (2) mining (Dogramaci et al. 2017); and (3) agriculture pollution (Chalk et al. 2017). Therefore, the use of chemical concentrations alone does not allow partitioning of sulfur sources or assessment of pollution inputs. This challenge can be addressed by including stable sulfur isotope analyses in hydrochemical analyses, as the stable sulfur isotope composition provides fingerprints of the original S-sources or leading processes and allows calculation of the proportional contribution of these sources.

Principles of sulfur biogeochemical cycling. Oxidation of hydrogen sulfide H2S occurs in the presence of molecular O2, leading to the production of sulfate (SO4), with minor stable isotope fractionation. Sulfate (SO4) can be utilized by plants via assimilatory reduction, again with minor stable isotope fractionation, and the resulting organic matter can be decomposed, leading to desulfurization. SO4 is the compound preferred by plants uptake. Dissimilatory and assimilatory reduction can be conducted under anoxic conditions by a few groups of microorganisms using SO4 as a biochemical substrate or during respiration. These biological processes are extremely 32S selective and result in a very low δ(34S) for H2S and a very high δ(34S) for residual SO4
Sulfur has four stable isotopes with a broad range of natural abundances: 32S = 95.04 %, 33S = 0.75 %, 34S = 4.20 % and 36S = 0.01 % as mole fraction percentages, and its stable isotope composition widely varies across different environments (Coplen et al. 2002a). Because the majority of the stable sulfur isotope fractionations are mass dependent, the ratio between the two most abundant stable isotopes 34S/32S is measured primarily using isotope ratio mass spectrometry (IRMS) (Sharp 2017). The results are usually reported in permilles (‰) as 1000 isotope delta values δ(34S) with respect to the absolute abundance in the Cañon Diablo Troilite (VCDT) standard, which is the international zero point for the VCDT scale (Kaplan and Hulston 1966; Skrzypek and Dunn 2020b). In addition to δ(34S), the stable oxygen isotope composition of the oxygen bonded in sulfates \(\delta (^{18} {\text{O}})_{{{\text{SO}}_{4} }}\) also provides valuable information about the sulfate origin. The \(\delta (^{18} {\text{O}})_{{{\text{SO}}_{4} }}\) value is typically analyzed in relation to the stable oxygen isotope composition of the water in which the sulfate is dissolved and that of atmospheric oxygen. Oxygen has three stable isotopes with different abundances of 18O = 0.20 %, 17O = 0.04 % and 16O = 99.76 % as mole fraction percentages (Coplen et al. 2002a). In the majority of studies, isotope delta values δ(18O) reflecting the 18O/16O ratio are used and expressed in permille (‰) in relation to the international water standard representing the zero point on the Vienna Standard Mean Ocean Water (VSMOW) scale.
The range of \(\delta (^{34} {\text{S}})_{{{\text{SO}}_{4} }}\) and \(\delta (^{18} {\text{O}})_{{{\text{SO}}_{4} }}\) values observed in the environment arises from stable isotope fractionations occurring during chemical, physical, or biological processes. In general, the stable sulfur isotope fractionation is relatively small during sulfur oxidation processes (~0–2 ‰) and negligible during sulfate dissolution (Clark and Fritz 1997). By contrast, this fractionation is very large during bacterial sulfur reduction processes, at up to ~40 ‰, because bacteria preferentially take up the lighter 32S isotope, thereby leaving the residual sulfur enriched in the heavy 34S isotope (Habicht and Canfield 1997). 32SO42− also reacts up to 1.07 faster than 34SO42− (Weyer et al. 1979). During sulfur oxidation, oxygen forms a strong and stable chemical bond with sulfur and does not easily exchange with water under natural conditions (Fig. 6.1). Its \(\delta (^{18} {\text{O}})_{{{\text{SO}}_{4} }}\) reflects the stable isotope composition of the oxygen source available during oxidation, which is usually atmospheric molecular oxygen or oxygen from water molecules. The isotope fractionation that occurs during the oxidation process depends on the source of oxygen and equals −11.4 ‰ between atmospheric oxygen and sulfate and +4.1 ‰ between water and sulfate (Taylor et al. 1984; Dogramaci et al. 2017).
6.2 Stable Isotope Composition of Sulfur Sources in Agro-ecosystems
Agro-ecosystems are usually studied on the catchment scale according to land use and water flow direction (Chap. 2). Therefore, the stable isotope and hydrochemical composition of pollution and natural solutes are monitored along waterways, in groundwater and pore water, and, if possible, at pollution sources or directly in contaminating compounds before their dispersal into the environment. The hydrochemical and stable isotope compositions of sulfate in water will therefore represent a mixture of various sources, both natural and anthropogenic, and the usual objective is to identify the fractional contributions from different sources and determine their locations. Hence, tracer studies very frequently use mass balance mixing models (Chap. 3) and sometimes include a stable isotope fractionation component (Lewicki et al. 2022). Mixing models can provide a fair assessment of the potential relative contributions from different sources if the hydrochemical and stable isotope signatures of each source are determined with reasonable accuracy. This is why the identification and characterization of potential sources are important before designing a specific sampling plan. The optimal method is to analyze the signature of each source at the studied location; however, the overview provided below can give benchmarks for the expected range of values.
The stable isotope studies using \(\delta (^{34} {\text{S}})_{{{\text{SO}}_{4} }}\) and \(\delta (^{18} {\text{O}})_{{{\text{SO}}_{4} }}\) as stable isotope hydrochemical tracers usually require consideration of the following potential sources of sulfur that contribute to waterways:
-
Natural sources
-
Precipitation and sea spray
-
Rock weathering
-
Sediments and soils
-
Decomposing organic matter
-
-
Anthropogenic sources
-
Atmospheric pollution
-
Acid rock drainage due to mining or other excavations
-
Industrial pollution discharge
-
Agriculture fertilizers.
-
6.2.1 Natural Sources
The sea spray contribution to the terrestrial sulfur budget is significant and occurs through the direct delivery of seawater droplets in coastal regions or by influencing the hydrochemical composition of precipitation. Sea spray delivers sulfate and dimethyl sulfate (DMS) at very high concentrations, but its delivery is restricted to coastal regions (Crawford et al. 2019; Lewis and Schwartz 2004). By contrast, precipitation that carries ocean signatures condenses across all land masses. It delivers large quantities of water, but the solutes are usually present at very low concentrations, with mean sulfate contents <3 mg/L and varying with distance from the coast and pollution sources; in pristine areas, the content is <0.3 mg/L (Vet et al. 2014). The generated loads of solutes are enormous on the landscape scale, but for sulfate surface budgets, these loads matter only in places with a long water retention time and a high evaporation rate (Skrzypek et al. 2013). In wet climates with high runoff, rainfall primarily causes solute dilution in the surface water, and its \(\delta (^{34} {\text{S}})_{{{\text{SO}}_{4} }}\) and \(\delta (^{18} {\text{O}})_{{{\text{SO}}_{4} }}\) are irrelevant due to the very low sulfate concentration (Vet et al. 2014). However, rainfall solute loads have a long-term impact on groundwater hydrochemistry in many regions, especially in arid and semiarid areas (Skrzypek et al. 2013, 2016), and in the absence of sulfur-bearing minerals in geological formations, rainfall may constitute a hydrochemical stable isotope baseline for sulfate in local pristine waters (Dogramaci and Skrzypek 2015).
The sulfate concentration in flood water depends on the evaporation and dissolution of salts deposited earlier on the ground; therefore, its concentration varies across a broad range and is not itself indicative of precipitation input. To make a meaningful estimation, other tracers can be used. For example, the ratio between sulfate and chloride (SO4/Cl), expressed in milliequivalents (meq/L) in the range between 0.15 and 0.70, can be attributed directly to marine origin (Fig. 6.2). Higher ratios will suggest inputs other than rainfall sulfate, while lower ratios will imply sulfur removal by sulfate reduction or excessive halite dissolution. Oceans also have a very distinct compositions, with \(\delta (^{34} {\text{S}})_{{{\text{SO}}_{4} }}\) ~ 21.1 ‰ and \(\delta (^{18} {\text{O}})_{{{\text{SO}}_{4} }}\) ~ 8.6 ‰, and these are highly consistent around the world (Rees et al. 1978; Holser et al. 1979). The unique \(\delta (^{34} {\text{S}})_{{{\text{SO}}_{4} }}\) values progressively decrease from 21 ‰ at the coast to ~14 ‰ in inland locations, but they usually remain above these values for other sulfur sources (Chivas et al. 1991). This range of values can be used as a basic reference baseline for local studies (Fig. 6.2). In this example, samples with \(\delta (^{34} {\text{S}})_{{{\text{SO}}_{4} }}\) ~12 ‰ fall within the SO4/Cl ratio typical for rainfall, suggesting precipitation as the dominant sulfate source for these waters (Fig. 6.2) (Dogramaci et al. 2017). By contrast, samples with a SO4/Cl ratio significantly higher than 0.7 have low \(\delta (^{34} {\text{S}})_{{{\text{SO}}_{4} }}\) < 8 ‰, suggesting an input of sulfur with a low \(\delta (^{34} {\text{S}})_{{{\text{SO}}_{4} }}\).

Stable sulfur isotope composition and chloride concentration relative to the SO4/Cl ratio (meq/L). The typical SO4/Cl ratio for rainfall varies between 0.15 and 0.7. Samples with SO4/Cl ratios >0.7 usually have additional S derived from sources other than precipitation. Samples with SO4/Cl ratios <0.1 are subject to S removal due to sulfate precipitation [\(\delta (^{34} {\text{S}})_{{{\text{SO}}_{4} }}\) 10–15‰] or bacterial reduction [\(\delta (^{34} {\text{S}})_{{{\text{SO}}_{4} }}\) > 30‰]. Groundwater—black points, surface water—blue points. Data from Pilbara, Western Australia, figure modified after Dogramaci et al. 2017
Rock weathering occurs naturally and can represent an important source of sulfur in waterways (Calmels et al. 2007; Das et al. 2012; Szynkiewicz et al. 2015b). The common form of sulfur is sulfide (e.g., pyrite or chalcopyrite) in many types of rock, especially metamorphic and sedimentary rocks (Dogramaci et al. 2017). Elemental sulfur occurs less frequently in, for example, volcanic rocks and as sulfate in evaporative deposits or salt domes (gypsum). These different geological sources of sulfur frequently show distinct \(\delta (^{34} {\text{S}})_{{{\text{SO}}_{4} }}\) and \(\delta (^{18} {\text{O}})_{{{\text{SO}}_{4} }}\) values that can aid in the identification of the contribution to ground and surface waters. However, the natural variability has a broad range (Coplen et al. 2002b), so obtaining local values is important whenever practical (Szynkiewicz et al. 2015b).
Sulfides usually have very low δ(34S), often below 0 ‰ (Krouse and Grinenko 1991; Clark and Fritz 1997), but values above zero have also been reported, such as −8.9 to 2.7 ‰ for the hydrothermal sulfides of the San Juan and Sangre de Cristo Mountains in the USA (Nordstrom et al. 2007; Campbell and Lueth 2008) or −1.9 to 4.4 ‰ for Pilbara in Western Australia (Dogramaci et al. 2017). In contrast to sulfides, the \(\delta (^{34} {\text{S}})_{{{\text{SO}}_{4} }}\) sulfates of marine origin evaporites are usually near or above the seawater values and are typically >15 ‰ (Claypool et al. 1980). However, most evaporites from old rock formations can be partitioned from modern marine sulfates deposited with rainfall or sea spray based on \(\delta (^{18} {\text{O}})_{{{\text{SO}}_{4} }}\). The evaporites \(\delta (^{18} {\text{O}})_{{{\text{SO}}_{4} }}\) values are usually much higher than the theoretically expected value of 16 ‰ (Holser et al. 1979) due to diagenetic alterations, and their values are significantly above those of marine sulfates (8.6 ‰). The \(\delta (^{34} {\text{S}})_{{{\text{SO}}_{4} }}\) values observed in sulfides may overlap with volcanic sulfur, which usually has values slightly above zero in both basalt rocks (Torssander 1988, 1989) and volcanic gases (De Moor et al. 2022).
The stable sulfur isotope composition of soil and terrestrial sediments primarily reflects geological sources and inputs from rain and sea spray (Mizota and Sasaki 1996; Stack and Rock 2011; Tanikawa et al. 2022) and consists of a mixture of minerals, organic sulfur or dissolved sulfates in porewater (Chalk et al. 2017). Under anoxic conditions (Fig. 6.1), if bacterial sulfate reduction occurs, the residual sulfate tends to have very high values, frequently >30‰ (Bottrell and Novak 1997; Oleinik et al. 2003; Schroth et al. 2007). Plant stable isotope composition usually reflects sulfur sources because the isotope fractionation occurring during sulfate uptake is usually negligible (Skrzypek et al. 2008; Chalk et al. 2017; Gałuszka et al. 2020). Therefore, plants do not provide unique signatures unless abundant organic matter decomposes under anoxic conditions, such as in wetlands or lake sediments, when the major driver of δ(34S) is bacterial reduction causing very high \(\delta (^{34} {\text{S}})_{{{\text{SO}}_{4} }}\) for residual sulfates (Trust and Fry 1992; Bottrell and Novak 1997; Skrzypek et al. 2010).
6.2.2 Anthropogenic Sources
6.2.2.1 Atmospheric Pollution
Atmospheric pollution in industrial areas frequently overwhelms the natural \(\delta (^{34} {\text{S}})_{{{\text{SO}}_{4} }}\) signature of precipitation. Very high sulfate loads are still observed around the world, despite desulfurization technologies introduced in the 1980s–1990s to address the acid rain problem (Jȩdrysek et al. 2002a, b), and they can exceed 4 kg/ha for sulfur (e.g., in the Mideastern US), compared to ~0.1 kg/ha for sulfur in pristine areas (e.g., the Rocky Mountains) (https://enviroatlas.epa.gov). A similar or even higher deposition of sulfur was observed in the industrial centers of Asia and Europe. The primary source of SO2 emission in the atmosphere is coal combustion in power plants and smelters (Jȩdrysek et al. 2003). Sulfur in coal originates primarily from sulfides and therefore has a very low δ(34S) (close to 0 ‰). During high-temperature combustion, whole sulfur is oxidized, and stable isotope fractionation for sulfur is low (Eldridge et al. 2016; Górka et al. 2017; Holt et al. 1982; Fig. 6.3). Sulfur is oxidized with atmospheric oxygen with a globally constant δ(18O) value of 23.5–23.8 ‰ (Kroopnick and Craig 1972; Horibe et al. 1973), and with the addition of atmospheric moisture, this forms SO4 characterized by a variable δ(18O), but usually below 0 ‰ (Araguás-Araguás et al. 2000). As a consequence of these processes, the \(\delta (^{34} {\text{S}})_{{{\text{SO}}_{4} }}\) in precipitation in polluted areas is low and usually varies from 0 to 5 ‰, with seasonal variations and variations due to inputs from other sources of pollution (Jenkins and Bao 2006; Górka et al. 2017; Kim et al. 2018; Wu et al. 2021).

Figure from Górka et al. (2017)
Range of \(\delta (^{34} {\text{S}})_{{{\text{SO}}_{4} }}\) variation in precipitation collected in the city of Wroclaw (SW Poland) with respect to the values of potential sulfur sources. The observed lack of correlation between the SO4 concentration and its \(\delta (^{34} {\text{S}})_{{{\text{SO}}_{4} }}\) suggests that pyrite oxidation during coal burning in a power plant is the main source of atmospheric sulfur, dominating sulfur budget in the atmosphere.
6.2.2.2 Acid Rock Drainage Due to Mining and Ground Disturbance
Sulfide oxidation occurs naturally through erosion processes of geological formations, which contribute to elevated concentrations of sulfates in the surface and groundwater (Cortecci et al. 2002; Brenot et al. 2007; Turchyn et al. 2013; Szynkiewicz et al. 2015b). The process occurring naturally on the ground surface primarily involves atmospheric oxygen, with only a small addition of oxygen from water molecules, at a proportion of 7:1 (Eq. 6.1). Therefore, during this reaction, only two moles of reduced hydrogen (H+) are produced per mole of FeS2 oxidized, and this contributes only moderately to water acidity. However, this process can escalate to a catastrophic scale when large amounts of pyrite are rapidly oxidized during large disturbances, such as those caused by mining, waste rock deposition, or construction work, that lead to acid rock drainage (ARD) (Dold 2017). This accelerated oxidation of a large amount of pyrite exposed to the surface during a disturbance results in a much lower pH than is observed with natural erosion processes occurring on the surface and on a small scale. Pyrite oxidation immobilizes iron, so the concentration of ferrous iron (Fe2+) increases in the solution. Ferrous iron can subsequently be oxidized to ferric iron (Fe3+) in the presence of oxygen at a low pH (Eq. 6.2), and this reaction can occur spontaneously or can be catalyzed by microorganisms. Ferric iron can also catalyze further pyrite oxidation under anoxic conditions using oxygen exclusively from water molecules and generating an eightfold higher acidity (Eq. 6.3) compared to oxidation involving atmospheric oxygen (i.e., 16 mol compared to 2 mol of H+) (Eq. 6.1).
These hydrochemical reactions will trigger elevated concentrations of sulfate and iron and low pH in waters impacted by ARD, which is accelerated by the presence of ferric iron. Low pH can be naturally neutralized in rock formations that contain large amounts of carbonates; therefore, acidity and sulfate concentrations alone cannot be used to verify the extent of ARD. For this reason, major ion hydrochemistry is frequently combined with stable isotope analyses. Pyrite in most geological formations has very low δ(34S) usually close to 0 ‰ and the ARD process does not cause stable isotope fractionation (Taylor et al. 1984; Gałuszka et al. 2020). Therefore, the original δ(34S) of pyrite is reflected in the initial \(\delta (^{34} {\text{S}})_{{{\text{SO}}_{4} }}\) value of the sulfate. However, some bacterially mediated reactions could be split into two phases, with some fractionation occurring during the initial stage (Brunner et al. 2008).
The \(\delta (^{34} {\text{S}})_{{{\text{SO}}_{4} }}\) value of produced sulfate usually does not overlap with other sources of natural sulfur in the environment or fertilizers. However, the δ(34S) alone may not be indicative of different secondary sources of sulfates originating from sulfide oxidation. For instance, ARD usually cannot be partitioned from pyrite oxidation resulting from natural erosion or from air pollution carrying the signature of pyrite combusted with coal in power plants if the δ(34S) values of the pyrite sources are similar. However, sulfate produced during sulfur oxidation in different environments will have a different \(\delta (^{18} {\text{O}})_{{{\text{SO}}_{4} }}\) that reflects the stable oxygen isotope composition in these environments. For example, sulfate oxidized with atmospheric oxygen will have values close to those of the oxygen in the atmosphere, which is constant around the globe (~23.5 ‰) (Kroopnick and Craig 1972) minus an isotope fractionation factor of −11.4 ‰ (Taylor et al. 1984). The stable oxygen isotope composition of surface water and groundwater is much more variable (usually −10 to +10 ‰) and depends on several factors, such as climate, distance from the sea, and evaporation losses (Gat 1997). Consequently, the \(\delta (^{18} {\text{O}})_{{{\text{SO}}_{4} }}\) will reflect the signature of the water available at the time of oxidation plus a fractionation factor of +4.1 ‰ (Taylor et al. 1984).
Oxygen and sulfur form strong chemical bonds in sulfate; therefore, both \(\delta (^{34} {\text{S}})_{{{\text{SO}}_{4} }}\) and \(\delta (^{18} {\text{O}})_{{{\text{SO}}_{4} }}\) are well preserved in solution unless sulfate is subject to biological processes and significant reduction, especially in anoxic conditions (Fritz et al. 1989, Fig. 6.1). Based on the stable isotope signatures of contrasting sources of oxygen contributing to sulfide oxidation, the contributions from the two leading processes to ARD can be partitioned (Eqs. 6.1–6.3).
6.2.2.3 Agriculture Fertilizers
The stable sulfur and oxygen isotope compositions of fertilizers vary in relatively large ranges according to their chemical compositions, manufacturing processes used for synthetic fertilizers and mineralogy of natural fertilizers (Mizota and Sasaki 1996; Coplen et al. 2002c; Vitòria et al. 2004; Chalk et al. 2017). This variability in \(\delta (^{34} {\text{S}})_{{{\text{SO}}_{4} }}\) and \(\delta (^{18} {\text{O}})_{{{\text{SO}}_{4} }}\) underscores the importance of understanding what types of fertilizers are used locally and, if possible, analyzing their stable isotope compositions. However, both \(\delta (^{34} {\text{S}})_{{{\text{SO}}_{4} }}\) and \(\delta (^{18} {\text{O}})_{{{\text{SO}}_{4} }}\) fertilizer signatures have been successfully used in several studies to partition agriculture sources from other sulfur sources by applying mixing models and estimating inputs from agrocontaminants (Mizota and Sasaki 1996; Hosono et al. 2007; Nakano et al. 2008; Szynkiewicz et al. 2015a; Urresti-Estala et al. 2015).
The dissolution and leaching of fertilizers to the surface and groundwater do not cause isotope fractionation, so the generated dissolved sulfate reflects the initial signature of the fertilizers (Chalk et al. 2017). However, the stable isotope composition of leachates, and especially \(\delta (^{18} {\text{O}})_{{{\text{SO}}_{4} }}\), can be further modified by bacterial processes. Hence, besides the initial stable isotope composition of fertilizers, processes contributing to the stable isotope fractionation of sulfates in soil and aquatic environments should also be considered. Stable isotope fractionation caused by microbiological processes adds uncertainty to the calculations, but the fertilizers usually still have a distinct composition that partitions them from other sources of sulfur in agrosystems if both \(\delta (^{34} {\text{S}})_{{{\text{SO}}_{4} }}\) and \(\delta (^{18} {\text{O}})_{{{\text{SO}}_{4} }}\) were analyzed at the same time (Fig. 6.4). The \(\delta (^{34} {\text{S}})_{{{\text{SO}}_{4} }}\) values are usually reported in the literature (Mizota and Sasaki 1996; Chalk et al. 2017), but relatively limited \(\delta (^{18} {\text{O}})_{{{\text{SO}}_{4} }}\) data are available (Vitòria et al. 2004). The median \(\delta (^{34} {\text{S}})_{{{\text{SO}}_{4} }}\) value reported by Vitòria et al. (2004) in the data compilation from a few countries, but primarily from Spain, was 5.7 ‰. The majority of fertilizers (25 of the 27 analyzed) from Spain had \(\delta (^{34} {\text{S}})_{{{\text{SO}}_{4} }}\) between −1.8 and 11.7 ‰ and \(\delta (^{18} {\text{O}})_{{{\text{SO}}_{4} }}\) between 7.7 and 16.5 ‰, thereby distinguishing these fertilizers from many other sulfur sources.

Range of stable sulfur and oxygen isotope compositions of fertilizers based on the compilation made by Vitòria et al. (2004), and Urresti-Estala et al. (2015), in reference to other typical sources of sulfate found in agrosystems. Note that fertilizers are represented by two separate green polygons according to origin
The type of applied fertilizer depends on the type of agricultural production, soil, and climate. Thus, the relatively broad range of \(\delta (^{34} {\text{S}})_{{{\text{SO}}_{4} }}\) and \(\delta (^{18} {\text{O}})_{{{\text{SO}}_{4} }}\) presented in Fig. 6.4 could be much more restricted for local studies on the catchment scale. Further, the subdivision of catchments according to the water flow direction and land use (Chap. 2) can provide even narrower value ranges for local use in mixing models developed for a particular location (Chap. 3 and Fig. 6.5).

Stable sulfur and oxygen isotope compositions of 43 fertilizer samples reported for Texas (Szynkiewicz et al. 2015a), Spain (Vitòria et al. 2004) and Western Australia (Data from Department of Water and Environmental Regulation and Department of Primary Industries and Regional Development of Western Australia). The gray area represents 80 % of the sample number with respect to the value range. Symbols indicate countries, and colors indicate chemical compositions
6.2.2.4 Other Industrial Pollution
Some other industrial pollutants impact the environment and influence \(\delta (^{34} {\text{S}})_{{{\text{SO}}_{4} }}\); however, these impacts occur less frequently and on more restricted scales. Some of these pollutants (e.g., hydrocarbons), even those characterized by low sulfur concentrations, can create anoxic conditions that accelerate microbiological sulfur reduction, thereby leading to substantial stable isotope fractionation. Specific chemical compounds in industrial pollution can also be used to determine dispersal pathways (Santucci et al. 2018; Schroth et al. 2001; Torssander et al. 2006).
6.3 Disentangling Acid Rock Drainage from Agrocontaminants Using \(\delta (^{2} {\text{H}})_{{{\text{H}}_{{2}} {\text{O}}}}\), \(\delta (^{18} {\text{O}})_{{{\text{H}}_{{2}} {\text{O}}}}\), \(\delta (^{34} {\text{S}})_{{{\text{SO}}_{4} }}\) and \(\delta (^{18} {\text{O}})_{{{\text{SO}}_{4} }}\)
The stable isotope analyses of sulfate usually are accompanied by analyses of stable hydrogen and oxygen isotope composition of water. The obtained \(\delta (^{2} {\text{H}})_{{{\text{H}}_{{2}} {\text{O}}}}\), \(\delta (^{18} {\text{O}})_{{{\text{H}}_{{2}} {\text{O}}}}\) results can support interpretation of \(\delta (^{34} {\text{S}})_{{{\text{SO}}_{4} }}\) and \(\delta (^{18} {\text{O}})_{{{\text{SO}}_{4} }}\) values and better partition the fate of water molecules from the fate of solutes. This is particularly important for interpretation of \(\delta (^{18} {\text{O}})_{{{\text{SO}}_{4} }}\) for which understanding of \(\delta (^{18} {\text{O}})_{{{\text{H}}_{{2}} {\text{O}}}}\) is required and variability in water stable isotope composition of major water sources.
6.3.1 Principles of δ2H(H2O) and δ18O(H2O) Interpretation
The stable hydrogen and oxygen isotope composition of water, \(\delta (^{2} {\text{H}})_{{{\text{H}}_{{2}} {\text{O}}}}\) and \(\delta (^{18} {\text{O}})_{{{\text{H}}_{{2}} {\text{O}}}}\), can inform us about the water sources contributing to a water body and distinguish inputs originating from four usually considered sources: (1) precipitation, (2) groundwater, (3) surface runoff, and (4) ocean water. Each of these sources can have very distinct \(\delta (^{2} {\text{H}})_{{{\text{H}}_{{2}} {\text{O}}}}\) and \(\delta (^{18} {\text{O}})_{{{\text{H}}_{{2}} {\text{O}}}}\), but their values vary spatially and temporarily with respect to the major drivers governing precipitation, groundwater recharge conditions, and evaporation, reflecting retention time on the ground surface (Gat 1997). All these values should be considered based on local conditions and the Local Meteoric Water Line (LMWL) and Local Evaporation Line (LEL), as defined by δ(2H)–δ(18O) relationship, as well as the precipitation pattern prior to sampling (Fig. 6.6; Craig and Gordon 1965; Rozanski et al. 1993).

Conceptual plot of the stable hydrogen and oxygen isotope composition of major water budget components considered for the evaluation of water source mixing and the progress of evaporation. The presented numerical range areas are those observed for the Pilbara region of Western Australia; these ranges will vary according to the local conditions. The slope of the Local Meteoric Water Line (LMWL) usually varies by ~8 to ~7 and the Local Evaporation Line (LEL) slope varies by ~5 to ~4. The dominant precipitation resulting from large-volume events or precipitation during cold periods tends to have negative values (RW). Groundwater (GW) usually reflects the values of the dominant precipitation, lies close to LMWL and has negative values. However, it is higher than RW and reflects the evaporative loss occurring between precipitation and infiltration into the groundwater aquifer. The stable isotope compositions of lakes and other water bodies are distributed along the LEL, and their position reflects the progress of evaporation, with higher delta values for more evaporated waters. Water bodies with significant additions of GW tend to lie between LEL and LMWL and close to GW. The crossing point between LEL and LMWL indicates the initial value for water prior to evaporation and lies close to RW
Precipitation varies seasonally according to temperature, humidity, source of moisture, rainout effect, elevation, distance from the coast, and other parameters (Dansgaard 1964; Rozanski et al. 1992, 1993). According to the International Atomic Energy Agency (IAEA) guidelines, the most appropriate method is to obtain LMWL locally from the monthly mean precipitation collected over a period of a minimum of three years (Gröning et al. 2012; Hughes and Crawford 2012; IAEA 1992). However, if local data are not available, several locations around the world have at least some precipitation data accessible from the Global Network of Isotopes in Precipitation (GNIP) database (Schotterer et al. 1996, https://www.iaea.org/services/networks/gnip) or national datasets (for example, in Australia: Hollins et al. 2018, in Canada: Peng et al. 2004, in Nigeria: Ohwoghere-Asuma et al. 2021, in the USA: Putman and Bowen 2019; Tian and Wang 2019 and in Vietnam: Le Duy et al. 2018). For regions lacking local data, approximate values can be obtained using an interpolation algorithm, as proposed by Bowen et al. (Bowen 2019; Bowen and Revenaugh 2003; https://waterisotopes.org).
Groundwater primarily reflects the stable isotope composition of the dominant precipitation contributing to recharge, such as large-volume events during the wet season (Skrzypek et al. 2019), snowmelt (Jasechko et al. 2017b) or past periods of abundant precipitation forming paleogroundwater (Jasechko et al. 2017a). These large-volume events or wet periods tend to have negative signatures. Similarly, at higher latitudes, the isotope composition is biased toward precipitation during the cold season and therefore also tends to have more negative values than during other seasons (Marchetti and Marchetti 2019). Therefore, groundwater frequently has low \(\delta (^{2} {\text{H}})_{{{\text{H}}_{{2}} {\text{O}}}}\) and \(\delta (^{18} {\text{O}})_{{{\text{H}}_{{2}} {\text{O}}}}\) compared to surface water, and these values are consistent on a regional or basin scale (Dogramaci et al. 2012a).
The surface water stable isotope composition in lakes and rivers is governed by evaporation and primarily reflects retention time (Fellman et al. 2011). The progress of evaporation reflects climate conditions, and retention time, since precipitation or water influx can be estimated by applying the Craig-Gordon model (Craig and Gordon 1965). Sampling inflow and outflow from a lake and comparing \(\delta (^{2} {\text{H}})_{{{\text{H}}_{{2}} {\text{O}}}}\) and \(\delta (^{18} {\text{O}})_{{{\text{H}}_{{2}} {\text{O}}}}\) allows for the estimation of evaporation over the inflow ratio. Similarly, repetitive sampling of a lake, pond, or waterhole as the water level decreases due to evaporation allows estimation of the water fraction loss (Fellman et al. 2011; Nitzsche et al. 2017; Paulsson and Widerlund 2020). Evaluation of evaporative losses helps to define the water budget for surface water bodies (Yapiyev et al. 2020) and to partition the fate of water molecules from the fate of solutes. The calculation procedure employing the C-G model has been simplified and standardized by the introduction of Hydrocalculator software (Skrzypek et al. 2015).
The ocean water \(\delta (^{2} {\text{H}})_{{{\text{H}}_{{2}} {\text{O}}}}\) and \(\delta (^{18} {\text{O}})_{{{\text{H}}_{{2}} {\text{O}}}}\) values are usually constant over a long time at a given location, and they reflect latitude. The mean ocean water \(\delta (^{2} {\text{H}})_{{{\text{H}}_{{2}} {\text{O}}}}\) and \(\delta (^{18} {\text{O}})_{{{\text{H}}_{{2}} {\text{O}}}}\) values are equal to 0‰ and define the zero point for the VSMOW2-SLAP2 international stable hydrogen and oxygen isotope scale (Coplen 1995). However, the surface water may vary locally with respect to evaporation, freshwater input, and ice melt, with values usually between −1 and 2‰ for \(\delta (^{18} {\text{O}})_{{{\text{H}}_{{2}} {\text{O}}}}\), and between −3 and 10 ‰ for \(\delta (^{2} {\text{H}})_{{{\text{H}}_{{2}} {\text{O}}}}\) (Schmidt 1999; Benetti et al. 2017). The ocean stable isotope composition could be used to assess mixing in estuaries (Price et al. 2012) or groundwater intrusion (Heilweil et al. 2009; Carreira et al. 2014) and to assess solute inputs in coastal regions.
6.3.2 Combined Approach to Partition Sulfate Sources Using Hydrochemical Composition, \(\delta (^{18} {\text{O}})_{{{\text{H}}_{{2}} {\text{O}}}}\) and \(\delta (^{18} {\text{O}})_{{{\text{SO}}_{4} }}\)
Stable isotope analyses of \(\delta (^{2} {\text{H}})_{{{\text{H}}_{{2}} {\text{O}}}}\) and \(\delta (^{18} {\text{O}})_{{{\text{H}}_{{2}} {\text{O}}}}\) have become routinely used tools to supplement major ion analyses. They can be coupled with analyses of changes in salinity, especially targeting conservative ions such as Cl to distinguish evapoconcentration from inputs other than precipitation (e.g., recycled accumulated salt or salt originating from geological formation or ions contributing from pollution) (Skrzypek et al. 2013). In pollution studies, \(\delta (^{18} {\text{O}})_{{{\text{H}}_{{2}} {\text{O}}}}\) can also be used to track the process of sulfate formation because \(\delta (^{18} {\text{O}})_{{{\text{SO}}_{4} }}\) primarily reflects the stable isotope composition of water and, to some extent, atmospheric oxygen, which is characterized by very constant values of ~23.5 ‰ (Kroopnick and Craig 1972). Following Eqs. 6.1–6.3, the contribution from these two oxygen sources to sulfate formation can be used to assess the dominant reaction for sulfate formation and the risk of ARD.
The potential of acid rock drainage is usually investigated in six steps and can be further used to partition other sources of sulfates in waterways:
-
1.
The SO4/Cl ratio (Fig. 6.2a) indicates the possibility of sulfate addition above those attributed to rainfall input. If the SO4/Cl is higher than 0.7, then part of the sulfate could originate from a source that does not contribute to other major conservative ion concentrations (e.g., conservative Cl). This is informative regarding the excessive input above that is observed in precipitation, but it does not specifically identify the source. However, other hydrochemical models can provide additional information about potential sources (Dogramaci et al. 2012b).
-
2.
The decrease or increase in \(\delta (^{34} {\text{S}})_{{{\text{SO}}_{4} }}\) correlated with an increased concentration of SO4 could also be attributed to the signature of the dominant sulfur input source (Fig. 6.7). Sulfides usually tend to have low or negative \(\delta (^{34} {\text{S}})_{{{\text{SO}}_{4} }}\). Therefore, a decrease in values is frequently associated with leaching from pyrite oxidation (e.g., García-Lorenzo et al. 2014; Dogramaci et al. 2017; Chudy et al. 2021). The best option is to confirm the local signatures of pyrite by directly analyzing minerals from the rock matrix in the study area.
Fig. 6.7 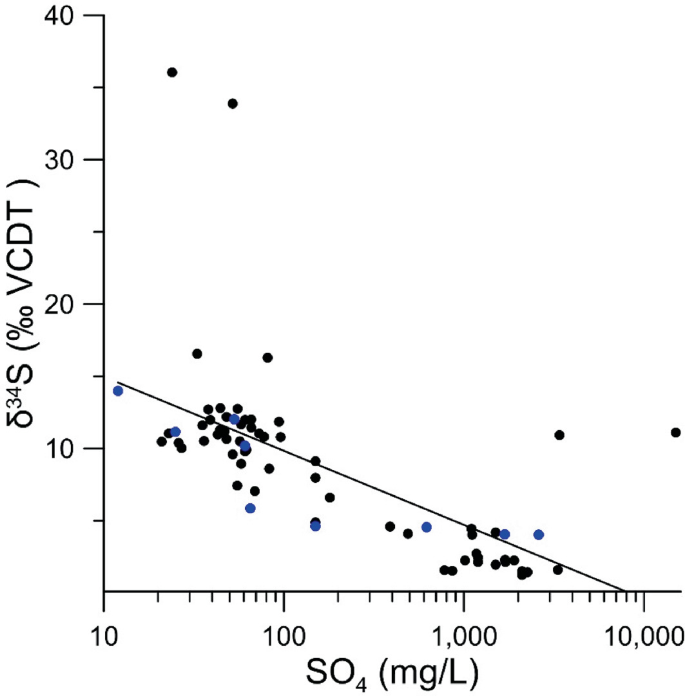
Figure from Dogramaci et al. (2017)
Increases in sulfide concentration correlate with decreases in \(\delta (^{34} {\text{S}})_{{{\text{SO}}_{4} }}\) in a case study from Pilbara, Western Australia. The pH at most locations was neutral because of buffering by carbonates. Acid rock drainage had to be confirmed using a combination of various hydrochemical and stable isotope tracers (blue points—surface water, black points—groundwater).
-
3.
In many cases, pyrite has a distinct signature that is lower than that of many other sources of sulfur. Therefore, \(\delta (^{34} {\text{S}})_{{{\text{SO}}_{4} }}\) alone could be sufficient to partition pyrite sulfur input from many other sources (García-Lorenzo et al. 2014; Chalk et al. 2017; Chudy et al. 2021). However, the values can overlap with fertilizers, which also tend to have low \(\delta (^{34} {\text{S}})_{{{\text{SO}}_{4} }}\) in some cases (Fig. 6.4). Fertilizer contributions can be separated from pyrite contributions using \(\delta (^{18} {\text{O}})_{{{\text{SO}}_{4} }}\), as the \(\delta (^{18} {\text{O}})_{{{\text{SO}}_{4} }}\) originating from pyrite oxidation is usually low (<10 ‰) and therefore different from most fertilizers (>10 ‰) (Fig. 6.4).
-
4.
The extent of ARD can be further confirmed using \(\delta (^{18} {\text{O}})_{{{\text{SO}}_{4} }}\) linked with \(\delta (^{18} {\text{O}})_{{{\text{H}}_{{2}} {\text{O}}}}\) of local ground or surface water in which sulfates are dissolved (Toran 1987; Taylor et al. 1984). The model proposed by Taylor et al. (1984) allows assessment of what portions of oxygen in the generated sulfate originate from the atmosphere and from water with respect to Eqs. 6.1–6.3 (Fig. 6.8). However, \(\delta (^{18} {\text{O}})_{{{\text{SO}}_{4} }}\) can be prone to microbial alterations by sulfuric bacteria, so δ(18O) will be replaced by the value of water available for the metabolic processes of bacteria in those cases; therefore, it should be treated with caution particularly when sulfate concentrations in water are low (Brunner et al. 2008). This method is still useful for assessment of ARD extent if uncertainty associated with potential bacterial reduction is kept in mind.
Fig. 6.8 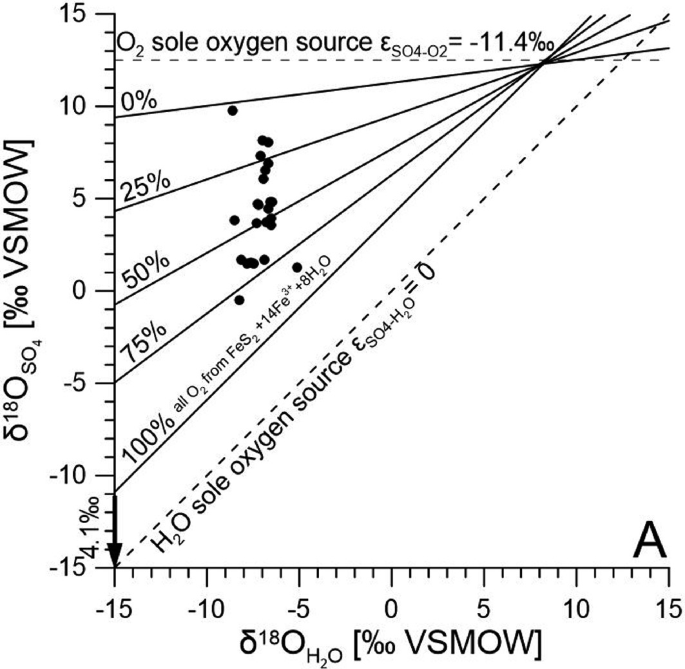
Figure after Dogramaci et al. (2017)
Estimation of the acid rock drainage (ARD) contribution to groundwater sulfates based on the stable oxygen isotope compositions of water and sulfate. Low \(\delta (^{18} {\text{O}})_{{{\text{SO}}_{4} }}\) and \(\delta (^{18} {\text{O}})_{{{\text{H}}_{{2}} {\text{O}}}}\) tend to suggest higher inputs from ARD (points between 50 and 100 %).
-
5.
The results of the ARD sulfate contribution could be used as input values for mixing models to calculate the proportional contributions from all determined sulfur sources, as discussed in Chap. 3. To account for uncertainty in the calculation, the average value for each considered source should be used, as well as a range of values reflecting the natural variability in each source \(\delta (^{34} {\text{S}})_{{{\text{SO}}_{4} }}\) and \(\delta (^{18} {\text{O}})_{{{\text{SO}}_{4} }}\).


The potential of ARD using the above principles can be qualitatively evaluated using a few categories with respect to simple hydrochemical parameters and sulfate and water stable isotope compositions, using the classification proposed by Dogramaci et al. (2017).
The principles summarized above have been successfully used in several variants of studies that endeavored to partition ARD sulfur sources from other inputs, usually to complement hydrochemical analyses of major ions and nutrients. The application of multiple tracers at the same time allows a more robust determination of contributions from various sources and a clearer estimation of calculation uncertainty. These outcomes help to evaluate what types of factors and human activities impact water quality. Szynkiewicz et al. (2015a, b) comprehensively assessed several sulfur sources in the Rio Grande catchment by partitioning sulfide inputs from agriculture fertilizer leachates, and they reported that the SO4 fluxes in Rio Grande at El Paso, at 200–450 metric tons/day, were originating from agrocontaminates primarily associated with irrigation periods linked with intensive fertilizer application. By contrast, this flux was only 30–80 metric tons/day during the postharvest winter season, when the majority of sulfate in the river was delivered by natural brines seeping into the catchment. At the same time, in the upper part of the Rio Grande catchment, sulfides contributed 83–94 % of the total sulfate budget (Szynkiewicz et al. 2015a, b). Toran (1987) was able to identify an area of sulfate contaminatioûn in groundwater from a carbonate-hosted mine on farmland in Wisconsin. Using a mixing model, Toran (1987) also applied hydrochemical modeling using the USGS computer program PHREEQE and determined the contribution from acid rock drainage despite the neutral pH due to buffering by carbonate rocks. Newman et al. confirmed underground seepage from an acidic pit lake to a perennial stream system. The acid rock drainage water input elevated the sulfate concentration and lowered the pH, which contributed to the mobility of potentially toxic metals (Al, Cd and Zn). The use of stable isotope methods allowed the evaluation of the extent of mining impacts in the catchments downstream from the mine and the partitioning of mining sources from other sulfur sources (Newman et al. 2020) and separate mining inputs from other S-sources including agriculture. A similar approach was adopted by Chudy et al. (2021) who assessed the impact of an abandoned iron ore mine on water quality. The extent of the mining influence and separation from the geological background could be further evaluated using bioindicator methods and plant tissue analyses (e.g., Migaszewski and Gałuszka 2019; Gałuszka et al. 2020).
6.4 Sample Preparation Techniques and Measurements
The sample of sulfate used for \(\delta (^{34} {\text{S}})_{{{\text{SO}}_{4} }}\) and \(\delta (^{18} {\text{O}})_{{{\text{SO}}_{4} }}\) analyses is usually precipitated from water as barium sulfate (BaSO4). Several variants of the procedure have been described in the literature, but all are based on the steps originally designed for the classical method for the analysis of sulfate concentrations (e.g., Carmody et al. 1998; Skrzypek 2018):
-
1.
Usually, between 0.5 and 4 L of water sample is collected (for SO42− concentration, this range is for 50 and 5 mg/L of sulfate, respectively) to clean high-density polyethylene (HDPE) bottles. Bottles should be filled full, without headspace, and well-sealed. These water volumes are sufficient to precipitate ~50 mg of BaSO4. For a single stable isotope analysis, usually up to 1 mg of BaSO4 is required, but handling such small aliquots is impractical during washing and transferring. Water samples should be filtered through 0.45 μm filters in the field or as soon as delivered to the laboratory. Sulfate samples are prone to stable isotope fractionation caused by bacterial reactions; therefore, they should be stored chilled on ice in a portable ice chest box in the field and later in a fridge at ~+ 5 °C.
-
2.
Before BaSO4 is precipitated, the pH of the filtered sample should be adjusted by adding a few milliliters of HCl to lower the pH to 2–3. The volume of acid required depends on the HCl concentration used and water alkalinity, but typically ~3–5 mL of 5 N HCl is sufficient.
-
3.
To accelerate crystal formation, warming the sample to ~40 °C is recommended. Precipitation of 50 mg of BaSO4 (as per the volumes and concentrations listed in point 1) requires the addition of ~1.2 mL of 10 % BaCl2; this volume contains approximately three times more barium than required by the stochiometric reaction to ensure fast and complete precipitation and also to take into consideration the potential uncertainty in the prediction of sulfate concentration. After vigorous stirring with a glass rod, the solution needs to be left for several hours to allow barium sulfate formation and deposition at the bottom of the beaker.
-
4.
The following day, white crystals should cover the bottom of the beaker and the supernatant should be transparent. The completeness of sulfate precipitation can be tested by adding a small amount of BaCl2 solution to see if further precipitation occurs, appearing as foggy tracers in the supernatant. In the next step, the supernatant needs to be removed and the white BaSO4 crystals washed with deionized water at least three times. The supernatant removal procedure can be performed using a simple siphon tube and then the beaker is refilled with deionized water. Again, the sample needs to be left overnight for crystal sedimentation. This process needs to be repeated three times. Alternatively, to accelerate the washing process, the sample can be transferred to centrifuge tubes, spun and the supernatant removed and replaced with deionized water. Using a centrifuge at 5000 rpm accelerates the separation of crystals and the supernatant and eliminates the overnight wait time. The washing with deionized water and centrifugation procedure should be repeated three times to remove traces of HCl and any unreacted excess of BaCl2.
-
5.
After washing, the collected BaSO4 sample can be transferred to a small evaporative dish and dried at 110 °C in a laboratory oven. After drying and cooling, the samples can be stored in small glass or plastic vials for several years. Pure BaSO4 should be white (or light gray) powder, like fine kitchen salt.
-
6.
BaCl2 is toxic, particularly for aquatic organisms. Therefore, all wastewater from washing needs to be neutralized by adding H2SO4 to precipitate the residual barium remaining in solution, and then the pH can be adjusted to neutral using sodium carbonate (e.g., soda ash).
The procedure presented above does not account for potential interferences that can be caused by compounds other than sulfate sulfur and oxygen-bearing compounds present in water samples (Skrzypek 2018). Therefore, modification of this procedure may be required to address the following potential problems:
-
1.
Samples that contain large concentrations of dissolved organic carbon (DOC) may be contaminated by coprecipitated organic fractions, as indicated by frequent changes in sample color from white to dark gray or brown. To address this issue, prefiltration through a 0.21 μm filter can be considered. Contaminated samples can also be further processed by adding 10 % hydrogen peroxide (H2O2) to an evaporation dish with dry BaSO4 to oxidize organic matter. The small addition of organic matter usually has a minor influence on \(\delta (^{34} {\text{S}})_{{{\text{SO}}_{4} }}\) but could significantly change \(\delta (^{18} {\text{O}})_{{{\text{SO}}_{4} }}\).
-
2.
If the H2S concentration in water samples is >0.5 mg/dm3 (characterized by a distinctive rotten-egg odor), H2S needs to be removed by precipitation and filtration to separate it from SO42−. The water sample must first be transferred to a glass beaker (500 or 1000 mL depending on the sample volume) and 5% zinc acetate solution added in a 1:10 ratio (e.g., 50 mL zinc acetate solution to 500 mL of water sample volume). After mixing, at least 1 h should be allowed for precipitation and sedimentation (Carmody et al. 1998).
-
3.
Analyses of \(\delta (^{18} {\text{O}})_{{{\text{SO}}_{4} }}\) in water samples that contain high concentrations of nitrates can be impacted by coprecipitation of nitrates that inoculate crystals of BaSO4. Nitrates will yield oxygen during the analysis, and they will be added to the oxygen yield from sulfates. In coprecipitated NO3/SO4 mixtures where molar ratios are above 2, the oxygen bonded in nitrates may contribute up to 7 % of the total yields and cause changes in \(\delta (^{18} {\text{O}})_{{{\text{SO}}_{4} }}\) of up to 5 ‰ (Michalski et al. 2008). Nitrates can be removed from water before precipitation of barium sulfate using the anion-exchange resin method (Le Gendre et al. 2017) or after precipitation using a chelating solution to redissolve and then reprecipitate barium sulfate (Bao 2006).
The stable sulfur and oxygen isotope compositions of sulfate in barium sulfate samples are routinely analyzed using IRMS in traditional offline systems or in continuous flow mode (Sharp 2017). In the currently more popular continuous flow systems, BaSO4 for \(\delta (^{34} {\text{S}})_{{{\text{SO}}_{4} }}\) analyses is decomposed at a high temperature (1000 °C) in elemental analyzers adapted for sulfur. After purification and water removal, SO2 gas in the helium stream is introduced to the ion source of a mass spectrometer. Analyzing SO2 compared to the SF6 gas traditionally used in offline systems is challenging due to isobaric interferences caused by the variable stable oxygen isotope composition. This arises from the physical properties of SO2, as different combinations of sulfur and oxygen isotopes can result in the same masses of SO2 molecule (Sharp 2017). This issue can be partially overcome using various correction factors and utilizing IRMS systems with three collectors that analyze simpler molecules (e.g., fragmented ions, such as SO+ with possible masses 48, 49 and 50). This analytical approach simplifies the required isobaric corrections and reduces analytical uncertainty. The analyzed samples are normalized to the VCDT scale for presentation as isotope delta values (Skrzypek et al. 2022) using at least two, but preferably three, well-calibrated laboratory or international standards, such as NBS127, IAEA-S-1, IAEA-S-2, and IAEA-S-3 (Skrzypek 2013). The usual combined analytical uncertainty of \(\delta (^{34} {\text{S}})_{{{\text{SO}}_{4} }}\) analysis varies between 0.3 and 0.4 ‰. The stable oxygen isotope composition of sulfates, \(\delta (^{18} {\text{O}})_{{{\text{SO}}_{4} }}\), can also be analyzed using continuous flow IRMS systems that differ from those used for \(\delta (^{34} {\text{S}})_{{{\text{SO}}_{4} }}\). For \(\delta (^{18} {\text{O}})_{{{\text{SO}}_{4} }}\) analysis, high‐temperature pyrolysis (HTP) at 1450 °C is required, utilizing a thermal conversion elementary analyzer (TC/EA). BaSO4 is reduced in the presence of hot graphite and glassy carbon, and carbon monoxide (CO) is produced. CO is separated from other gases using a gas chromatography column and introduced to the ion source of the IRMS. After multi-point normalization (Skrzypek 2013), usually based on international standards (e.g., IAEA-SO5, IAEA-S06 and NBS127), the results are reported on the VSMOW stable isotope scale with a combined analytical uncertainty usually 0.30–0.40 ‰, one sigma (Skrzypek and Sadler 2011).
6.5 Limitations and Challenges
Stable isotope delta results are reported with respect to entirely artifact-based scales that occasionally require updates (e.g., VSMOW2-SLAP2 or VPDB). To ensure the longevity of published data, a comprehensive description must be provided of (1) the analytical procedure; (2) traceability; (3) data processing; and (4) the uncertainty evaluation. For the minimum requirements for publishing stable isotope results, please refer to the guidelines prepared by the International Atomic Energy Agency and the International Union of Pure and Applied Chemistry (Skrzypek et al. 2022). If recalculations are required between different expressions of the stable isotope composition (e.g., isotope ratio, isotope fraction, isotope delta), the differences between the absolute values of the zero points for stable isotope scales adopted in the manufacturing software setup need to be considered and the calculations adjusted accordingly (Skrzypek and Dunn 2020a, b).
In catchments contaminated with pollutants originating from several sources, the major challenge is clarifying the ambiguous stable isotope signatures of overlapping values. To a large extent, this issue can be addressed using denser sampling to determine pollution budgets in individual subcatchments and by applying more advanced probabilistic models rather than simple mass balance arithmetic calculations (Lewicki et al. 2022).
References
Alon A, Ward S-A, Yeala S, Ronald PK (2013) Sulfur isotope homogeneity of oceanic DMSP and DMS. Proc Natl Acad Sci 110:18413–18418
Andrulionis NY, Zavialov PO (2019) Laboratory studies of main component composition of hyperhaline lakes. Phys Oceanogr 26:13–31
Araguás-Araguás L, Froehlich K, Rozanski K (2000) Deuterium and oxygen-18 isotope composition of precipitation and atmospheric moisture. Hydrol Process 14:1341–1355
Bao H (2006) Purifying barite for oxygen isotope measurement by dissolution and reprecipitation in a chelating solution. Anal Chem 78:304–309
Benetti M, Reverdin G, Aloisi G, Sveinbjörnsdóttir Á (2017) Stable isotopes in surface waters of the Atlantic Ocean: indicators of ocean-atmosphere water fluxes and oceanic mixing processes. J Geophys Res: Oceans 122:4723–4742
Bottrell S, Novak M (1997) Sulphur isotopic study of two pristine Sphagnum bogs in the western British Isles. J Ecol 85:125–132
Bowen GJ (2019) The online isotopes in precipitation calculator. Available http://www.waterisotopes.org (Accessed)
Bowen GJ, Revenaugh J (2003) Interpolating the isotopic composition of modern meteoric precipitation. Water Resour Res 39:SWC91–SWC913.
Brenot A, Carignan J, France-Lanord C, Benoît M (2007) Geological and land use control on δ34S and δ18O of river dissolved sulfate: the Moselle river basin, France. Chem Geol 244:25–41
Brosnan JT, Brosnan ME (2006) The sulfur-containing amino acids: an overview. J Nutr 136:1636S-1640S
Brunner B, Yu J-Y, Mielke RE, Macaskill JA, Madzunkov S, Mcgenity TJ, Coleman M (2008) Different isotope and chemical patterns of pyrite oxidation related to lag and exponential growth phases of Acidithiobacillus ferrooxidans reveal a microbial growth strategy. Earth Planet Sci Lett 270:63–72
Burke A, Present TM, Paris G, Rae ECM, Sandilands BH, Gaillardet J, Peucker-Ehrenbrink B, Fischer WW, Mcclelland JW, Spencer RGM, Voss BM, Adkins JF (2018) Sulfur isotopes in rivers: Insights into global weathering budgets, pyrite oxidation, and the modern sulfur cycle. Earth Planet Sci Lett 496:168–177
Calmels D, Gaillardet J, Brenot A, France-Lanord C (2007) Sustained sulfide oxidation by physical erosion processes in the Mackenzie River basin: climatic perspectives. Geology 35:1003–1006
Campbell AR, Lueth VW (2008) Isotopic and textural discrimination between hypogene, ancient supergene, and modern sulfates at the Questa mine, New Mexico. Appl Geochem 23:308–319
Carmody RW, Plummer N, Busenberg E, Coplen TB (1998) Methods for collection of dissolved sulfate and sulfide and analysis of their sulfur isotopic composition. In: Open-file report. Reston, VA C6
Carreira PM, Marques JM, Nunes D (2014) Source of groundwater salinity in coastline aquifers based on environmental isotopes (Portugal): natural versus human interference. A review and reinterpretation. Appl Geochem 41:163–175
Chalk PM, Inácio CT, Chen D (2017) Tracing S dynamics in agro-ecosystems using 34S. Soil Biol Biochem 114:295–308
Chivas AR, Andrews AS, Lyons WB, Bird MI, Donnelly TH (1991) Isotopic constraints on the origin of salts in Australian playas. 1. Sulphur. Palaeogeogr Palaeoclimatol Palaeoecol 84:309–332
Chudy K, Worsa-Kozak M, Wójcik A, Wolkersdorfer C, Drzewicki W, Konsencjusz D, Szyszka D (2021) Chemical variations in mine water of abandoned pyrite mines exemplified by the Colorful Lakes in Wieściszowice, Sudetes Mountains, Poland. J Hydrol: Regional Stud 38:100974
Clark ID, Fritz P (1997) Environmental isotopes in hydrogeology. Taylor & Francis Group, CRC Press, Boca Raton
Claypool GE, Holser WT, Kaplan IR, Sakai H, Zak I (1980) The age curves of sulfur and oxygen isotopes in marine sulfate and their mutual interpretation. Chem Geol 28:199–260
Coplen TB (1995) Discontinuance of SMOW and PDB [6]. Nature 375:285
Coplen TB, Böhlke JK, De Bièvre P, Ding T, Holden NE, Hopple JA, Krouse HR, Lamberty A, Peiser HS, Révész K, Rieder SE, Rosman KJR, Roth E, Taylor PDP, Vocke RD Jr, Xiao YK (2002a) Isotope-abundance variations of selected elements (IUPAC technical report). Pure Appl Chem 74:1987–2017
Coplen TB, Hopple JA, Böhlke JK, Peiser HS, Rieder SE, Krouse HR, Rosman KJR, Ding T, Vocke RD Jr, Revesz KM, Lamberty A, Taylor P, De Bievre P (2002b) Compilation of minimum and maximum isotope ratios of selected elements in naturally occurring terrestrial materials and reagents. In: Water-resources investigations report. C6
Coplen TB, Hopple JA, Böhlke JK, Peiser HS, Rieder SE, Krouse HR, Rosman KJR, Ding T, Vocke RD Jr, Révész KM, Lamberty A, Taylor P, Bièvre D (2002c) Compilation of minimum and maximum isotope ratios of selected elements in naturally occurring terrestrial materials and reagents. US Geological Survey Water-Resources Investigation
Cortecci G, Dinelli E, Bencini A, Adorni-Braccesi A, La Ruffa G (2002) Natural and anthropogenic SO4 sources in the Arno river catchment, northern Tuscany, Italy: a chemical and isotopic reconnaissance. Appl Geochem 17:79–92
Craig H, Gordon LI (1965) Deuterium and oxygen-18 variations in the ocean and the marine atmosphere. Stable Isotopes in Oceanographic Studies and Paleotemperatures 9–130.
Crawford J, Cohen DD, Chambers SD, Williams AG, Atanacio A (2019) Impact of aerosols of sea salt origin in a coastal basin: Sydney, Australia. Atmos Environ 207:52–62
Dansgaard W (1964) Stable isotopes in precipitation. Tellus 16:436–468
Das A, Chung C-H, You C-F (2012) Disproportionately high rates of sulfide oxidation from mountainous river basins of Taiwan orogeny: sulfur isotope evidence. Geophys Res Lett 39:L12404
Davidian J-C, Kopriva S (2010) Regulation of sulfate uptake and assimilation—The same or not the same? Mol Plant 3:314–325
De Moor JM, Fischer TP, Plank T (2022) Constraints on the sulfur subduction cycle in Central America from sulfur isotope compositions of volcanic gases. Chem Geol 588
Dogramaci S, Mclean L, Skrzypek G (2017) Hydrochemical and stable isotope indicators of pyrite oxidation in carbonate-rich environment; the Hamersley Basin, Western Australia. J Hydrol 545:288–298
Dogramaci S, Skrzypek G (2015) Unravelling sources of solutes in groundwater of an ancient landscape in NW Australia using stable Sr, H and O isotopes. Chem Geol 393–4:67–78
Dogramaci S, Skrzypek G, Dodson W, Grierson P (2012a) Stable isotope and hydrochemical evolution of groundwater in the semi-arid Hamersley Basin of sub-tropical northwest Australia. J Hydrogeol 475:281–293
Dogramaci S, Skrzypek G, Dodson W, Grierson PF (2012b) Stable isotope and hydrochemical evolution of groundwater in the semi-arid Hamersley Basin of subtropical northwest Australia. J Hydrol 475:281–293
Dold B (2017) Acid rock drainage prediction: a critical review. J Geochem Explor 172:120–132
Eldridge DL, Guo W, Farquhar J (2016) Theoretical estimates of equilibrium sulfur isotope effects in aqueous sulfur systems: highlighting the role of isomers in the sulfite and sulfoxylate systems. Geochim Cosmochim Acta 195:171–200
Fellman JB, Dogramaci S, Skrzypek G, Dodson W, Grierson PF (2011) Hydrologic control of dissolved organic matter biogeochemistry in pools of a subtropical dryland river. Water Resour Res 47:W06501
Fritz P, Basharmal GM, Drimmie RJ, Ibsen J, Qureshi RM (1989) Oxygen isotope exchange between sulphate and water during bacterial reduction of sulphate. Chem Geol: Isotope Geosci Sect 79:99–105
Gałuszka A, Migaszewski ZM, Pelc A, Trembaczowski A, Dołęgowska S, Michalik A (2020) Trace elements and stable sulfur isotopes in plants of acid mine drainage area: implications for revegetation of degraded land. J Environ Sci (China) 94:128–136
García-Lorenzo ML, Martínez-Sánchez MJ, Pérez-Sirvent C, Agudo I, Recio C (2014) Isotope geochemistry of waters affected by mining activities in Sierra Minera and Portman Bay (SE, Spain). Appl Geochem 51:139–147
Gat JR (1997) Isotope hydrology. World Scientific Publishing Co Pte Ltd.
Górka M, Skrzypek G, Hałas S, Jędrysek MO, Strąpoć D (2017) Multi-seasonal pattern in 5-year record of stable H, O and S isotope compositions of precipitation (WrocŁaw, SW Poland). Atmos Environ 158:197–210
Gröning M, Lutz HO, Roller-Lutz Z, Kralik M, Gourcy L, Pöltenstein L (2012) A simple rain collector preventing water re-evaporation dedicated for δ18O and δ2H analysis of cumulative precipitation samples. J Hydrol 448–449:195–200
Habicht KS, Canfield DE (1997) Sulfur isotope fractionation during bacterial sulfate reduction in organic-rich sediments. Geochim Cosmochim Acta 61:5351–5361
Heilweil VM, Solomon KD, Gingerich SB, Verstraeten IM (2009) Oxygen, hydrogen, and helium isotopes for investigating groundwater systems of the Cape Verde Islands, West Africa. Hydrogeol J 17:1157–1174
Hollins SE, Hughes CE, Crawford J, Cendón DI, Meredith KM (2018) Rainfall isotope variations over the Australian continent—Implications for hydrology and isoscape applications. Sci Total Environ 645:630–645
Holser WT, Kaplan IR, Sakai H, Zak I (1979) Isotope geochemistry of oxygen in the sedimentary sulfate cycle. Chem Geol 25:1–17
Holt BD, Kumar R, Cunningham PT (1982) Primary sulfates in atmospheric sulfates: estimation by oxygen isotope ratio measurements. Science 217:51–53
Horibe Y, Shigehara K, Takakuwa Y (1973) Isotope separation factor of carbon dioxide-water system and isotopic composition of atmospheric oxygen. J Geophys Res 78:2625–2629
Hosono T, Nakano T, Igeta A, Tayasu I, Tanaka T, Yachi S (2007) Impact of fertilizer on a small watershed of Lake Biwa: use of sulfur and strontium isotopes in environmental diagnosis. Sci Total Environ 384:342–354
Hughes C, Crawford J (2012) A new precipitation weighted method for determining the meteoric water line. J Hydrol 464–465:344–351
Iaea (1992) Statistical treatment of data on environmental isotopes in precipitation. International Atomic Energy Agency, Vienna
Jasechko S, Perrone D, Befus KM, Bayani cardenas M, Ferguson G, Gleeson T, Luijendijk E, Mcdonnell Jeffrey J, Taylor RG, Wada Y, Kirchner JW (2017a) Global aquifers dominated by fossil groundwaters but wells vulnerable to modern contamination. Nat Geosci 10:425–429
Jasechko S, Wassenaar LI, Mayer B (2017b) Isotopic evidence for widepread cold-season-biased groundwater recharge and young streamflow across central Canada. Hydrol Process 31:2196–2209
Jȩdrysek MO, Kałuzny A, Hoefs J (2002a) Sulphur and oxygen isotope ratios in spruce needles as a tracer of atmospheric pollution. J Geophys Res D: Atmos 107:5-1–5-12.
Jȩdrysek MO, Kałuzny A, Hoefs J (2002b) Sulphur and oxygen isotope ratios in spruce needles as a tracer of atmospheric pollution. J Geophys Res Atmos 107:5-1–5-12.
Jȩdrysek MO, Krapiec M, Skrzypek G, Kałuzny A (2003) Air-pollution effect and paleotemperature scale versus δ13C records in tree rings and in a peat core (Southern Poland). Water Air Soil Pollut 145:359–375
Jenkins KA, Bao H (2006) Multiple oxygen and sulfur isotope compositions of atmospheric sulfate in Baton Rouge, LA, USA. Atmos Environ 40:4528–4537
Joo YJ, Sim MS, Elwood Madden ME, Soreghan GS (2022) Significance of the terrestrial sink in the biogeochemical sulfur cycle. Geophys Res Lett 49:e2021GL097009.
Jørgensen BB, Findlay AJ, Pellerin A (2019) The biogeochemical sulfur cycle of marine sediments. Front Microbiol 10:849–849
Kaplan IR, Hulston JR (1966) The isotopic abundance and content of sulfur in meteorites. Geochim Cosmochim Acta 30:479–496
Kim Y, Lee I, Lim C, Farquhar J, Lee SM, Kim H (2018) The origin and migration of the dissolved sulfate from precipitation in Seoul, Korea. Environ Pollut 237:878–886
Kroopnick P, Craig H (1972) Atmospheric oxygen: isotopic composition and solubility fractionation. Science 175:54–55
Krouse HR, Grinenko VA (1991) Stable isotopes: Natural and anthropogenic sulphur in the environment. Wiley, UK
Le Duy N, Heidbüchel I, Meyer H, Merz B, Apel H (2018) What controls the stable isotope composition of precipitation in the Mekong Delta? A model-based statistical approach. Hydrol Earth Syst Sci 22:1239–1262
Le Gendre E, Martin E, Villemant B, Cartigny P, Assayag N (2017) A simple and reliable anion-exchange resin method for sulfate extraction and purification suitable for multiple O- and S-isotope measurements. Rapid Commun Mass Spectrom 31:137–144
Lewis ER, Schwartz SE (2004) Fundamentals. In: Sea salt aerosol production: mechanisms, methods, measurements and models
Lewicki MP, Lewicka-Szczebak D, Skrzypek G (2022) FRAME—Monte Carlo model for evaluation of the stable isotope mixing and fractionation. PlosONE 17(11):e0277204
Marchetti DW, Marchetti SB (2019) Stable isotope compositions of precipitation from Gunnison, Colorado 2007–2016: implications for the climatology of a high-elevation valley. Heliyon 5:e02120–e02120
Michalski G, Kasem M, Rech JA, Adieu S, Showers WS, Genna B, Thiemens M (2008) Uncertainties in the oxygen isotopic composition of barium sulfate induced by coprecipitation of nitrate. Rapid Commun Mass Spectrom 22:2971–2976
Migaszewski ZM, Gałuszka A (2019) The origin of pyrite mineralization: implications for Late Cambrian geology of the Holy Cross Mountains (south-central Poland). Sed Geol 390:45–61
Mizota C, Sasaki A (1996) Sulfur isotope composition of soils and fertilizers : differences between Northern and Southern Hemispheres. Geoderma 71:77–93
Nakano T, Tayasu I, Yamada Y, Hosono T, Igeta A, Hyodo F, Ando A, Saitoh Y, Tanaka T, Wada E, Yachi S (2008) Effect of agriculture on water quality of Lake Biwa tributaries, Japan. Sci Total Environ 389:132–148
Newman CP, Poulson SR, Mccrea KW (2020) Contaminant generation and transport from mine pit lake to perennial stream system: multidisciplinary investigations at the Big Ledge Mine, Nevada, USA. Geochemistry 80:125552
Nitzsche KN, Kalettka T, Premke K, Lischeid G, Gessler A, Kayler ZE (2017) Land-use and hydroperiod affect kettle hole sediment carbon and nitrogen biogeochemistry. Sci Total Environ 574:46–56
Nordstrom DK, Wright WG, Mast MA, Bove DJ, Rye RO (2007) Aqueous-sulfate stable isotopes—A study of mining-affected and undisturbed acidic drainage. In: U.S. Geological survey professional paper, vol 1651, pp 387–416
Ohwoghere-Asuma O, Aweto EK, Nwankwoala HO, Akpokodje EG (2021) Stable isotopic composition of precipitation in a tropical rainforest region of the Niger Delta, Nigeria. Isot Environ Health Stud 57:94–110
Oleinik SA, Ryskov YG, Morgun EG (2003) Fractionation of stable sulfur isotopes in hydromorphic saline soils and its role as an indicator of reducing processes. Geochem Int 41:1207–1213
Paulsson O, Widerlund A (2020) Pit lake oxygen and hydrogen isotopic composition in subarctic Sweden: a comparison to the local meteoric water line. Appl Geochem 118:104611
Peng H, Mayer B, Harris S, Krouse HR (2004) A 10-yr record of stable isotope ratios of hydrogen and oxygen in precipitation at Calgary, Alberta, Canada. Tellus B: Chem Phys Meteorol 56:147–159
Price RM, Skrzypek G, Grierson PF, Swart PK, Fourqurean JW (2012) The use of stable isotopes of oxygen and hydrogen to identify water sources in two hypersaline estuaries with different hydrologic regimes. Mar Freshw Res 63:952–966
Putman AL, Bowen GJ (2019) Technical note: a global database of the stable isotopic ratios of meteoric and terrestrial waters. Hydrol Earth Syst Sci 23:4389–4396
Rees CE, Jenkins WJ, Monster J (1978) The sulphur isotopic composition of ocean water sulphate. Geochim Cosmochim Acta 42:377–381
Rozanski K, Araguas-Araguas L, Gonfiantini R (1992) Relation between long-term trends of oxygen-18 isotope composition of precipitation and climate. Science 258:981–985
Rozanski K, Araguás-Araguás L, Gonfiantini R (1993) Isotopic patterns in modern global precipitation. Geophys Monogr-Am Geophys Union 78:1–1
Santucci L, Carol E, Tanjal C (2018) Industrial waste as a source of surface and groundwater pollution for more than half a century in a sector of the Río de la Plata coastal plain (Argentina). Chemosphere 206:727–735
Schmidt GA (1999) Forward modeling of carbonate proxy data from planktonic foraminifera using oxygen isotope tracers in a global ocean model. Paleoceanography 14:482–497
Schotterer U, Oldfield F, Froehlich K (1996) GNIP global network for isotopes in precipitation. Laederach AG, Switzerland
Schroth AW, Bostick BC, Graham M, Kaste JM, Mitchell MJ, Friedland AJ (2007) Sulfur species behavior in soil organic matter during decomposition. J Geophys Res: Biogeosci 112
Schroth MH, Kleikemper J, Bolliger C, Bernasconi SM, Zeyer J (2001) In situ assessment of microbial sulfate reduction in a petroleum-contaminated aquifer using push-pull tests and stable sulfur isotope analyses. J Contam Hydrol 51:179–195
Sharp Z (2017) Principles of stable isotope geochemistry, 2nd edn.
Skrzypek G (2013) Normalization procedures and reference material selection in stable HCNOS isotope analyses: an overview. Anal Bioanal Chem 405:2815–2823
Skrzypek G (2018) Water sampling and preservation for stable isotope analyses of water molecules and selected solutes In: Dercon G, Heng L, Heiling M (ed) Sampling and isotope analysis of agricultural pollutants in water. International Atomic Energy Agency, Vienna
Skrzypek G, Allison C, Böhlke JK, Bontempo L, Brewer P, Camin F, Carter JF, Chartrand MMG, Coplen TB, Gröning M, Hélie J-F, Esquivel-Hernández G, Kraft RA, Magdas DA, Mann JL, Meija J, Meijer HAJ, Moossen H, Ogrinc N, Perini M, Possolo A, Rogers K, Schimmelmann A, Shemesh A, Soto DX, Thomas F, Wielgosz R, Winchester MR, Yan Z, Dunn PJH (2022) Minimum requirements for publishing hydrogen, carbon, nitrogen, oxygen and sulfur stable-isotope delta results. Pure Appl Chem Aop. https://doi.org/10.1515/pac-2021-1108
Skrzypek G, Akagi T, Drzewicki W, Jȩdrysek MO (2008) Stable isotope studies of moss sulfur and sulfate from bog surface waters. Geochem J 42:481–492
Skrzypek G, Dogramaci S, Grierson PF (2013) Geochemical and hydrological processes controlling groundwater salinity of a large inland wetland of northwest Australia. Chem Geol 357:164–177
Skrzypek G, Dogramaci S, Page GFM, Rouillard A, Grierson PF (2019) Unique stable isotope signatures of large cyclonic events as a tracer of soil moisture dynamics in the semiarid subtropics. J Hydrol 578:124124
Skrzypek G, Dogramaci S, Rouillard A, Grierson PF (2016) Groundwater seepage controls salinity in a hydrologically terminal basin of semi-arid northwest Australia. J Hydrol 542:627–636
Skrzypek G, Dunn PJ (2020a) Absolute isotope ratios defining isotope scales used in isotope ratio mass spectrometers and optical isotope instruments. Rapid Commun Mass Spectrom e8890 (in press)
Skrzypek G, Dunn PJ (2020b) The recalculation of stable isotope expressions for HCNOS—EasyIsoCalculator. Rapid Commun Mass Spectrom e8892
Skrzypek G, Jezierski P, Szynkiewicz A (2010) Preservation of primary stable isotope signatures of peat-forming plants during early decomposition - observation along an altitudinal transect. Chem Geol 273:238–249
Skrzypek G, Mydłowski A, Dogramaci S, Hedley P, Gibson JJ, Grierson PF (2015) Estimation of evaporative loss based on the stable isotope composition of water using Hydrocalculator. J Hydrol 523:781–789
Skrzypek G, Sadler R (2011) A selection strategy for reference materials in stable oxygen isotope analyses of solid materials. Rapid Commun Mass Spectrom 25:1625–1630
Stack P, Rock L (2011) A δ34S isoscape of total sulphur in soils across Northern Ireland. Appl Geochem 26:1478–1487
Szynkiewicz A, Borrok DM, Ganjegunte GK, Skrzypek G, Ma L, Rearick MS, Perkins GB (2015a) Isotopic studies of the Upper and Middle Rio Grande. Part 2-Salt loads and human impacts in south New Mexico and west Texas. Chem Geol 411:336–350
Szynkiewicz A, Borrok DM, Skrzypek G, Rearick MS (2015b) Isotopic studies of the Upper and Middle Rio Grande. Part 1—Importance of sulfide weathering in the riverine sulfate budget. Chem Geol 411:323–335
Tanikawa T, Sase H, Fukushima S, Ito Y, Yamashita M, Yamashita N, Kamisako M, Sugiyama A, Imaya A, Ishida T, Takenaka C, Takahashi M (2022) Sulfur accumulation in soil in a forested watershed historically exposed to air pollution in central Japan. Geoderma 407
Taylor BE, Wheeler MC, Nordstrom DK (1984) Stable isotope geochemistry of acid mine drainage: experimental oxidation of pyrite. Geochim Cosmochim Acta 48:2669–2678
Tian C, Wang L (2019) Stable isotope variations of daily precipitation from 2014–2018 in the central United States. Sci Data 6:190018
Toran L (1987) Sulfate contamination in groundwater from a carbonate-hosted mine. J Contam Hydrol 2:1–29
Torssander P (1988) Sulfur isotope ratios of Icelandic lava incrustations and volcanic gases. J Volcanol Geoth Res 35:227–235
Torssander P (1989) Sulfur isotope ratios of Icelandic rocks. Contrib Miner Petrol 102:18–23
Torssander P, Mörth CM, Kumpulainen R (2006) Chemistry and sulfur isotope investigation of industrial wastewater contamination into groundwater aquifers, Piteå County, N. Sweden. J Geochem Explor 88:64–67
Trust BA, Fry B (1992) Stable sulphur isotopes in plants: a review. Plant, Cell Environ 15:1105–1110
Turchyn AV, Tipper ET, Galy A, Lo J-K, Bickle MJ (2013) Isotope evidence for secondary sulfide precipitation along the Marsyandi River, Nepal, Himalayas. Earth Planet Sci Lett 374:36–46
Urresti-Estala B, Vadillo-Pérez I, Jiménez-Gavilán P, Soler A, Sánchez-García D, Carrasco-Cantos F (2015) Application of stable isotopes (δ34S-SO4, δ18O-SO4, δ15N-NO3, δ18O-NO3) to determine natural background and contamination sources in the Guadalhorce River Basin (southern Spain). Sci Total Environ 506–507:46–57
Vet R, Artz RS, Carou S, Shaw M, Ro C-U, Aas W, Baker A, Bowersox VC, Dentener F, Galy-Lacaux C, Hou A, Pienaar JJ, Gillett R, Forti MC, Gromov S, Hara H, Khodzher T, Mahowald NM, Nickovic S, Rao PSP, Reid NW (2014) A global assessment of precipitation chemistry and deposition of sulfur, nitrogen, sea salt, base cations, organic acids, acidity and pH, and phosphorus. Atmos Environ 93:3–100
Vitòria L, Otero N, Soler A, Canals A (2004) Fertilizer characterization: Isotopic data (N, S, O, C, and Sr). Environ Sci Technol 38:3254–3262
Weyer KU, Krouse HR, Horwood WC (1979) Investigation of regional geohydrology south of Great Slave Lake, Canada, utilizing natural sulphur and hydrogen isotope variations. Isotope Hydrol 251–264 (International Atomic Energy Agency, Vienna)
Wu Y, Liu W, Xu Y, Xu Z, Zhou X, Zhou L (2021) Multiple isotopic tracing for sulfate and base cation sources of precipitation in Hangzhou city, Southeast China: insights for rainwater acidification mechanism. Environ Pollut 288:117770
Yapiyev V, Skrzypek G, Verhoef A, Macdonald D, Sagintayev Z (2020) Between boreal Siberia and arid Central Asia—Stable isotope hydrology and water budget of Burabay National Nature Park ecotone (Northern Kazakhstan). J Hydrol: Regional Stud 27:100644
Author information
Authors and Affiliations
Corresponding author
Editor information
Editors and Affiliations
Rights and permissions
The opinions expressed in this chapter are those of the author(s) and do not necessarily reflect the views of the IAEA: International Atomic Energy Agency, its Board of Directors, or the countries they represent.
Open Access This chapter is licensed under the terms of the Creative Commons Attribution 3.0 IGO license (http://creativecommons.org/licenses/by/3.0/igo/), which permits use, sharing, adaptation, distribution and reproduction in any medium or format, as long as you give appropriate credit to the IAEA: International Atomic Energy Agency, provide a link to the Creative Commons license and indicate if changes were made.
Any dispute related to the use of the works of the IAEA: International Atomic Energy Agency that cannot be settled amicably shall be submitted to arbitration pursuant to the UNCITRAL rules. The use of the IAEA: International Atomic Energy Agency's name for any purpose other than for attribution, and the use of the IAEA: International Atomic Energy Agency's logo, shall be subject to a separate written license agreement between the IAEA: International Atomic Energy Agency and the user and is not authorized as part of this CC-IGO license. Note that the link provided above includes additional terms and conditions of the license.
The images or other third party material in this chapter are included in the chapter's Creative Commons license, unless indicated otherwise in a credit line to the material. If material is not included in the chapter's Creative Commons license and your intended use is not permitted by statutory regulation or exceeds the permitted use, you will need to obtain permission directly from the copyright holder.
Copyright information
© 2024 IAEA: International Atomic Energy Agency
About this chapter

Cite this chapter
Skrzypek, G. (2024). Stable Sulfur and Oxygen Isotope Compositions of Sulfates to Disentangle Agrocontaminants from Other Sources of Sulfur in Agrosystems. In: Adu-Gyamfi, J., Skrzypek, G., Imfeld, G., Heng, L. (eds) Tracing the Sources and Fate of Contaminants in Agroecosystems . Springer, Cham. https://doi.org/10.1007/978-3-031-47265-7_6
Download citation
DOI: https://doi.org/10.1007/978-3-031-47265-7_6
Published:
Publisher Name: Springer, Cham
Print ISBN: 978-3-031-47264-0
Online ISBN: 978-3-031-47265-7
eBook Packages: Chemistry and Materials ScienceChemistry and Material Science (R0)