
Abstract
There are around 2,304 sand dunes scattered within seven dune fields in Kuwait. The longest barchanoid chain dune in Kuwait is 2400 m and 900 m. All the dunes in Kuwait were mapped, sampled, and analyzed. This chapter passes through dunes in Kuwait covering the following:
-
The dunes mapping.
-
The dune migrations using satellite images.
-
The chemical properties include
-
Mineralogical properties.
-
X-ray diffraction (major and minor trace elements).
-
Micro-inclusions within Aeolian particles.
-
-
The physical properties include
-
The particle size analysis.
-
Statistical properties.
-
Particle micro-features.
-
BET surface area.
-
Perimeter and diameter.
-
This chapter covers all aspects regarding sand dunes in Kuwait; therefore, this chapter will be a key reference for future studies tackling aeolian landforms in Kuwait and regional areas.
You have full access to this open access chapter, Download chapter PDF
3.1 Introduction
Desert sand seas, or ergs, are contained beyond 95% of the world’s aeolian sand. Of this 85% is contained in sand seas with an area exceeding 32,000 km2 (Wilson, 1973). Most areas of sand sea accumulation lie in the old-world deserts such as the Sahara, Arabia, Central Asia, Australia, and South Africa, the sea cover is often less than 45% of the area’s surface ranging between 20 and 45% that is classified as arid (Lancaster, 1989). Mobile sand is a common phenomenon in desert areas, and it can pose a threat to various urban and industrial activities. In Kuwait, it can affect various activities such as agriculture, urban development, and communication. Mobile sand and dust transported by wind, and the corresponding problems and impact on the environment, are very important.
Kuwait constitutes part of the northwestern coastal plain of the Arabian Gulf. It covers an area of about 17,818 km2 spreading between 46° 33′ and 48° 36′ E, and latitudes 28° 30′ N and 30° 05′N. On the north and west, the state of Kuwait is bounded by Iraq, while on the southwest and south it is bordered by Saudi Arabia. The state has some offshore islands, the largest of which are Bubiyan, Failaka, and Warba. Only Failaka Island is inhabited.
The geological, environmental, and geographical characteristics of Kuwait and its surrounding areas contribute to the dynamism and occurrence of the migrating sand belt.
Sand and dust storms are common in Kuwait. Windblown sand forms one of the chief difficulties in the future development of Kuwait. The mobile sands and dust threaten the main roads, encroach cultivated lands and several inland areas. Scientific studies were conducted on the various types of sand deposits and the locations of the sediments in the Al-Huwaimiliyah and Al-Atraf areas (Khalaf et al., 1980; Abu-Eid et al., 1983). Some of the key findings of these studies are that the development activities in these areas are prone to severe impacts due to the migration of sand. They also suggest that the use of mobile sand belts should be established to help in the land-use planning in these regions.
Khalaf et al. (1980) identified four types of aeolian accumulation in Kuwait. These include sand sheets, aeolian wadi fill deposits, sand dunes, and sand drifts and surface sediment maps of Kuwait were produced.
There is a lack of information concerning the characteristics of the mobile surface sediments in Kuwait usually and in the study area particularly. This study focuses on a comprehensive examination of the morphology, dynamics, and sedimentology of numerous categories of free dunes (barchan, domal, barchanoid, and barchan complex), in addition to anchored dunes such as nabkhas and falling dunes. A sand dune belt dominates in northwest Kuwait. Also, a detailed dunes map has been developed using remote sensing to detect sand dunes within the Al-Huwaimiliyah–An-Nimritayn zone.
An assessment of baseline data and information about the main environmental conditions in the desert of Kuwait was an essential prerequisite for the implementation of this study. The following is a brief review of the most relevant literature that provided such data and information.
Fuchs et al. (1968) conducted a comprehensive geological study of the surface and near-surface formations in Kuwait. They prepared a surface geologic map with a scale of 1: 250,000. In 1981, the Kuwait Oil Company surveyed the surface geology of Kuwait and created a detailed geological map at a scale of 1: 50,000 (Warsi, 1990).
A comprehensive study was conducted by Khalaf et al. (1984) on the various geological formations in Kuwait. He produced a sedimentomorphic map showing the distribution and type of recent surface sediments and redeveloped by Misak (2000). A detailed geomorphological zonation of Kuwait’s terrain was carried out by Al-Bakri (1988a, b). All these studies include the study area of this project.
Aeolian landforms have been widely discussed (Hunter, 1977; Howard et al, 1978; Chaudhri & Khan, 1981; Paisley et al., 1991; Nickling & Wolfe, 1994; Ramakrishna et al., 1994; Anthonsen et al, 1996; Neuman et al, 1997; Bullard et al, 1997; Blumberg, 1998).
Dune morphology and control lay factors were first mentioned by Beadnell (1910). This was followed by numerous subsequent discussions Folk (1971), Bowler (1973), Breed et al., (1979a, b, 1979b), Nielson et al., (1982), Tsoar (1983a, b, 1986), Greeley and Iversen (1985), Thomas (1986, 1988a, b, c, 1989), El-Baz (1986), Cooke et al., (1993). The genesis of the barchan dunes has been described by Bagnold (1941).
Sand dunes and other aeolian landforms in Kuwait were discussed by Abu-Eid et al. (1983) and many later investigators Foda et al., (1984), Vincent and Lancaster (1985), Khalaf (1989), Gharib et al., (1985), Khalaf et al, (1995), Misak et al., (1996), Abdullah, (1988), Nayfeh (1990). In Kuwait, the dunes can be found as isolated, sporadically distributed, or clustered in the form of dune belts (Khalaf et al, 1984). Al-Dousari (1998) delineates six belts of barchan sand dunes extending NW–SE direction in the northwestern part of Kuwait.
At a wider regional scale, aeolian sediments and landforms within Iraq and Arabia also have been discussed widely. Several workers (Dougrameji, 1984; Skocek & Saadallah, 1972) discussed the dunes of southern Iraq. They found a close similarity in mineralogy and textural characteristics between the southern Iraq dune sediments and the Mesopotamian flood plain.
The southern Mesopotamian flood plain is frequently hit by dust storms in the Middle East. It is regarded as one of the main sources of dust in the world (Khalaf & Al-Ajmi, 1993). The textural characteristics of aeolian sediments and landforms in eastern Saudi Arabia have attracted the interest of many investigators (Al-Saud, 1986; Fryberger et al., 1984; Shehata et al., 1992). The application of different fixation methods was widely used on dunes and mobile sand in the eastern desert of Arabia (Abolkhair, 1986; Watson, 1990). The study of the sand dunes has been discussed by Embabi and Ashour (1993), and Al-Sheeb (1998) in Qatar, and Goudie et al. (2001), El-Sayed (1999) in the United Arab Emirates.
Most dune types can be accommodated in an extended morphological categorization of dunes, following Pye and Tsoar (1990). Misak et al. (1996) classify the dunes into three main categories, namely, free or mobile, anchored and stabilized dunes.
Al-Dabi et al. (1997) analyzed the distribution and quantity of free dunes in Kuwait. They found that the increase in the number of free dunes occurred from 1989 to 1992. The Gulf War’s disruption of Kuwait’s environmental desert surface contributed to the development of these dunes. They noticed that with the same wind velocity during the past three decades, the rate of dune formation suddenly increased from 31 dunes per year for the pre-war images (1985–1989) to 321 dunes per year for after-war images (1992–1994).
Barchan sand dunes are the prevailing form in the study zone. Individual dunes and groups of barchans cover more than 80% of some dune belt areas (Al-Dousari, 1998). The barchan dunes appear primarily close to their source in the peripheral zones of the sand sea, especially downwind, away from the advancing tips of linear dunes in Al-Najaf sand sea in Iraq. These barchan dunes extend from Al-Najaf downwind to the Al-Atraf area in Kuwait.
There are four major conditions for the formation of barchan dunes. They are.
-
i.
sufficient continuous source of sand;
-
ii.
dominant, unidirectional wind;
-
iii.
relatively flat, hard surfaces, such as desert pavement; and
-
iv.
sand trapping obstacles such as vegetation or abrupt changes in microtopography.
The conditions listed above were subjected to various conditions that were conducive to the formation of sand dunes. However, the initiation of sand dunes is still considered a poorly understood process in the aeolian process. According to Khalaf and Al-Ajmi (1993), the sand dunes in Kuwait can be formed by the accumulation of flat patches of sand around 80–100 m2 of sand on an area measuring less than 30 cm high. These sand patches grow into mounds and continue growing to form barchan dunes. Bagnold (1941) and Mainguet (1984) asserted that pre-barchanic dunes are transformed over time into crescentic dunes. Al-Dousari (1998) mentioned that Landsat TM images using bands 2, 5, and 7 differentiate between thick and thin mobile sand sheets. He noticed that the thick mobile sands are usually formed around the dunes, while thin sand sheets are mainly initiated downwind directly at the end of the mobile sand dunes in the Al-Atraf area as a continuation of the wind corridor. This strongly suggests that the sand dunes are one of the major sources of sand sheets in Kuwait.
Philip (1968), Skocek and Saadallah (1972) found a close similarity between the mineralogical and chemical composition of sand dunes in Iraq and the Mesopotamian flood plain deposits. Omar et al. (1989) mentioned that the barchan sand dunes in the northwest of Kuwait have nearly the same mineralogical composition as the upwind dunes in Iraq.
The average annual amount of sand drift in Kuwait is calculated by Al-Awadhi and Cermak (1995) as 99.596 kg/(m.yr). The highest average net flux amount of sand transport is 18.620 kg/(m.mo) in June, while the lowest is 592 kg/(m.mo) in December, but the sand drift attains a maximum during summertime (Al-Awadhi & Cermak, 1995).
3.2 Materials and Methods
The aeolian deposits have been traced using remote sensing (satellite images or aerial photographs) and fieldwork.
A total of 1684 samples were collected from the top 5 cm of the surface in the seven major fields of dunes in Kuwait. A global positioning system was used to determine the random sample locations. The number of samples collected varied from one dune field to another depending on the field size (Table 3.1).
The sampling sites were randomly collected within the wind corridor from the top surface sediments of sand dunes of different forms in Kuwait. Samples cover all types of dunes (barchans, dome, nabkha, and falling). At each chosen site samples were collected from an undisturbed surface at a location that appeared to be representative of the aeolian surface sediments at each site location.
A global positioning system was used to determine the specimen locations (GPS). The crest, the slip face, the horn, the windward, and the middle area between the crest and the windward were all sampled separately from the dune surfaces.
3.3 Dunes Migration
-
Satellite Imagery
The level-3A RapidEye and PlanetScope images from the Planet Labs Inc (https://www.planet.com) acquired on different dates (Table 3.2) were used to detect the yearly rate of dune migration in Kuwait. The Level-3A images were geometrically and radiometrically calibrated by the Planet Labs. The RapidEye satellite imagery consists of five spectral bands ranging from 440 to 850 nm at a spatial resolution of 5 m (https://www.satimagingcorp.com), whereas the PlanetScope satellite imagery consists of four spectral bands ranging from 455 to 860 nm at a spatial resolution of 3 m (https://www.planet.com).
-
Dune Delineation
Dunes were identified and delineated using ArcMap 10.6 based on a visual interpretation that incorporates linear and non-linear image contrast techniques (e.g., standard deviations, histogram equalization, and minimum–maximum stretch) (Jensen, 2015). A random sample of dunes was selected from five areas in Kuwait, i.e., Atraf, Buhaith, Huwaimliyah, Kabd, and Um Urta (Fig. 3.1). The selected dunes were varied in size and separated from other adjacent dunes. To estimate the dunes’ migration, the selected dunes were observed two times over 4 years or longer. This period was selected to ensure that the magnitude of dune displacement was sufficient to be detected. The area and centroid of delineated dunes of the two times were calculated and saved in a shapefile.

Dune zones in Kuwait. Dunes are widely distributed in Huwaimliyah, Um Urta, and Atraf compared to the other areas
-
Dune Migration
The dune migration analysis was conducted using the R programming language. The dune shapefile was imported to RStudio, and its attribute table was stored as a data-frame object. The total dune displacement was calculated by determining the distance from the dune’s centroid in time-1 to the dune’s centroid in time-2 using Eq. (3.1):
where \(d\) is total dune displacement, \({x}_{t1}\) and \({y}_{t1}\) represent the dune position in the time-1, and \({x}_{t2}\) and \({y}_{t2}\) represent the dune position in the time-2.
The dune migration yearly rate was then estimated by dividing \(d\) by the time difference in years from time-1 to time-2. Furthermore, the direction of dune migration in radians was calculated using the two-dimensional arctangent function available in R. These radian values were converted to degrees for the statistical analysis.
The dune displacement and its direction were statistically summarized. Descriptive statistics of these values within each area were also conducted to investigate the differences in dune migration in these areas. Dune migration differences in northwestern areas (i.e., Huwaimliyah, Um Urta, and Atraf) were investigated using one-way ANOVA analysis. The other areas were excluded due to some limitations in number of dune samples in these areas.
3.4 The Volume of the Dunes and Single Dune Sampling
The volume of the dunes was measured using two formulae:
-
Barchan and domal dune volume = 4/3 * 3.14 * (Length * width * height).
-
Falling dune volume = 1/6 * (Length * width * height).
A good estimation for the volume of all the dune fields was achieved using these equations.
Three different single dunes at three different locations were sampled to see the statistical variations within the same dunes.
Careful sampling, analysis, and data interpretation are essential to ensure those good management decisions are possible. Along with the quality of sampling, a sufficient sampling number of samples must be taken. In this study, the sample sites were chosen, randomly distributed areas all different kinds of mobile surface sediments. The collected samples were taken from the top 3 cm of both mobile and anchored surface sediments in all cases. The collected samples have been subjected to several types of laboratory analysis. The laboratory work is represented by trace and major elements (ICP, XRF), carbonate content, mineralogical surface area, and quartz morphometry analysis.
A total of 26 different micro-features were identified by the Scanning Electron Microscope (SEM). The chosen method used to describe the analysis features of the surface is considered as the finest technique due to the contributions of Krinsley and Doornkamp (1973), Bull (1981), Culver et al. (1983). The tabulation of the surface features on the quartz particles using percentages, numbers, or other statistical methods was also useful in distinguishing different samples. The roundness scale was also measured using a visual scale developed from Powers (1953) (Table 3.3 and Fig. 3.2).

Modified particle shape visual comparator scheme of Powers (1953), showing numerical indices and associated descriptive terminology
Three different sets of aeolian samples along the main wind corridor were collected from upwind to downwind and one extra set was collected from the Dibdibba Formation for comparison (Fig. 3.1). With special care, samples were impregnated with epoxy, cut, and polished. The initial three set samples were gathered from upwind zones around Huwamiliyah area. One set of three samples D1, D4, and D9 represents the Dibdiba Formation. D1 is made up of fine sand particles (0.250 mm–0.180 mm), whereas the rest of the samples, whether from the Dibdiba Formation or aeolian sediments, are made up of medium sand fractions (0.5 mm–0.350 mm), which are the most prevailing size fractions. Samples preparation included the split and mix of both size fractions and placed in a resin block producing polished surface. Several grades of diamond abrasive are used in the grinding and polishing process of aeolian sediment samples.
The samples were examined using a Hitachi 3000 variable pressure SEM equipped with BSE deflectors. The microscope can be used in a variety of ways, including
-
a.
provide illustration in BSE or SEM mode of the sample;
-
b.
using the EDX attachment, to analyze spots, areas, or line cross sections;
-
c.
determine the map element distributions.
An intensive study was performed on various features within detected inclusions in quartz, feldspar, and other particles. The identification of some mineral species was challenging since there are also polymorphs that have similar chemical composition but have different structures. There are seven known polymorphs of titanium dioxide TiO2 with the same chemical composition, but with different structures (e.g., rutile, anatase, and brookite). This makes it difficult to identify them using the crystals they are made from. For instance, rutile may have long hair-like needles, while other forms may have euhedral lath-like structures.
3.5 Results
Al-Dousari et al. (2008) identified and investigated six dune fields in Kuwait, namely, (Fig. 3.1).
-
Al-Huwaimiliyah–Al-Atraf zone area (Fig. 3.3).
Fig. 3.3 
Location map for sampled dunes in Huwaimiliyah–Al-Atraf zone area
-
Um Niqa (NE Kuwait) (Fig. 3.4).
Fig. 3.4 
Location map for sampled dunes in Um Niqa/Bhaith (left) and Um Eish
-
Falling dunes in Jal Al-Zur and Ras Sabiyah.
-
Um Eish sand dunes (Fig. 3.4).
-
Kabd sand dunes (Fig. 3.5).
Fig. 3.5 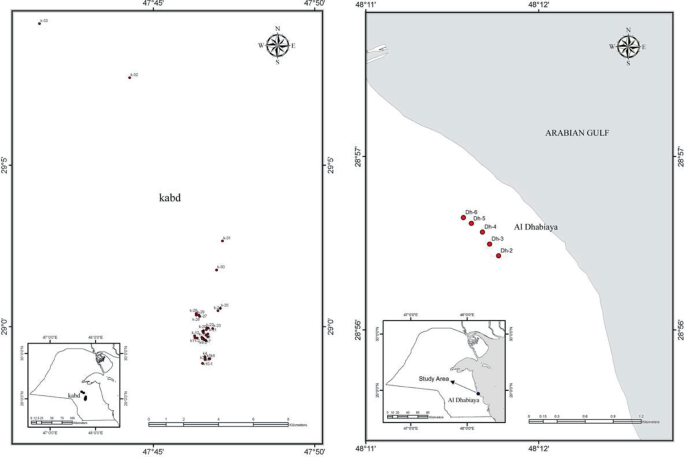
Location map for sampled dunes in Kabd (left) and Dhubaiyah
-
Dhubaiya coastal dunes (Fig. 3.5).


There are six major types of dunes (Fig. 3.6) in the dune fields, namely,

Pictures illustrating the types of studied dunes, barchan dunes (a), falling dunes (b), climbing dune (c), and nabkha (d)
-
Barchan or crescentic dunes.
-
Domal dunes.
-
Falling dunes.
-
Climbing dunes.
-
Barachanoid dunes.
-
Nabkha dunes.
Most of the dunes in Kuwait are in the Huwaimiliyah (2026 dunes) and Jal Al-Zur (190 dunes) fields. About 36% of the dunes are barchans while only 10% are domal dunes in the Huwaimiliyah. The total volume of dunes in Kuwait is about 93,379,916 m3 up to date. This volume is renewable, as the aeolian mobile sand is renewable especially in the summertime.
The longest barchanoid chain dune in Kuwait is with 2400 m and 900 m in Huwaimiliyah and Um Urta areas, respectively, shown in Fig. 3.7. Abu-Eid et al. (1983) showed dunes mapping used as a reference for our study that was collected in 1979 with a scale of 1:10,000 shown in Fig. 3.8. Dunes mapping during this study in the upwind area of the Huwaimiliyah-Atraf zone area is visible in Figs. 3.9, 3.10, and 3.11.

Sampling locations of sand dunes in Kuwait and the Dibdiba Formation

Dunes mapping in reference to aerial photos 1979 (Abu-Eid et al., 1983)

Dunes mapping during this study in the upwind area of the Huwaimiliyah-Atraf zone area

Dunes mapping in the mid-area of the Huwaimiliyah-Atraf zone area

Dunes mapping in downwind area of the Huwaimiliyah-Atraf zone area
3.6 Dunes Migration
There are around 2304 sand dunes in Kuwait, all were sampled in this study. A sample of 35 dunes from five areas (i.e., Atraf, Buhaith, Huwaimiliyah, Kabd, Um Urta) were investigated. Um Al-Aish dunes were not investigated because we could not find a clear site for them in the satellite images. The sample dunes varied in the area from about 2,300 m2–40,000 m2 (Table 3.4). The dune migration yearly rate ranged from 2 m in Buhaith area to 24 m in Um Urta area with an overall mean of about 14 m (Table 3.5) and (Fig. 3.12). The dunes were generally migrated toward the southeast enforced by the northwestern wind (the permanent wind). The dune migration direction, however, varied from 121° to 142° with a mean of 129° (Fig. 13a). We found one exception in Buhaith area: a dune displaced to the east (87°) by 2 m yr−1. The dune was the largest in the sample with an area of about 40,000 m2. Generally, the dune migration rate had a negative correlation with the dune area (r = −0.81).

The dune migration rate of two dunes in Huwaimiliyah. The dunes were different in size, migration rate, and direction

a Rose diagram shows the migration direction and yearly rate. Most of the dunes (60%) were migrated to the southeast direction between 125° and 142°. b The distribution of dunes migration yearly rate. Colored dots show the variation of dune migration yearly rates within the dune areas
The dune migration rate in Buhaith area was different compared to the other areas (Fig. 3.13b). The dune migration in the northwestern areas exhibited some differences (Fig. 3.13). Um Urta and Atraf had the widest range of dune migration, whereas Huwaimiliyah dune migration rate had relatively a narrow range. This difference in dune migration rate among the three areas was significant (F = 4.15 and P-value = 0.008). The dune migration yearly rate significantly varied in northwestern areas in which Huwaimiliyah area had the narrowest range of dune migration yearly rate (Fig. 3.14).

The dune migration yearly rate significant variation in northwestern areas
3.6.1 Dunes Granulometric Characteristics
Most barchans in the region that extends from the Najaf Sand Sea toward Kuwait appear as isolated, occasionally dispersed in clusters or groups forming dune belts. The statistical parameters that were used to determine the barchan dune body’s characteristics varied from one area to another. For instance, the mean particle size decreased from the upwind to the downwind edge, and the finest sand arising from the middle of the slip face. A significant variation in the border and mid-dune was present only in very fine sand with a p-value of 0.047. When relating particle samples in the upwind of the barchan and climbing dune, all particle size classes presented significant variations except for the very coarse class (p-value = 0.44). Contrary to that, the particle sizes of the downwind barchans and falling dunes were remarkably different. For instance, sorting develops and improves in the direction of the border of the dune, while the horns and the mid of the dunes were poorly sorted compared to other sites. The difference in the sizes of the various particles in the two areas was also significant (Table 3.6). The average particle size demonstrates even and uniform dispersal with increased percentages of the medium, fine, and coarse sand size fractions, respectively. The upwind samples comprehend the largest percentages of coarse sand (68%) compared to mid and other dunes.
Kurtosis differs relatively with a vast range from 0.83 (platykurtic) to 1.6 (very leptokurtic) with an average of 1.12 (leptokurtic). The presence of several small populations on the crest could explain the decrease in particle sizes found in border samples. The limited mixing of numerous particle size populations on the crest might be the indication for the decrease in the samples from the borders than those from the crest.
Statistical parameters of the studied dunes are variable regionally. The mean size diameter of dune sediments in the Mesopotamian Flood Plain is finer than other dunes on a regional scale. The dune sediments in Kuwait are coarser than the surrounding dunes in Iraq and Saudi, Qatar, and Emirates (Table 3.7). The mean grain size shows extensive differences shifting between 1.3ϕ and 3.1ϕ (Tables 3.8 and 3.9). The barchans in Kuwait demonstrate a greater mean particle size, enhanced sorting, and more leptokurtic but similar skewness related to those upwind in Iraq and downwind in Saudi Arabia (Table 3.10). The location of Iraq’s dunes near the Mesopotamian flood plain is known to have contributed to the higher levels of fine sediments found in these areas (Fig. 3.15). Also, climbing dunes and sabkhas contain much coarser sediments than comparable studies. Due to the limited literature on falling dunes, the available content on this matter was correlated with the size of the large linear dunes. According to the findings, the falling dunes had a greater mean grain size, better sorting, but similar skewness.

Particle size distribution histograms from upwind in Iraq to downwind in Kuwait (V.C.S, C.S. M.S., F.S., V.F.S.: very coarse, coarse, medium, fine, and very fine sand, respectively, S: silt)
The textural features of different types of dunes in the same field global aspect were studied by Al-Dousari and Pye (2005). Considering the time factor, the statistical parameters of sediments across the dune fields in the study area were limited.
The results of the study showed that the skewness had negative effects on the overall dunes characteristics with fewer coarse particles among dunes with a tendency for coursing toward the dune margins. It made them more prone to settling toward the margins (Table 3.11). The values range between −0.17 and 0.40 with an average of 0.14 (positively skewed). Skewness values of margins samples showed no significant variation compared to the samples from the crest of the same dune (Fig. 3.16).

Statistical parameters with sampling sites for barchan dune surface sediments in Um Urta
3.7 Mineralogy
The mineral semi-quantitative percentages show lower quartz in upwind dunes in Iraq and the Mesopotamian Flood Plain. The highest purity quartz is present in two main areas: northwestern Arabia and Kuwait (Table 3.12).
3.8 XRF Results
The XRF percentages show a lower concentration of silica in Dhubaiyah (56%) and Huwaimiliyah (82%), but Dhubaiyah dunes contain the highest amount of calcium oxides (39.2%) in comparison to all dune fields in Kuwait (Table 3.13). On the other hand, the RHUL results show percentage similar values to those of KISR before calibration (Table 3.12). The KISR results have been achieved with calibration, and are, therefore, more authentic.
Major oxide analyses of the bulk sand samples taken from the study area of aeolian sediments revealed the chemical interrelationships between the various components of the sand. The chemical differences between aeolian sands in the study area and Al-Dibdibba Formation sand are supported by mineralogical and ICP analyses result which show that the relative abundance of quartz and feldspar differs slightly between these two sand populations. The Al-Dibdibba Formation and Mesopotamian flood plain sand have been subjected to more extensive physical and chemical weathering. The major oxide values coincide the trace element results, which clearly differentiated the three sand populations. In addition, the close similarities in plot diagrams between the aeolian sediments of the research area and the Al-Dibdibba Formation sediments are well observed.
Differences between coarse and medium sand in terms of the concentration of major oxides are very limited. The aeolian sediments are characterized by high concentrations of SiO2 (range from 86 to 97%) in both dominant size fractions. The high silica percentages reflect the high quartz proportion.
Although the major oxide results show close percentages between sediments from various regions, bivariate plots revealed clear distinctions. These results show that the aeolian sands in the study area are chemically related to the Al-Dibdibba Formation sand. Table 3.14 shows a very close interrelationship between Al2O3 and both K2O and Fe2O3 indicating that the Al oxides are mostly associated with K-bearing minerals, principally K-feldspar. The aeolian sediments show slightly lower percentages of most of the major elements in comparison to the Al-Dibdibba sediments. The division evident in the SiO2 is also reflected in the variation of Al2O3 abundance. The high abundance of Al2O3 in the Al-Dibdibba sediments probably reflects an increased relative abundance of feldspar in these samples, indicating that they are less mature than the aeolian transported sands. Prolonged wind abrasion can reduce sand-sized K-feldspar and Fe-bearing minerals to silt sizes, causing silt is deflated away, and quartz-rich residue to form. The point counting results of coarse sand using binocular microscopy show that the average feldspar content is 2.37% in the total minerals of aeolian sand.
3.9 Micro-inclusions in Dunes Particles
Studying the physical and chemical properties of inclusions within aeolian particles is essential to use these properties as a fingerprint to compare them with global and regional sediments (Al-Dousari et al., 2020). Back-scattered electron microscopy was applied to examine the inclusions in 12 different samples from dunes (recent) and the Dibdiba Formation (Miocene to Pleistocene) sediments (Table 3.15). Samples were collected from a line across the main wind corridor. The samples were analyzed using the electron microscopes to determine the presence of various elements within the deposits. The 12 aeolian samples were gathered from a line transect across the main wind corridor, representing the downwind, mid, and upwind areas (three in each set). All examined samples are observed in the major elements within minerals. Iron, aluminum, calcium, and zirconium, respectively, were the highly dominant elements found in the aeolian samples. Some variation was observed in the inclusion counts of various materials in the samples. For instance, in the downwind samples, the lower counts were observed in quartz and feldspars, while the aluminum percentages gradually increased upwind. The samples in the mid-area exhibited the presence of more sodium than in the downwind and upwind zones. The average percentages of barium found within the particles of quartz and feldspar indicate that the conditions in the samples have gradually increased downwind. The consistency across the various elements in the samples from the Dibdiba Formation suggests that there is a strong relationship between the various elements.
The variations in the properties of the various elements found in the samples from the Dibdiba Formation are very limited. For instance, titanium is mainly produced through the natural solubility of smectite in cracks, fractures, and borders of quartz particles to form rutile (TiO2) with needle-like or lath-like crystals. Although there were no further changes observed in the barium inclusions in quartz samples when compared with both the Dibdiba Formation (4.7%) and the aeolian (4.8%) samples. Other elements within the samples revealed a similar trend of resemblance. Different forms of titanium minerals were found in which (a) signify single particle with variations in brightness (Fig. 3.17). Aeolian particle enclosing heavy minerals inclusions (a) Smectite, inclusion made of iron, silica, titanium, and minor aluminum (Fig. 3.18).

Titanium minerals in various forms, where a represents a single particle with varying brightness. The first is anatase, which is composed of titanium, iron, silica, and minor manganese (1), and the darker tone contains more iron than titanium without manganese (2), b veins of silica, calcium, titanium, and aluminum (ilmenite) within quartz particle, c lath-like crystals of anatase (1) composed of titanium and silica with minor aluminum within quartz particle (2), d rutile (1) formed in the border of quartz particle due to alteration from smectite (2), e albite particle (1) contains ilmenite (2) and epidote (3) inclusions, and f euhedral crystals within quartz particle in sample D9 at Dibdiba formation

Aeolian particle with enclosing heavy minerals inclusions a Smectite (1), bright inclusion composed of iron and silica (2) engulfing a sphene (3), b a matrix composed of iron, silica, titanium, and minor aluminum (1) containing variety of inclusions, silica, calcium, zircon, and titanium (2), pyroxene (3) and hornblende with altered titanium (4), c zircon (1) inserted around a cavity coated by silica, magnesium, and iron (2), d biotite mica as large inclusion within a quartz particle e hypersthene inclusion (1) containing small inclusion composed of silica, molybdenum, iron, calcium, and barium, f a feldspar particle full of inclusions of garnet minerals (almandite)
3.10 Mechanical Micro-textures (Micro-features)
Mechanical micro-features are mainly mainly composed of various types of pits, such as crescentic pits, rounded pits, coalescing pits, V-shaped pits, dish-shaped depressions, curved sutures, straight sutures, grooves, upturned plates, meandering ridges, stepped cleavage planes, striations, and conchoidal fractures.
Most quartz grains have a dotted surface due to particle-to-particle coalescence caused by saltation. The most prominent features on the surfaces of the quartz particles were discovered to be V-shaped pits and dish-shaped depressions (Fig. 3.19a). The size of the rounded and V-shaped pits ranges from 5 to 50 m. When quartz particles are exposed on the surface, they are subjected to weathering and abrasion during transportation. As a result, the surface of the chemically smoothed particles is dominated by crescentic, rounded, and V-shaped pits. Weathering causes adhering particles on the surface of quartz particles as well as dissolution and precipitation. Additionally, grooves and etchings were revealed on the surface of some particles (Fig. 3.19b). Some of the quartz particles had extensive fracturing, abrasion, and weathering (Fig. 3.19c). Some of the particles exhibited a smooth surface texture. However, some of them showed a variety of unusual features, such as Sutures and grooves that appeared mostly without any regularity in orientation. The angular quartz particles are also known to have multiple micro-features, such as sutures, cracks, and fractures either linear or conchoidal. Due to the dominance of other micro-features such as dish-shaped depressions and mechanical pits, they are suppressed in visual observation (Fig. 3.19d). Upturned plates were discovered to be abundant on the majority of the particles. Adhering particles were rare and uncommon on most of the majority of quartz particles, but the rounded quartz particles with smooth surfaces had none or very few particles compared with angular particles rich in micro-features. It is concluded that some quartz particles had a longer paleoenvironmental history than other quartz particles. It is worth noting that the pits, which were either V-shaped or crescentic and rounded, covered the majority of the particles and other surface micro-features, indicating that they were younger than other surface micro-features.

Quartz sand particles shown in scanning electron micrographs (SEM). a Well-rounded smoothed quartz particle with mechanical V-shaped, rounded, and crescentic pits and dish-shaped depressions. b Deep chemical pitting in a quartz particle. c An angular particle with a large number of mature conchoidal fractures. d Medium outline relief particle with a variety of micro-features such as meandering ridges (1), upturned plates (2), capping layers (3), conchoidal fractures (4), and adhering particles (5). e Extensive grooves, cracks, and chemically etched V-forms. f Generalized etching arrangement, solution disintegration, V-shaped sutures (1), and weathered feldspar-inclusion (2)
In terms of the relative effect of weathering and transport of the individual minerals, the quartz/feldspar ratio is a good indicator of the general maturity of sediments (Zimbelman & Williams, 2002).
3.11 Chemical Micro-textures
The only abundant chemical micro-feature found in the studied samples was irregular solution and silica precipitation. Other micro-features discovered to occur to a limited extent include silica plastering, deep surface solution, oriented V-shaped pits, disintegration by solution, and large-scale decomposition. Chemical surface features were discovered to be sporadic in distribution and varied in extent from particle to particle. Deep grooves were discovered, sometimes deeply etched, and were frequently overlapping by mechanical features such as conchoidal fractures and deep triangular pits (Fig. 3.19e). The surface of some quartz particles has a frosted appearance with large depressions. Deep grooving and etching occur more frequently in sutures, pits, or around corners of quartz particles (Fig. 3.19f).
3.12 Upwind and Downwind Variations
In general, upwind particles in Huwaimiliyah have more mechanical and chemical properties than southeastern particles (downwind). This could imply that the coarse quartz particles are primarily derived from local sources (Fig. 3.19a). The dominant elements in the upwind samples are upturned plates, dish-shaped depressions, V-shaped pits, and rounded and crescentic pits, while the dominant features in the downwind samples are upturned plates, irregular solution precipitation, rounded and crescentic pits, and V-shaped pits. Dish-shaped depressions were much less common in downwind samples than in upwind samples (Table 3.16).
3.13 Particle Area, Perimeter, and BET Surface Area
BET surface area varied in range from 1 m2g−1 to 47 m2g−1. The closer the samples to the Mesopotamian flood Plain, the higher the BET surface area (Fig. 3.20). This can be attributed to the high content of mud size fractions, carbonates, and heavy minerals compared to samples in Arabia and Kuwait that contain more quartz.

BET surface area from upwind to downwind in the study area shows the high surface area in dunes within the Mesopotamian Flood Plain
The particle area and perimeter measurements of aeolian sediments (upwind and downwind) in Kuwait and the underneath or surrounding geological formation (Dibdiba Formation) indicate close similarities between the upwind and downwind. Using these values, the similarities are also observed when comparing the aeolian sediments and the Dibdiba Formation samples. The mean area and perimeter values of aeolian samples are slightly higher than the Dibdiba Formation samples. Also, upwind samples were slightly higher in the mean perimeter values than downwind samples, but the values overlap by one standard deviation (Fig. 3.21).

Area (a) versus perimeter diagrams for upwind and downwind samples
3.14 Conclusions
There are around 2304 sand dunes in Kuwait; all were sampled in this study. The sum up conclusion of this study is as follows:
-
The total volume of dunes up to date is about 93,379,916 m3.
-
Bhaith dunes contain along with Um Eish and Jal Zur, the purest silica content in Kuwait.
-
Dhubaiyah and Huwaimiliyah dunes contain the lowest silica content.
-
Generally, the aeolian sand dunes in Kuwait contain low percentages of silica (about 84% on average) that can be of economic value for glass manufacturing.
-
Most of the dunes are in the Huwaimiliyah field.
-
The significant sand dune dynamics and migration rates varied from 121° to 142o except in Buhaith area: a dune displaced to the east (87°) by 2 m yr−1.
-
Dune migration rate had a negative correlation with the dune area (r = −0.81).
References
Abdullah, J. (1988). Study of control measures of mobile barchan dunes in the Umm Al-Eish and west Jahra areas. Kuwait Institute for Scientific Research, KISR 2580, Kuwait.
Abolkhair, Y. M. S. (1986). The statistical analysis of the sand grain size distribution of Al-Ubay-lah barchan dunes, Northwestern Ar-Rub-Alkhali desert. Saudi Arabia. Geo Journal, 13, 103–109. https://doi.org/10.1007/BF00212712.
Abu-Eid, R., El-Sayed, M., Salman, A. S. (1983). Field and laboratory investigation of sand dune deposits in north-east and north-west of Kuwait. Kuwait Institute for Scientific Research, Kuwait.
Al-Awadhi, J., & Cermak, E. (1995). Application of Mathematical Modelling of Sand Transport to Kuwait Environment. Kuwait Journal of Science, 22, 183–197.
Al-Bakri, D., Kittaneh, W., & Shublaq, W. (1988a). Sedimentological characteristics of the surficial deposits of the Jal Az-Zor area. Kuwait, Sedimentary Geology, 59, 295–306.
Al-Bakri, D., Rejehrt, M., Al-Sulaimi, J., & Kittaneh W. (1988b). Assessment of the sand and gravel resources of Kuwait: Geology and geomorphology, Final Report, Vol.3, KISR 2830, Kuwait.
Al-Dousari, A. M. (1998). Textural characteristics and mineralogy of free dunes of the Al-Huwamiliyah–Al-Atraf zone in Kuwait (Doctoral dissertation, MS thesis, Kuwait University, Kuwait)..
Al-Dousari, A. M., Ahmed, M. O. D. I., Al-Senafy, M., & Al-Mutairi, M. (2008). Characteristics of nabkhas in relation to dominant perennial plant species in Kuwait. Kuwait Journal of Science and Engineering, 35(1A), 129.
Al-Dousari, A. M., & Pye, K. (2005). Mapping and monitoring of dunes in northwestern Kuwait. Kuwait Journal of Science and Engineering, 32(2), 119.
Al-Dousari, A., Pye K., Al-Hazza, A., Al-Shatti, F., Ahmed, M., Al-Dousari, N., & Rajab, M. (2020). Nanosize Inclusions as A Fingerprint for Aeolian Sediments. Journal of Nanoparticle Research. https://doi.org/10.1007/s11051-020-04825-7.
Al-Dabi, H., Koch, M., Al-Sarawi, M., & El-Baz, F. (1997). Evolution of sand dune patterns in space and time in north-western Kuwait using Landsat images. Journal of Arid Environments, 36, 15–24.
Alenezi, A., (2001). Morphodynamic and sedimentology of falling dunes northeast of Kuwait. Ph.D. Thesis, Royal Holloway, University of London, unpublished.
Al-Saud, M. (1986). Sand drift and its size characteristics in Ad-Dahna desert on the Riyadh-Dammam highway. Unpublished M.A. Thesis, Geogr. Dept, King Saud University, Riyadh, Saudi Arabia, 1986 (Arabic).
Al-Sheeb, A. I. (1998). Sand movement in the state of Qatar—The problem and solution. Assessment and monitoring of desert ecosystemsIn S. A. S. Omar, R. Misak, & D. Al-Ajmi (Eds.), Sustainable development in arid zones (Vol. 1, pp. 223–239). Balkema.
Anthonsen, K., Clemmensen, L., & Jensen, J. (1996). Evolution of a dune from crescentic to parabolic form in response to short-term climatic changes: Rأ¥bjerg Mile, Skagen Odde. Denmark. Geomorphology, 17, 63–77. https://doi.org/10.1016/0169-555X(95)00091-I.
Bagnold, R. A. (1941). Physics of blown sand and desert dunes (p. 205). Methuen.
Beadnell. H. (1910). The sand-dunes of the Libyan desert. Their Origin, form, and rate of movement, considered in relation to the geological and meteorological conditions of the region. The Geographical Journal, 35(4), 379–392.
Benaafi, M., & Abdullatif, O. (2015). Sedimentological, mineralogical, and geochemical characterization of sand dunes in Saudi Arabia. Arabian Journal of Geosciences, 8, 11073–11092. https://doi.org/10.1007/s12517-015-1970-9.
Binda, P. L. (1983). On skewness of some eolian sands from Saudi Arabia. In M. E. Brookfield & T. S. Ahlbrandt (Eds.), Developments in sedimentology (Vol. 38, pp. 27–39). Elsevier.
Blumberg, D. (1998). Remote Sensing of Desert Dune Forms by Polarimetric Synthetic Aperture Radar (SAR). Remote Sensing of Environment, 65(2), 204–216. https://doi.org/10.1016/S0034-4257(98)00028-5.
Bowler, J. M. (1973). Clay Dunes: Their occurrence. formation and environmental significance. Earth-Science Reviews, 9(4), 315–338. https://doi.org/10.1016/0012-8252(73)90001-9.
Breed, C. S., Grolier, M., McCauley, J. (1979a). Morphology and distribution of common ‘sand’ dunes on Mars: Comparison with the Earth 84(14), 8183–8204. https://doi.org/10.1029/JB084iB14p08183.
Breed, C. S., & Grow, T. (1979b). Morphology and distribution of dunes in sand seas observed by remote sensing. In E. D. McKee (Ed.), A study of global sand seas, United States Geological Survey Professional Paper 1052, pp. 253–304.
Breed, C. S., et al. (1979b). Regional studies of sand seas using Landsat (ERTS) imagery. In E. D. McKee (Ed.), A study of global sand seas, United States Geological Survey Professional Paper 1052, pp. 305–398.
Bull, P. A. (1981). Environmental reconstruction by scanning electron microscopy. Progress in Physical Geography, 5(3), 368–397.
Bullard, J. E., Thomas, D. S. G., Livingstone, I., & Wiggs, G. S. F. (1997). Dunefield Activity and Interactions with Climatic Variability in the Southwest Kalahari Desert. Earth Surface Processes and Landforms, 22(2), 165–174. https://doi.org/10.1002/(SICI)1096-9837(199702)22:2%3c165::AID-ESP687%3e3.0.CO;2-9.
Chaundhri, R. S., & Khan, H. M. (1981). Textural parameters of desert sediments—Thar desert (India). Sedimentary Geology, 28(1), 43–62. https://doi.org/10.1016/0037-0738(81)90033-6.
Cooke, R., Warren, A., & Goudie, A. (1993). Desert geomorphology. UCL press.
Culver, S. J., Bull, P. A., Campbell, S., Shakesby, A., & Whalley, W. B. (1983). Environmental discrimination based on grains surface textures: A statistical investigation. Sedimentology, 30, 129–136.
Dougill, A. J., & Thomas, A. D. (2002). Nebkha dunes in the Molopo Basin, South Africa and Botswana: Formation controls and their validity as indicators of soil degradation. Journal of Arid Environments, 50(3), 413–428.
Dougrameji, J. (1984). The physical and mineralogical characteristics of some sand dunes in Iraq. Presented at the first Arabian conference for dunes stabilization and desertification control, University of Baghdad: Iraq (in Arabic). 14–22 October.
Elsayed, Z., & El-Sayed. (1999). Geoarchaeology and Hydrogeology of Deir El-Hagar Playa, Dakhla. Bulletin Society Bulletin Society Geography. Egypte Tome LXXII, V. 72, 81–90.
El-Baz, F. (1986). On the reddening of quartz grains in dune sand. Physics of desertification. Springer, Dordrecht, pp. 191–209. https://doi.org/10.1007/978-94-009-4388-9_14.
Embabi, N. S., & Ashour, M. M. (1993). Barchan dunes in Qatar. Journal of Arid Environments., 25(1), 49–69. https://doi.org/10.1006/jare.1993.1042.
Foda, M. A., Khalaf, F. I., Gharib, I.M., Al-Hashash, M. Z., & Al-Kadi, A. S. (1984). Assessment of sand encroachment and erodability problems in Kuwait. Technical report. Kuwait Institute for Scientific Research, KISR 1297, Kuwait.
Folk, R. (1971). Longitudinal dunes of the northwestern edge of the Simpson desert, northern territory, Australia, 1. Geomorphology and grain size relationships. Sedimentology, 16(1), 5–54. https://doi.org/10.1111/j.1365-3091.1971.tb00217.x.
Fryberger, S. G., AL‐SARI, A. M., Clisham, T. J., Rizvi, S., & Al‐Hinai, K. (1984). Wind sedimentation in the Jafurah sand sea, Saudi Arabia. Sedimentology, 31(3), 413-431.
Fryberger, S. G., & Schenk, C. (1981). Wind sedimentation tunnel experiments on the origins of Aeolian strata sedimentology, 28(6), 805–821.
Fuchs, F., Gattinger, T. E., & Holzer, H. F. (1968). Explanatory text to the synoptic geologic map of Kuwait: A surface geology of Kuwait and the Neutral Zone. Geological Survey of Austria.
Gharib, I., Foda, M. A., Al-Hashash, M., & Marzouk, F. (1985). A study of control measures of mobile sand problems in Kuwait air bases. Kuwait Institute for Scientific Research, KISR 1696, Kuwait.
Greeley, R., & Iversen, J. (1985). Wind as a geological process (p. 33). Academic press.
Goudie, A. S., & Middleton, N. J. (2001). Saharan dust storms: Nature and consequences. Earth-Science Reviews, 56, 179–204. https://doi.org/10.1016/S0012-8252(01)00067-8.
Howard, A., Morton, J., Hack, M., & Pierce, D. (1978). Sand transport model of barchan dune equilibrium. Sedimentology, 25, 307–338.
Hunter, R. (1977). Basic types of stratification in small eolian dunes. Sedimentology, 24(3), 361–387. https://doi.org/10.1111/j.1365-3091.1977.tb00128.x.
Jensen, J. (2015). Introductory digital image processing: A remote sensing perspective (4th edition). Pearson.
Khalaf, F. I. (1989). Textural characteristics and genesis of the aeolian sediments in Kuwait desert. Sedimentology, 36, 253–271.
Khalaf, F. I., Misak, R., & Al-Dousari, A. M. (1995). Sedimentological and morphological characteristics of some nabkha deposits in the northern coastal plain of Kuwait, Arabia. Journal of Arid Environments, 29, 267–292.
Khalaf, F. I., Gharib, I., & Al-Hashash, M. Z. (1984). Types and characteristics of recent surface deposits of Kuwait. Journal of Arid Environments, 7, 9–33.
Khalaf, F. I., Kadib, L., Gharib, I., Al-Hashash, M. Z., Al-Saleh, S., & Al-Kadi, A. (1980). Dust fallout in Kuwait. Kuwait Institute For Scientific Research, KISR/PPI 108/EES-RF-8016. Kuwait.
Khalaf, F., & Al-Ajmi, D. (1993). Aeolian processes and sand encroachment problems in Kuwait. Geomorphology, 6, 111–134. https://doi.org/10.1016/0169-555X(93)90042-Z.
Krinsley, D., & Doornkamp, J. (1973). Atlas of quartz sand surface textures. Cambridge University Press.
Lancaster, N. (1989). Star dunes. Progress in Physical Geography: Earth and Environment, 13(1), 67–91. https://doi.org/10.1177/030913338901300105.
Lancaster, N. (1981). Grain size characteristics of namib desert linear dunes. Sedimentology, 28, 115–122.
Livingstone, I., Bullard, J. E., Wiggs, G. F. S., & Thomas, D. S. T. (1999). Grain-size variation on dunes in the Southwest Kalahari, Southern Africa. Journal of Sedimentary Research, 69(3), 546–552. https://doi.org/10.2110/jsr.69.546.
Mainguet M. (1984). A classification of dunes based on aeolian dynamics and the sand budget. In F. El-Baz (Eds.), Deserts and arid lands. Remote Sensing of Earth Resources and Environment, Vol. 1. Springer, Dordrecht. https://doi.org/10.1007/978-94-009-6080-0_2.
Misak, R., Zaghloul, M., & Ahmed, M. (1996). New approach to the classification of aeolian landforms in Kuwait. Presented at the international conference on desert development in Arab Gulf Countries, Kuwait. 23–26 March.
Misak, R., & Kawarteng, A. (2000). Recent environmental changes in the surface geological features of Kuwait: An effective tool for environmental management. 5th international conference on the geology of the Arab world (GAW-5), p. 109.
McKee, E. D. (1979). Introduction to study of global sand seas. In E. D. Mckee (Ed.), A Study of Global Sand Seas. United States Geological Survey, Professional Paper 1052, pp. 3–19.
Nayfeh, A. (1990). Geotechnical Characteristics of the Dune Sands for Kuwait. Thesis, Kuwait University (Unpublished), Kuwait.
Neuman, C. M., Lancaster, N., & Nickling, W. G. (1997). Relations between dune morphology, air flow, and sediment flux on reversing dunes, Silver Peak. Nevada. Sedimentology, 44(6), 1103–1111. https://doi.org/10.1046/J.1365-3091.1997.D01-61.X.
Nielsen, O., Dalsgaard, K., Halgreen, C., Kuhlman, H., Møller, J. T., & Schou, G. (1982). Variation in particle size distribution over a small dune. Sedimentology, 29(1), 53–65. https://doi.org/10.1111/j.1365-3091.1982.tb01708.x.
Nickling, W., & Wolfe, S. A. (1994). The morphology and origin of nabkhas, Region of Mopti, Mali, West Africa. Journal of Arid Environments, 28, 13–30.
Omar, S., El-Bagouri, I., Anwar, M., Khalaf, F., Al-hashash, M., & Nassef, A. (1989). Measures to control mobile sand in Kuwait. Kuwait Institute for Scientific Research, Technical report no. KISR2760, Kuwait.
Paisley, E., Lancaster, N., Gaddis, L., & Greeley, R. (1991). Discrimination of active and inactive sand from remote sensing: Kelso dunes, Mojave desert. California. Remote Sensing of Environment, 37(3), 153–166. https://doi.org/10.1016/0034-4257(91)90078-K.
Phillip, G. (1968). Mineralogy of the recent sediments of Tigris and Euphrates Rivers and some of the older detrital deposits. J. Sediment. Petrol. 38. 35–44. Power, M.C. 1953. A new roundness scale for sedimentary particles. Sedimentary Petrology, 23, 117–119.
Planet. (2021). Available at https://www.planet.com/.
Powers, M. C. (1953). A new roundness scale for sedimentary particles. Journal of Sedimentary Petrology, 23, 117–119.
Pye, K., & Tsoar, H. (1990). Aeolian sand and sand dunes. Unwin Hyman, London. https://lib.ugent.be/catalog/rug01:001642518.
Ramakrishna, Y., Kar, A., Rao, A., & Singh, R. (1994). Micro-climate and mobility of barchan dune in the thar desert. Annals of Arid Zone, 33(3), 203–214.
Satellite Imaging Corporation. (2021). Available at https://www.satimagingcorp.com/.
Skocek, V., & Saadallah, A. A. (1972). Grain size distribution, carbonate content and heavy minerals in aeolian sands, southern desert, Iraq. Sedimentary Geology pp. 29–46.
Shehata, W., Bader, T., Irtem, O., Ali, A., Abdallah, M., Aftab, S. (1992). Rate and mode of Barchan Dunes advance in the central part of the Jafurah sand sea. Journal of Arid Environments, 23(1), 1–17. https://doi.org/10.1016/S0140-1963(18)30537-8.
Thomas, D. S. G. (1986). Dune pattern statistics applied to the Kalahari Dune Desert. Southern Africa. Zeitschrift Für Geomorphologie, 30(2), 231–242. https://doi.org/10.1127/zfg/30/1986/231.
Thomas, D. S. G. (1988a). Analysis of linear dune sediment-form relationships in the Kalahari dune desert. Earth Surface Processes and Landforms, 13(6), 545–553. https://doi.org/10.1002/esp.3290130608.
Thomas, D. S. G. (1988b). Arid geomorphology. Progress in Physical Geography: Earth and Environment, 12(2), 595–606. https://doi.org/10.1177/030913339001400204.
Thomas, D. S. G. (1989). Aeolian sand deposits, 232–261.
Thomas, D. S. G. (1988c). Desert dune activity: Concepts and significance. Journal of Arid Environments, 22(1), 31–38. https://doi.org/10.1016/S0140-1963(18)30654-2.
Tsoar, H., & Yaalon, D. (1983a). Deflection of sand movement on a sinuous longitudinal (seif) dune: use of fluorescent dye as tracer. Sedimentary Geology, 36(1), 25–39.
Tsoar, H. (1983b). Wind tunnel modeling of echo and climbing dunes. Eolian sediments and processes, pp.247–259.
Tsoar, H. (1986). Two-dimensional analysis of dune profile and the effect of grain size on sand dune morphology. Physics of desertification, pp. 94–108.
Vincent, P., & Lancaster, N. (1985). Some Saudi Arabian dune sand: A note on the use of response diagram. Zeitschrift Fur Geomorphology, 29, 117–122.
Warsi, W. E. K. (1990). Gravity field of Kuwait and its relevance to major geological structures. AAPG Bull. 1610–1622 (American Association of Petroleum Geologists; United States, Medium: X; Size).
Watson, A. (1990). The control of blowing sand and mobile desert dunes. Techniques for desert reclamation, pp. 35–85 ref.164.
Watson, A. (1985). The control of wind blown sand and moving dunes: A review of the methods of sand control in deserts, with observations from Saudi Arabia. Quarterly Journal of Engineering Geology and Hydrogeology, 18, 237–252. https://doi.org/10.1144/GSL.QJEG.1985.018.03.05.
White, B., & Tsoar, H. (1998). Slope effect on saltation over a climbing sand dune. Geomorphology, 22(2), 159–180.
Wilson, I. G. (1973). Ergs. Sedimentary Geology, 10, 77–106. https://doi.org/10.1016/0037-0738(73)90001-8.
Zimbelman, J., & Williams, S. (2002). Geochemical indicators of separate sources for eolian sands in the eastern Mojave Desert, California, and western Arizona. Geological Society of America Bulletin, 114(4), 490–496.
Author information
Authors and Affiliations
Corresponding author
Editor information
Editors and Affiliations
Rights and permissions
Open Access This chapter is licensed under the terms of the Creative Commons Attribution 4.0 International License (http://creativecommons.org/licenses/by/4.0/), which permits use, sharing, adaptation, distribution and reproduction in any medium or format, as long as you give appropriate credit to the original author(s) and the source, provide a link to the Creative Commons license and indicate if changes were made.
The images or other third party material in this chapter are included in the chapter's Creative Commons license, unless indicated otherwise in a credit line to the material. If material is not included in the chapter's Creative Commons license and your intended use is not permitted by statutory regulation or exceeds the permitted use, you will need to obtain permission directly from the copyright holder.
Copyright information
© 2023 The Author(s)
About this chapter

Cite this chapter
Al-Dousari, A.M., Al-Sahli, M., Al-Awadhi, J., Al-Enezi, A.K., Al-Dousari, N., Ahmed, M. (2023). Sand Dunes in Kuwait, Morphometric and Chemical Characteristics. In: Abd el-aal, A.ea.K., Al-Awadhi, J.M., Al-Dousari, A. (eds) The Geology of Kuwait. Regional Geology Reviews. Springer, Cham. https://doi.org/10.1007/978-3-031-16727-0_3
Download citation
DOI: https://doi.org/10.1007/978-3-031-16727-0_3
Published:
Publisher Name: Springer, Cham
Print ISBN: 978-3-031-16726-3
Online ISBN: 978-3-031-16727-0
eBook Packages: Earth and Environmental ScienceEarth and Environmental Science (R0)