
Abstract
The goals on this chapter are to:
You have full access to this open access chapter, Download chapter PDF
1.1 Introduction and Scope
1.1.1 Scope
The goals on this chapter are to:
-
introduce the concept of educational data as a key success factor for online and blended teaching and learning,
-
present the Learn2Analyze framework for educational data literacy competences, and
-
discuss the fundamentals of educational data collection.
1.1.2 Chapter Learning Objectives
This chapter learning objectives | Learn2Analyse Educational data literacy Competence profile |
|---|---|
Learn how educational data can support successful online and blended courses | 1.1 |
Understand the importance of data-driven decision making to continuously improve the online and blended teaching and learning | 5.1 |
Recognise the value of educational data literacy to make data-informed reflections on the design and delivery of instruction | 5.2 |
Know the different types of educational data in online and blended courses | 1.1 |
Know the different educational data sources related to core elements of e-learning environments | 1.1 |
1.1.3 Introduction
Data is identified as one of the key enablers for driving change in the twenty-first century.
In the context of online education, learners are leaving behind a rich data footprint throughout the course of their study. As a result, the existing educational data about learners, their learning and the environments in which they learn, has exponentially increased.
Educators can grasp the great opportunities offered by educational data and the potential provided by data analytics technologies, to gain powerful insights and develop new ways of achieving excellence in both teaching and learning.
Educational data can reveal insights about the course design and teaching practice that might not be recognised otherwise. Moreover, through educational data analysis, tutors can have a holistic view of their learners’ past, present and likely future, develop a deep understanding of their learners’ activities, behaviour and preferences. As a result, they can target accordingly their teaching and learning interventions to provide the learners with a personalised learning experience and better feedback, and help them meet their educational goals.
Educational Data-Driven Decision Making (DDDM) can be a useful tool for reflecting on the teaching practices and improving the teaching and learning outcomes. For effective DDDM, educators need to be able to identify, collect, combine, analyse, interpret and effectively act upon all types of educational data from diverse sources.
Educational Data Literacy for all Education Professionals (such as instructional designers, teachers and tutors of online and blended courses) is now recognized internationally as a key set of competences and a strong competitive advantage to get the best results in online and blended teaching and learning.
However, emerging advancements related to the use of data-driven design and delivery of online and blended learning courses, exploiting Educational Data Analytics are not yet thoroughly addressed by existing competence frameworks for education professionals.
To this end, the Learn2Analyze project has developed a comprehensive proposal for an Educational Data Literacy Competence Framework to enhance existing competence frameworks with new Educational Data Literacy competences. The Learn2Analyze Educational Data Literacy Competence Framework comprises of 6 competence dimensions and 17 competence statements.
The first competence dimension of this framework refers to Data Collection. Since educational data comes from a variety of sources in diverse formats, the effective Data Collection is considered as an essential competence that educators need to acquire and a prerequisite for this continuous process of evaluation, reflection and improvement.
It is fundamental for educators to distinguish the different types of Educational Data in Online and Blended courses, to identify the Educational Data Sources related to core elements of e-learning environments and to access and gather the appropriate educational data by combining data from different sources and in different formats, avoiding systematic errors induced from the data collection process employed.
1.2 Educational Data as a Key Success Factor for Online and Blended Teaching and Learning
1.2.1 Educational Data for Data-Driven Decision Making
As described in the “What is Big Data and how does it work?” video (in the useful video resources), data is identified as one of the key factors driving change in the twenty-first century. Commonly referred to as the ‘data revolution’, the ‘era of big data’, or more simply ‘big data’, the term is used to describe the tremendous increase in the amounts of data we generate in all aspects of our lives. Big Data can bring big possibilities and thus create big expectations (Shacklock, 2016).
“Big Data gives you the ability to achieve superior value from analytics on data at higher volumes, velocities, varieties or veracities”. This claim is summarized in Fig. 1.1, based on the infographic “Extracting business value from the 4 V’s of big data” by IBM (2019).
Volume | The size of available data has been growing at an exponential rate. “With higher data volumes, you can take a more holistic view of your subject’s past, present and likely future”. |
Velocity | Data streams are created at an unprecedented speed. “At higher data velocities, you can ground your decisions in continuously updated, real-time data”. |
Variety | Data comes in all types of formats. “With broader varieties of data, you can have a more nuanced view of the matter at hand”. |
Veracity | Data veracity is not only how accurate or truthful a data set may be, but also how trustworthy the data source, type, and processing of it is. “As data veracity improves, you can be confident that you’re working with the truest, cleanest, most consistent data”. |

The 4 V’s of big data
This video by intel (see the useful video resources “Big Data’s Making Education Smarter”) explains further how big data can make education smarter.
In the context of online education, learners are leaving behind a rich data footprint throughout the course of their study. Educational data comprises a wide range of datasets about learners, their learning and the environments in which they learn, stored in various sources. We will focus on and discuss in detail different types of educational data in the next topic of this chapter (Shacklock, 2016).
Educational data and data analytics technologies can support us in developing a better understanding of our learners’ activities, behaviour and preferences, by identifying patterns and trends in the data that, in turn, can help us predict possible future outcomes and take actions for improving the learners’ experience in our courses.
Therefore, in both online and blended courses (Fig. 1.2),
-
instructional designers can use data to (re)design their courses,
-
tutors can use data to adjust their tutoring and learners’ support strategies,
-
school teachers can use data to better plan inside and outside classroom activities and assess students’ learning.
On the other hand, data could potentially enable learners to take control of their own learning. When appropriately delivered, data can provide learners with better insights about their current academic performance in real-time, about their progress (also in comparison to their peers) and recommendations about what they need to do for meeting their learning goals and help them to make informed, data-driven choices about their studying (Sclater et al., 2016).

Educational data opportunities
The Data Quality Campaign, in the video “Data is Power” (in the useful video resources), highlights the importance of collecting and using quality data to transform education. Nevertheless, the provision of educational data by itself does not automatically lead to improved teaching and learning. Appropriate analyses and sensemaking of educational data allow us to identify actionable insights and inform decision making.
Data-Driven Decision Making is about that.
Data-driven decision making (DDDM) is defined as
the systematic collection, analysis, examination, and interpretation of data to inform practice and policy in educational settings (Mandinach, 2012).
Data-driven decision making has become an essential component of educational practice in order to ground decisions based on data and evidence.
Data-Driven Decision Making (DDDM) crosses all levels of the educational system and uses a variety of data from which decisions can be made. Therefore, it can be challenging to engage in DDDM due to data being siloed in different sources and at different levels.
Developing competences for effective DDDM is essential for education professionals. Such competences require “to effectively transform information into actionable knowledge and practices by collecting, analyzing, and interpreting all types of data” (Ridsdale et al., 2015).
Decisions fall into two categories (Marsh et al., 2006:
-
Using data as a diagnostic tool to identify, inform, or clarify issues both at learners’ level (e.g. identifying needs) and at institution level (e.g. informing the design of courses or curricula), and
-
Using data to act (e.g. assessing and acting upon differential outcomes among the learners’ population, personalised interventions for at-risk learners).
Data is not a static entity and therefore decisions based on data should not be static either. Data usage and evaluation should be continuous and integrated into existing decision-making processes (Fig. 1.3).

From problem identification to informed decision making
Don’t approach data analysis as a cool “science experiment” or an exercise in amassing data for data’s sake. The fundamental objective in collecting, analyzing, and deploying data is to make better decisions (Díaz et al., 2018).
As per Marsh et al. (2006), “Once the decision to act has been made, new data can be collected to begin assessing the effectiveness of those actions, leading to a continuous cycle of collection, organization, and synthesis of data in support of decision making.”
Data analytics refers to methods and tools for analysing large sets of different types of data from diverse sources, to support and improve decision-making. Data analytics are mature technologies that are currently applied in real-life financial, business and health systems.
However, it is only recently (Johnson et al., 2011, p.28-30), that data analytics have been considered in education - first in higher education, and more recently in school education (Bienkowski et al., 2012).
The “Engaging with students to build a better digital environment” video (in the useful video resources) shows a real-life case study of the implementation of Jisc digital experience insights service (Jisc, 2018) aiming to improve the student experience of blended learning at Canterbury Christ Church University based on educational data analysis.
As the Project lead Duncan MacIver concludes “The data we have from the insights service makes a significant difference to where we are moving digitally as an institution. This lends a credible voice to decisions being made and provides us with a level of confirmation that we are taking actions that are of direct benefit to students.”
Questions and Teaching Materials
-
1.
Please select the right answer.
As described in the video “What is Big Data and how does it work?”, in order to process big data and elaborate the endless possibilities offered, we need to use huge computers to analyze the million pieces of data we generate on a daily basis.
Is this sentence True or False?
-
True
-
False
-
Correct answer: False
-
2.
Please match the appropriate definition (from the right column), to the respective “V of Big Data” in the left column.
1. Veracity | A. To take a more holistic view of your subject’s past, present and likely future |
2. Variety | B. To be confident that you’re working with the truest, cleanest, most consistent data |
3. Value | C. To have a more nuanced view of the matter at hand |
4. Volume | D. To ground your decisions in continuously updated, real-time data |
5. Velocity | E. To get useful insights from superior analytics |
Correct answers: 1-B, 2-C, 3-E, 4-A, 5-D
-
3.
Please select the right answer.
According to the “Big Data’s Making Education Smarter” video by Intel, that presents how education technology companies are leveraging big data to make learning more effective, analytics can
-
1.
be a powerful tool only for assessing learners’ performance
-
2.
enable teachers to see what students learn but not how students learn.
-
3.
enable schools to decrease drop-out rates.
-
1.
Correct answer: C.
-
4.
Please match how educational data and data analytics technologies (from the right column) can support each professional role (in the left column)
1. School Teachers | A. to take control of their own learning |
2. Instructional designers | B to adjust their tutoring and learners’ support strategies. |
3. Learners | C. To (re)design their courses |
4.Tutors | D. To better plan inside and outside classroom activities and assess students’ learning |
Correct answers: 1-D, 2-C, 3-A, 4-B
-
5.
Please select the right answer(s). You may select more than one answer.
Data-Driven Decision Making (DDDM) is about:
-
A.
collecting a huge amount of data
-
B.
grounding decisions based on evidence
-
C.
informing practice and policy in educational settings
-
D.
identifying actionable insights from the educational data
-
E.
dealing with overwhelming statistics
-
A.
Correct answers: B, C, and D
-
6.
Please match the steps we need to proceed with, for Data-Driven Decision Making (DDDM), in the right order:
1st step | A. Transform Information into Decisions |
2nd step | B. Collect required data |
3rd step | C. Identify problems |
4th step | D. Evaluate decisions |
5th step | E. Transform data into information |
6th step | F. Frame questions |
Correct answers: 1-C, 2-F, 3-B, 4-E, 5-A, 6-D
-
7.
Please select the right answer(s). You may select more than one answer.
As per the video “Engaging with students to build a better digital environment”, the educational data analysis provided Canterbury Christ Church University with a deep understanding of the
-
A.
staff dissatisfaction on having to handle the burden of the inclusion of technology within learning and teaching.
-
B.
students’ expectations when it comes to the inclusion of technology within learning and teaching.
-
C.
parents’ complaints for collecting and using students’ personal data.
-
D.
policy makers’ demand for effective learning and teaching, minimizing the drop-out rates.
-
E.
areas that the university needed to develop to best support their students
-
A.
Correct answers: B and E.
-
8.
ACTIVITY/PRACTICE QUESTION (Reflect on)
We encourage you to elaborate on your response about the implementation of personalised learning in the following reflective task.
You may reflect on:
-
1.
What data are you currently collecting? How are you using this data to make decisions and take actions?
-
2.
How are you currently using your data to inform the design of your courses?
-
1.
1.2.2 Why Educational Data Is Important for Online and Blended Teaching and Learning?
Personalised learning is identified as one of the major educational challenges of the twenty-first century (2017 Horizon Report, Freeman et al. (2017)). Personalised learning refers to the supporting of individual student learning in a pedagogically effective and practically efficient personalised manner, based on their individual short, mid and long-term needs.
Education Elements (2018) states that personalised learning is increasingly recognized as a promising strategy to
-
help students connect with their needs and aspirations,
-
close achievement gaps,
-
increase student engagement, and
-
prepare students to become self-directed, lifelong learners
by meeting their individual needs, customizing their learning experiences to indulge their interests, using customised lessons, units and projects at their own pace.
Personalised learning has become easier with the leverage of learners’ performance, engagement and behaviour data, captured in online and blended learning environments and analysed with the help of data science.
The video published by Educause “Educause: What Is Personalized Learning?” (in the useful video resources), explains aspects of personalised learning emphasizing the variety of tools and technologies that can support each learner’s individual needs. The importance of a personalised learning experience, that is tailored to the learners’ unique needs, skills, and interests, is also illustrated in the following infographic “You Need Data to Personalize Learning” from Data Quality Campaign.
A wide range of data is generated by the learners and stored in online and blended teaching and learning environments. Data is collected from explicit learners’ activities, such as completing assignments and taking exams, and from tacit actions, including online social interactions, extracurricular activities, posts on discussion forums, and other activities that are not directly assessed as part of the learner’s educational progress (U.S. Department of Education, 2012) (Bienkowski et al., 2012).
Such learner-generated data is used to assess learning progress, to predict learning performance, to detect and identify potentially harming behaviours and to act upon the findings.
Nevertheless, as stated in the 2011 Horizon report, we should not solely focus on learners’ performance. Deeper analysis of the educational data can be used to improve understanding of teaching and learning taking place online and/or in blended courses.
As it can be seen at the video in Arizona State University “Using big data to customize learning” (in the useful video resources), online learner generated data is used to customise teaching and learning in subjects like maths, by tailoring the content to the detected needs of the learners.
Every drop-off, click or share is a learner shouting their likes and dislikes. These actions are the eye-rolls, smiles and crossed arms from the classroom, simply in digital format (Greany & Niles-Hofmann (2018), An Everyday Guide to Learning Analytics).
Questions and Teaching Materials
-
1.
Please select the right answer(s). You may select more than one answer.
According to Anthony Kim, CEO and Founder of Education Elements “We don’t need a model of superhuman superhero teachers. We need to use the power of technology and educational design—combined with the high aspirations we all begin with—in order to create innovative learning environments that foster personalised learning for everyone.” Why does personalised learning matter, as per Chap. 2 “Why personalized Learning” in Education Elements?
Personalised learning
-
A.
creates lifelong learners.
-
B.
decreases student engagement.
-
C.
increases student achievement.
-
D.
limits the time for teachers to focus on each student.
-
E.
is the future of learning.
-
A.
Correct answers: A, C, E
-
2.
Please select the right answer(s). You may select more than one answer.
As stated by Data Quality Campaign (in the infographic “You need Data to Personalize Learning”) “For all students to be college and career ready, they need a learning experience that is tailored to their unique needs, skills, and interests. Data is a critical tool that makes this personalised learning possible”. You are requested to explain the reasons.
With Data:
-
A.
Learning is individualized.
-
B.
Learning continues outside of the classroom.
-
C.
Teachers have the total control of their students learning.
-
D.
Learning is about mastery.
-
E.
Learning is about time spent in class.
-
A.
Correct answers: A, B, D
-
3.
Please select the right answer.
As described in the Executive Summary of the Issue Brief published by U.S. Department of Education in 2012, K–12 schools and school districts are starting to adopt applications of educational data mining and learning analytics techniques in order to proceed with institution-level analyses
-
A.
for recognizing the costs and challenges associated with collecting and storing logged educational data.
-
B.
for detecting areas for instructional improvement, setting policies, and measuring results.
-
C.
for detecting ethical obligations associated with knowing and acting on student data.
-
A.
Correct answer: B
-
4.
Please select the right answer
At the Arizona State University (as per the video “Using big data to customize learning”), appropriate software adapts to each individual student needs by analyzing students’ every keystroke to figure out their learning styles. The software harvests information from the devices the students use and collates grades, learning skills, strong and weak points and even hesitation patterns when using the computer mouse.
This is achieved using:
-
A.
Predictive Algorithms
-
B.
Prescriptive Algorithms
-
A.
Correct answer: A.
-
5.
ACTIVITY/PRACTICE QUESTION (Reflect on)
We encourage you to elaborate on your response about the implementation of personalised learning in the following reflective task.
You may reflect on:
-
1.
How can you as an instructional designer, tutor or school teacher develop an evaluation plan for a personalised learning intervention?
-
2.
Apart from personalised learning, how can educational data be important to your role as instructional designer, tutor or school teacher?
-
1.
1.2.3 How Educational Data Can Help Instructional Designers and e-Tutors of Online Courses?
Instructional design - also referred to Learning Design or Educational Design - is a systematic and iterative process for any educational challenge (including professional training and human performance improvement) that requires an educational intervention.
Reiser (2001) states that: “The field of instructional design and technology encompasses the analysis of learning and performance problems, and the design, development, implementation, evaluation and management of instructional and non-instructional processes and resources intended to improve learning and performance in a variety of settings, particularly educational institutions and the workplace” (p.53).
The widely used ADDIE model, illustrated in the below infographic from Obsidian Learning (2018) (Fig. 1.4), is a five-phase approach to analyse, design, develop, implement and evaluate any teaching and learning product and process in an effective and efficient way.

ADDIE model representation (Krisna kristiandi hartono [CC BY-SA 4.0])
Within the context of the ADDIE approach
-
Instructional designers (ID) are the professionals in the field of instructional design, mainly engaged in the analysis, the design, the development and the evaluation phases, whereas,
-
Trainers or tutors are the professionals engaged mainly in the implementation phase and they can also inform the evaluation phase.
The roles of instructional designers and trainers/tutors in online and blended courses require new competences compared to those in traditional face-to-face education and training programs.
Instructional Designers are mainly engaged in the analysis, the design, the development and the evaluation phases of the ADDIE process.
Analysis Phase
During this phase, the instructional designer identifies an instructional (educational or learning) problem and analyses the parameters of the context in which teaching and learning will take place, as well as the learners’ characteristics and their existing competences (knowledge, skills and attitudes). As a result, the key elements of this phase can be codified as follows:
-
A.1.
Instructional/educational/learning problem Identification: aims to address why a teaching/learning process (broadly referred to as educational intervention) is needed for the identified problem. Contextual Analysis: aims to capture where the educational intervention will be implemented, namely the learning environment.
-
A.2.
Learner Analysis: aims to analyse for whom the educational intervention will be designed.
The major outcome of the Analysis phase is a granulated overview of the contextual and learner conditions that will be used to configure and formulate the upcoming Design phase.
Design Phase
During this phase, the instructional designer defines the educational objectives to be achieved, selects an appropriate teaching approach for attaining these objectives, as well as, appropriate assessment methods for evaluating whether and to what extent the educational objectives have been met. As a result, the key elements of this phase can be codified as follows:
-
DES.1.
Definition of Educational Objectives: this includes the definition of general educational objectives, as well as the development of specific subject matter objectives, aligned to the general objectives.
-
DES.2.
Selection of Teaching Approach/Strategy: this includes the selection of an appropriate teaching approach/strategy for supporting learners in attaining the educational objectives. Additionally, based on the selected strategy, this phase also includes the formulation of the specific learning activities and their appropriate sequencing in order to attain the expected educational objectives. Finally, a direct mapping between each learning activity to the educational objectives that they aim to cultivate is also performed.
-
DES.3.
Selection of Assessment Method(s): this includes the selection of appropriate assessment methods for evaluating the level of achievement of the educational objectives. This includes also sequencing and description of assessment activities according to the selected teaching approach/strategy and assessment method(s).
The main outcome of the Design phase is a detailed blueprint of the flow and description of the learning and assessment activities, which also accommodates the contextual and learner considerations from the Analysis phase.
Develop Phase
During this phase, the development or selection of appropriate educational materials and the development/arrangement of the appropriate delivery setting is performed for the outcome of the Design Phase. This phase can involve except from the instructional designer, other individuals such as subject matter experts or technical and media experts. As a result, the key elements of this phase can be codified as follows:
-
DEV.1.
Development or selection of educational resources for supporting learning and/or assessment activities of the Design Phase
-
DEV.2.
Development or selection of educational tools and/or services for supporting learning and/or assessment activities of the Design Phase
-
DEV.3.
Development/arrangement of the appropriate delivery setting where learning will take place. For example, development/selection of a digital delivery system or appropriate arrangement of a physical delivery setting such as a classroom.
The main outcome of the Develop phase is the selection or production of educational materials/tools that can appropriately support the outcome of the Design Phase.
Evaluate Phase
During this phase, an evaluation of both the entire teaching and learning process, as well as each phase, is performed towards identifying whether the desired results have been achieved. As a result, the key elements of this phase can be codified as follows:
-
E.1.
Formative Evaluation: this includes an ongoing evaluation process during design, development and implementation phases and aims to maximize pedagogical/ andragogical effectiveness (e.g. achievement of educational objectives) and/or implementation efficiency (e.g. time/cost reduction)
-
E.2.
Summative Evaluation: this is performed after completion of the Implement phase and aims to measure pedagogical/ andragogical effectiveness (e.g. achievement of educational objectives) and/or implementation efficiency (e.g. time/cost reduction).
The main outcome of the Evaluate phase is to identify issues or changes needed, so as to refine the design, development and implementation phases of future designs and to assess whether the desired results have been achieved.
Trainers or tutors, as part of their role, they are mainly engaged in the implementation phase of the ADDIE process, whereas they can also inform the evaluation phase.
Implement Phase
During this phase, the outcome of the previous phases is delivered to the learners. Although delivery is typically addressing groups of learners, still emphasis should be given to providing individual learning experiences, including scaffolding and feedback. To this end, it is important that learners’ (and teachers’/tutors’) actions are tracked and meaningful educational data is collected (to be analysed and inform reflection and decision making). As a result, the key elements of this phase can be codified as follows:
-
I.1.
Delivery: this includes the delivery of the product from Analysis, Design and Develop phases to the learners.
-
I.2.
Monitoring: this includes tracking of learners’ (and teacher/tutors’) actions and collecting meaningful educational data based on which teachers can form evidence-based run-time adaptations/revisions (and also specify which and why these adaptations or revisions were performed).
The main outcome of the Implement phase is to support learners in attaining the educational objectives by appropriately monitoring them so, if needed, changes and adaptations can be made.
As presented in the figure below (Fig. 1.5), instructional designers and trainers/tutors, as part of their role, leverage educational data at all phases of the ADDIE process they are engaged in.

Instructional designers and trainers/tutors leverage educational data in all phases of the ADDIE process
Questions and Teaching Materials
-
1.
ADDIE model is a five-phase approach to analyse, design, develop, implement and evaluate any teaching and learning product and process in an effective and efficient way (as presented in the infographic from Obsidian Learning ( 2018 ) of Fig. 1.4 ).
Please match the sentences (from the right column) corresponding to the respective phase of ADDIE Model (in the left column).
1. Analyze | A. The quality of learning resources |
B. Target audience | |
2. Design | C. Learning resources |
D. The learning solution by preparing the learning space and engaging participants | |
3. Develop | E. Instructional goals |
F. How well the learning resources accomplish instructional goals | |
4. Implement | G. Validate and revise drafts |
H. a learning solution that aligns objectives and strategies with instructional goals | |
5. Evaluate | I. Required resources |
J. Conduct a pilot test |
Correct answers: 1: B, E, I – 2: H – 3: C, G, J – 4: D - 5: A, F
-
2.
Instructional Designers are mainly engaged in the analysis, the design, the development and the evaluation phases of the ADDIE process. Please mark the correct key elements corresponding to each phase of the ADDIE process.
Analysis phase | Design phase | Develop phase | Evaluate phase | |
|---|---|---|---|---|
Formative evaluation | X | |||
Capture learners’ characteristics and their existing competences | X | |||
Selection of assessment method(s) | X | |||
Arrangement of the appropriate delivery setting | X | |||
Identify instructional (educational or /learning) problem | X | |||
Summative evaluation | X | |||
Definition of educational objectives | X | |||
Assess whether the desired results have been achieved | X | |||
Selection of educational resources | X | |||
Selection of teaching approach/strategy | X |
Correct answers: as marked with X above
-
3.
The key elements in the Implement Phase of the ADDIE process are Delivery and Monitoring. Please match the sentences (from the right column) corresponding to the respective key element of the Implement Phase of the ADDIE process (in the left column).
1. Delivery | A. Of meaningful educational data based on which teachers can form evidence-based run-time adaptations/revisions |
B. Of the product from develop phase to the learners | |
2. Monitoring | C. Of the product from analysis and design phases to the learners |
D. Of learners’ (and teacher/tutors’) actions |
Correct answers: 1: B, C - 2: A, D.
-
4.
Please mark the correct professional role and outcome to the respective phase of the ADDIE process
ADDIE Phase | Instructional Designers | Trainers/Tutors | Support learners in attaining the educational objectives | Description of the learning and assessment activities | Identify issues or changes needed | Granulated overview of the contextual and learner conditions | Detailed blueprint of the flow | Selection and production of educational materials/tools |
|---|---|---|---|---|---|---|---|---|
Analysis phase | X | X | ||||||
Design phase | X | X | X | |||||
Develop phase | X | X | ||||||
Implement phase | X | X | ||||||
Evaluate phase | X | X |
Correct answers: as marked with X above
-
5.
Please select the right answer(s). You may select more than one answer.
As described in the video “Data Driven Learning Design”, “Data-Driven Learning Design very simply is all about just looking at data at the start before you begin any design, put all this data together and build a picture for how you want to design your content to respond to what insights they’re telling you.”
Can you give some examples of the data that you should be looking at, in order to decode the digital body language of your learners?
-
A.
what type of devices learners use to log in?
-
B.
what is the political belief of the learners?
-
C.
what’s the time of day that learners are engaging with your content?
-
D.
what is the financial status of the learners?
-
E.
how long of the portion of a video a person looks?
-
F.
whether learners are married
-
G.
data that is easily available – start small
-
A.
Correct answers: A, C, E, G.
-
6.
ACTIVITY/PRACTICE QUESTION (Reflect on)
We encourage you to elaborate on your response about the use of educational data, in the following reflective task.
You may reflect on:
-
1.
How can you as an Instructional Designer or e-Tutor leverage educational data from online courses? Please share either your past experience or your thoughts for future actions.
-
2.
How can you as an Instructional Designer or e-Tutor use educational data to enhance engagement in an online course? Please share either your past experience or your thoughts for future actions.
-
1.
1.2.4 How Educational Data Can Help School Teachers of Blended Courses?
Schools are using self-evaluation as an instrument to engage all key stakeholders (namely, school leaders, educators, parents and students) in reflecting and improving school activities.
For example, as presented in the “School Self-evaluation Guidelines 2016-2020 Primary”, the Irish Inspectorate of the Department of Education Skills (2016) defines School Self-evaluation as:
a collaborative, inclusive, and reflective process of internal school review. An evidence-based approach, it involves gathering information from a range of sources, and then making judgements. All of this with a view to bring about improvements in students’ learning.
The Annenberg Institute for School Reform (Barnes, 2004) has developed a continuous, non-linear inquiry process for self-evaluation, comprised of six essential activities, depicted in the figure below (Fig. 1.6).

The six essential activities for continuous, non-linear inquiry process for self-evaluation
In the video “Data: It’s Just Part of Good Teaching” (in the useful video resources) from the Data Quality Campaign, Sherman Elementary in Rhode Island demonstrates how the effective use of data by a school community can improve students’ performance. Moreover, the video “How Data Help Teachers” (in the useful video resources), from the Data Quality Campaign, demonstrates how data helps school teachers and their students succeed. For more details, you may also review the corresponding infographic, “Ms. Bullen’s Data-Rich Year” by DQC.
This video from the Data Quality Campaign, “Data Can Help Every Student Excel” (in the useful video resources) also discusses what does it mean to use data in service of student learning, taking the stand that data is one of the most powerful tools to inform, engage, and create opportunities for students along their education journey.
Before proceeding further, let’s now discuss what flipped classroom is all about. As per Panopto (2015) “The flipped classroom is a teaching strategy in which the traditional class format is turned on its head. This inverted model “flips” the traditional order of class activities so that school work is done at home, and “homework” is done at school. In flipped classes, students review lecture materials prior to class, reserving in-class time for teacher-guided activities that allow students to put the lecture materials into practice. Activities can include in-depth discussion, labs, debates, problem-solving, or just open time for individual assignments — all with the added benefit of having the teacher nearby to help when questions arise.”
This new approach enables teachers to make the shift from teacher-driven instruction to student-centred learning and thus to reinforce deeper learning. You may also review the video “The Flipped Classroom Model” (in the useful video resources).
As Brame (2013) from the University of Vanderbilt, Center for Teaching, suggests, the flipped classroom approach yields statistically significant improvements in engagement, test scores and overall long-term learning.
The infographic “How Educational Data can help School Teachers of Blended (Flipped Classroom) Courses?” is presenting a use-case with an example for the school teacher of blended learning courses in the K-12 education context (Fig. 1.7).

Infographic for school teacher in K12 blended courses
The video “Why Personalized Learning: 4 Stories from 4 School Districts” (in the useful video resources) shows 4 School Districts sharing their findings on the implementation of blended courses aiming to provide a unique personalised learning experience to their students.
Questions and Teaching Materials
-
1.
Please select the right answer(s). You may select more than one answer.
As described in the Chap. 2 of the “School Self-evaluation Guidelines 2016-2020 Primary” (Inspectorate, Department of Education and Skills, 2016), self-evaluation requires a school to address the following key questions with regards to an aspect or aspects of its work.
-
A.
How bad are we doing?
-
B.
How do we know?
-
C.
What other schools do?
-
D.
How can we find out more?
-
E.
What are our strengths?
-
F.
How can we hide our weaknesses?
-
G.
What are our areas for improvement?
-
H.
How can we improve?
-
A.
Correct answers: B, D, E, G, H
-
2.
Please select the correct answer.
According to Sherman Elementary in Rhode Island (please refer to the video “Data: It’s Just Part of Good Teaching”), the use of data may be really beneficial for the school community and can lead to improved academic performance. Nevertheless, it creates an extra add-on and an overwhelming burden for both teachers and students.
Is this statement valid?
-
Yes
-
No
-
Correct answer: No
-
3.
Let’s meet Alice! Alice is an enthusiastic English Language teacher who has just been appointed in an Experimental High School, in Athens, Greece. She will be responsible for the English Language Course of class1 and class2 of the ninth Grade (14 to 15 years’ students). Alice is very excited about her new role. Nevertheless, the school’s principle, Alex, is concerned about the relatively low performance of last year’s eighth graders compared to other experimental schools in the region. Alex encourages Alice to use student data to gain insights and plan her teaching activities accordingly, so as to improve this year’s Grade 9 students’ academic performance.
Alice decides to watch the video by Data Quality Campaign “How Data Help Teachers”, so as to find out how she can leverage data for her students to succeed. Alice is really inspired by Ms. Bullen who empowers her student Joey to get on track meeting the educational goals.
Can you help Alice to arrange the instances of Ms. Bullen’s story in the right order?
A. Joey’s data shows that he’s on track for success. |
B. Ms. Bullen reviews her performance with the principal to note strengths and opportunities. |
C. She uses data and her experience in the classroom to see where Joey and his classmates excel or struggle. |
D. Ms. Bullen gets access to data on her students’ past performance, behaviour and attendance. |
E when Ms. Bullen sees that Joey is at risk of failing, she works with Joey, his parents and his other teachers to get him on track by the end of the year. |
F. Ms. Bullen talks with Joey about his own data and they work together to set goals throughout the year. |
Correct answers: 1-D, 2-C, 3-F, 4-B, 5-E, 6-A
-
4.
Please select the appropriate answer (s). You may select more than one answer.
Alice is really excited about the power of using data in service of learning and for personalizing her instruction to keep every student on track to excel. Thus, she searches for further information. Alice now watches the video about How “Data Can Help Every Student Excel”. She then reviews the below statements. Something seems wrong...
Which of these statements are not valid ?
-
A.
When students, parents and educators have the right information to make decisions, students excel.
-
B.
Data is one of the most powerful tools to inform, engage, and create opportunities for students along their education journey.
-
C.
Education data is all about test scores.
-
D.
Education data comes from many sources and in many formats.
-
E.
Policy makers know the detailed profile for each and every student.
-
F.
Making data work for students means collecting all possible data in all available formats
-
A.
Correct answers: C, E, F
-
5.
Please select the right answer(s). You may select more than one answer.
Let’s go back to Alice. The principal informs Alice about the Learning Management System used by the school to facilitate teaching and learning, pointing out that the previous teacher has already created some online activities there.
Alice decides to apply the flipped classroom strategy to her new students using the school’s LMS. For this purpose, she designs and develops online teaching resources for Class1 and Class2. Students of these classes enrol in the respective group and study the lecture material at home (prior to classroom meeting). The material is in the form of video, text, small activities with automatic feedback (such as online quizzes), and forum discussions. During the classroom sessions, students are performing more complex activities, typically in small groups, with the benefit of Alice’s scaffolding, guidance and feedback. Then, they can undertake some additional homework online to further check their understanding and extend their learning through appropriately designed individual and group assignments.
Alice reads the article “Flipping the classroom” By Cynthia J. Brame. She is looking at the key elements of the flipped classroom.
-
A.
Provide an opportunity for students to gain first exposure prior to class.
-
B.
Provide a mechanism to assess student understanding.
-
C.
Provide in-class activities that focus on lower-level cognitive activities.
-
D.
Provide an incentive for students to prepare for class.
-
E.
Provide an opportunity for teachers to keep in contact with parents.
Correct answers: A, B, D
-
6.
As referred to the infographic “ How Educational Data can help School Teachers of Blended (Flipped Classroom) Courses? ”, to improve this year’s Grade 9 students’ academic performance, Alice decides to apply the flipped classroom strategy to her new students using the school’s Learning Management System. Alice starts creating a detailed plan about the needed steps to go through in order to make her flipped classroom strategy a success story for herself, her students, her principle and the parents. Can you help Alice to arrange the steps of her plan in the right order?
Please arrange the instances in the right order.
-
A.
Following data analysis, Alice plans to use Learning analytics to monitor students’ learning process, to discover patterns, to identify problems early, to find indicators for success and indicators for poor marks or drop-out and self-reflect to improve the design and the delivery of her course comprehending the story that the collected data reveals.
-
B.
Furthermore, Alice plans to design an evaluation plan for her course using indicators to ensure that the flipped classroom initiative is on track for reaching the long-term goal of improving students’ academic performance to reach the regional standards.
-
C.
Alice will contact the school’s data protection officer (DPO), to secure all necessary approvals for the sources handled by her school or by the corresponding district. She will also request to grant her access to the LMS used by the school and ask the DPO if signed informed parental consent are necessary for all participating students before implementing the flipped classroom initiative.
-
D.
After running the online course for three weeks, Alice will use different presentation methods to illustrate descriptive statistics on students’ participation and performance data.
-
E.
Following the principal’s advice, Alice plans to use student data to gain insights and plan her teaching activities accordingly. She will gather a variety of students’ data, including demographics, perception data, past academic performance. To retrieve the needed data, she has to access diverse sources: school’s internal data sources like the student information system as well as external data sources, like the district’s databases.
-
F.
As data coming from various sources is quite messy, containing missing values, outliers, and duplicate instances, data cleaning is required to obtain a consistent database, free from any sort of discrepancies.
-
A.
Correct answers: 1E-2C-3F-4D-5A-6B
-
7.
Please select the right answer (s). You may select more than one answer.
Alice is unstoppable. She meets regularly with other teachers for training and for identifying promising data use practices for her flipped classroom model. She now wonders. What are the findings of other schools that have successfully implemented their Blended Courses?
She retrieves the video describing the 4 stories from 4 School Districts on personalised learning “Why Personalized Learning: 4 Stories from 4 School Districts, https://www.youtube.com/watch?v=ur2E_S1IBP0”. She notes down some initial findings. She reads them again and she notices that she probably mixed it up a bit.
Can you help her identify the right findings?
-
A.
Personalised learning is really about traditional notions of grade-level expectations.
-
B.
Personalised learning enables teachers to understand where students are and recognize the potential for moving them forward.
-
C.
Keeping middle school kids on track and on task academically can often be the biggest challenge for teachers.
-
D.
In this model the teacher is not the key education element anymore.
-
E.
In this model teachers may have individual conversations with students each day and figure out where they are at and take them to the next level.
-
F.
Teachers are not interested in looking at each individual student’s growth.
-
G.
There is a lot more student engagement in the digital content or with the device and less student engagement with the teacher.
-
H.
With supportive personalised learning schools create students who are knowledgeable critical thinkers, communicators, collaborators, creators and contributors.
Correct answers: B, C, E, H.
-
8.
ACTIVITY/PRACTICE QUESTION (Reflect on)
We encourage you to elaborate on your response about using educational data in blended learning environment, in the following reflective task. You may reflect on your experience from implementing flipped classroom and/or express your opinion on why to use blended learning (or not!):
-
1.
Teachers always used data in their everyday practice. Whether you are an instructional designer, an e-tutor or a school teacher, reflect on which particular learners’ data do you use and how?
-
2.
How data gathered from the online component of a blended learning flipped classroom, can help school teachers improve their teaching?
-
1.
1.2.5 The Learn2Analyze Educational Data Literacy Competence Framework
Educational data literacy is defined as:
the ability to collect, manage, evaluate, and apply data, in a critical manner (Ridsdale et al., 2015).
the ability to accurately observe, analyse and respond to a variety of different kinds of data for the purpose of continuously improving teaching and learning in the classroom and school (Love, 2012).
the ability to understand and use data effectively to inform decisions … composed of a specific skill set and knowledge base that enables educators to transform data into information and ultimately into actionable knowledge (Mandinach & Gummer, 2013).
[the capacity to] continuously, effectively, and ethically access, interpret, act on, and communicate multiple types of data from state, local, classroom, and other sources in order to improve outcomes for students in a manner appropriate to their professional roles and responsibilities (Data Quality Campaign, 2014a).
Thus, educational data literacy refers to the competence set which is required to identify, collect, combine, analyse, interpret and act upon educational data from different sources, with the aim of continuously improving the teaching, learning and assessment process.
In the “Roadmap for Educator Licensure Policy Addressing Data Literacy” report, the Data Quality Campaign recommends the following set of Data Literacy Competences for teachers, (Fig. 1.8):
-
1.
Locate and Collect Relevant Educational Data
-
2.
Synthesise and Analyse Educational Data from Diverse Sources
-
3.
Know about Educational Data beyond Grades
-
4.
Understand How to Use Educational Data beyond Grades
-
5.
Engage in a Data-Driven Continuing Inquiry Process
-
6.
Use Data Analysis to Customise Teaching Plans to Diverse Groups
-
7.
Use Own Data to Reflect on Practice
-
8.
Facilitate Students to Understand their Data
-
9.
Communicate Insights from Data Analysis to Diverse Internal and External Stakeholders
-
10.
Monitor this process in a continuous manner

Educational data literacy roadmap
As already discussed, Educational Data Analytics are attributed with significant benefits for enhancing personalised educational support of the learners as well as reflective course (re)design for achieving improved teaching, learning and assessment.
However, emerging advancements related to the use of data-driven design and delivery of online and blended learning courses, exploiting Educational Data Analytics are not yet thoroughly addressed by existing competence frameworks for education professionals (instructional designers, trainers, educators, teachers). Existing professional competence frameworks for instructional designers and trainers almost ignore the dimension of Educational Data Literacy.
To this end, the Learn2Analyze project has developed a comprehensive proposal for an Educational Data Literacy Competence Framework to enhance existing competence frameworks for instructional designers and e-trainers of online courses with new Educational Data Literacy competences.
The Learn2Analyze Educational Data Literacy Competence Framework comprises of 6 competence dimensions and 17 competence statements, as captured in Fig. 1.9.

Learn2Analyze educational data literacy dimensions
In addition, the following table (Table 1.1.) provides a brief overview of the Learn2Analyze Educational Data Literacy Competence Framework.
Questions and Teaching Materials
-
1.
Please select the right answer.
Alice is back! She has realized that, for effective data use, Educational Data Literacy is a prerequisite. So, she is trying to understand the meaning of this much-discussed key component.
Alice believes that educational data literacy refers to the specific skill of using assessment data effectively in order to improve outcomes for students.
Is this definition by Alice valid?
-
Yes
-
No
-
Correct answer: No
-
2.
Please select the right answer.
Alice decides to study further on Educational Data Literacy. She reads the brief intended for State Policy Makers by Data Quality Campaign “Teacher Data Literacy: It’s About Time”.
According to this brief, “One element of quality teaching for improving student outcomes is effective data use. Teacher data use is also the best way to maximize state investment in data systems.”
Consequently, to date, policies have heavily promoted the skills teachers need to be data literate. Thus, many teachers regard data as a powerful tool for improving instruction and ultimately outcomes for students.
Is this interpretation by Alice, True or False?
-
True
-
False
-
Correct answer: False.
-
3.
Alice is now interested in finding out the skills that teachers need to be qualified, so as to integrate the use of data into their everyday practice as one tool for improving student achievement. Are you ready to support Alice in this task?
According to the “Roadmap for Educator Licensure Policy Addressing Data Literacy” report, the ability to effectively use data includes a set of skills that teachers (and administrators) need to use data both collaboratively and individually to inform instruction.
Please match the appropriate definition (from the right column), to the respective data use skill in the left column.
1. Synthesize and analyze diverse data | A. Ability to use one’s own performance data and other relevant data to assess and reflect on personal practice for the purpose of continuous improvement. |
2. Know about and use student-level and other types of data beyond assessment data | B. Ability to engage in the ongoing process of identifying classroom and system problems, forming questions and hypotheses about each issue, collecting and analyzing relevant information and translating. |
3. Engage in a data-driven and cyclical inquiry process | C. Ability to use data to communicate with students about their progress so that they can evaluate their own performance and set goals. |
4. Use one’s own data | D. Ability to explore and organize many types of data. |
5. Facilitate student understanding of data | E. Understanding that multiple types of data beyond student assessments can be used to inform practice. |
Correct answers: 1-D, 2-E, 3-B, 4-A, 5-C.
-
4.
Alice is confident with the flipped classroom approach, as she has used it before with great results. However, she realises that she is lacking data literacy competences
The principle encourages her to enrol in the Learn2Analyse MOOC before the school year starts – it is only an 8-week course and it is free. She is really excited and she immediately reviews the Educational Data Literacy Competence Profile Framework that comprises of 6 competence dimensions.
Can you assist Alice to arrange these 6 competence dimensions in the right order?
Please arrange the 6 competence dimensions in the right order.
A. Data analysis |
B. Data ethics |
C. Data management |
D. Data comprehension & interpretation |
E. Data collection |
F. Data application |
Correct answers: 1-E, 2-C, 3-A, 4-D, 5-F, 6-B
-
5.
Alice studies thoroughly the competence statements of the Learn2Analyze Educational Data Literacy Competence Profile Framework (L2A EDL-CP Framework). She is really interested in investigating the exact competences she needs to develop in order to be Educational Data Literate and use data both effectively and ethically to improve her students’ achievements.
But she needs your assistance, again!
Please help Alice to mark the correct statements corresponding to each of the 6 competence dimensions of the EDL-CP Framework.
Data collection | Data management | Data analysis | Data comprehension & interpretation | Data application | Data ethics | |
|---|---|---|---|---|---|---|
Use the informed consent | X | |||||
Apply the technologies to preserve data | X | |||||
Apply modelling methods | X | |||||
Evaluate the data-driven revision of instruction | X | |||||
Gather the appropriate data | X | |||||
Elicit potential implications | X | |||||
Apply data limitations and quality measures | X | |||||
Apply data presentation methods | X | |||||
Interpret insights from data analysis | X | |||||
Apply authorship & ownership | X | |||||
Use data analysis results to make decisions to revise instruction | X | |||||
Apply data curation processes | X |
Correct answers: as marked with X above
-
6.
Alice now has a good sense that in order to achieve her strategy to become a success story, her school needs to develop a culture of data enablement for all parties involved in the life of a student.
Thus, she watches the interview of the well-known Gartner’s Analyst Rita Sallam “Develop a culture of data and analytics enablement at the summit”, to find out what are the actions that her school needs to proceed with.
She understands how important it is to ensure that every person in her school is data literate in order to be able to leverage the information provided to each of them. Enabling analytics to have maximum impact on her school, involves addressing key concepts like diversity in school’s data, systems and most importantly diversity of the people, to make sure that the school can get diverse ideas and diverse skills to really innovate. Do you agree with the assumption of Alice?
Please select the correct answer:
-
Yes
-
No
-
Correct answer: Yes.
-
7.
ACTIVITY/PRACTICE QUESTION (Reflect on)
We encourage you to elaborate on your response to educational data literacy training in the following reflective task. You may reflect on:
-
1.
your experience from attending such a course, and/or
-
2.
your thoughts on why to attend such a course (or not!)
-
1.
1.3 Data Is Everywhere (Educational Data Collection)
1.3.1 Posing Questions and Identifying Appropriate Educational Data
In the previous sections we reviewed the key role of educational data. In this section we will have a closer look of what educational data is.
In the school context, educational data can be broadly defined as:
information that is collected and organised to represent some aspect of schools. This can include any relevant information about students, parents, schools, and teachers derived from qualitative and quantitative methods of analysis (Lai & Schildkamp, 2013, p. 10).
As this definition suggests, educational data is not restricted to students’ grades in national exams and standardised tests (although that is a common misconception). Instead, educational data comprises a wide range of data from various sources, both internal (school-wide and classroom-specific data) and external (state and/or district data) to the school.
This definition can be extended to higher education and professional training institutions, as represented in Fig. 1.10 (Long & Siemens, 2011).

Different levels of educational data
We can distinguish two major categories of data, the qualitative and quantitative data. With a combination of different types of data being the most effective in generating powerful evidence to assess learning performance and improve teaching practice. Both quantitative and qualitative data is equally important in these processes (Fig. 1.11).

Quantitative and qualitative educational data
As discussed, for effective Data-Driven Decision Making, we need to be data literate, to be able to understand basic data science processes (speak data). According to Gartner analysts Idoine, Schlegel, and Sallam (Pettey, 2018), “learning to “speak data” is like learning any language. It starts with understanding the basic terms and describing key concepts.” In our case, the first key area of data literacy vocabulary is Educational Data Collection.
Educational Data is everywhere. To inform our decisions and benefit from them, we need to collect the necessary data. To do this, we need to answer to the “Four Ws and One How” questions, presented in Fig. 1.12. We should know why we collect this data, what types of data we need to collect, when and how to get it and where to find it. “Who will collect or grant access to the needed data”, is also a question that should be answered, since, obviously, we can only collect data to which we have access and which we have been granted permission to use.

The four Ws and one how of educational data
You will probably need to utilize a variety of data types from different sources and use various methods to process and analyse them according to our goals.
Bear this strategy in mind and start posing questions that will help you identify and collect the appropriate educational data. Your ultimate goal is to improve your instructional e-learning strategy and make your online and blended course a success story for your target learners.
We’ll now guide you step by step through the effective process for collecting educational data by answering each one of these key questions.
Most things start with a question. The first question to ask ourselves is “Why is data needed? Why we need to collect the data, in the first place?”
When you analyse and design any course you need to gather the questions that are related to your instructional design, your teaching and tutoring strategy and your learners’ support:
-
What is my Target Audience (whose instructional needs are to be addressed)?
-
What are the Learning Environment Characteristics (educational context, limiting factors, affordances and constraints, technical requirements)?
-
What criteria will be used to assess the achievement of the expected learning outcomes by the learners?
When the course is up and running:
-
What is the learners’ activity in the Online Environment?
-
What are the tutors’ support activities (scaffolding, feedback, answering questions, stimulating engagement)?
-
How the combination of the learners’ and tutors’ activities relate to the academic performance, motivation and/or engagement?
Figure 1.13 summarizes some key questions to help us identify the needed data.

Key questions to help us identify the needed data
Now that we have the right questions in place, we can identify the type of data that may help us find the answers we are looking for. As suggested by Fig. 1.14 and this infographic by the Data Quality Campaign project, the types of educational data commonly used can be classified in two types: Static and Dynamic Data.

Static and dynamic educational data
Static data, refers to data which can remain unchanged for large periods of time. According to Shacklock (2016), it is the data “which is collected, recorded and stored by institutions and traditionally includes student records, staff data, financial data and estates data”.
As Shacklock (2016), points out “Static data has always been a strategic asset for both institutions and government. It informs all operational and business decision-making and planning in an institution, and indicates to government and the public how the sector is performing as a whole.”
Dynamic data refers to data generated at a more frequent rate and they are mainly related to learners’ activities during the learning process. Such data is usually collected by the e-tutors, classroom teachers typically through Learning Management Systems.
If we manage to collect, link and analyse dynamic data, then we can probably get an instant, accurate view of how an individual learner or a group of learners is performing.
Lai and Schildkamp (2013, p. 11–12) have extended Ikemoto and Marsh’s (2007) categories of educational data, to input data, context data, process data and outcome data. Each category indicates when data will be collected. Figure 1.15 presents examples of educational data for each category.

Examples of educational data for each category
To get a better understanding of the use of data to strengthen lifelong learning, you may watch the video (in the useful video resources) from UNESCO “Data for Lifelong Learning“, presenting an overview of the tools developed by the UNESCO Institute for Statistics (UIS) to measure learning and improve learning outcomes.
Questions and Teaching Materials
-
1.
Please select the correct answer.
Do you remember Alice? Alice is an English teacher who has just been appointed in an Experimental High School, in Athens, Greece. She is responsible for the English Course of Class1 and Class2 of the ninth grade. Her principal has encouraged her to use student data to gain insights and prepare her instruction accordingly, so as to improve this year’s Grade 9 students’ achievement.
Alice is studying the categories of data and realizes that we can distinguish two major categories of data, qualitative and quantitative data.
In a school setting, quantitative data may include notes from classroom observations.
Do you agree with the assumption of Alice?
-
Yes
-
No
-
Correct answers: No
-
2.
Please select the correct answer.
Alice realizes that the first key to be data literate is Educational Data Collection. To achieve her goals, she needs to utilize a variety of data types from different sources and use various methods to process and analyse them.
Do you agree with the assumption of Alice?
-
Yes
-
No
-
Correct answers: Yes
-
3.
Alice is a bit confused about Navigation and click stream data. What information could this data reveal?
Help Alice select the correct answer(s):
-
A.
The most popular paths through the course site
-
B.
Time spent in the online learning environment
-
C.
Quiz performance
-
D.
Critical dropout points
-
E.
All the above
-
A.
Correct answers: A, B, D
-
4.
Alice starts posing questions to identify and collect the appropriate educational data. She asks herself “ Why do I need the data?”, “ What data is needed?” “ Where are data located?” “ How will data be collected? ”
Alice decides to gather a variety of students’ data, including demographics, perception data, past academic performance, last year’s achievements and formative assessments for English lesson and other courses, as well as the regional (district’s) performance over the past 5 years.
Alice understands that static data remain unchanged for large periods of time, while dynamic data is generated at a more frequent rate.
Help Alice match the data from the left column to the appropriate type from the right column (static or dynamic).
1. Personnel’s professional experience | A. STATIC DATA |
2. Student performance | |
3. Absenteeism rates | |
4. Engagement in the discussion forum | |
5. Learner’s background | B. DYNAMIC DATA |
6. Prior performance | |
7. Level of usage of educational resources | |
8. Resources and materials |
Correct answers: 1-A, 2-B, 3-B, 4-B, 5-A, 6-A, 7-B, 8-A
-
5.
According to Lai and Schildkamp ( 2013 ) educational data can be categorized as:
-
A.
input data
-
B.
context data
-
C.
process data and
-
D.
outcome data.
Alice wants to make effective instructional changes to her reading program to better cater for the boys in her class. She is considering using the following data:
-
1.
Data on student characteristics such as absenteeism rates for boys.
-
2.
Analysis of student performance on reading tests.
-
3.
Discussions with the boys about their strengths and weaknesses in reading and their love of reading.
-
4.
Examination of the school curriculum to determine whether the reading texts are engaging for boys.
Help Alice to match the data [1 to 4] with the categories of the data [a to d] mentioned above.
-
A.
Correct answer: 1a – 2d – 3c – 4b
-
6.
Please select the correct answer.
After watching the video “Data for Lifelong Learning”, from the UNESCO Institute for Statistics, Alice realizes that “robust monitoring is needed to track whether children and adults are gaining the skills they need to thrive in today’s world.”
Do you agree with the assumption of Alice?
-
Yes
-
No
-
Correct answer: Yes.
-
7.
ACTIVITY/PRACTICE QUESTION (Reflect on)
We encourage you to elaborate on your response about the use of educational data in the following reflective task. You may reflect on:
-
1.
As an instructional designer or a school teacher, you want to collect data to redesign your course. Describe your evaluation plan. Define the questions you need to answer and the data you will need to collect. Please share either your past experience or your thoughts for future actions.
-
2.
As a tutor of an online course, you want to collect data to enhance your learners’ participation in the course. Define the questions you need to answer and the data you will need to collect. Please focus on either your past experience or your thoughts for future actions.
-
1.
1.3.2 Matching Appropriate Educational Data with Data Sources
In this section we will discuss where to find the educational data you need and how.
WHERE applies to the location where you might have to go for the data collection, according to the data you need.
There are numerous data sources of learners’ information available:
-
data stored in institutional student information systems, e.g. high school grades, socio-economic status, citizenship and immigration status, parents’ education and language skills,
-
trace data recorded within Learning Management Systems and other online learning environments such as e-libraries and virtual labs,
-
data from systems that analyse discussion in online forums,
-
survey data (e.g., questionnaires) (Fig. 1.16).

Difference between reliability and validity
By EGalvez (WMF) – Own work, CC BY-SA 3.0, https://commons.wikimedia.org/w/index.php?curid=31697223
Before proceeding further with data collection, we need to agree on a few basic concepts related to the nature of data itself. As Guerra-López (2008) points out, data must meet three basic characteristics:
-
Relevancy: The data must directly relate to the research questions being answered.
-
Reliability: The data must be measured, trustworthy, and consistent.
-
Validity: The data must measure what we intend to measure.
Another important question is which methods will be used to select a representative group of people from the learners’ target audience? How can we avoid biases in sampling?
Rothwell et al. (2016) argue that the four types of sampling procedures commonly used are: (1) convenience or judgmental sampling, (2) simple random sampling, (3) stratified sampling, and (4) systematic sampling. To determine which one to select, we need to consider our goals and objectives, certainty needed in the conclusions, the willingness of decision makers in the organisation to allow information to be collected for our study, and the resources (time, money, and staff) available (Rothwell et al., 2016) (Fig. 1.17).

Different sampling methods
Let’s have a closer look at this important aspect affecting our data, biases. Biases are systematic errors induced from the data collection process employed, reducing potential biases allows us to have data that represent the population. This “Bias when collecting data” video (in the useful video resources) explains different kind of biases that occur when collecting data.
-
Voluntary bias occurs when the responders choose themselves to participate.
-
Undercoverage bias occurs when some members of the population are inadequately represented in the sample.
-
Overcoverage bias occurs when some members of the population are overrepresented in the sample.
-
Non-response bias or participation bias occurs when the sample is unwilling to participate.
-
Convenience sample bias or availability bias occur when collecting the data that is easier to obtain, rather than collecting more relevant data.
-
Response bias occurs when respondents provide dishonest or misleading answers, due to many reasons such as survey design, survey fatigue, missing answers etc (Fig. 1.18).
As seen in Fig. 1.18, access to educational data may be a really serious barrier to overcome when gathering appropriate educational data. Here are some additional questions that we need to answer. What data do we need versus what data can we access? With whom in the organisation should we interact during our data collection process? How many people? For what issues? Whose approval is necessary to collect information?

Barriers to educational data
Perhaps the most common failure during the collection process is failing to receive enough—or the right—permissions to collect data. To overcome this problem, we should make sure we have secured all necessary approvals before collecting data.
Failure to complete this step successfully can create significant, and often unfortunate, barriers to cooperation within the organisation.
In their 2006 report, Making Sense of Data-Driven Decision Making in Education, Julie Marsh and her colleagues (Marsh et al., 2006, p. 9) identified a number of barriers to the effective and efficient take-up of educational data use.
Questions and Teaching Materials
-
1.
Alice wants to collect the following data, in order to study how her students’ academic achievement is related to their learning behaviour.
Help Alice decide which of this data is stored in the institutional Student Information.
System (select all that apply):
-
A.
Grades.
-
B.
Demographics.
-
C.
Clickstream data.
-
D.
Number of posts in the discussion forum.
-
E.
Parents education.
-
A.
Correct answers: A, B, E
-
2.
Alice wants to understand the difference between validity and reliability, so she asks Steven, a colleague. Steven uses the following example to explain validity and reliability in datasets.
“You want to measure students’ intelligence so you ask students to do as many push-ups as they can every day for a week. After one week, you find that each student did approximately the same number of push-ups on each day. What is the data you collected, in terms of validity and reliability?”
Help Alice find the right answer (you may also refer to https://www.thegraidenetwork.com/blog-all/2018/8/1/the-two-keys-to-quality-testing-reliability-and-validity ). The data collected is:
-
A.
Both valid and reliable
-
B.
Neither valid nor reliable
-
C.
Valid but not reliable
-
D.
Reliable but not valid
-
A.
Correct answer: D
-
3.
Alice has decided to apply the flipped classroom strategy with her students using the school’s Learning Management System. This inverted model “flips” the traditional order of class activities so that school work is done at home, and “homework” is done at school.
Before using the flipped classroom initiative, Alice wants to study students’ perceptions of technology. She prepares a questionnaire and uses students from her class as a sample for her study. She wants to generalize her findings to all High-School students.
The above procedure is an example of:
-
A.
convenience sampling
-
B.
simple random sampling
-
C.
systematic sampling
-
D.
snowball sampling
-
A.
Correct answer: A.
-
4.
Alice is excited. There are so many different kinds of bias that occur when collecting data.
Alice wonders if she understood the different categories of bias. Can you help Alice?

The data collection process described in the above comic strip with Hagar the Horrible is an example of:
-
A.
Non response bias
-
B.
Voluntary bias
-
C.
Response bias
-
D.
Convenience sample bias
-
A.

Correct answer: C
-
5.
Alice contacts Mr. Adams, who is appointed as school’s Data Protection Officer (DPO), to secure all necessary approvals for the sources handled by her school or by the corresponding district. As soon as Alice signs the required data protection consent form, she gets permission and downloads the datasets from the various sources. Alice also requests that she be granted access to the LMS used by the school (a new teacher account is created by the LMS administrator).
Without the availability of high-quality data and perhaps technical assistance, data may become misinformation or lead to invalid inferences. Delayed or late access to data and/or its analysis might affect the efficiency of the planned activities in response to the data intervention.
This kind of data barrier is referred as:
-
A.
Lack of easy access to educational data
-
B.
Lack of timely collection and analysis of educational data
-
C.
Poor quality of educational data
-
D.
Lack of time and support
-
A.
Correct answer: B.
-
6.
ACTIVITY/PRACTICE QUESTION (Reflect on)
We encourage you to elaborate on your response about data collection, in the following reflective task. You may reflect on:
-
1.
How can you as an instructional designer or tutor avoid biases in educational data collection? Please share either your past experience or your thoughts for future actions.
-
2.
You are an instructional designer or tutor or school teacher and you want to collect and analyse educational data from your course discussion forum to evaluate learners’ participation. Describe your evaluation plan.
-
1.
1.3.3 Combining Data from Different Educational Data Sources
As we have already seen, there are many different data sources that contain useful educational data. Shacklock (2016) reports that “some institutions are beginning to explore the possibility of incorporating more types of data into their analytics systems. The University of Lancaster is considering capturing and using data on which students are accessing library PCs and for how long, NTU are also looking at capturing data on e-book usage”.
Figure 1.19 summarizes indicative educational data sources that store data from various sources:
-
Internal Data Sources
-
Online Learning Courses
-
Surveys and polls
-
Cloud applications
-
Social media
-
External data sources, like open repositories

Indicative educational data sources
Once we decide upon the “Ws” of the data we need, we have to define HOW we will collect the data. School of Data (2013) distinguishes three basic ways of getting hold of data:
-
1.
Finding data – this involves searching and finding data that has already been released e.g. through open data repositories.
-
2.
Getting hold of more data – asking from official sources to release ‘new’ data, e.g. through Freedom of Information requests.
-
3.
Collecting data, yourself – This means gathering data through:
-
surveys and polls
-
internal data sources, like Institutions’ Management Information Systems and/or Students Information Systems.
-
online educational environments, such as LMSs, MOOCs, ITSs which record any learner activity involved, such as reading, writing, taking tests, performing various tasks and commenting with peers (Fig. 1.20).
-
There are various sources of educational data where data is stored in different formats. Romero et al. (2014) state that “the goal of data aggregation/ integration is to group together data from multiple sources into a coherent recompilation, normally into a database”.

Searching for answers
Aggregation is the process of grouping together same type of data from different organisations/institutions and integration is the process that groups different types of data from the same organisation/institution.
Using aggregation and integration we can combine data from different sources and in different formats, for example performance data, attendance records, past academic data and forum participation data into a single database.
Questions and Teaching Materials
-
1.
Alex, the principal of Alice’s school, is now interested in studying the effects of the free school breakfast programme on children’s attendance and academic achievement. He poses some questions and asks Alice to help him find the appropriate data.
Match the items in column A with column B and choose the correct answer to help Alice find the appropriate data collections.
Column A: Data needed | Column B: Where to look for data |
|---|---|
1. National/regional school breakfast program participation | A. Finding data in government or open data repositories and/or asking from official sources to release ‘new’ data |
2. Institutional school breakfast program participation | |
3. National/regional students’ academic achievements | |
B. Online educational environments | |
4. Institutional students’ academic achievements | |
5. National/regional students’ absenteeism data | C. Surveys and polls |
D. Institutions’ management information systems | |
6. Institutional students’ absenteeism data | |
7. Participation in online learning activities | E. Students information systems |
8. Dietary attitudes |
Correct answer: 1A – 2D – 3A – 4E – 5A – 6E – 7B – 8C
-
2.
Alice wants to retrieve students’ information from the Student Information System and combine it with data from the Learning Management System, in order to study the factors that affect student’s participation in the online course she prepared. The process that groups different types of data from the same organisation/institution is called:
-
A.
Aggregation
-
B.
Integration
-
A.
Correct answer: B.
-
3.
ACTIVITY/PRACTICE QUESTION (Reflect on)
We encourage you to elaborate on your response in the following reflective task. You may reflect on:
-
1.
You are an instructional designer and you need to collect data in order to redesign your online course. Describe your plan to ask permission to collect the appropriate data. You can use Freedom of Information request (The Freedom of Information Act (FOIA) gives you the right to access recorded information held by public sector organisations)
-
2.
You are an instructional designer or tutor or school teacher and you want to improve learners’ retention. How can you benefit from combining different data sources?
-
1.
1.4 Concluding Self-Assessed Assignment
1.4.1 Introduction
Now that you have a better understanding of the power of educational data as a key success factor for online and blended teaching as well as of the fundamentals of Educational Data Collection, you are ready to link theory with practice and apply your Educational Data Literacy Competences focusing on the creation of a Data Collection plan.
In order to proceed, you are requested to complete a concluding self-assessed assignment. This self-assessed assignment is a real life scenario activity (based on the use case of our teacher Alice), using a rubric across three proficiency levels and an exemplary solution rating. When you have completed this assignment, you will assess it yourself, following the rubric which will list the criteria required and give guidelines for the assessment.
This self-assessed assignment procedure consists of 5 steps:
-
Step 1. Real life scenario
-
Step 2. Getting familiar with the assessment rubric
-
Step 3. Prepare your answer
-
Step 4. Review a sample solution
-
Step 5. Self-evaluate your answer
1.4.2 Step 1. Real Life Scenario
Let’s go back to Alice. As introduced, Alice has decided to apply the flipped classroom strategy with her students using the school’s Learning Management System. She wants to use educational data to reveal insights about her course design and students’ activities, to reflect on her teaching practices and to target accordingly her teaching and learning interventions so as to help every student to excel and meet their educational goals.
To inform her decisions and benefit from them, Alice needs to access and gather the appropriate data. She should know why she collects this data, what types of data she needs to collect, when and how to get it and where to find it.
You need to help Alice to design her Educational Data Collection plan, in order to monitor students’ performance in the online course, for the flipped classroom initiative.
1.4.3 Step 2. Getting Familiar with the Assessment Rubric
Alice has already prepared an Initial Educational Data Collection Plan and asks you to evaluate it, using the Rubric for assessing the Educational Data Collection Plan, to identify potential issues.
ACTIVITY/PRACTICE QUESTION (Reflect on)
We encourage you to elaborate on your response about the evaluation of the Initial Educational Data Collection Plan created by Alice, in the following reflective task. You may reflect on:
-
1.
Does this Educational Data Collection Plan addresses student’s performance aspects?
-
2.
If not, what would you advise Alice to add/modify, so that the data collection plan addresses all aspects and monitor student’s performance, during the flipped classroom initiative?
1.4.3.1 Initial Educational Data Collection Plan
Evaluation questions (Why?) | Indicators (What?) | Data source (Where?) | Time of collection (When?) | Collection methods (How?) |
|---|---|---|---|---|
Online presence | Connection frequency | LMS | End of year | In class survey |
Performance | Final exams scores | Region database | End of year | SIS |
Activities | Activities completed | LMS | End of year | Online survey |
1.4.3.2 Rubric for Assessing the Educational Data Collection Plan
Criteria | 1 Unacceptable | 3 Good/Solid | 5 Exemplary |
|---|---|---|---|
Determine appropriate, clearly defined evaluation questions | Evaluation questions are not relevant or adequately defined and address only one or two aspects of student’s performance. | Evaluation questions are relevant, adequately defined and address several aspects of student’s performance. | Evaluation questions are relevant, well defined and address almost every aspect of student’s performance. |
Determine what data must be collected in order to answer the each evaluation question (indicators) | Most of the indicators are not defined or are not relevant with the respective performance evaluation question. | Relevant indicators are defined for most of the evaluation questions. | Multiple relevant indicators are defined for each evaluation question. |
Determine the data sources (where to find data) | Data sources are not defined for most of the evaluation questions. | Most of the data sources defined for The evaluation questions are relevant. | All data sources defined for the evaluation questions are relevant. |
Determine when to collect the data | Collection time is not defined for most of the evaluation questions. | Collection time is defined for most of the evaluation questions, but not always correctly. | Collection time is defined correctly for each of the evaluation questions. |
Determine how to collect the data (collection methods) | Collection methods are not defined for most of the evaluation questions. | Collection methods are adequately defined for most of the evaluation questions. | Appropriate collection methods are defined for all the evaluation questions. |
1.4.4 Step 3. Prepare Your Answer
Please assist Alice in preparing an Educational Data Collection plan to monitor her students’ performance in the online course for the flipped classroom initiative, by completing the following matrix.
Evaluation questions (Why?) | Indicators (What?) | Data source (Where?) | Time of collection (When?) | Collection methods (How?) |
|---|---|---|---|---|
e.g. online presence | e.g. connection frequency, Time spent, etc. | LMS | e.g. end of each month | System reports |
Add rows… |
ACTIVITY/PRACTICE QUESTION (Reflect on)
We encourage you to elaborate on your response about the preparation of the Educational Data Collection plan to monitor students’ performance in the online course, in the following reflective task. You may reflect on:
-
1.
How should the Educational Data Collection plan be formulated so that Alice can obtain useful insights for student’s performance, to inform her decisions and benefit from them?
-
2.
What are the main questions to ask for evaluating student’s performance in online courses and what data could be useful indicators to address these questions?
1.4.5 Step 4. Review a Sample Solution
Please review a sample of an Exemplary solution that follows the criteria specified in the Rubric for assessing the Educational Data Collection Plan.
ACTIVITY/PRACTICE QUESTION (Reflect on)
We encourage you to elaborate on your response about the Exemplary solution that follows the criteria specified in the Rubric for assessing the Educational Data Collection Plan, in the following reflective task. You may reflect on:
-
1.
Do you identify any requirements that you did not take under consideration when creating your Educational Data Collection Plan?
1.4.5.1 Exemplary Sample Solution
Educational Data Collection plan to monitor students’ performance in the English Language online course, for the flipped classroom initiative of the ninth Grade of Athens Experimental High School.
Evaluation questions (Why?) | Indicators (What?) | Data source (Where?) | Time of collection (When?) | Collection methods (How?) |
|---|---|---|---|---|
Online presence | Connection frequency, Time spent online, date of last login | LMS | End of week | System reports |
Content study | Number of lessons read, latency, downloaded PDFs, viewed resources, time spent on lessons and resources | LMS | End of month | System reports |
Activities done | Number of activities done for each type (quiz, assignment) | LMS | End of week | System reports |
Activities result | Average grade, average last grade, average best grade, final exams result | LMS | End of week | System reports |
Social activities | Topics read, answers posted, new topics created, time spent on the forums | LMS | End of month | System reports |
1.4.6 Step 5. Self-Evaluate Your Answer
Now that you have seen the Exemplary Sample Solution, please rate your initial answer (evaluate the Educational Data Collection Plan you created), using the Rubric table below.
Criteria | 1 Unacceptable | 3 Good/Solid | 5 Exemplary |
|---|---|---|---|
Determine appropriate, clearly defined evaluation questions | Evaluation questions are not relevant or adequately defined and address only one or two aspects of student’s performance. | Evaluation questions are relevant, adequately defined and address several aspects of student’s performance. | Evaluation questions are relevant, well defined and address almost every aspect of student’s performance. |
Determine what data must be collected in order to answer the each evaluation question (indicators) | Most of the indicators are not defined or are not relevant with the respective performance evaluation question. | Relevant indicators are defined for most of the evaluation questions. | Multiple relevant indicators are defined for each evaluation question. |
Determine the data sources (where to find data) | Data sources are not defined for most of the evaluation questions. | Most of the data sources defined for The evaluation questions are relevant. | All data sources defined for the evaluation questions are relevant. |
Determine when to collect the data | Collection time is not defined for most of the evaluation questions. | Collection time is defined for most of the evaluation questions, but not always correctly. | Collection time is defined correctly for each of the evaluation questions. |
Determine how to collect the data (collection methods) | Collection methods are not defined for most of the evaluation questions. | Collection methods are adequately defined for most of the evaluation questions. | Appropriate collection methods are defined for all the evaluation questions. |
References
Barnes, F. D. (2004). Inquiry and action: Making school improvement part of daily practice. Annenberg Institute for School Reform, Brown University.
Bienkowski, M., Feng, M., & Means, B. (2012). Enhancing teaching and Learning through educational data mining and Learning analytics: An issue brief. U.S. Department of Education, Office of Educational Technology.
Bovo, A., Sanchez, S., Heguy, O., & Duthen, Y. (2013). Clustering moodle data as a tool for profiling students. In 2013 Second international conference on E-Learning and E-Technologies in Education (ICEEE) (pp. 121–126).
Brame, C. J. (2013). Flipping the classroom. Vanderbilt University Center for Teaching. Retrieved from http://cft.vanderbilt.edu/guides-sub-pages/flipping-the-classroom/
Data Quality Campaign. (2014a). Roadmap for educator licensure policy addressing data literacy. Retrieved from https://dataqualitycampaign.org/resource/roadmap-educator-licensure-policy-addressing-data-literacy/
Data Quality Campaign. (2014b). Teacher data literacy: It’s about time. A brief for state policymakers. Retrieved from http://2pido73em67o3eytaq1cp8au.wpengine.netdna-cdn.com/wp-content/uploads/2016/03/DQC-Data-Literacy-Brief.pdf
Díaz, A., Rowshankish, K., & Saleh, T. (2018, September). Why data culture matters. McKinsey Analytics. Retrieved from https://www.mckinsey.com/business-functions/mckinsey-analytics/our-insights/why-data-culture-matters
Education Elements. (2018). Personalised learning: The present and future of education. Retrieved from https://www.edelements.com/personalized-learning
Freeman, A., Adams Becker, S., Cummins, M., Davis, A., & Hall Giesinger, C. (2017). NMC/CoSN horizon report: 2017 K–12 edition. The New Media Consortium.
Greany, K., & Niles-Hofmann, L. (2018). An everyday guide to learning analytics. How to use data to decode the digital body language of your audience and design elearning that works. Elucidat. Retrieved from https://elearningindustry.com/free-ebooks/everyday-guide-to-learning-analytics
Guerra-López, I. (2008). Performance evaluation: Proven approaches for improving program and organizational performance. Jossey Bass.
IBM. (2019). Extracting business value from the 4 V’s of big data. IBM Big Data & Analytics Hub. Retrieved from https://www.researchgate.net/figure/The-Four-Vs-of-Big-Data-and-Its-Value-IBM-2019_fig1_344303432
Ikemoto, G. S., & Marsh, J. A. (2007). Chapter 5 cutting through the "data-driven" mantra: Different conceptions of data-driven decision making. Yearbook of the National Society for the Study of Education, 106(1), 105–131. https://doi.org/10.1111/j.1744-7984.2007.00099.x
Inspectorate, Department of Education and Skills. (2016). School self-evaluation guidelines 2016–2020 primary. Department of Education and Skills.
Jisc. (2018, September 10). Canterbury Christ Church University. Jisc digital experience insights. Retrieved from https://digitalinsights.jisc.ac.uk/case-study-listing/canterbury-christ-church-university/
Johnson, L., Smith, R., Willis, H., Levine, A., & Haywood, K. (2011). The 2011 horizon report. The New Media Consortium.
Lai, M. K., & Schildkamp, K. (2013). Data-based decision making: An overview. In K. Schildkamp, M. K. Lai, & L. Earl (Eds.), Data-based decision making in education: Challenges and opportunities. Springer.
Long, P. D., & Siemens, G. (2011). Penetrating the fog: Analytics in learning and education. Educause Review, 46(5), 31–40.
Love, N. (2012). Data literacy for teachers. Hawker Brownlow Education. Retrieved form http://files.hbe.com.au/samplepages/NPR8884.pdf
Mandinach, E. B. (2012). A perfect time for data use: Using data-driven decision making to inform practice. Educational Psychologist, 47(2), 71–85. https://doi.org/10.1080/00461520.2012.667064
Mandinach, E. B., & Gummer, E. S. (2013). A systemic view of implementing data literacy in educator preparation. Educational Researcher, 42(1), 30–37. https://doi.org/10.3102/0013189X12459803
Marsh, J. A., Pane, J. F., & Hamilton, L. S. (2006). Making sense of data-driven decision making in education: Evidence from recent RAND research. RAND Corporation.
Obsidian Learning. (2018, October 16). ADDIE Model. Retrieved from https://www.obsidianlearning.com/projects/addie-model/
Panopto. (2015, January, 12). Infographic: The growth in flipped learning. Retrieved from https://www.panopto.com/blog/growth-in-flipped-learning-infographic/
Pettey, C. (2018, March 5). How data and analytics leaders learn to master information as a second language. Retrieved from https://www.gartner.com/smarterwithgartner/gartner-keynote-do-you-speak-data/
Reiser, R. A. (2001). A history of instructional design and technology: Part I: A history of instructional media author(s). Educational Technology Research and Development, 49(1), 53–64.
Ridsdale, C., Rothwell, J., Smit, M., Ali-Hassan, H., Bliemel, M., Irvine, D., Kelley, D., Matwin, S., & Wuetherick, B. (2015). Strategies and best practices for data literacy education: Knowledge synthesis report. Dalhousie University. https://doi.org/10.13140/RG.2.1.1922.5044
Romero, C., Romero, J. R., & Ventura, S. (2014). A survey on pre-processing educational data. In Educational data mining studies in computational intelligence (pp. 29–64). Springer. https://doi.org/10.1007/978-3-319-02738-8_2.
Rothwell, W. J., Benscoter, G. M., King, M., & King, S. B. (2016). Mastering the instructional design process: A systematic approach. John Wiley & Sons. Retrieved from https://www.wiley.com/en-us/Mastering+the+Instructional+Design+Process%3A+A+Systematic+Approach%2C+5th+Edition-p-9781118947142
School of Data. (2013). School of data handbook. Retrieved from https://schoolofdata.org/handbook/
Sclater, N., Peasgood, A., & Mullan, J. (2016). Learning Analytics in Higher Education: A review of UK and international practice. Full report. Jisc.
Shacklock, X. (2016). From bricks to clicks: The potential of data and analytics in higher education. Policy Connect – Higher Education Commission.
Useful Video Resources
External Video: What is Big Data and how does it work? [1:33].
External Video: Big Data’s Making Education Smarter [2:16].
External Video: Data is Power [2:32]
External Video: Engaging with students to build a better digital environment [2:56]
External Video: Educause: What Is Personalized Learning?[2:27].
External Video: Using big data to customize learning[3:08].
External Video: Data Driven Learning Design [5:35].
External Video: Data: It’s Just Part of Good Teaching [3:43].
External Video: How Data Help Teachers[1:51].
External Video: Data Can Help Every Student Excel [2:00].
External Video: The Flipped Classroom Model [3:00].
External Video: Why Personalized Learning: 4 Stories from 4 School Districts [3:41]
External Video: Develop a culture of data and analytics enablement at the summit [1:30].
External Video: Data for Lifelong Learning [2:49].
External Video: Bias when collecting data [5:59].
Further Reading
Baker, R. S., & Inventado, P. S. (2016). Educational data mining and learning analytics: Potentials and possibilities for online education. In G. Veletsianos (Ed.), Emergence and innovation in digital learning (pp. 83–98). https://doi.org/10.15215/aupress/9781771991490.01
Brown, M. (2012). Learning analytics: Moving from concept to practice. EDUCAUSE Learning Initiative.
Centre for Education Statistics and Evaluation. (2018). Using data with confidence. NSW Department of Education.
Chapman, C., & Sammons, P. (2013). School self-evaluation for school improvement: What works and why? Project Report. CfBT Education Trust, Reading.
Ellis, R. A., Han, F., & Pardo, A. (2017). Improving learning analytics – Combining observational and self-report data on student learning. Educational Technology & Society, 20(3), 158–169.
Friesen, N. (2013). Learning Analytics: Readiness and Rewards/L’analyse de l’apprentissage: état de préparation et récompenses. Canadian Journal of Learning and Technology/La revue canadienne de l’apprentissage et de la technologie, 39(4), 1–12.
Gendron, S. A., & Traub, S. (2015). Data: The guide on the path to personalized Learning for ALL students. International Center for Leadership in Education.
Goldring, E. B., & Berends, M. (2009). The importance of data-driven decision making. In Leading with data: Pathways to improve your school. Corwin Press.
Government Digital Service. (2017, April 05). How to make a freedom of information (FOI) request. Retrieved from https://www.gov.uk/make-a-freedom-of-information-request
Grant, P., & Basye, D. (2014). Personalized Learning: A guide for engaging students with technology. International Society for Technology in Education.
Hamilton, L., Halverson, R., Jackson, S. S., Mandinach, E., Supovitz, J. A., & Wayman, J. (2009). Using student achievement data to support instructional decision making (NCEE 2009–4067). National Center for Education Evaluation and Regional Assistance, Institute of Education Sciences, U.S. Department of Education.
HM Government. (2013). Seizing the data opportunity: A strategy for UK data capability. BIS.
Hora, M. T., Bouwma-Gearhart, J., Park, H. J. (2014). Exploring data-driven decision-making in the field: How faculty use data and other forms of information to guide instructional decision-making (WCER working paper no. 2014-3). Retrieved from https://files.eric.ed.gov/fulltext/ED556492.pdf
Houston, P. D. (2002). Using data to improve schools: What’s working. American Association of School Administrators.
Johnson, L., Adams, S., Cummins, M., Estrada, V., Freeman, A., & Ludgate, H. (2013). The NMC horizon report: 2013 higher. Education Edition. The New Media Consortium.
Johnson, L., Adams Becker, S., Estrada, V., & Freeman, A. (2015). NMC horizon report: 2015 K-12 edition. The New Media Consortium.
Khalil, M., & Ebner, M. (2015). Learning analytics: Principles and constraints. https://doi.org/10.13140/RG.2.1.1733.2083
Lancy, D. (2001). 3D data management: Controlling data volume, velocity, and variety. META Group.
Lewis, J. (2014). Next gen tools. Strategies and Innovations for Implementing Breakthrough Models. Blended Learning Classroom Design. EDUCAUSE. Retrieved from https://s3.amazonaws.com/nglc/resource-files/NGB1405-pdf.pdf
Mandinach, E. (2013, September 17). Data literacy vs. assessment literacy. [Blog post]. Retrieved from https://www.msdf.org/blog/2013/09/ellen-mandinach-data-literacy-vs-assessment-literacy/
Marsh, J. A., & Farrell, C. C. (2015). How leaders can support teachers with data-driven decision making: A framework for understanding capacity building. Educational Management Administration & Leadership, 43(2), 269–289. https://doi.org/10.1177/1741143214537229
Martin, J. (2010, August 4). Aligning data collection with school mission: Preparing for DoE ONPE Panel. [Blog post]. Retrieved from https://21k12blog.net/2010/08/04/aligning-data-collection-with-school-mission-preparing-for-doe-onpe-panel/#more-1913
Matters, G. (2006). Using data to support learning in schools: Students, teachers, systems. ACER Press.
McIntosh, K., Horner, R. H., & Sugai, G. M. (2009). Sustainability of systems-level evidence-based practices in schools: Current knowledge and future directions. In W. Sailor, G. Dunlap, G. M. Sugai, & R. Horner (Eds.), Handbook of positive behavior support (pp. 327–352). Springer. https://doi.org/10.1007/978-0-387-09632-2_14
Means, B., Chen, E., DeBarger, A., & Padilla, C. (2011). Teachers’ ability to use data to inform instruction: Challenges and supports. Office of Planning. Retrieved from https://files.eric.ed.gov/fulltext/ED516494.pdf
MOEduSAIL – Educational Systems and Instruction for Learning. (2019). Data-based decision making for teacher teams. Retrieved from http://www.moedu-sail.org/dbdm-materials/
Mor, Y., Ferguson, R., & Wasson, B. (2015). Editorial: Learning design, teacher inquiry into student learning and learning analytics: A call for action: Learning design, TISL and learning analytics. British Journal of Educational Technology, 46(2), 221–229. https://doi.org/10.1111/bjet.12273
Next Generation Learning Challenges. (2017). New designs for school. What does next generation learning look like in practice? EDUCAUSE. Retrieved from http://nextgenlearning.org/personalized-learning
Niles-Hofmann, L. (2016). Data-driven Learning design. How to decode learner digital body language. Retrieved from http://www.loriniles.com/ebook/
Pane, J. F., Steiner, E. D., Baird, M. D., & Hamilton, L. S. (2015). Continued progress: Promising evidence on personalized Learning. RAND Corporation.
Pane, J. F., Steiner, E. D., Baird, M. D., Hamilton, L. S., & Pane, J. D. (2017). Informing Progress: Insights on personalized Learning implementation and effects. RAND Corporation.
Peersman, G. (2014). Overview: Data collection and analysis methods in impact evaluation: Methodological briefs – impact evaluation no. 10, methodological Briefs no. 10.
Qi, J., & Coogan, P. (2015). Leveraging canvas participation data to inform course design. Dartmouth College. Retrieved from https://cpb-us-e1.wpmucdn.com/sites.dartmouth.edu/dist/c/571/files/2015/04/LeveragingCanvasData1.pdf
Qi, J., & Esco, J. (2017). Leveraging Canvas learning data to inform MOOC design. Retrieved from https://cpb-us-e1.wpmucdn.com/sites.dartmouth.edu/dist/c/571/files/2015/04/IC17Presentation.pdf
Rajbhandari, L., & Schober, J. (2013). Data warehouse and analytics discussion paper. Northwestern University.
Renshaw, P., Baroutsis, A., van Kraayenoord, C., Goos, M., & Dole, S. (2013). Teachers using classroom data well: Identifying key features of effective practices. Final report. The University of Queensland.
Reyes, J. A. (2015). The skinny on big data in education: Learning analytics simplified. TechTrends, 59(2), 75–80. https://doi.org/10.1007/s11528-015-0842-1
Schildkamp, K., Poortman, C., Luyten, H., & Ebbeler, J. (2017). Factors promoting and hindering data-based decision making in schools. School Effectiveness and School Improvement, 28(2), 242–258. https://doi.org/10.1080/09243453.2016.1256901
Spearman, M. M. (2019). Using evidence based interventions & practices: A process guide for improvement. State of South Carolina Department of Education.
Treser, M. (2015). Elearning industry: Getting to know ADDIE. Retrieved from https://elearningindustry.com/getting-know-addie-analysis
Vai, M., & Sosulski, K. (2011). Essentials of online course design: A standards-based guide (2nd ed.). Routledge.
Verbert, K., Manouselis, N., Drachsler, H., & Duval, E. (2012). Dataset-driven research to support learning and knowledge analytics [electronic version]. Educational Technology & Society, 15(3), 133–148.
Wagner, E., & Ice, P. (2012). Data changes everything: Delivering on the promise of learning analytics in higher education. Educause Review, 47(4), 32–36.
Williams, K. C. (2018). Top five business trends impacting K-12 education in 2018. Gartner. Retrieved from https://emtemp.gcom.cloud/ngw/globalassets/en/research/documents/top-five-business-trends-impacting-k-12-education-in-2018-3847265-344453.pdf
Yupangco, J. (2017, December 21). What sources of learning analytics should you be collecting? Retrieved from https://elearningindustry.com/sources-of-learning-analytics-should-collecting
Author information
Authors and Affiliations
Rights and permissions
Open Access This chapter is licensed under the terms of the Creative Commons Attribution 4.0 International License (http://creativecommons.org/licenses/by/4.0/), which permits use, sharing, adaptation, distribution and reproduction in any medium or format, as long as you give appropriate credit to the original author(s) and the source, provide a link to the Creative Commons license and indicate if changes were made.
The images or other third party material in this chapter are included in the chapter's Creative Commons license, unless indicated otherwise in a credit line to the material. If material is not included in the chapter's Creative Commons license and your intended use is not permitted by statutory regulation or exceeds the permitted use, you will need to obtain permission directly from the copyright holder.
Copyright information
© 2023 The Author(s)
About this chapter

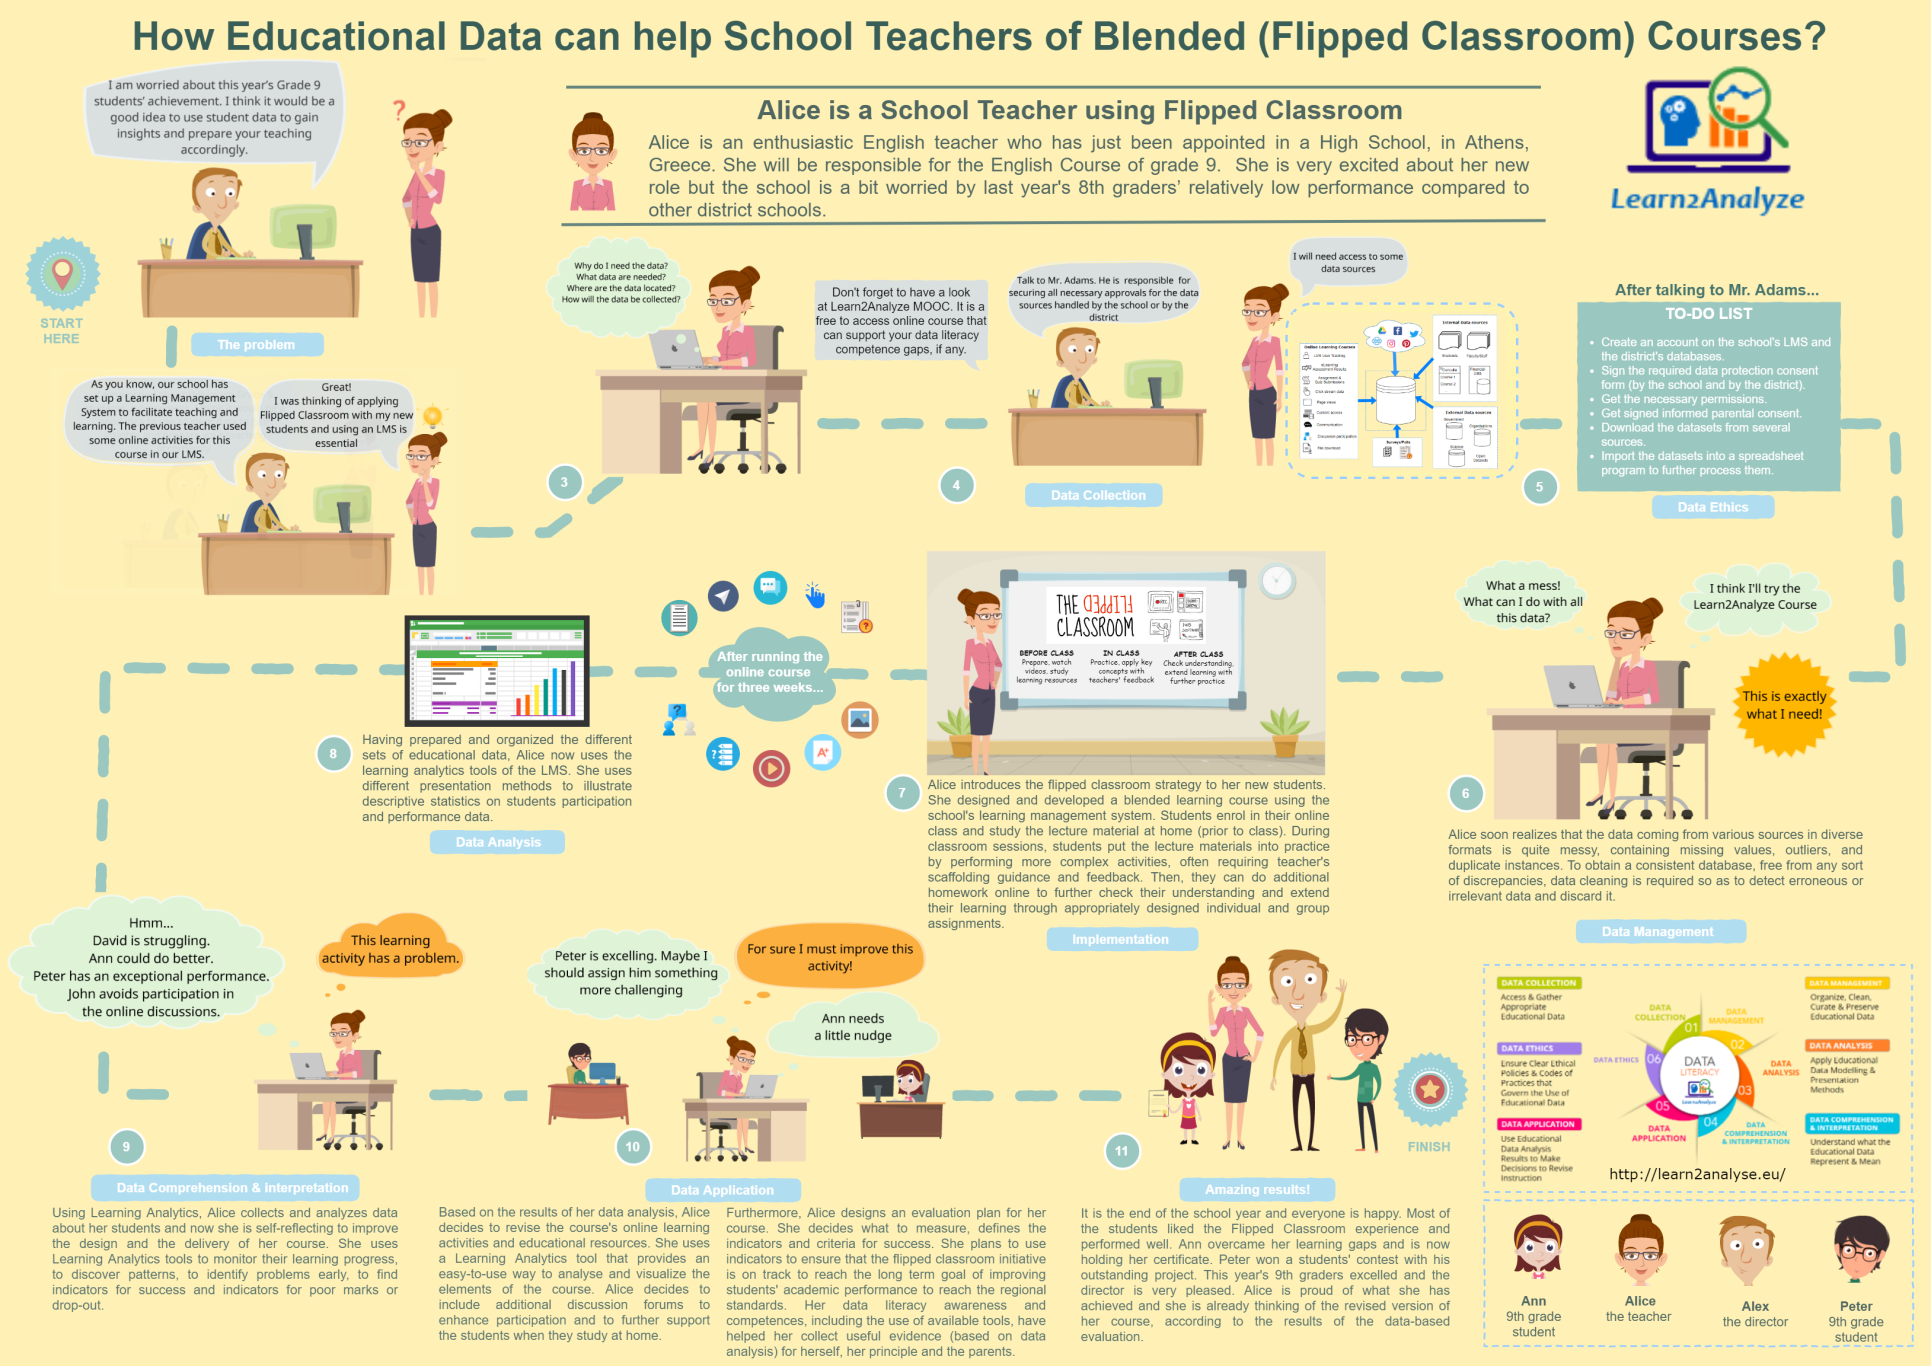
Cite this chapter
Mougiakou, S., Vinatsella, D., Sampson, D., Papamitsiou, Z., Giannakos, M., Ifenthaler, D. (2023). Online and Blended Teaching and Learning Supported by Educational Data. In: Educational Data Analytics for Teachers and School Leaders. Advances in Analytics for Learning and Teaching. Springer, Cham. https://doi.org/10.1007/978-3-031-15266-5_1
Download citation
DOI: https://doi.org/10.1007/978-3-031-15266-5_1
Published:
Publisher Name: Springer, Cham
Print ISBN: 978-3-031-15265-8
Online ISBN: 978-3-031-15266-5
eBook Packages: EducationEducation (R0)