
Abstract
Every day, we encounter various phenomena that make us question how, why, and with what implications they vary. In responding to these questions, we often begin by considering bivariate relationships, meaning the way that two variables relate to one another. Such relationships are the focus of this chapter.
You have full access to this open access chapter, Download chapter PDF
3.1 Description, Explanation, and Causal Stories
Every day, we encounter various phenomena that make us question how, why, and with what implications they vary. In responding to these questions, we often begin by considering bivariate relationships, meaning the way that two variables relate to one another. Such relationships are the focus of this chapter.
There are many reasons why we might be interested in the relationship between two variables. Suppose we observe that some of the respondents interviewed in Arab Barometer surveys and other surveys report that they have thought about emigrating, and we are interested in this variable. We may want to know how individuals’ consideration of emigration varies in relation to certain attributes or attitudes. In this case, our goal would be descriptive, sometimes described as the mapping of variance. Our goal may also or instead be explanation, such as when we want to know why individuals have thought about emigrating.
Description
Description means that we seek to increase our knowledge and refine our understanding of a single variable by looking at whether and how it varies in relation to one or more other variables. Descriptive information makes a valuable contribution when the structure and variance of an important phenomenon are not well known, or not well known in relation to other important variables.
Returning to the example about emigration, suppose you notice that among Jordanians interviewed in 2018, 39.5 percent of the 2400 men and women interviewed reported that they have considered the possibility of emigrating.
Our objective may be to discover what these might-be migrants look like and what they are thinking. We do this by mapping the variance of emigration across attributes and orientations that provide some of this descriptive information, with the descriptions themselves each expressed as bivariate relationships. These relationships are also sometimes labeled “associations” or “correlations” since they are not considered causal relationships and are not concerned with explanation.
Of the 39.5 percent of Jordanians who told interviewers that they have considered emigrating, 57.3 percent are men and 42.7 percent are women. With respect to age, 34 percent are age 29 or younger and 19.2 percent are age 50 or older. It might have been expected that a higher percentage of respondents age 29 or younger would have considered emigrating. In fact, however, 56 percent of the 575 men and women in this age category have considered emigrating. And with respect to destination, the Arab country most frequently mentioned by those who have considered emigration is the UAE, named by 17 percent, followed by Qatar at 10 percent and Saudi Arabia at 9.8 percent. Non-Arab destinations were mentioned more frequently, with Turkey named by 18.1 percent, Canada by 21.1 percent, and the U.S. by 24.2 percent.
With the variables sex, age, and prospective destination added to the original variable, which is consideration of emigration, there are clearly more than two variables under consideration. But the variables are described two at a time and so each relationship is bivariate.
These bivariate relationships, between having considered emigration on the one hand and sex, age, and prospective destination on the other, provide descriptive information that is likely to be useful to analysts, policymakers, and others concerned with emigration. They tell, or begin to tell, as noted above, what might-be migrants look like and what they are thinking. Still additional insight may be gained by adding descriptive bivariate relationships for Jordanians interviewed in a different year to those interviewed in 2018. In addition, of course, still more information and possibly a more refined understanding, may be gained by examining the attributes and orientations of prospective emigrants who are citizens of other Arab (and perhaps also non-Arab) countries.
With a focus on description, these bivariate relationships are not constructed to shed light on explanation, that is to contribute to causal stories that seek to account for variance and tell why some individuals but not others have considered the possibility of emigrating. In fact, however, as useful as bivariate relationships that provide descriptive information may be, researchers usually are interested as much if not more in bivariate relationships that express causal stories and purport to provide explanations.
Explanation and Causal Stories
There is a difference in the origins of bivariate relationships that seek to provide descriptive information and those that seek to provide explanatory information. The former can be thought to be responding to what questions: What characterizes potential emigrants? What do they look like? What are their thoughts about this or that subject? If the objective is description, a researcher collects and uses her data to investigate the relationship between two variables without a specific and firm prediction about the relationship between them. Rather, she simply wonders about the “what” questions listed above and believes that finding out the answers will be instructive. In this case, therefore, she selects the bivariate relationships to be considered based on what she thinks it will be useful to know, and not based on assessing the accuracy of a previously articulated causal story that specifies the strength and structure of the effect that one variable has on the other.
A researcher is often interested in causal stories and explanation, however, and this does usually begin with thinking about the relationship between two variables, one of which is the presumed cause and the other the presumed effect. The presumed cause is the independent variable, and the presumed effect is the dependent variable. Offering evidence that there is a strong relationship between two variables is not sufficient to demonstrate that the variables are likely to be causally related, but it is a necessary first step. In this respect it is a point of departure for the fuller, probably multivariate analysis, required to persuasively argue that a relationship is likely to be causal. In addition, as discussed in Chap. 4, multivariate analysis often not only strengthens the case for inferring that a relationship is causal, but also provides a more elaborate and more instructive causal story. The foundation, however, on which a multivariate analysis aimed at causal inference is built, is a bivariate relationship composed of a presumed independent variable and a presumed dependent variable.
A hypothesis that posits a causal relationship between two variables is not the same as a causal story, although the two are of course closely connected. The former specifies a presumed cause, a presumed determinant of variance on the dependent variable. It probably also specifies the structure of the relationship, such as linear as opposed to non-linear, or positive (also called direct) as opposed to negative (also called inverse).
On the other hand, a causal story describes in more detail what the researcher believes is actually taking place in the relationship between the variables in her hypothesis; and accordingly, why she thinks this involves causality. A causal story provides a fuller account of operative processes, processes that the hypothesis references but does not spell out. These processes may, for example, involve a pathway or a mechanism that tells how it is that the independent variable causes and thus accounts for some of the variance on the dependent variable. Expressed yet another way, the causal story describes the researcher’s understandings, or best guesses, about the real world, understandings that have led her to believe, and then propose for testing, that there is a causal connection between her variables that deserves investigation. The hypothesis itself does not tell this story; it is rather a short formulation that references and calls attention to the existence, or hypothesized existence, of a causal story. Research reports present the causal story as well as the hypothesis, as the hypothesis is often of limited interpretability without the causal story.
A causal story is necessary for causal inference. It enables the researcher to formulate propositions that purport to explain rather than merely describe or predict. There may be a strong relationship between two variables, and if this is the case, it will be possible to predict with relative accuracy the value, or score, of one variable from knowledge of the value, or score, of the other variable. Prediction is not explanation, however. To explain, or attribute causality, there must be a causal story to which a hypothesized causal relationship is calling attention.
An instructive illustration is provided by a recent study of Palestinian participation in protest activities that express opposition to Israeli occupation.Footnote 1 There is plenty of variance on the dependent variable: There are many young Palestinians who take part in these activities, and there are many others who do not take part. Education is one of the independent variables that the researcher thought would be an important determinant of participation, and so she hypothesized that individuals with more education would be more likely to participate in protest activities than individuals with less education.
But why would the researcher think this? The answer is provided by the causal story. To the extent that this as yet untested story is plausible, or preferably, persuasive, at least in the eyes of the investigator, it gives the researcher a reason to believe that education is indeed a determinant of participation in protest activities in Palestine. By spelling out in some detail how and why the hypothesized independent variable, education in this case, very likely impacts a person’s decision about whether or not to protest, the causal story provides a rationale for the researcher’s hypothesis.
In the case of Palestinian participation in protest activities, another investigator offered an insightful causal story about the ways that education pushes toward greater participation, with emphasis on its role in communication and coordination.Footnote 2 Schooling, as the researcher theorizes and subsequently tests, integrates young Palestinians into a broader institutional environment that facilitates mass mobilizations and lowers informational and organizational barriers to collective action. More specifically, she proposes that those individuals who have had at least a middle school education, compared to those who have not finished middle school, have access to better and more reliable sources of information, which, among other things, enables would-be protesters to assess risks. More schooling also makes would-be protesters better able to forge inter-personal relationships and establish networks that share information about needs, opportunities, and risks, and that in this way facilitate engaging in protest activities in groups, rather than on an individual basis. This study offers some additional insights to be discussed later.
The variance motivating the investigation of a causal story may be thought of as the “variable of interest,” and it may be either an independent variable or a dependent variable. It is a variable of interest because the way that it varies poses a question, or puzzle, that a researcher seeks to investigate. It is the dependent variable in a bivariate relationship if the researcher seeks to know why this variable behaves, or varies, as it does, and in pursuit of this objective, she will seek to identify the determinants and drivers that account for this variance. The variable of interest is an independent variable in a particular research project if the researcher seeks to know what difference it makes—on what does its variance have an impact, of what other variable or variables is it a driver or determinant.
The variable in which a researcher is initially interested, that is to say the variable of interest, can also be both a dependent variable and an independent variable. Returning to the variable pertaining to consideration of emigration, but this time with country as the unit of analysis, the variance depicted in Table 3.1 provides an instructive example. The data are based on Arab Barometer surveys conducted in 2018–2019, and the table shows that there is substantial variation across twelve countries. Taking the countries together, the mean percentage of citizens that have thought about relocating to another country is 30.25 percent. But in fact, there is very substantial variation around this mean. Kuwait is an outlier, with only 8 percent having considered emigration. There are also countries in which only 21 percent or 22 percent of the adult population have thought about this, figures that may be high in absolute terms but are low relative to other Arab countries. At the other end of the spectrum are countries in which 45 percent or even 50 percent of the citizens report having considered leaving their country and relocating elsewhere.
The very substantial variance shown in Table 3.1 invites reflection on both the causes and the consequences of this country-level variable, aggregate thinking about emigration. As a dependent variable, the cross-country variance brings the question of why the proportion of citizens that have thought about emigrating is higher in some countries than in others; and the search for an answer begins with the specification of one or more bivariate relationships, each of which links this dependent variable to a possible cause or determinant. As an independent variable, the cross-country variance brings the question of what difference does it make—of what is it a determinant or driver and what are the consequences for a country if more of its citizens, rather than fewer, have thought about moving to another country.
3.2 Hypotheses and Formulating Hypotheses
Hypotheses emerge from the research questions to which a study is devoted. Accordingly, a researcher interested in explanation will have something specific in mind when she decides to hypothesize and then evaluate a bivariate relationship in order to determine whether, and if so how, her variable of interest is related to another variable. For example, if the researcher’s variable of interest is attitude toward gender equality and one of her research questions asks why some people support gender equality and others do not, she might formulate the hypothesis below to see if education provides part of the answer.
-
Hypothesis 1. Individuals who are better educated are more likely to support gender equality than are individuals who are less well-educated.
The usual case, and the preferred case, is for an investigator to be specific about the research questions she seeks to answer, and then to formulate hypotheses that propose for testing part of the answer to one or more of these questions. Sometimes, however, a researcher will proceed without formulating specific hypotheses based on her research questions. Sometimes she will simply look at whatever relationships between her variable of interest and a second variable her data permit her to identify and examine, and she will then follow up and incorporate into her study any findings that turn out to be significant and potentially instructive. This is sometimes described as allowing the data to “speak.” When this hit or miss strategy of trial and error is used in bivariate and multivariate analysis, findings that are significant and potentially instructive are sometimes described as “grounded theory.” Some researchers also describe the latter process as “inductive” and the former as “deductive.”
Although the inductive, atheoretical approach to data analysis might yield some worthwhile findings that would otherwise have been missed, it can sometimes prove misleading, as you may discover relationships between variables that happened by pure chance and are not instructive about the variable of interest or research question. Data analysis in research aimed at explanation should be, in most cases, preceded by the formulation of one or more hypotheses. In this context, when the focus is on bivariate relationships and the objective is explanation rather than description, each hypothesis will include a dependent variable and an independent variable and make explicit the way the researcher thinks the two are, or probably are, related. As discussed, the dependent variable is the presumed effect; its variance is what a hypothesis seeks to explain. The independent variable is the presumed cause; its impact on the variance of another variable is what the hypothesis seeks to determine.
Hypotheses are usually in the form of if-then, or cause-and-effect, propositions. They posit that if there is variance on the independent variable, the presumed cause, there will then be variance on the dependent variable, the presumed effect. This is because the former impacts the latter and causes it to vary.
An illustration of formulating hypotheses is provided by a study of voting behavior in seven Arab countries: Algeria, Bahrain, Jordan, Lebanon, Morocco, Palestine, and Yemen.Footnote 3 The variable of interest in this individual-level study is electoral turnout, and prominent among the research questions is why some citizens vote and others do not. The dependent variable in the hypotheses proposed in response to this question is whether a person did or did not vote in the country’s most recent parliamentary election. The study initially proposed a number of hypotheses, which include the two listed here and which would later be tested with data from Arab Barometer surveys in the seven countries in 2006–2007. We will return to this illustration later in this chapter.
-
Hypothesis 1: Individuals who have used clientelist networks in the past are more likely to turn out to vote than are individuals who have not used clientelist networks in the past.
-
Hypothesis 2: Individuals with a positive evaluation of the economy are more likely to vote than are individuals with a negative evaluation of the economy.
Another example pertaining to voting, which this time is hypothetical but might be instructively tested with Arab Barometer data, considers the relationship between perceived corruption and turning out to vote at the individual level of analysis.
The normal expectation in this case would be that perceptions of corruption influence the likelihood of voting. Even here, however, competing causal relationships are plausible. More perceived corruption might increase the likelihood of voting, presumably to register discontent with those in power. But greater perceived corruption might also actually reduce the likelihood of voting, presumably in this case because the would-be voter sees no chance that her vote will make a difference. But in this hypothetical case, even the direction of the causal connection might be ambiguous. If voting is complicated, cumbersome, and overly bureaucratic, it might be that the experience of voting plays a role in shaping perceptions of corruption. In cases like this, certain variables might be both independent and dependent variables, with causal influence pushing in both directions (often called “endogeneity”), and the researcher will need to carefully think through and be particularly clear about the causal story to which her hypothesis is designed to call attention.
The need to assess the accuracy of these hypotheses, or any others proposed to account for variance on a dependent variable, will guide and shape the researcher’s subsequent decisions about data collection and data analysis. Moreover, in most cases, the finding produced by data analysis is not a statement that the hypothesis is true or that the hypothesis is false. It is rather a statement that the hypothesis is probably true or it is probably false. And more specifically still, when testing a hypothesis with quantitative data, it is often a statement about the odds, or probability, that the researcher will be wrong if she concludes that the hypothesis is correct—if she concludes that the independent variable in the hypothesis is indeed a significant determinant of the variance on the dependent variable. The lower the probability of being wrong, of course, the more confident a researcher can be in concluding, and reporting, that her data and analysis confirm her hypothesis.
Exercise 3.1
Hypotheses emerge from the research questions to which a study is devoted. Thinking about one or more countries with which you are familiar: (a) Identify the independent and dependent variables in each of the example research questions below. (b) Formulate at least one hypothesis for each question. Make sure to include your expectations about the directionality of the relationship between the two variables; is it positive/direct or negative/inverse? (c) In two or three sentences, describe a plausible causal story to which each of your hypotheses might call attention.
-
1.
Does religiosity affect people’s preference for democracy?
-
2.
Does preference for democracy affect the likelihood that a person will vote?Footnote 4
Exercise 3.2
Since its establishment in 2006, the Arab Barometer has, as of spring 2022, conducted 68 social and political attitude surveys in the Middle East and North Africa. It has conducted one or more surveys in 16 different Arab countries, and it has recorded the attitudes, values, and preferences of more than 100,000 ordinary citizens.
The Arab Barometer website (arabbarometer.org) provides detailed information about the Barometer itself and about the scope, methodology, and conduct of its surveys. Data from the Barometer’s surveys can be downloaded in either SPSS, Stata, or csv format. The website also contains numerous reports, articles, and summaries of findings.
In addition, the Arab Barometer website contains an Online Data Analysis Tool that makes it possible, without downloading any data, to find the distribution of responses to any question asked in any country in any wave. The tool is found in the “Survey Data” menu. After selecting the country and wave of interest, click the “See Results” tab to select the question(s) for which you want to see the response distributions. Click the “Cross by” tab to see the distributions of respondents who differ on one of the available demographic attributes.
The charts below present, in percentages, the response distributions of Jordanians interviewed in 2018 to two questions about gender equality. Below the charts are questions that you are asked to answer. These questions pertain to formulating hypotheses and to the relationship between hypotheses and causal stories.


-
1.
For each of the two distributions, do you think (hypothesize) that the attitudes of Jordanian women are:
-
(a)
About the same as those of Jordanian men
-
(b)
More favorable toward gender equality than those of Jordanian men
-
(c)
Less favorable toward gender equality than those of Jordanian men
-
(a)
-
2.
For each of the two distributions, do you think (hypothesize) that the attitudes of younger Jordanians are:
-
(a)
About the same as those of older Jordanians
-
(b)
More favorable toward gender equality than those of older Jordanians
-
(c)
Less favorable toward gender equality than those of older Jordanians
-
(a)
-
3.
Restate your answers to Questions 1 and 2 as hypotheses.
-
4.
Give the reasons for your answers to Questions 1 and 2. In two or three sentences, make explicit the presumed causal story on which your hypotheses are based.
-
5.
Using the Arab Barometer’s Online Analysis Tool, check to see whether your answers to Questions 1 and 2 are correct. For those instances in which an answer is incorrect, suggest in a sentence or two a causal story on which the correct relationship might be based.
-
6.
In which other country surveyed by the Arab Barometer in 2018 do you think the distributions of responses to the questions about gender equality are very similar to the distributions in Jordan? What attributes of Jordan and the other country informed your selection of the other country?
-
7.
In which other country surveyed by the Arab Barometer in 2018 do you think the distributions of responses to the questions about gender equality are very different from the distributions in Jordan? What attributes of Jordan and the other country informed your selection of the other country?
-
8.
Using the Arab Barometer’s Online Analysis Tool, check to see whether your answers to Questions 6 and 7 are correct. For those instances in which an answer is incorrect, suggest in a sentence or two a causal story on which the correct relationship might be based.
We will shortly return to and expand the discussion of probabilities and of hypothesis testing more generally. First, however, some additional discussion of hypothesis formulation is in order. Three important topics will be briefly considered. The first concerns the origins of hypotheses; the second concerns the criteria by which the value of a particular hypothesis or set of hypotheses should be evaluated; and the third, requiring a bit more discussion, concerns the structure of the hypothesized relationship between an independent variable and a dependent variable, or between any two variables that are hypothesized to be related.
Origins of Hypotheses
Where do hypotheses come from? How should an investigator identify independent variables that may account for much, or at least some, of the variance on a dependent variable that she has observed and in which she is interested? Or, how should an investigator identify dependent variables whose variance has been determined, presumably only in part, by an independent variable whose impact she deems it important to assess.
Previous research is one place the investigator may look for ideas that will shape her hypotheses and the associated causal stories. This may include previous hypothesis-testing research, and this can be particularly instructive, but it may also include less systematic and structured observations, reports, and testimonies. The point, very simply, is that the investigator almost certainly is not the first person to think about, and offer information and insight about, the topic and questions in which the researcher herself is interested. Accordingly, attention to what is already known will very likely give the researcher some guidance and ideas as she strives for originality and significance in delineating the relationship between the variables in which she is interested.
Consulting previous research will also enable the researcher to determine what her study will add to what is already known—what it will contribute to the collective and cumulative work of researchers and others who seek to reduce uncertainty about a topic in which they share an interest. Perhaps the researcher’s study will fill an important gap in the scientific literature. Perhaps it will challenge and refine, or perhaps even place in doubt, distributions and explanations of variance that have thus far been accepted. Or perhaps her study will produce findings that shed light on the generalizability or scope conditions of previously accepted variable relationships. It need not do any of these things, but that will be for the researcher to decide, and her decision will be informed by knowledge of what is already known and reflection on whether and in what ways her study should seek to add to that body of knowledge.
Personal experience will also inform the researcher’s search for meaningful and informative hypotheses. It is almost certainly the case that a researcher’s interest in a topic in general, and in questions pertaining to this topic in particular, have been shaped by her own experience. The experience itself may involve many different kinds of connections or interactions, some more professional and work-related and some flowing simply and perhaps unintentionally from lived experience. The hypotheses about voting mentioned earlier, for example, might be informed by elections the researcher has witnessed and/or discussions with friends and colleagues about elections, their turnout, and their fairness. Or perhaps the researcher’s experience in her home country has planted questions about the generalizability of what she has witnessed at home.
All of this is to some extent obvious. But the take-away is that an investigator should not endeavor to set aside what she has learned about a topic in the name of objectivity, but rather, she should embrace whatever personal experience has taught her as she selects and refines the puzzles and propositions she will investigate. Should it happen that her experience leads her to incorrect or perhaps distorted understandings, this will be brought to light when her hypotheses are tested. It is in the testing that objectivity is paramount. In hypothesis formation, by contrast, subjectivity is permissible, and, in fact, it may often be unavoidable.
A final arena in which an investigator may look for ideas that will shape her hypotheses overlaps with personal experience and is also to some extent obvious. This is referenced by terms like creativity and originality and is perhaps best captured by the term “sociological imagination.” The take-away here is that hypotheses that deserve attention and, if confirmed, will provide important insights, may not all be somewhere out in the environment waiting to be found, either in the relevant scholarly literature or in recollections about relevant personal experience. They can and sometimes will be the product of imagination and wondering, of discernments that a researcher may come upon during moments of reflection and deliberation.
As in the case of personal experience, the point to be retained is that hypothesis formation may not only be a process of discovery, of finding the previous research that contains the right information. Hypothesis formation may also be a creative process, a process whereby new insights and proposed original understandings are the product of an investigator’s intellect and sociological imagination.
Crafting Valuable Hypotheses
What are the criteria by which the value of a hypothesis or set of hypotheses should be evaluated? What elements define a good hypothesis? Some of the answers to these questions that come immediately to mind pertain to hypothesis testing rather than hypothesis formation. A good hypothesis, it might be argued, is one that is subsequently confirmed. But whether or not a confirmed hypothesis makes a positive contribution depends on the nature of the hypothesis and goals of the research. It is possible that a researcher will learn as much, and possibly even more, from findings that lead to rejection of a hypothesis. In any event, findings, whatever they may be, are valuable only to the extent that the hypothesis being tested is itself worthy of study.
Two important considerations, albeit somewhat obvious ones, are that a hypothesis should be non-trivial and non-obvious. If a proposition is trivial, suggesting a variable relationship with little or no significance, discovering whether and how the variables it brings together are related will not make a meaningful contribution to knowledge about the determinants and/or impact of the variance at the heart of the researcher’s concern. Few will be interested in findings, however rigorously derived, about a trivial proposition. The same is true of an obvious hypothesis, obvious being an attribute that makes a proposition trivial. As stated, these considerations are themselves somewhat obvious, barely deserving mention. Nevertheless, an investigator should self-consciously reflect on these criteria when formulating hypotheses. She should be sure that she is proposing variable relationships that are neither trivial nor obvious.
A third criterion, also somewhat obvious but nonetheless essential, has to do with the significance and salience of the variables being considered. Will findings from research about these variables be important and valuable, and perhaps also useful? If the primary variable of interest is a dependent variable, meaning that the primary goal of the research is to account for variance, then the significance and salience of the dependent variable will determine the value of the research. Similarly, if the primary variable of interest is an independent variable, meaning that the primary goal of the research is to determine and assess impact, then the significance and salience of the independent variable will determine the value of the research.
These three criteria—non-trivial, non-obvious, and variable importance and salience—are not very different from one another. They collectively mean that the researcher must be able to specify why and how the testing of her hypothesis, or hypotheses, will make a contribution of value. Perhaps her propositions are original or innovative; perhaps knowing whether they are true or false makes a difference or will be of practical benefit; perhaps her findings add something specific and identifiable to the body of existing scholarly literature on the subject. While calling attention to these three connected and overlapping criteria might seem unnecessary since they are indeed somewhat obvious, it remains the case that the value of a hypothesis, regardless of whether or not it is eventually confirmed, is itself important to consider, and an investigator should, therefore, know and be able to articulate the reasons and ways that consideration of her hypothesis, or hypotheses, will indeed be of value.
Hypothesizing the Structure of a Relationship
Relevant in the process of hypothesis formation are, as discussed, questions about the origins of hypotheses and the criteria by which the value of any particular hypothesis or set of hypotheses will be evaluated. Relevant, too, is consideration of the structure of a hypothesized variable relationship and the causal story to which that relationship is believed to call attention.
The point of departure in considering the structure of a hypothesized variable relationship is an understanding that such a relationship may or may not be linear. In a direct, or positive, linear relationship, each increase in the independent variable brings a constant increase in the dependent variable. In an inverse, or negative, linear relationship, each increase in the independent variable brings a constant decrease in the dependent variable. But these are only two of the many ways that an independent variable and a dependent variable may be related, or hypothesized to be related. This is easily illustrated by hypotheses in which level of education or age is the independent variable, and this is relevant in hypothesis formation because the investigator must be alert to and consider the possibility that the variables in which she is interested are in fact related in a non-linear way.
Consider, for example, the relationship between age and support for gender equality, the latter measured by an index based on several questions about the rights and behavior of women that are asked in Arab Barometer surveys. A researcher might expect, and might therefore want to hypothesize, that an increase in age brings increased support for, or alternatively increased opposition to, gender equality. But these are not the only possibilities. Likely, perhaps, is the possibility of a curvilinear relationship, in which case increases in age bring increases in support for gender equality until a person reaches a certain age, maybe 40, 45, or 50, after which additional increases in age bring decreases in support for gender equality. Or the researcher might hypothesize that the curve is in the opposite direction, that support for gender equality initially decreases as a function of age until a particular age is reached, after which additional increases in age bring an increase in support.
Of course, there are also other possibilities. In the case of education and gender equality, for example, increased education may initially have no impact on attitudes toward gender equality. Individuals who have not finished primary school, those who have finished primary school, and those who have gone somewhat beyond primary school and completed a middle school program may all have roughly the same attitudes toward gender equality. Thus, increases in education, within a certain range of educational levels, are not expected to bring an increase or a decrease in support for gender equality. But the level of support for gender equality among high school graduates may be higher and among university graduates may be higher still. Accordingly, in this hypothetical illustration, an increase in education does bring increased support for gender equality but only beginning after middle school.
A middle school level of education is a “floor” in this example. Education does not begin to make a difference until this floor is reached, and thereafter it does make a difference, with increases in education beyond middle school bringing increases in support for gender equality. Another possibility might be for middle school to be a “ceiling.” This would mean that increases in education through middle school would bring increases in support for gender equality, but the trend would not continue beyond middle school. In other words, level of education makes a difference and appears to have explanatory power only until, and so not after, this ceiling is reached. This latter pattern was found in the study of education and Palestinian protest activity discussed earlier. Increases in education through middle school brought increases in the likelihood that an individual would participate in demonstrations and protests of Israeli occupation. However, additional education beyond middle school was not associated with greater likelihood of taking part in protest activities.
This discussion of variation in the structure of a hypothesized relationship between two variables is certainly not exhaustive, and the examples themselves are straightforward and not very complicated. The purpose of the discussion is, therefore, to emphasize that an investigator must be open to and think through the possibility and plausibility of different kinds of relationships between her two variables, that is to say, relationships with different structures. Bivariate relationships with several different kinds of structures are depicted visually by the scatter plots in Fig. 3.4.
These possibilities with respect to structure do not determine the value of a proposed hypothesis. As discussed earlier, the value of a proposed relationship depends first and foremost on the importance and salience of the variable of interest. Accordingly, a researcher should not assume that the value of a hypothesis varies as a function of the degree to which it posits a complicated variable relationship. More complicated hypotheses are not necessarily better or more correct. But while she should not strive for or give preference to variable relationships that are more complicated simply because they are more complicated, she should, again, be alert to the possibility that a more complicated pattern does a better job of describing the causal connection between the two variables in the place and time in which she is interested.
This brings the discussion of formulating hypotheses back to our earlier account of causal stories. In research concerned with explanation and causality, a hypothesis for the most part is a simplified stand-in for a causal story. It represents the causal story, as it were. Expressing this differently, the hypothesis states the causal story’s “bottom line;” it posits that the independent variable is a determinant of variance on the dependent variable, and it identifies the structure of the presumed relationship between the independent variable and the dependent variable. But it does not describe the interaction between the two variables in a way that tells consumers of the study why the researcher believes that the relationship involves causality rather than an association with no causal implications. This is left to the causal story, which will offer a fuller account of the way the presumed cause impacts the presumed effect.
3.3 Describing and Visually Representing Bivariate Relationships
Once a researcher has collected or otherwise obtained data on the variables in a bivariate relationship she wishes to examine, her first step will be to describe the variance on each of the variables using the univariate statistics described in Chap. 2. She will need to understand the distribution on each variable before she can understand how these variables vary in relation to one another. This is important whether she is interested in description or wishes to explore a bivariate causal story.
Once she has described each one of the variables, she can turn to the relationship between them. She can prepare and present a visual representation of this relationship, which is the subject of the present section. She can also use bivariate statistical tests to assess the strength and significance of the relationship, which is the subject of the next section of this chapter.
Contingency Tables
Contingency tables are used to display the relationship between two categorical variables. They are similar to the univariate frequency distributions described in Chap. 2, the difference being that they juxtapose the two univariate distributions and display the interaction between them. Also called cross-tabulation tables, the cells of the table may present frequencies, row percentages, column percentages, and/or total percentages. Total frequencies and/or percentages are displayed in a total row and a total column, each one of which is the same as the univariate distribution of one of the variables taken alone.
Table 3.2, based on Palestinian data from Wave V of the Arab Barometer, crosses gender and the average number of hours watching television each day. Frequencies are presented in the cells of the table. In the cell showing the number of Palestinian men who do not watch television at all, row percentage, column percentage, and total percentage are also presented. Note that total percentage is based on the 10 cells showing the two variables taken together, which are summed in the lower right-hand cell. Thus, total percent for this cell is 342/2488 = 13.7. Only frequencies are given in the other cells of the table; but in a full table, these four figures – frequency, row percent, column percent and total percent – would be given in every cell.
Exercise 3.3
Compute the row percentage, the column percentage, and the total percentage in the cell showing the number of Palestinian women who do not watch television at all.
Describe the relationship between gender and watching television among Palestinians that is shown in the table. Do the television watching habits of Palestinian men and women appear to be generally similar or fairly different? You might find it helpful to convert the frequencies in other cells to row or column percentages.
Stacked Column Charts and Grouped Bar Charts
Stacked column charts and grouped bar charts are used to visually describe how two categorical variables, or one categorical and one continuous variable, relate to one another. Much like contingency tables, they show the percentage or count of each category of one variable within each category of the second variable. This information is presented in columns stacked on each other or next to each other. The charts below show the number of male Palestinians and the number of female Palestinians who watch television for a given number of hours each day. Each chart presents the same information as the other chart and as the contingency table shown above (Fig. 3.1).

Stacked column charts and grouped bar charts comparing Palestinian men and Palestinian women on hours watching television
Box Plots and Box and Whisker Plots
Box plots, box and whisker plots, and other types of plots can also be used to show the relationship between one categorical variable and one continuous variable. They are particularly useful for showing how spread out the data are. Box plots show five important numbers in a variable’s distribution: the minimum value; the median; the maximum value; and the first and third quartiles (Q1 and Q2), which represent, respectively, the number below which are 25 percent of the distribution’s values and the number below which are 75 percent of the distribution’s values. The minimum value is sometimes called the lower extreme, the lower bound, or the lower hinge. The maximum value is sometimes called the upper extreme, the upper bound, or the upper hinge. The middle 50 percent of the distribution, the range between Q1 and Q3 that represents the “box,” constitutes the interquartile range (IQR). In box and whisker plots, the “whiskers” are the short perpendicular lines extending outside the upper and lower quartiles. They are included to indicate variability below Q1 and above Q3. Values are usually categorized as outliers if they are less than Q1 − IQR*1.5 or greater than Q3 + IQR*1.5. A visual explanation of a box and whisker plot is shown in Fig. 3.2a and an example of a box plot that uses actual data is shown in Fig. 3.2b.
The box plot in Fig. 3.2b uses Wave V Arab Barometer data from Tunisia and shows the relationship between age, a continuous variable, and interpersonal trust, a dichotomous categorical variable. The line representing the median value is shown in bold. Interpersonal trust, sometimes known as generalized trust, is an important personal value. Previous research has shown that social harmony and prospects for democracy are greater in societies in which most citizens believe that their fellow citizens for the most part are trustworthy. Although the interpersonal trust variable is dichotomous in Fig. 3.2b, the variance in interpersonal trust can also be measured by a set of ordered categories or a scale that yields a continuous measure, the latter not being suitable for presentation by a box plot. Figure 3.2b shows that the median age of Tunisians who are trusting is slightly higher than the median age of Tunisians who are mistrustful of other people. Notice also that the box plot for the mistrustful group has an outlier.
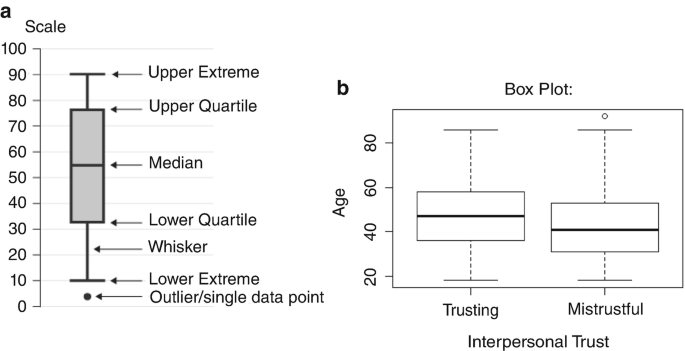
(a) A box and whisker plot. (b) Box plot comparing the ages of trusting and mistrustful Tunisians in 2018
Line Plots
Line plots may be used to visualize the relationship between two continuous variables or a continuous variable and a categorical variable. They are often used when time, or a variable related to time, is one of the two variables. If a researcher wants to show whether and how a variable changes over time for more than one subgroup of the units about which she has data (looking at men and women separately, for example), she can include multiple lines on the same plot, with each line showing the pattern over time for a different subgroup. These lines will generally be distinguished from each other by color or pattern, with a legend provided for readers.
Line plots are a particularly good way to visualize a relationship if an investigator thinks that important events over time may have had a significant impact. The line plot in Fig. 3.3 shows the average support for gender equality among men and among women in Tunisia from 2013 to 2018. Support for gender equality is a scale based on four questions related to gender equality in the three waves of the Arab Barometer. An answer supportive of gender equality on a question adds +.5 to the scale and an answer unfavorable to gender equality adds −.5 to the scale. Accordingly, a scale score of 2 indicates maximum support for gender equality and a scale score of −2 indicates maximum opposition to gender equality.

Line plot showing level of support for gender equality among Tunisian women and men in 2013, 2016, and 2018
Scatter Plots
Scatter plots are used to visualize a bivariate relationship when both variables are numerical. The independent variable is put on the x-axis, the horizontal axis, and the dependent variable is put on the y-axis, the vertical axis. Each data point becomes a dot in the scatter plot’s two-dimensional field, with its precise location being the point at which its value on the x-axis intersects with its value on the y-axis. The scatter plot shows how the variables are related to one another, including with respect to linearity, direction, and other aspects of structure. The scatter plots in Fig. 3.4 illustrate a strong positive linear relationship, a moderately strong negative linear relationship, a strong non-linear relationship, and a pattern showing no relationship.Footnote 5 If the scatter plot displays no visible and clear pattern, as in the lower left hand plot shown in Fig. 3.4, the scatter plot would indicate that the independent variable, by itself, has no meaningful impact on the dependent variable.

Scatter plots showing bivariate relationships with different structures
Scatter plots are also a good way to identify outliers—data points that do not follow a pattern that characterizes most of the data. These are also called non-scalar types. Figure 3.5 shows a scatter plot with outliers.
Outliers can be informative, making it possible, for example, to identify the attributes of cases for which the measures of one or both variables are unreliable and/or invalid. Nevertheless, the inclusion of outliers may not only distort the assessment of measures, raising unwarranted doubts about measures that are actually reliable and valid for the vast majority of cases, they may also bias bivariate statistics and make relationships seem weaker than they really are for most cases. For this reason, researchers sometimes remove outliers prior to testing a hypothesis. If one does this, it is important to have a clear definition of what is an outlier and to justify the removal of the outlier, both using the definition and perhaps through substantive analysis. There are several mathematical formulas for identifying outliers, and researchers should be aware of these formulas and their pros and cons if they plan to remove outliers.
If there are relatively few outliers, perhaps no more than 5–10 percent of the cases, it may be justifiable to remove them in order to better discern the relationship between the independent variable and the dependent variable. If outliers are much more numerous, however, it is probably because there is not a significant relationship between the two variables being considered. The researcher might in this case find it instructive to introduce a third variable and disaggregate the data. Disaggregation will be discussed in Chap. 4.

A scatter plot with outliers marked in red
Exercise 3.4 Exploring Hypotheses through Visualizing Data: Exercise with the Arab Barometer Online Analysis Tool
-
1.
Go to the Arab Barometer Online Analysis Tool (https://www.arabbarometer.org/survey-data/data-analysis-tool/)
-
(a)
Select Wave V and a country that interests you
-
(b)
Select “See Results”
-
(c)
Select “Social, Cultural and Religious topics”
-
(d)
Select “Religion: frequency: pray”
-
(e)
Questions: What does the distribution of this variable look like? How would you describe the variance?
-
(a)
-
2.
Click on “Cross by,” then
-
(a)
Select “Show all variables”
-
(b)
Select “Kind of government preferable” and click
-
(c)
Select “Options,” then “Show % over Row total,” then “Apply”
-
(d)
Questions: Does there seem to be a relationship between religiosity and preference for democracy? If so, what might explain the relationship you observe—what is a plausible causal story? Is it consistent with the hypothesis you wrote for Exercise 3.1?
-
(a)
-
3.
Questions:
-
(a)
What other variables could be used to measure religiosity and preference for democracy? Explore your hypothesis using different items from the list of Arab Barometer variables
-
(b)
Do these distributions support the previous results you found? Do you learn anything additional about the relationship between religiosity and preference for democracy?
-
(a)
-
4.
Now it is your turn to explore variables and variable relationships that interest you!
-
(a)
Pick two variables that interest you from the list of Arab Barometer variables. Are they continuous or categorical? Ordinal or nominal? (Hint: Most Arab Barometer variables are categorical, even if you might be tempted to think of them as continuous. For example, age is divided into the ordinal categories 18–29, 30–49, and 50 and more.)
-
(b)
Do you expect there to be a relationship between the two variables? If so, what do you think will be the structure of that relationship, and why?
-
(a)
-
5.
Go to the Arab Barometer Online Analysis Tool (https://www.arabbarometer.org/survey-data/data-analysis-tool/)
-
(a)
Select the wave (year) and the country that interest you
-
(b)
Select one of your two variables of interest
-
(c)
Click on “Cross by,” and then select your second variable of interest.
-
(d)
On the left side of the page, you’ll see a contingency table. On the right side at the top, you’ll see several options to graphically display the relationship between your two variables. Which type of graph best represents the relationship between your two variables of interest?
-
(e)
Do the two variables seem to be independent of each other, or do you think there might be a relationship between them? Is the relationship you see similar to what you had expected
-
(a)
3.4 Probabilities and Type I and Type II Errors
As in visual presentations of bivariate relationships, selecting the appropriate measure of association or bivariate statistical test depends on the types of the two variables. The data on both variables may be categorical; the data on both may be continuous; or the data may be categorical on one variable and continuous on the other variable. These characteristics of the data will guide the way in which our presentation of these measures and tests is organized. Before briefly describing some specific measures of association and bivariate statistical tests, however, it is necessary to lay a foundation by introducing a number of terms and concepts. Relevant here are the distinction between population and sample and the notions of the null hypothesis, of Type I and Type II errors, and of probabilities and confidence intervals. As concepts, or abstractions, these notions may influence the way a researcher thinks about drawing conclusions about a hypothesis from qualitative data, as was discussed in Chap. 2. In their precise meaning and application, however, these terms and concepts come into play when hypothesis testing involves the statistical analysis of quantitative data.
To begin, it is important to distinguish between, on the one hand, the population of units—individuals, countries, ethnic groups, political movements, or any other unit of analysis—in which the researcher is interested and about which she aspires to advance conclusions and, on the other hand, the units on which she has actually acquired the data to be analyzed. The latter, the units on which she actually has data, is her sample. In cases where the researcher has collected or obtained data on all of the units in which she is interested, there is no difference between the sample and the population, and drawing conclusions about the population based on the sample is straightforward. Most often, however, a researcher does not possess data on all of the units that make up the population in which she is interested, and so the possibility of error when making inferences about the population based on the analysis of data in the sample requires careful and deliberate consideration.
This concern for error is present regardless of the size of the sample and the way it was constructed. The likelihood of error declines as the size of the sample increases and thus comes closer to representing the full population. It also declines if the sample was constructed in accordance with random or other sampling procedures designed to maximize representation. It is useful to keep these criteria in mind when looking at, and perhaps downloading and using, Arab Barometer data. The Barometer’s website gives information about the construction of each sample. But while it is possible to reduce the likelihood of error when characterizing the population from findings based on the sample, it is not possible to eliminate entirely the possibility of erroneous inference. Accordingly, a researcher must endeavor to make the likelihood of this kind of error as small as possible and then decide if it is small enough to advance conclusions that apply to the population as well as the sample.
The null hypothesis, frequently designated as H0, is a statement to the effect that there is no meaningful and significant relationship between the independent variable and the dependent variable in a hypothesis, or indeed between two variables even if the relationship between them has not been formally specified in a hypothesis and does not purport to be causal or explanatory. The null hypothesis may or may not be stated explicitly by an investigator, but it is nonetheless present in her thinking; it stands in opposition to the hypothesized variable relationship. In a point and counterpoint fashion, the hypothesis, H1, posits that the variables are significantly related, and the null hypothesis, H0, replies and says no, they are not significantly related. It further says that they are not related in any meaningful way, neither in the way proposed in H1 nor in any other way that could be proposed.
Based on her analysis, the researcher needs to determine whether her findings permit rejecting the null hypothesis and concluding that there is indeed a significant relationship between the variables in her hypothesis, concluding in effect that the research hypothesis, H1, has been confirmed. This is most relevant and important when the investigator is basing her analysis on some but not all of the units to which her hypothesis purports to apply—when she is analyzing the data in her sample but seeks to advance conclusions that apply to the population in which she is interested. The logic here is that the findings produced by an analysis of some of the data, the data she actually possesses, may be different than the findings her analysis would hypothetically produce were she able to use data from very many more, or ideally even all, of the units that make up her population of interest.
This means, of course, that there will be uncertainty as the researcher adjudicates between H0 and H1 on the basis of her data. An analysis of these data may suggest that there is a strong and significant relationship between the variables in H1. And the stronger the relationship, the more unlikely it is that the researcher’s sample is a subset of a population characterized by H0 and that, therefore, the researcher may consider H1 to have been confirmed. Yet, it remains at least possible that the researcher’s sample, although it provides strong support for H1, is actually a subset of a population characterized by the null hypothesis. This may be unlikely, but it is not impossible, and so, therefore, to consider H1 to have been confirmed is to run the risk, at least a small risk, of what is known as a Type I error. A Type I error is made when a researcher accepts a research hypothesis that is actually false, when she judges to be true a hypothesis that does not characterize the population of which her sample is a subset. Because of the possibility of a Type I error, even if quite unlikely, researchers will often write something like “We can reject the null hypothesis,” rather than “We can confirm our hypothesis.”
Another analysis related to voter turnout provides a ready illustration. In the Arab Barometer Wave V surveys in 12 Arab countries,Footnote 6 13,899 respondents answered a question about voting in the most recent parliamentary election. Of these, 46.6 percent said they had voted, and the remainder, 53.4 percent, said they had not voted in the last parliamentary election.Footnote 7 Seeking to identify some of the determinants of voting—the attitudes and experiences of an individual that increase the likelihood that she will vote, the researcher might hypothesize that a judgment that the country is going in the right direction will push toward voting. More formally:
-
H1. An individual who believes that her country is going in the right direction is more likely to vote in a national election than is an individual who believes her country is going in the wrong direction.
Arab Barometer surveys provide data with which to test this proposition, and in fact there is a difference associated with views about the direction in which the country is going. Among those who judged that their country is going in the right direction, 52.4 percent voted in the last parliamentary election. By contrast, among those who judged that their country is going in the wrong direction, only 43.8 percent voted in the last parliamentary election.
This illustrates the choice a researcher faces when deciding what to conclude from a study. Does the analysis of her data from a subset of her population of interest confirm or not confirm her hypothesis? In this example, based on Arab Barometer data, the findings are in the direction of her hypothesis, and differences in voting associated with views about the direction the country is going do not appear to be trivial. But are these differences big enough to justify the conclusion that judgements about the country’s path going forward are a determinant of voting, one among others of course, in the population from which her sample was drawn? In other words, although this relationship clearly characterizes the sample, it is unclear whether it characterizes the researcher’s population of interest, the population from which the sample was drawn.
Unless the researcher can gather data on the entire population of eligible voters, or at least almost all of this population, it is not possible to entirely eliminate uncertainty when the researcher makes inferences about the population of voters based on findings from the subset, or sample, of voters on which she has data. She can either conclude that her findings are sufficiently strong and clear to propose that the pattern she has observed characterizes the population as well, and that H1 is therefore confirmed; or she can conclude that her findings are not strong enough to make such an inference about the population, and that H1, therefore, is not confirmed. Either conclusion could be wrong, and so there is a chance of error no matter which conclusion the researcher advances.
The terms Type I error and Type II error are often used to designate the possible error associated with each of these inferences about the population based on the sample. Type I error refers to the rejection of a true null hypothesis. This means, in other words, that the investigator could be wrong if she concludes that her finding of a strong, or at least fairly strong, relationship between her variables characterizes Arab voters in the 12 countries in general, and if she thus judges H1 to have been confirmed when the population from which her sample was drawn is in fact characterized by H0. Type II error refers to acceptance of a false null hypothesis. This means, in other words, that the investigator could be wrong if she concludes that her finding of a somewhat weak relationship, or no relationship at all, between her variables characterizes Arab voters in the 12 countries in general, and that she thus judges H0 to be true when the population from which her sample was drawn is in fact characterized by H1.
In statistical analyses of quantitative data, decisions about whether to risk a Type I error or a Type II error are usually based on probabilities. More specifically, they are based on the probability of a researcher being wrong if she concludes that the variable relationship—or hypothesis in most cases—that characterizes her data, meaning her sample, also characterizes the population on which the researcher hopes her sample and data will shed light. To say this in yet another way, she computes the odds that her sample does not represent the population of which it is a subset; or more specifically still, she computes the odds that from a population that is characterized by the null hypothesis she could have obtained, by chance alone, a subset of the population, her sample, that is not characterized by the null hypothesis. The lower the odds, or probability, the more willing the researcher will be to risk a Type I error.
There are numerous statistical tests that are used to compute such probabilities. The nature of the data and the goals of the analysis will determine the specific test to be used in a particular situation. Most of these tests, frequently called tests of significance or tests of statistical significance, provide output in the form of probabilities, which always range from 0 to 1. The lower the value, meaning the closer to 0, the less likely it is that a researcher has collected and is working with data that produce findings that differ from what she would find were she to somehow have data on the entire population. Another way to think about this is the following:
-
If the researcher provisionally assumes that the population is characterized by the null hypothesis with respect to the variable relationship under study, what is the probability of obtaining from that population, by chance alone, a subset or sample that is not characterized by the null hypothesis but instead shows a strong relationship between the two variables;
-
The lower the probability value, meaning the closer to 0, the less likely it is that the researcher’s data, which support H1, have come from a population that is characterized by H0;
-
The lower the probability that her sample could have come from a population characterized by H0, the lower the possibility that the researcher will be wrong, that she will make a Type I error, if she rejects the null hypothesis and accepts that the population, as well as her sample, is characterized by H1;
-
When the probability value is low, the chance of actually making a Type I error is small. But while small, the possibility of an error cannot be entirely eliminated.
If it helps you to think about probability and Type I and Type II error, imagine that you will be flipping a coin 100 times and your goal is to determine whether the coin is unbiased, H0, or biased in favor of either heads or tails, H1. How many times more than 50 would heads have to come up before you would be comfortable concluding that the coin is in fact biased in favor of heads? Would 60 be enough? What about 65? To begin to answer these questions, you would want to know the odds of getting 60 or 65 heads from a coin that is actually unbiased, a coin that would come up heads and come up tails roughly the same number of times if it were flipped many more than 100 times, maybe 1000 times, maybe 10,000. With this many flips, would the ratio of heads to tails even out. The lower the odds, the less likely it is that the coin is unbiased. In this analogy, you can think of the mathematical calculations about an unbiased coin’s odds of getting heads as the population, and your actual flips of the coin as the sample.
But exactly how low does the probability of a Type I error have to be for a researcher to run the risk of rejecting H0 and accepting that her variables are indeed related? This depends, of course, on the implications of being wrong. If there are serious and harmful consequences of being wrong, of accepting a research hypothesis that is actually false, the researcher will reject H0 and accept H1 only if the odds of being wrong, of making a Type I error, are very low.
There are some widely used probability values, which define what are known as “confidence intervals,” that help researchers and those who read their reports to think about the likelihood that a Type I error is being made. In the social sciences, rejecting H0 and running the risk of a Type I error is usually thought to require a probability value of less than .05, written as p < .05. The less stringent value of p < .10 is sometimes accepted as sufficient for rejecting H0, although such a conclusion would be advanced with caution and when the consequences of a Type I error are not very harmful. Frequently considered safer, meaning that the likelihood of accepting a false hypothesis is lower, are p < .01 and p < .001. The next section introduces and briefly describes some of the bivariate statistics that may be used to calculate these probabilities.
3.5 Measures of Association and Bivariate Statistical Tests
The following section introduces some of the bivariate statistical tests that can be used to compute probabilities and test hypotheses. The accounts are not very detailed. They will provide only a general overview and refresher for readers who are already fairly familiar with bivariate statistics. Readers without this familiarity are encouraged to consult a statistics textbook, for which the accounts presented here will provide a useful guide. While the account below will emphasize calculating these test statistics by hand, it is also important to remember that they can be calculated with the assistance of statistical software as well. A discussion of statistical software is available in Appendix 4.
Parametric and Nonparametric Statistics
Parametric and nonparametric are two broad classifications of statistical procedures. A parameter in statistics refers to an attribute of a population. For example, the mean of a population is a parameter. Parametric statistical tests make certain assumptions about the shape of the distribution of values in a population from which a sample is drawn, generally that it is normally distributed, and about its parameters, that is to say the means and standard deviations of the assumed distributions. Nonparametric statistical procedures rely on no or very few assumptions about the shape or parameters of the distribution of the population from which the sample was drawn. Chi-squared is the only nonparametric statistical test among the tests described below.
Degrees of Freedom
Degrees of freedom (df) is the number of values in the calculation of a statistic that are free to vary. Statistical software programs usually give degrees of freedom in the output, so it is generally unnecessary to know the number of the degrees of freedom in advance. It is nonetheless useful to understand what degrees of freedom represent. Consistent with the definition above, it is the number of values that are not predetermined, and thus are free to vary, within the variables used in a statistical test.
This is illustrated by the contingency tables below, which are constructed to examine the relationship between two categorical variables. The marginal row and column totals are known since these are just the univariate distributions of each variable. df = 1 for Table 3.3a, which is a 4-cell table. You can enter any one value in any one cell, but thereafter the values of all the other three cells are determined. Only one number is not free to vary and thus not predetermined. df = 2 for Table 3.3b, which is a 6-cell table. You can enter any two values in any two cells, but thereafter the values of all the other cells are determined. Only two numbers are free to vary and thus not predetermined. For contingency tables, the formula for calculating df is:
Chi-Squared
Chi-squared, frequently written X2, is a statistical test used to determine whether two categorical variables are significantly related. As noted, it is a nonparametric test. The most common version of the chi-squared test is the Pearson chi-squared test, which gives a value for the chi-squared statistic and permits determining as well a probability value, or p-value. The magnitude of the statistic and of the probability value are inversely correlated; the higher the value of the chi-squared statistic, the lower the probability value, and thus the lower the risk of making a Type I error—of rejecting a true null hypothesis—when asserting that the two variables are strongly and significantly related.
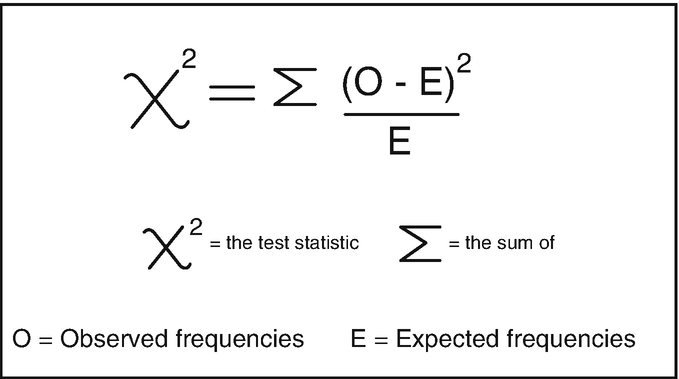
The simplicity of the chi-squared statistic permits giving a little more detail in order to illustrate several points that apply to bivariate statistical tests in general. The formula for computing chi-squared is given below, with O being the observed (actual) frequency in each cell of a contingency table for two categorical variables and E being the frequency that would be expected in each cell if the two variables are not related. Put differently, the distribution of E values across the cells of the two-variable table constitutes the null hypothesis, and chi-squared provides a number that expresses the magnitude of the difference between an investigator’s actual observed values and the values of E.
The computation of chi-squared involves the following procedures, which are illustrated using the data in Table 3.4.
-
The values of O in the cells of the table are based on the data collected by the investigator. For example, Table 3.4 shows that of the 200 women on whom she collected information, 85 are majoring in social science.
-
The value of E for each cell is computed by multiplying the marginal total of the column in which the cell is located by the marginal total of the row in which the cell is located divided by N, N being the total number of cases. For the female students majoring in social science in Table 3.4, this is: 200 * 150/400 = 30,000/400 = 75. For the female students majoring in math and natural science in Table 3.4, this is: 200 * 100/400 = 20,000/400 = 50.
-
The difference between the value of O and the value of E is computed for each cell using the formula for chi-squared. For the female students majoring in social science in Table 3.4, this is: (85–75)2/75 = 102/75 = 100/75 = 1.33. For the female students majoring in math and natural science, the value resulting from the application of the chi-squared is: (45–50)2/50 = 52/75 = 25/75 = .33.
-
The values in each cell of the table resulting from the application of the chi-squared formula are summed (Σ). This chi-squared value expresses the magnitude of the difference between a distribution of values indicative of the null hypothesis and what the investigator actually found about the relationship between gender and field of study. In Table 3.4, the cell for female students majoring in social science adds 1.33 to the sum of the values in the eight cells, the cell for female students majoring in math and natural science adds .33 to the sum, and so forth for the remaining six cells.
A final point to be noted, which applies to many other statistical tests as well, is that the application of chi-squared and other bivariate (and multivariate) statistical tests yields a value with which can be computed the probability that an observed pattern does not differ from the null hypothesis and that a Type I error will be made if the null hypothesis is rejected and the research hypothesis is judged to be true. The lower the probability, of course, the lower the likelihood of an error if the null hypothesis is rejected.
Prior to the advent of computer assisted statistical analysis, the value of the statistic and the number of degrees of freedom were used to find the probability value in a table of probability values in an appendix in most statistics books. At present, however, the probability value, or p-value, and also the degrees of freedom, are routinely given as part of the output when analysis is done by one of the available statistical software packages.
Table 3.5 shows the relationship between economic circumstance and trust in the government among 400 ordinary citizens in a hypothetical country. The observed data were collected to test the hypothesis that greater wealth pushes people toward greater trust and less wealth pushes people toward lesser trust. In the case of all three patterns, the probability that the null hypothesis is true is very low. All three patterns have the same high chi-squared value and low probability value. Thus, the chi-squared and p-values show only that the patterns all differ significantly from what would be expected were the null hypothesis true. They do not show whether the data support the hypothesized variable relationship or any other particular relationship.
As the three patterns in Table 3.5 show, variable relationships with very different structures can yield similar or even identical statistical test and probability values, and thus these tests provide only some of the information a researcher needs to draw conclusions about her hypothesis. To draw the right conclusion, it may also be necessary for the investigator to “look at” her data. For example, as Table 3.5 suggests, looking at a tabular or visual presentation of the data may also be needed to draw the proper conclusion about how two variables are related.
How would you describe the three patterns shown in the table, each of which differs significantly from the null hypothesis? Which pattern is consistent with the research hypothesis? How would you describe the other two patterns? Try to visualize a plot of each pattern.
Pearson Correlation Coefficient
The Pearson correlation coefficient, more formally known as the Pearson product-moment correlation, is a parametric measure of linear association. It gives a numerical representation of the strength and direction of the relationship between two continuous numerical variables. The coefficient, which is commonly represented as r, will have a value between −1 and 1. A value of 1 means that there is a perfect positive, or direct, linear relationship between the two variables; as one variable increases, the other variable consistently increases by some amount. A value of −1 means that there is a perfect negative, or inverse, linear relationship; as one variable increases, the other variable consistently decreases by some amount. A value of 0 means that there is no linear relationship; as one variable increases, the other variable neither consistently increases nor consistently decreases.
It is easy to think of relationships that might be assessed by a Pearson correlation coefficient. Consider, for example, the relationship between age and income and the proposition that as age increases, income consistently increases or consistently decreases as well. The closer a coefficient is to 1 or −1, the greater the likelihood that the data on which it is based are not the subset of a population in which age and income are unrelated, meaning that the population of interest is not characterized by the null hypothesis. Coefficients very close to 1 or −1 are rare; although it depends on the number of units on which the researcher has data and also on the nature of the variables. Coefficients higher than .3 or lower than −.03 are frequently high enough, in absolute terms, to yield a low probability value and justify rejecting the null hypothesis. The relationship in this case would be described as “statistically significant.”
Exercise 3.5
Estimating Correlation Coefficients from scatter plots
-
1.
Look at the scatter plots in Fig. 3.4 and estimate the correlation coefficient that the bivariate relationship shown in each scatter plot would yield.
-
2.
Explain the basis for each of your estimates of the correlation coefficient.
Spearman’s Rank-Order Correlation Coefficient
The Spearman’s rank-order correlation coefficient is a nonparametric version of the Pearson product-moment correlation. Spearman’s correlation coefficient, (ρ, also signified by rs) measures the strength and direction of the association between two ranked variables.
Bivariate Regression
Bivariate regression is a parametric measure of association that, like correlation analysis, assesses the strength and direction of the relationship between two variables. Also, like correlation analysis, regression assumes linearity. It may give misleading results if used with variable relationships that are not linear.
Regression is a powerful statistic that is widely used in multivariate analyses. This includes ordinary least squares (OLS) regression, which requires that the dependent variable be continuous and assumes linearity; binary logistic regression, which may be used when the dependent variable is dichotomous; and ordinal logistic regression, which is used with ordinal dependent variables. The use of regression in multivariate analysis will be discussed in the next chapter. In bivariate analysis, regression analysis yields coefficients that indicate the strength and direction of the relationship between two variables. Researchers may opt to “standardize” these coefficients. Standardized coefficients from a bivariate regression are the same as the coefficients produced by Pearson product-moment correlation analysis.
T-Test
The t-test, also sometimes called a “difference of means” test, is a parametric statistical test that compares the means of two variables and determines whether they are different enough from each other to reject the null hypothesis and risk a Type I error. The dependent variable in a t-test must be continuous or ordinal—otherwise the investigator cannot calculate a mean. The independent variable must be categorical since t-tests are used to compare two groups.
An example, drawing again on Arab Barometer data, tests the relationship between voting and support for democracy. The hypothesis might be that men and women who voted in the last parliamentary election are more likely than men and women who did not vote to believe that democracy is suitable for their country. Whether a person did or did not vote would be the categorical independent variable, and the dependent variable would be the response to a question like, “To what extent do you think democracy is suitable for your country?” The question about democracy asked respondents to situate their views on a 11-point scale, with 0 indicating completely unsuitable and 10 indicating completely suitable.
Focusing on Tunisia in 2018, Arab Barometer Wave V data show that the mean response on the 11-point suitability question is 5.11 for those who voted and 4.77 for those who did not vote. Is this difference of .34 large enough to be statistically significant? A t-test will determine the probability of getting a difference of this magnitude from a population of interest, most likely all Tunisians of voting age, in which there is no difference between voters and non-voters in views about the suitability of democracy for Tunisia. In this example, the t-test showed p < .086. With this p-value, which is higher than the generally accepted standard of .05, a researcher cannot with confidence reject the null hypotheses, and she is unable, therefore, to assert that the proposed relationship has been confirmed.
This question can also be explored at the country level of analysis with, for example, regime type as the independent variable. In this illustration, the hypothesis is that citizens of monarchies are more likely than citizens of republics to believe that democracy is suitable for their country. Of course, a researcher proposing this hypothesis would also advance an associated causal story that provides the rationale for the hypothesis and specifies what is really being tested. To test this proposition, an investigator might merge data from surveys in, say, three monarchies, perhaps Morocco, Jordan, and Kuwait, and then also merge data from surveys in three republics, perhaps Algeria, Egypt, and Iraq. A t-test would then be used to compare the means of people in republics and people in monarchies and give the p-value.
A similar test, the Wilcoxon-Mann-Whitney test, is a nonparametric test that does not require that the dependent variable be normally distributed.
ANOVA
Analysis of variance, or ANOVA, is closely related to the t-test. It may be used when the dependent variable is continuous and the independent variable is categorical. A one-way ANOVA compares the mean and variance values of a continuous dependent variable in two or more categories of a categorical independent variable in order to determine if the latter affects the former.
ANOVA calculates the F-ratio based on the variance between the groups and the variance within each group. The F-ratio can then be used to calculate a p-value. However, if there are more than two categories of the independent variable, the ANOVA test will not indicate which pairs of categories differ enough to be statistically significant, making it necessary, again, to look at the data in order to draw correct conclusions about the structure of the bivariate relationships. Two-way ANOVA is used when an investigator has more than two variables.
Table 3.6 presents a summary list of the visual representations and bivariate statistical tests that have been discussed. It reminds readers of the procedures that can be used when both variables are categorical, when both variables are numerical/continuous, and when one variable is categorical and one variable is numerical/continuous.
Bivariate Statistics and Causal Inference
It is important to remember that bivariate statistical tests only assess the association or correlation between two variables. The tests described above can help a researcher estimate how much confidence her hypothesis deserves and, more specifically, the probability that any significant variable relationships she has found characterize the larger population from which her data were drawn and about which she seeks to offer information and insight.
The finding that two variables in a hypothesized relationship are related to a statistically significant degree is not evidence that the relationship is causal, only that the independent variable is related to the dependent variable. The finding is consistent with the causal story that the hypothesis represents, and to that extent, it offers support for this story. Nevertheless, there are many reasons why an observed statistically significant relationship might be spurious. The correlation might, for example, reflect the influence of one or more other and uncontrolled variables. This will be discussed more fully in the next chapter. The point here is simply that bivariate statistics do not, by themselves, address the question of whether a statistically significant relationship between two variables is or is not a causal relationship.
Only an Introductory Overview
As has been emphasized throughout, this chapter seeks only to offer an introductory overview of the bivariate statistical tests that may be employed when an investigator seeks to assess the relationship between two variables. Additional information will be presented in Chap. 4. The focus in Chap. 4 will be on multivariate analysis, on analyses involving three or more variables. In this case again, however, the chapter will provide only an introductory overview. The overviews in the present chapter and the next provide a foundation for understanding social statistics, for understanding what statistical analyses involve and what they seek to accomplish. This is important and valuable in and of itself. Nevertheless, researchers and would-be researchers who intend to incorporate statistical analyses into their investigations, perhaps to test hypotheses and decide whether to risk a Type I error or a Type II error, will need to build on this foundation and become familiar with the contents of texts on social statistics. If this guide offers a bird’s eye view, researchers who implement these techniques will also need to expose themselves to the view of the worm at least once.
Chapter 2 makes clear that the concept of variance is central and foundational for much and probably most data-based and quantitative social science research. Bivariate relationships, which are the focus of the present chapter, are building blocks that rest on this foundation. The goal of this kind of research is very often the discovery of causal relationships, relationships that explain rather than merely describe or predict. Such relationships are also frequently described as accounting for variance. This is the focus of Chap. 4, and it means that there will be, first, a dependent variable, a variable that expresses and captures the variance to be explained, and then, second, an independent variable, and possibly more than one independent variable, that impacts the dependent variable and causes it to vary.
Bivariate relationships are at the center of this enterprise, establishing the empirical pathway leading from the variance discussed in Chap. 2 to the causality discussed in Chap. 4. Finding that there is a significant relationship between two variables, a statistically significant relationship, is not sufficient to establish causality, to conclude with confidence that one of the variables impacts the other and causes it to vary. But such a finding is necessary.
The goal of social science inquiry that investigates the relationship between two variables is not always explanation. It might be simply to describe and map the way two variables interact with one another. And there is no reason to question the value of such research. But the goal of data-based social science research is very often explanation; and while the inter-relationships between more than two variables will almost always be needed to establish that a relationship is very likely to be causal, these inter-relationships can only be examined by empirics that begin with consideration of a bivariate relationship, a relationship with one variable that is a presumed cause and one variable that is a presumed effect.
Against this background, with the importance of two-variable relationships in mind, the present chapter offers a comprehensive overview of bivariate relationships, including but not only those that are hypothesized to be causally related. The chapter considers the origin and nature of hypotheses that posit a particular relationship between two variables, a causal relationship if the larger goal of the research is explanation and the delineation of a causal story to which the hypothesis calls attention. This chapter then considers how a bivariate relationship might be described and visually represented, and thereafter it discusses how to think about and determine whether the two variables actually are related.
Presenting tables and graphs to show how two variables are related and using bivariate statistics to assess the likelihood that an observed relationship differs significantly from the null hypothesis, the hypothesis of no relationship, will be sufficient if the goal of the research is to learn as much as possible about whether and how two variables are related. And there is plenty of excellent research that has this kind of description as its primary objective, that makes use for purposes of description of the concepts and procedures introduced in this chapter. But there is also plenty of research that seeks to explain, to account for variance, and for this research, use of these concepts and procedures is necessary but not sufficient. For this research, consideration of a two-variable relationship, the focus of the present chapter, is a necessary intermediate step on a pathway that leads from the observation of variance to explaining how and why that variance looks and behaves as it does.
Notes
- 1.
Dana El Kurd. 2019. “Who Protests in Palestine? Mobilization Across Class Under the Palestinian Authority.” In Alaa Tartir and Timothy Seidel, eds. Palestine and Rule of Power: Local Dissent vs. International Governance. New York: Palgrave Macmillan.
- 2.
Yael Zeira. 2019. The Revolution Within: State Institutions and Unarmed Resistance in Palestine. New York: Cambridge University Press.
- 3.
Carolina de Miguel, Amaney A. Jamal, and Mark Tessler. 2015. “Elections in the Arab World: Why do citizens turn out?” Comparative Political Studies 48, (11): 1355–1388.
- 4.
Question 1: Independent variable is religiosity; dependent variable is preference for democracy. Example of hypothesis for Question 1: H1. More religious individuals are more likely than less religious individuals to prefer democracy to other political systems. Question 2: Independent variable is preference for democracy; dependent variable is turning out to vote. Example of hypothesis for Question 2: H2. Individuals who prefer democracy to other political systems are more likely than individuals who do not prefer democracy to other political systems to turn out to vote.
- 5.
Mike Yi. “A complete Guide to Scatter Plots,” posted October 16, 2019 and seen at https://chartio.com/learn/charts/what-is-a-scatter-plot/
- 6.
The countries are Algeria, Egypt, Iraq, Jordan, Kuwait, Lebanon, Libya, Morocco, Palestine, Sudan, Tunisia, and Yemen. The Wave V surveys were conducted in 2018–2019.
- 7.
Not considered in this illustration are the substantial cross-country differences in voter turnout. For example, 63.6 of the Lebanese respondents reported voting, whereas in Algeria the proportion who reported voting was only 20.3 percent. In addition to testing hypotheses about voting in which the individual is the unit of analysis, country could also be the unit of analysis, and hypotheses seeking to account for country-level variance in voting could be formulated and tested.
Author information
Authors and Affiliations
Rights and permissions
Open Access This chapter is licensed under the terms of the Creative Commons Attribution 4.0 International License (http://creativecommons.org/licenses/by/4.0/), which permits use, sharing, adaptation, distribution and reproduction in any medium or format, as long as you give appropriate credit to the original author(s) and the source, provide a link to the Creative Commons license and indicate if changes were made.
The images or other third party material in this chapter are included in the chapter's Creative Commons license, unless indicated otherwise in a credit line to the material. If material is not included in the chapter's Creative Commons license and your intended use is not permitted by statutory regulation or exceeds the permitted use, you will need to obtain permission directly from the copyright holder.
Copyright information
© 2023 The Author(s)
About this chapter

Cite this chapter
Tessler, M. (2023). Bivariate Analysis: Associations, Hypotheses, and Causal Stories. In: Social Science Research in the Arab World and Beyond. SpringerBriefs in Sociology. Springer, Cham. https://doi.org/10.1007/978-3-031-13838-6_3
Download citation
DOI: https://doi.org/10.1007/978-3-031-13838-6_3
Published:
Publisher Name: Springer, Cham
Print ISBN: 978-3-031-13837-9
Online ISBN: 978-3-031-13838-6
eBook Packages: Social SciencesSocial Sciences (R0)