
Abstract
Structural equation modeling is a multivariate data analysis method for analyzing complex relationships among constructs and indicators. To estimate structural equation models, researchers generally draw on two methods: covariance-based SEM (CB-SEM) and partial least squares SEM (PLS-SEM). Whereas CB-SEM is primarily used to confirm theories, PLS represents a causal–predictive approach to SEM that emphasizes prediction in estimating models, whose structures are designed to provide causal explanations. PLS-SEM is also useful for confirming measurement models. This chapter offers a concise overview of PLS-SEM’s key characteristics and discusses the main differences compared to CB-SEM. The chapter also describes considerations when using PLS-SEM and highlights situations that favor its use compared to CB-SEM.
You have full access to this open access chapter, Download chapter PDF
Keywords
- CB-SEM
- Common factor-based SEM
- Composite-based SEM
- Construct scores
- Constructs
- Covariance-based SEM (CB-SEM)
- Endogenous latent variables
- Error terms
- Exogenous latent variables
- Factor (score) indeterminacy
- Formative measurement model
- Indicators
- Inner model
- Inverse square root method
- Latent variables
- Measurement error
- Measurement model
- Measurement theory
- Metric scale
- Metrological uncertainty
- Minimum sample size requirements
- Missing value treatment
- Outer model
- Partial least squares structural equation modeling (PLS-SEM)
- Path model
- PLS path modeling
- PLS regression
- PLS-SEM
- PLS-SEM bias
- Prediction
- Ratio scale
- Reflective measurement model
- Sample
- Secondary data
- Second-generation techniques
- Statistical power
- Structural equation modeling (SEM)
- Structural model
- Structural theory
- Sum scores
- Theory
- Variance-based SEM
After reading this chapter, you should:
-
1.
Understand the principles of structural equation modeling (SEM)
-
2.
Describe the basic elements of a structural equation model
-
3.
Comprehend the basic concepts of partial least squares structural equation modeling (PLS-SEM)
-
4.
Explain the differences between covariance-based structural equation modeling (CB-SEM) and PLS-SEM and when to use each of the approaches
1.1 What Is Structural Equation Modeling?
First-generation multivariate data analysis techniques, such as multiple regression, logistic regression, and analysis of variance, belong to the core set of statistical methods employed by researchers to empirically test hypothesized relationships between variables of interest. Numerous researchers in various scientific disciplines have applied these methods to generate findings that have significantly shaped the way we see the world today. These techniques have three important limitations in common, namely (1) the postulation of a simple model structure, (2) requiring that all variables can be considered observable, and (3) the assumption that all variables are measured without error (Haenlein & Kaplan, 2004).
With regard to the first limitation, multiple regression analysis and its extensions postulate a simple model structure involving one layer of dependent and independent variables. Causal chains, such as “A leads to B leads to C” or more complex nomological networks involving a large number of intervening variables, can only be estimated piecewise with these methods rather than simultaneously, which can have severe consequences for the quality of the results (Sarstedt, Hair, Nitzl, Ringle, & Howard, 2020).
With regard to the second limitation, regression-type methods are restricted to processing observable variables, such as age or sales (in units or dollars). Theoretical concepts, which are “abstract, unobservable properties or attributes of a social unit of entity” (Bagozzi & Philipps, 1982, p. 465), can only be considered after prior stand-alone validation by means of, for example, a confirmatory factor analysis (CFA). The ex post inclusion of measures of theoretical concepts, however, comes with various shortcomings.
With regard to the third limitation and related to the previous point, one has to bear in mind that each observation of the real world is accompanied by a certain degree of measurement error, which can be systematic or random. First-generation techniques are, strictly speaking, only applicable when measured variables contain neither systematic nor random error. This situation is, however, rarely encountered in reality, particularly when the aim is to estimate relationships among measures of theoretical concepts. Since the social sciences, and many other fields of scientific inquiry, routinely deal with theoretical concepts, such as perceptions, attitudes, and intentions, these limitations of first-generation techniques are fundamental.
To overcome these limitations, researchers have increasingly been turning to second-generation techniques. These methods, referred to as structural equation modeling (SEM), enable researchers to simultaneously model and estimate complex relationships among multiple dependent and independent variables. The concepts under consideration are typically unobservable and measured indirectly by multiple indicators. In estimating the relationships, SEM accounts for measurement error in observed variables. As a result, the method obtains a more precise measurement of the theoretical concepts of interest (Cole & Preacher, 2014). We will discuss these aspects in the following sections in greater detail.
Two popular methods dominate SEM in practice: covariance-based SEM (CB-SEM) and partial least squares SEM (PLS-SEM, also called PLS path modeling). CB-SEM is primarily used to confirm (or reject) theories and their underlying hypotheses. This approach confirms/rejects hypotheses by determining how closely a proposed theoretical model can reproduce the covariance matrix for an observed sample dataset. In contrast, PLS has been introduced as a “causal–predictive” approach to SEM (Jöreskog & Wold, 1982, p. 270), which focuses on explaining the variance in the model’s dependent variables (Chin et al., 2020).
PLS-SEM is evolving rapidly as a statistical modeling technique. Over the last few decades, there have been numerous introductory articles on this methodology (e.g., Chin, 1998; Haenlein & Kaplan, 2004; Hair et al., 2020; Hair, Howard, & Nitzl, 2020; Hair, Risher, Sarstedt, & Ringle, 2019; Nitzl & Chin, 2017; Rigdon, 2013; Roldán & Sánchez-Franco, 2012; Tenenhaus, Esposito Vinzi, Chatelin, & Lauro, 2005; Wold, 1985) as well as review articles examining how researchers across different disciplines have used the method (◘ Table 1.1). In light of the increasing maturation of the field, researchers have also started exploring the knowledge infrastructure of methodological research on PLS-SEM by analyzing the structures of authors, countries, and co-citation networks (Hwang, Sarstedt, Cheah, & Ringle, 2020; Khan et al., 2019).
The remainder of this chapter first provides a brief introduction of measurement and structural theory as a basis for presenting the PLS-SEM method. In describing the PLS-SEM method’s characteristics, we also discuss distinguishing features vis-à-vis CB-SEM. Finally, we outline considerations when using PLS-SEM and highlight situations that favor its use compared to CB-SEM.
1.2 Principles of Structural Equation Modeling
1.2.1 Path Models with Latent Variables
Path models are diagrams used to visually display the hypotheses and variable relationships that are examined when SEM is applied (Hair, Page, & Brunsveld, 2020; Hair, Ringle, & Sarstedt, 2011). An example of a path model is shown in ◘ Fig. 1.1.
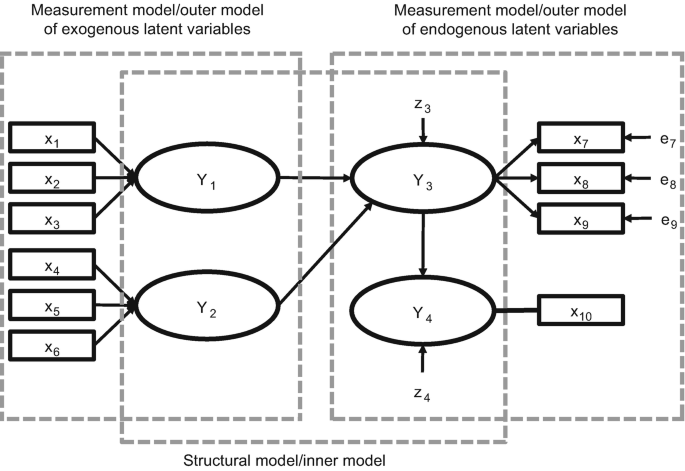
A simple path model. (Source: Hair et al., 2022, Chap. 1; used with permission by Sage)
Constructs (i.e., variables that are not directly measurable), also referred to as latent variables, are represented in path models as circles or ovals (Y1 to Y4). The indicators, also called items or manifest variables, are the directly measured variables that contain the raw data. They are represented in path models as rectangles (x1 to x10). Relationships between constructs, as well as between constructs and their assigned indicators, are depicted as arrows. In PLS-SEM, the arrows are always single headed, thus representing directional relationships. Single-headed arrows are considered predictive relationships and, with strong theoretical support, can be interpreted as causal relationships.
A PLS path model consists of two elements. First, there is a structural model (also called the inner model in the context of PLS-SEM) that links together the constructs (circles or ovals). The structural model also displays the relationships (paths) between the constructs. Second, there are the measurement models (also referred to as the outer models in PLS-SEM) of the constructs that display the relationships between the constructs and the indicator variables (rectangles). In ◘ Fig. 1.1, there are two types of measurement models: one for the exogenous latent variables (i.e., those constructs that only explain other constructs in the model) and one for the endogenous latent variables (i.e., those constructs that are being explained in the model). Rather than referring to measurement models of exogenous and endogenous latent variables, researchers often refer to the measurement model of one specific latent variable. For example, x1 to x3 are the indicators used in the measurement model of Y1, while Y4 only includes the x10 indicator in the measurement model.
The error terms (e.g., e7 or e8; ◘ Fig. 1.1) are connected to the (endogenous) constructs and (reflectively) measured variables by single-headed arrows. Error terms represent the unexplained variance when path models are estimated (i.e., the difference between the model’s in-sample prediction of a value and an observed value of a manifest or latent variable). Error terms e7 to e9 in ◘ Fig. 1.1 are connected to those indicators whose relationships point from the construct (Y3) to the indicators (i.e., reflectively measured indicators).
In contrast, the formatively measured indicators x1 to x6, where the relationship goes from the indicator to the construct (Y1 and Y2), do not have error terms (Sarstedt, Hair, Ringle, Thiele, & Gudergan, 2016). Finally, for the single-item construct Y4, the direction of the relationships between the construct and the indicator is not relevant, as construct and item are equivalent. For the same reason, there is no error term connected to x10. The structural model also contains error terms. In ◘ Fig. 1.1, z3 and z4 are associated with the endogenous latent variables Y3 and Y4(note that error terms on constructs and measured variables are labeled differently). In contrast, the exogenous latent variables (Y1 and Y2) that only explain other latent variables in the structural model do not have an error term, regardless of whether they are specified reflectively or formatively.
1.2.2 Testing Theoretical Relationships
Path models are developed based on theory and are often used to test theoretical relationships. Theory is a set of systematically related hypotheses developed following the scientific method that can be used to explain and predict outcomes. Thus, hypotheses are individual conjectures, whereas theories are multiple hypotheses that are logically linked together and can be tested empirically. Two types of theory are required to develop path models: measurement theory and structural theory. Measurement theory specifies which indicators and how these are used to measure a certain theoretical concept. In contrast, structural theory specifies how the constructs are related to one another in the structural model.
Testing theory using PLS-SEM follows a two-step process (Hair, Black, Babin, & Anderson, 2019). We first test the measurement theory to confirm the reliability and validity of the measurement models. After the measurement models are confirmed, we move on to testing the structural theory. The logic is that we must first confirm the measurement theory before testing the structural theory, because structural theory cannot be confirmed if the measures are unreliable or invalid.
1.2.3 Measurement Theory
Measurement theory specifies how the latent variables (constructs) are measured. Generally, there are two different ways to measure unobservable variables. One approach is referred to as reflective measurement, and the other is formative measurement. Constructs Y1 and Y2 in ◘ Fig.1.1 are modeled based on a formative measurement model. Note that the directional arrows are pointing from the indicator variables (x1 to x3 for Y1 and x4 to x6 for Y2) to the construct, indicating a predictive (causal) relationship in that direction.
In contrast, Y3 in ◘ Fig. 1.1 is modeled based on a reflective measurement model. With reflective indicators, the direction of the arrows is from the construct to the indicator variables, indicating the assumption that the construct “causes” the measurement (more precisely, the covariation) of the indicator variables. As indicated in ◘ Fig. 1.1, reflective measures have an error term associated with each indicator, which is not the case with formative measures. The latter are assumed to be error-free (Diamantopoulos, 2006). Finally, note that Y4 is measured using a single item rather than multi-item measures. Therefore, the relationship between construct and indicator is undirected.
Deciding whether to measure the constructs reflectively versus formatively and whether to use multiple items or a single-item measure is fundamental when developing path models. Hair, Hult, Ringle, and Sarstedt (2022; Chap. 2) explain these approaches to modeling constructs in more detail.
1.2.4 Structural Theory
Structural theory shows how the latent variables are related to one another (i.e., it shows the constructs and their path relationships in the structural model). The location and sequence of the constructs are either based on theory or the researcher’s experience and accumulated knowledge or both. When path models are developed, the sequence is from left to right. The variables on the left side of the path model are independent variables, and any variable on the right side is a dependent variable. Moreover, variables on the left are shown as sequentially preceding and predicting the variables on the right. However, when variables are in the middle of the path model (between the variables that serve only as independent or dependent variables – Y3; ◘ Fig. 1.1), they serve as both independent and dependent variables in the structural model.
When latent variables only serve as independent variables, they are called exogenous latent variables (Y1 and Y2). When latent variables only serve as dependent variables (Y4) or as both independent and dependent variables (Y3), they are called endogenous latent variables (◘ Fig. 1.1). Any latent variable that has only single-headed arrows going out of it is an exogenous latent variable. In contrast, endogenous latent variables can have either single-headed arrows going both into and out of them (Y3) or only going into them (Y4). Note that the exogenous latent variables Y1 and Y2 do not have error terms, since these constructs are the entities (independent variables) that are explaining the dependent variables in the path model.
1.3 PLS-SEM and CB-SEM
There are two main approaches to estimating the relationships in a structural equation model (Hair et al., 2011; Hair, Black, et al., 2019). One is CB-SEM, and the other is PLS-SEM, the latter being the focus of this book. Each is appropriate for a different research context, and researchers need to understand the differences in order to apply the correct method (Marcoulides & Chin, 2013; Rigdon, Sarstedt, & Ringle, 2017). Finally, some researchers have argued for using regressions based on sum scores, instead of some type of indicator weighting as is done by PLS-SEM. The sum scores approach offers practically no value compared to the PLS-SEM weighted approach and in fact can produce erroneous results (Hair et al., 2017). For this reason, in the following sections, we only briefly discuss sum scores and instead focus on the PLS-SEM and CB-SEM methods.
A crucial conceptual difference between PLS-SEM and CB-SEM relates to the way each method treats the latent variables included in the model. CB-SEM represents a common factor-based SEM method that considers the constructs as common factors that explain the covariation between its associated indicators. This approach is consistent with the measurement philosophy underlying reflective measurement, in which the indicators and their covariations are regarded as manifestations of the underlying construct. In principle, CB-SEM can also accommodate formative measurement models, even though the method follows a common factor model estimation approach. To estimate this model type, however, researchers must follow rules that require specific constraints on the model to ensure model identification (Bollen & Davies, 2009; Diamantopoulos & Riefler, 2011), which means that the method can calculate estimates for all model parameters. As Hair, Sarstedt, Ringle, and Mena (2012, p. 420) note, “[t]hese constraints often contradict theoretical considerations, and the question arises whether model design should guide theory or vice versa.”
PLS-SEM, on the other hand, assumes the concepts of interest can be measured as composites (Jöreskog & Wold, 1982), which is why PLS is considered a composite-based SEM method (Hwang et al., 2020). Model estimation in PLS-SEM involves linearly combining the indicators of a measurement model to form composite variables. The composite variables are assumed to be comprehensive representations of the constructs, and, therefore, valid proxies of the conceptual variables being examined (e.g., Hair & Sarstedt, 2019). The composite-based approach is consistent with the measurement philosophy underlying formative measurement, but this does not imply that PLS-SEM is only capable of estimating formatively specified constructs. The reason is that the estimation perspective (i.e., forming composites to represent conceptual variables) should not be confused with the measurement theory perspective (i.e., specifying measurement models as reflective or formative). The way a method like PLS-SEM estimates the model parameters needs to be clearly distinguished from any measurement theoretical considerations on how to operationalize constructs (Sarstedt et al., 2016). Researchers can include reflectively and formatively specified measurement models that PLS-SEM can straightforwardly estimate.
In following a composite-based approach to SEM, PLS relaxes the strong assumption of CB-SEM that all of the covariation between the sets of indicators is explained by a common factor (Henseler et al., 2014; Rigdon, 2012; Rigdon et al., 2014). At the same time, using weighted composites of indicator variables facilitates accounting for measurement error, thus making PLS-SEM superior compared to multiple regression using sum scores, where each indicator is weighted equally.
It is important to note that the composites produced by PLS-SEM are not assumed to be identical to the theoretical concepts, which they represent. They are explicitly recognized as approximations (Rigdon, 2012). As a consequence, some scholars view CB-SEM as a more direct and precise method to empirically measure theoretical concepts (e.g., Rönkkö, McIntosh, & Antonakis, 2015), while PLS-SEM provides approximations. Other scholars contend, however, that such a view is quite shortsighted, since common factors derived in CB-SEM are also not necessarily equivalent to the theoretical concepts that are the focus of the research (Rigdon, 2012; Rigdon et al., 2017; Rossiter, 2011; Sarstedt et al., 2016). Rigdon, Becker, and Sarstedt (2019a) show that common factor models can be subject to considerable degrees of metrological uncertainty. Metrological uncertainty refers to the dispersion of the measurement values that can be attributed to the object or concept being measured (JCGM/WG1, 2008). Numerous sources contribute to metrological uncertainty such as definitional uncertainty or limitations related to the measurement scale design, which go well beyond the simple standard errors produced by CB-SEM analyses (Hair & Sarstedt, 2019). As such, uncertainty is a validity threat to measurement and has adverse consequences for the replicability of study findings (Rigdon, Sarstedt, & Becker, 2020). While uncertainty also applies to composite-based SEM, the way researchers treat models in CB-SEM analyses typically leads to a pronounced increase in uncertainty (Rigdon & Sarstedt, 2021). More precisely, in an effort to improve model fit, researchers typically reduce the number of indicators per construct, which in turn increases uncertainty (Hair, Matthews, Matthews, & Sarstedt, 2017; Rigdon et al., 2019a). These issues do not necessarily imply that composite models are superior, but they cast considerable doubt on the assumption of some researchers that CB-SEM constitutes the gold standard when measuring unobservable concepts. In fact, researchers in various fields of science show increasing appreciation that common factors may not always be the right approach to measure concepts (e.g., Rhemtulla, van Bork, & Borsboom, 2020; Rigdon, 2016). Similarly, Rigdon, Becker, and Sarstedt (2019b) show that using sum scores can significantly increase the degree of metrological uncertainty, which questions this measurement practice.
Apart from differences in the philosophy of measurement, the differing treatment of latent variables and, more specifically, the availability of construct scores also have consequences for the methods’ areas of application. Specifically, while it is possible to estimate latent variable scores within a CB-SEM framework, these estimated scores are not unique. That is, an infinite number of different sets of latent variable scores that will fit the model equally well are possible. A crucial consequence of this factor (score) indeterminacy is that the correlations between a common factor and any variable outside the factor model are themselves indeterminate (Guttman, 1955). That is, they may be high or low, depending on which set of factor scores one chooses. As a result, this limitation makes CB-SEM grossly unsuitable for prediction (e.g., Dijkstra, 2014; Hair & Sarstedt, 2021). In contrast, a major advantage of PLS-SEM is that it always produces a single specific (i.e., determinate) score for each composite of each observation, once the indicator weights/loadings are established. These determinate scores are proxies of the theoretical concepts being measured, just as factors are proxies for the conceptual variables in CB-SEM (Rigdon et al., 2017; Sarstedt et al., 2016).
Using these proxies as input, PLS-SEM applies ordinary least squares regression with the objective of minimizing the error terms (i.e., the residual variance) of the endogenous constructs. In short, PLS-SEM estimates coefficients (i.e., path model relationships) with the goal of maximizing the R2 values of the endogenous (target) constructs. This feature achieves the (in-sample) prediction objective of PLS-SEM (Hair & Sarstedt, 2021), which is therefore the preferred method when the research objective is theory development and explanation of variance (prediction of the constructs). For this reason, PLS-SEM is also regarded a variance-based SEM approach. Specifically, the logic of the PLS-SEM approach is that all of the indicators’ variance should be used to estimate the model relationships, with particular focus on prediction of the dependent variables (e.g., McDonald, 1996). In contrast, CB-SEM divides the total variance into three types – common, unique, and error variance – but utilizes only common variance (i.e., the variance shared with other indicators in the same measurement model) for the model estimation (Hair, Black, et al., 2019). That is, CB-SEM only explains the covariation between measurement and structural model indicators (Jöreskog, 1973) and does not focus on predicting dependent variables (Hair, Matthews, et al., 2017).
Attention
PLS-SEM is similar but not equivalent to PLS regression, another popular multivariate data analysis technique (Abdi, 2010; Wold, Sjöström, & Eriksson, 2001). PLS regression is a regression-based approach that explores the linear relationships between multiple independent variables and a single or multiple dependent variable(s). PLS regression differs from regular regression, however, because, in developing the regression model, the method derives composite factors from the multiple independent variables by means of principal component analysis. PLS-SEM, on the other hand, relies on prespecified networks of relationships between constructs as well as between constructs and their measures (see Mateos-Aparicio, 2011, for a more detailed comparison between PLS-SEM and PLS regression).
1.4 Considerations When Applying PLS-SEM
1.4.1 Key Characteristics of the PLS-SEM Method
Several considerations are important when deciding whether or not to apply PLS-SEM. These considerations also have their roots in the method’s characteristics. The statistical properties of the PLS-SEM algorithm have important features associated with the characteristics of the data and model used. Moreover, the properties of the PLS-SEM method affect the evaluation of the results. Four critical issues are relevant to the application of PLS-SEM (Hair et al., 2011; Hair, Risher, et al., 2019): (1) data characteristics, (2) model characteristics, (3) model estimation, and (4) model evaluation. ◘ Table 1.2 summarizes the key characteristics of the PLS-SEM method. An initial overview of these issues is provided in this chapter. For a more detailed explanation, see Hair et al. (2022).
PLS-SEM works efficiently with small sample sizes and complex models (Cassel, Hackl, & Westlund, 1999; Hair, Sarstedt, & Ringle, 2019). In addition, different from maximum likelihood-based CB-SEM, which requires normally distributed data, PLS-SEM makes no distributional assumptions (i.e., it is nonparametric). PLS-SEM can easily handle reflective and formative measurement models, as well as single-item constructs, with no identification problems. It can therefore be applied in a wide variety of research situations. When applying PLS-SEM, researchers also benefit from high efficiency in parameter estimation, which is manifested in the method’s greater statistical power in comparison to that of CB-SEM. Greater statistical power means that PLS-SEM is more likely to render a specific relationship significant when it is in fact present in the population. The same holds for the comparison with regression using sum score data, which is also characterized by lower statistical power than PLS-SEM (Hair, Hollingsworth, et al., 2017).
There are, however, several limitations of PLS-SEM. In its basic form, the technique cannot be applied when structural models contain causal loops or circular relationships between the latent variables (i.e., non-recursive models). Early extensions of the basic PLS-SEM algorithm that have not yet been implemented in standard PLS-SEM software packages, however, enable the handling of circular relationships (Lohmöller, 1989). Furthermore, since PLS-SEM does not have an established global goodness-of-fit measure, its use for theory testing and confirmation is more limited in certain situations. Recent research has attempted to promote common goodness-of-fit measures within a PLS-SEM framework (Schuberth, Henseler, & Dijkstra, 2018) but with very limited success. The concept of model fit – as defined in CB-SEM – is not applicable to PLS-SEM because of the methods’ different functioning principles (Hair, Sarstedt, & Ringle, 2019). Instead, PLS-SEM-based model estimation and assessment follow a causal–predictive paradigm, in which the objective is to test the predictive power of a model, derived from theory and logic. As such, the method strikes a balance between machine learning methods, which are fully predictive in nature and CB-SEM, which focuses on confirmation and model fit (Richter, Cepeda Carrión, Roldán, & Ringle, 2016). Its causal–predictive nature makes PLS-SEM particularly appealing for research in fields that aim to derive recommendations for practice. For example, recommendations in managerial implication sections in business research journals always include predictive statements (“our results suggest that managers should…”). Making such statements requires a prediction focus on model estimation and evaluation (Sarstedt & Danks, 2021). PLS-SEM perfectly emphasizes this need as the method sheds light on the mechanisms (i.e., the structural model relationships) through which the predictions are generated (Hair, 2020; Hair & Sarstedt, 2019, 2021).
In early writing, researchers noted that PLS estimation is “deliberately approximate” to factor-based SEM (Hui & Wold, 1982, p. 127), a characteristic previously referred to as the PLS-SEM bias (e.g., Chin, Marcolin, & Newsted, 2003). A number of studies have used simulations to demonstrate the alleged PLS-SEM bias (e.g., Goodhue, Lewis, & Thompson, 2012; McDonald, 1996; Rönkkö & Evermann, 2013). According to prior research on the PLS-SEM bias, measurement model estimates are biased upward, whereas structural model estimates are biased downward compared to CB-SEM results. The studies conclude that parameter estimates will approach what has been labeled the “true” parameter values when both the number of indicators per construct and sample size increase (Hui & Wold, 1982). However, all the abovementioned simulation studies used CB-SEM as the benchmark against which the PLS-SEM estimates were evaluated with the assumption that they should be the same. Because PLS-SEM is a composite-based approach, which uses the total variance to estimate parameters, differences can be expected in such an assessment (Lohmöller, 1989; Schneeweiß, 1991). Not surprisingly, the very same issues apply when composite models are used to estimate CB-SEM results. In fact, Sarstedt et al. (2016) show that the bias produced by CB-SEM is far more severe than that of PLS-SEM, when applying the method to the wrong type of model (i.e., estimating composite models with CB-SEM versus estimating common factor models with PLS-SEM). Apart from these conceptual concerns, simulation studies show that the differences between PLS-SEM and CB-SEM estimates, when assuming the latter as a standard of comparison, are very small, provided that measurement models meet minimum recommended standards in terms of measurement quality (i.e., reliability and validity). Specifically, when the measurement models have four or more indicators and indicator loadings meet the common standards (≥ 0.70), there are practically no differences between the two methods in terms of parameter accuracy (e.g., Reinartz, Haenlein, & Henseler, 2009; Sarstedt et al., 2016). Thus, the extensively discussed PLS-SEM bias is of no practical relevance for the vast majority of applications (e.g., Binz Astrachan, Patel, & Wanzenried, 2014).
Finally, methodological research has substantially extended the original PLS-SEM method by introducing advanced modeling, assessment, and analysis procedures. Examples include different types of robustness checks (Sarstedt et al., 2020), higher-order constructs (Sarstedt, Hair, Cheah, Becker, & Ringle, 2019), discrete choice modeling (Hair, Sarstedt, & Ringle, 2019), necessary condition analysis and related methods (Rasoolimanesh, Ringle, Sarstedt, & Olya, 2021; Richter, Schubring, Hauff, Ringle, & Sarstedt, 2020), and out-of-sample prediction metrics (Hair, 2020). Hair, Sarstedt, Ringle, and Gudergan (2018) offer an introduction into several of these advanced topics.
In the following, we discuss aspects related to data characteristics (e.g., minimum sample size requirements) and model characteristics (e.g., model complexity).
1.4.2 Data Characteristics
Data characteristics, such as minimum sample size requirements, non-normal data, and scales of measurement (i.e., the use of different scale types), are among the most often stated reasons for applying PLS-SEM across numerous disciplines (e.g., Ghasemy, Teeroovengadum, Becker, & Ringle, 2020; Hair, Sarstedt, Ringle, & Mena, 2012; Ringle et al., 2020). While some of the arguments are consistent with the method’s capabilities, others are not. In the following sections, we discuss these and also aspects related data characteristics.
1.4.2.1 Minimum Sample Size Requirements
Small sample size is likely the most often abused reason stated for using PLS-SEM, with some researchers obtaining model solutions with unacceptably low sample sizes (Goodhue et al., 2012; Marcoulides & Saunders, 2006). These researchers oftentimes believe there is some “magic” in the PLS-SEM approach that allows them to use a very small sample to obtain results representing the effects that exist in large populations of several million elements or individuals. No multivariate analysis technique, including PLS-SEM, has this kind of “magic” inferential capability (Petter, 2018).
PLS-SEM can certainly obtain solutions with smaller samples, but the population’s nature determines the situations in which small sample sizes are acceptable (Rigdon, 2016). For example, in business-to-business research, populations are often restricted in size. Assuming that other situational characteristics are equal, the more heterogeneous the population, the larger the sample size needed to achieve an acceptable accuracy (Cochran, 1977). If basic sampling theory guidelines are not considered (Sarstedt, Bengart, Shaltoni, & Lehmann, 2018), questionable results are produced.
In addition, when applying multivariate analysis techniques, the technical dimension of the sample size becomes relevant. Adhering to the minimum sample size guidelines ensures the results of a statistical method, such as PLS-SEM, have adequate statistical power. In these regards, an analysis based on an insufficient sample size may not reveal an effect that exists in the underlying population (which results in committing a type II error). Moreover, executing statistical analyses based on minimum sample size guidelines will ensure the results of the statistical method are robust and the model is generalizable to another sample from that same population. Thus, an insufficient sample size may lead to PLS-SEM results that differ from those of another larger sample. In the following, we focus on the PLS-SEM method and its technical requirements of the minimum sample size.
The overall complexity of a structural model has little influence on the minimum sample size requirements for PLS-SEM. The reason is the PLS-SEM algorithm does not compute all relationships in the structural model at the same time. Instead, it uses ordinary least squares regressions to estimate the model’s partial regression relationships. Two early studies systematically evaluated the performance of PLS-SEM with small sample sizes and concluded that the method performed well (e.g., Chin & Newsted, 1999; Hui & Wold, 1982). More recently, simulation studies by Hair et al. (2017) and Reinartz et al. (2009) indicate that PLS-SEM is the method of choice when the sample size is small. Moreover, compared with its covariance-based counterpart, PLS-SEM has higher levels of statistical power in situations with complex model structures and smaller sample sizes. Similarly, Henseler et al. (2014) show that results can be obtained with PLS-SEM when other methods do not converge or provide inadmissible solutions. For example, problems often are encountered when using CB-SEM on complex models, especially when the sample size is limited. Finally, CB-SEM encounters identification and convergence issues when formative measures are involved (e.g., Diamantopoulos & Riefler, 2011).
Unfortunately, some researchers believe sample size considerations do not play a role in the application of PLS-SEM. This idea has been fostered by the often-cited 10-time rule (Barclay, Higgins, & Thompson, 1995), which suggests the sample size should be equal to 10 times the number of independent variables in the most complex regression in the PLS path model (i.e., considering both measurement and structural models). This rule of thumb is equivalent to saying the minimum sample size should be 10 times the maximum number of arrowheads pointing at a latent variable anywhere in the PLS path model. While this rule offers a rough guideline, the minimum sample size requirement should consider the statistical power of the estimates. To assess statistical power, researchers can consider power tables (Cohen, 1992) or power analyses using programs, such as G*Power (Faul, Erdfelder, Buchner, & Lang, 2009), which is available free of charge at ► http://www.gpower.hhu.de/. These approaches do not explicitly consider the entire model but instead use the most complex regression in the (formative) measurement models and structural model of a PLS path model as a point of reference for assessing the statistical power. In doing so, researchers typically aim at achieving a power level of 80%. However, the minimum sample size resulting from these calculations may still be too small (Kock & Hadaya, 2018).
Addressing these concerns, Kock and Hadaya (2018) proposed the inverse square root method, which considers the probability that the ratio of a path coefficient and its standard error will be greater than the critical value of a test statistic for a specific significance level. The results depend, therefore, on only one path coefficient and are dependent neither on the size of the most complex regression in the (formative) models nor on the size of the overall model. Assuming a common power level of 80% and significance levels of 1%, 5%, and 10%, the minimum sample size (nmin) is given by the following equations, respectively, where pmin is the value of the path coefficient with the minimum magnitude in the PLS path model:
Significance level = 1%: \( {n}_{\mathrm{min}}>{\left(\frac{3.168}{\left|{p}_{\mathrm{min}}\right|}\right)}^2 \).
Significance level = 5%: \( {n}_{\mathrm{min}}>{\left(\frac{2.486}{\left|{p}_{\mathrm{min}}\right|}\right)}^2 \).
Significance level = 10%: \( {n}_{\mathrm{min}}>{\left(\frac{2.123}{\left|{p}_{\mathrm{min}}\right|}\right)}^2 \).
For example, assuming a significance level of 5% and a minimum path coefficient of 0.2, the minimum sample size is given by
This result needs to be rounded to the next integer, so the minimum sample size is 155.
The inverse square root method is rather conservative, in that it slightly overestimates the sample size required to render an effect significant at a given power level. Most importantly, the method is characterized by its ease of use, since it can be readily implemented.
Nevertheless, two considerations are important when using the inverse square root method. First, by using the smallest statistical path coefficient as the point of reference, the method can be misleading as researchers will not expect marginal effects to be significant. For example, assuming a 5% significance level and a minimum path coefficient of 0.01 would require a sample size of 61,802! Hence, researchers should choose a higher path coefficient as input, depending on whether the model produces either overall weak or strong effects or the smallest relevant (to be detected) effect.
Second, by relying on model estimates, the inverse square root method follows a retrospective approach. As a result, this assessment approach can be used as a basis for additional data collection or adjustments in the model. If possible, however, researchers should follow a prospective approach by trying to derive the minimum expected effect size prior to data analysis. To do so, researchers can draw on prior research involving a comparable conceptual background or models with similar complexity or, preferably, the results of a pilot study, which tested the hypothesized model using a smaller sample of respondents from the same population. For example, if the pilot study produced a minimum path coefficient of 0.15, this value should be chosen as input for computing the required sample size for the main study.
In most cases, however, researchers have only limited information regarding the expected effect sizes, even if a pilot study has been conducted. Hence, it is reasonable to consider ranges of effect sizes rather than specific values to determine the sample size required for a specific study. ◘ Table 1.3 shows the minimum sample size requirement for different significance levels and varying ranges of pmin. In deriving the minimum sample size, it is reasonable to consider the upper boundary of the effect range as reference, since the inverse square root method is rather conservative. For example, when assuming that the minimum path coefficient expected to be significant is between 0.11 and 0.20, one would need approximately 155 observations to render the corresponding effect significant at 5%. Similarly, if the minimum path coefficient expected to be significant is between 0.31 and 0.40, then the recommended sample size would be 39.
1.4.2.2 Missing Value Treatment
As with other statistical analyses, missing values should be dealt with when using PLS-SEM. For reasonable limits (i.e., less than 5% values missing per indicator), missing value treatment options, such as mean replacement, the EM (expectation–maximization) algorithm, and nearest neighbor (e.g., Hair, Black, et al., 2019), generally result in only slightly different PLS-SEM estimates (Grimm & Wagner, 2020). Alternatively, researchers can opt for deleting all observations with missing values, which decreases variation in the data and may introduce biases when certain groups of observations have been deleted systematically.
1.4.2.3 Non-normal Data
The use of PLS-SEM has two other key advantages associated with data characteristics (i.e., distribution and scales). In situations where it is difficult or impossible to meet the stricter requirements of more traditional multivariate techniques (e.g., normal data distribution), PLS-SEM is always the preferred method. PLS-SEM’s greater flexibility is described by the label “soft modeling,” coined by Wold (1982), who developed the method. It should be noted, however, that “soft” is attributed only to the distributional assumptions and not to the concepts, models, or estimation techniques (Lohmöller, 1989). PLS-SEM’s statistical properties provide very robust model estimations with data that have normal as well as extremely non-normal (i.e., skewness and/or kurtosis) distributional properties (Hair, Hollingsworth, et al., 2017; Hair, Matthews, et al., 2017; Reinartz et al., 2009). It must be remembered, however, that influential observations, outliers, and collinearity do influence the ordinary least squares regressions in PLS-SEM and researchers should evaluate the data and results for these issues (Hair, Black, et al., 2019).
1.4.2.4 Scales of Measurement
The PLS-SEM algorithm generally requires variables to be measured on a metric scale (ratio scale or interval scale) for the measurement model indicators. But the method also works well with ordinal scales with equidistant data points (i.e., quasi-metric scales; Sarstedt & Mooi, 2019; Chap. 3.6) and with binary-coded data. The use of binary-coded data is often a means of including categorical control variables (Hair et al., 2022) or moderators in PLS-SEM models. In short, binary indicators can be included in PLS-SEM models but require special attention. For example, using PLS-SEM in discrete choice experiments, where the aim is to explain or to predict a binary dependent variable, requires specific designs and estimation routines (Hair, Ringle, Gudergan, Fischer, Nitzl, & Menictas, 2019).
1.4.2.5 Secondary Data
Secondary data are data that have already been gathered, often for a different research purpose some time ago (Sarstedt & Mooi, 2019; Chap. 3.2.1). Secondary data are increasingly available to explore real-world phenomena. Research based on secondary data typically focuses on a different objective than in a standard CB-SEM analysis, which is strictly confirmatory in nature. More precisely, secondary data are mainly used in exploratory research to propose causal–predictive relationships in situations that have little clearly defined theory (Hair, Matthews, et al., 2017; Hair, Hollingsworth, et al., 2017). Such settings require researchers to place greater emphasis on examining all possible relationships rather than achieving model fit (Nitzl, 2016). By its nature, this process creates large, complex models that can hardly be analyzed with the CB-SEM method. In contrast, due to its less stringent data requirements, PLS-SEM offers the flexibility needed for the interplay between theory and data (Nitzl, 2016). Or, as Wold (1982, p. 29) notes, “soft modeling is primarily designed for research contexts that are simultaneously data-rich and theory-skeletal.” Furthermore, the increasing popularity of secondary data analysis (e.g., by using data that stem from company databases, social media, customer tracking, national statistical bureaus, or publicly available survey data) shifts the research focus from strictly confirmatory to predictive and causal–predictive modeling. Such research settings are a perfect fit for the prediction-oriented PLS-SEM approach and even more so when assessing out-of-sample prediction (Shmueli, et al., 2019).
PLS-SEM also proves valuable for analyzing secondary data from a measurement theory perspective. First, unlike survey measures, which are usually crafted to confirm a well-developed theory, measures used in secondary data sources are typically not created and refined over time for confirmatory analyses. Thus, achieving model fit is very unlikely with secondary data measures in most research situations when using CB-SEM. Second, researchers who use secondary data do not have the opportunity to revise or refine the measurement model to achieve fit. Third, a major advantage of PLS-SEM when using secondary data is that it permits the unrestricted use of single-item and formative measures. This is extremely valuable for research involving secondary data, because many measures included in corporate databases are artifacts, such as financial ratios and other firm-fixed factors (Henseler, 2017). Such artifacts typically are reported in the form of formative indices whose estimation dictates the use of PLS-SEM.
◘ Table 1.4 summarizes key considerations related to data characteristics.
1.4.3 Model Characteristics
PLS-SEM is very flexible in its modeling properties. In its basic form, the PLS-SEM algorithm requires all models to not include circular relationships or loops of relationships between the latent variables in the structural model. Although causal loops are sometimes specified in business research, this characteristic does not limit the applicability of PLS-SEM, if such models are required as Lohmöller’s (1989) extensions of the basic PLS-SEM algorithm allow for handling such model types. Other model specification requirements that constrain the use of CB-SEM, such as distribution and identification assumptions, are generally not relevant with PLS-SEM.
Measurement model difficulties are one of the major obstacles to obtaining a solution with CB-SEM. For instance, estimation of complex models with many latent variables and/or indicators is often impossible with CB-SEM. In contrast, PLS-SEM can easily be applied in such situations, since this method is not constrained by identification and other technical issues. Consideration of reflective and formative measurement models is a key issue in the application of SEM (Bollen & Diamantopoulos, 2017). PLS-SEM can easily handle both formative and reflective measurement models and is (therefore) considered the primary approach when the hypothesized model incorporates formative measures. CB-SEM can accommodate formative indicators, but to ensure model identification, they must follow distinct specification rules (Diamantopoulos & Riefler, 2011). In fact, the requirements often prevent running the analysis as originally planned. In contrast, PLS-SEM does not have such requirements and handles formative measurement models without any limitation. This also applies to model settings in which endogenous constructs are measured formatively. The applicability of CB-SEM to such model settings has been subject to considerable debate (Cadogan & Lee, 2013; Rigdon, 2014), but due to PLS-SEM’s multistage estimation process (Tenenhaus et al., 2005), which separates measurement from structural model estimation, the inclusion of formatively measured endogenous constructs is not an issue in PLS-SEM (Rigdon et al., 2014). The only problematic issue is when high levels of collinearity exist between the indicator variables of a formative measurement model.
Different from CB-SEM, PLS-SEM facilitates easy specification of interaction terms to map moderation effects in a path model. This makes PLS-SEM the method of choice in simple moderation models and more complex conditional process models, which combine moderation and mediation effects (Sarstedt, Hair, et al., 2020). Similarly, higher-order constructs, which allow specifying a construct simultaneously on different levels of abstraction (Sarstedt et al., 2019), can readily be implemented in PLS-SEM.
Finally, PLS-SEM is capable of estimating very complex models. For example, if theoretical or conceptual assumptions support large models and sufficient data are available (i.e., meeting minimum sample size requirements), PLS-SEM can handle models of almost any size, including those with dozens of constructs and hundreds of indicator variables. As noted by Wold (1985), PLS-SEM is virtually without competition when path models with latent variables are complex in their structural relationships. ◘ Table 1.5 summarizes rules of thumb for PLS-SEM model considerations.
1.5 Guidelines for Choosing Between PLS-SEM and CB-SEM
Summarizing the previous discussions and drawing on Hair, Risher, et al. (2019), ◘ Table 1.6 displays the rules of thumb applied when deciding whether to use CB-SEM or PLS-SEM. As can be seen, PLS-SEM is not recommended as a universal alternative to CB-SEM. Both methods differ from a statistical point of view, are designed to achieve different objectives, and rely on different measurement philosophies. Neither of the techniques is generally superior to the other, and neither of them is appropriate for all situations (Petter, 2018). Hence, to answer the question of when to use PLS-SEM versus CB-SEM, researchers should focus on the characteristics and objectives that distinguish the two methods (Hair, Sarstedt, Ringle, & Mena, 2012). Broadly speaking, with its strong focus on model fit and in light of its extensive data requirements, CB-SEM is particularly suitable for testing a theory in the confinement of a concise theoretical model. However, if the primary research objective is prediction and explanation of target constructs (Rigdon, 2012), PLS-SEM should be given preference (Hair, Sarstedt, & Ringle, 2019; Hair, Hollingsworth, Randolph, & Chong, 2017).
In general, the strengths of PLS-SEM are CB-SEM’s limitations and vice versa, although PLS-SEM is increasingly being applied for scale development and confirmation (Hair, Howard, & Nitzl, 2020). It is important that researchers understand the different applications each approach was developed for and use them accordingly. Researchers need to apply the SEM technique that best suits their research objective, data characteristics, and model setup (Roldán & Sánchez-Franco, 2012).
Summary
SEM is a second-generation multivariate data analysis method, which facilitates analyzing the relationships among constructs, each measured by one or more indicator variables. The primary advantage of SEM is its ability to measure complex model relationships while accounting for measurement error inherent in the indicators. There are two types of SEM methods – CB-SEM and PLS-SEM. The two method types differ in the way they estimate the model parameters and their assumptions regarding the nature of measurement. Compared to CB-SEM, PLS-SEM emphasizes prediction, while simultaneously relaxing the demands regarding the data and specification of relationships. PLS-SEM aims at maximizing the endogenous latent variables’ explained variance by estimating partial model relationships in an iterative sequence of ordinary least squares regressions. In contrast, CB-SEM estimates model parameters, such that the discrepancy between the estimated and sample covariance matrices is minimized. Instead of following a common factor model logic in estimating concept proxies as CB-SEM does, PLS-SEM calculates composites of indicators that serve as proxies for the concepts under research. The method is not constrained by identification issues, even if the model becomes complex – a situation that typically restricts CB-SEM use – and does not rely on distributional assumptions. Moreover, PLS-SEM can better handle formative measurement models and has advantages when sample sizes are relatively small as well as when analyzing secondary data. Researchers should consider the two SEM approaches as complementary and apply the SEM technique that best suits their research objective, data characteristics, and model setup.
Exercise
Please answer the following questions:
-
1.
When would SEM methods be more advantageous than first-generation techniques in understanding relationships between variables?
-
2.
Why should social science researchers consider using SEM instead of multiple regression?
-
3.
What are the most important considerations in deciding whether to use CB-SEM or PLS-SEM?
-
4.
Under what circumstances is PLS-SEM the preferred method over CB-SEM?
-
5.
Why is an understanding of theory important when deciding whether to use PLS-SEM or CB-SEM?
-
6.
Why is PLS-SEM’s prediction focus a major advantage of the method?
References
Abdi, H. (2010). Partial least squares regression and projection on latent structure regression (PLS-Regression). WIREs Computational Statistics, 2(1), 97–106.
Ali, F., Rasoolimanesh, S. M., Sarstedt, M., Ringle, C. M., & Ryu, K. (2018). An assessment of the use of partial least squares structural equation modeling (PLS-SEM) in hospitality research. The International Journal of Contemporary Hospitality Management, 30(1), 514–538.
Bagozzi, R. P., & Philipps, L. W. (1982). Representing and testing organizational theories: A holistic construal. Administrative Science Quarterly, 27(3), 459–489.
Barclay, D. W., Higgins, C. A., & Thompson, R. (1995). The partial least squares approach to causal modeling: Personal computer adoption and use as illustration. Technology Studies, 2(2), 285–309.
Bayonne, E., Marin-Garcia, J. A., & Alfalla-Luque, R. (2020). Partial least squares (PLS) in operations management research: Insights from a systematic literature review. Journal of Industrial Engineering and Management, 13(3), 565–597.
Binz Astrachan, C. B., Patel, V. K., & Wanzenried, G. (2014). A comparative study of CB-SEM and PLS-SEM for theory development in family firm research. Journal of Family Business Strategy, 5(1), 116–128.
Bollen, K. A., & Davies, W. R. (2009). Causal indicator models: Identification, estimation, and testing. Structural Equation Modeling, 16(3), 498–522.
Bollen, K. A., & Diamantopoulos, A. (2017). In defense of causal-formative indicators: A minority report. Psychological Methods, 22(3), 581–596.
Cadogan, J. W., & Lee, N. (2013). Improper use of endogenous formative variables. Journal of Business Research, 66(2), 233–241.
Cassel, C., Hackl, P., & Westlund, A. H. (1999). Robustness of partial least squares method for estimating latent variable quality structures. Journal of Applied Statistics, 26(4), 435–446.
Cepeda Carrión, G., Cegarra-Navarro, J.-G., & Cillo, V. (2019). Tips to use partial least squares structural equation modelling (PLS-SEM) in knowledge management. Journal of Knowledge Management, 23(1), 67–89.
Chin, W. W. (1998). The partial least squares approach to structural equation modeling. In G. A. Marcoulides (Ed.), Modern methods for business research (pp. 295–358). Mahwah, NJ: Erlbaum.
Chin, W. W., Cheah, J.-H., Liu, Y., Ting, H., Lim, X.-J., & Cham, T. H. (2020). Demystifying the role of causal-predictive modeling using partial least squares structural equation modeling in information systems research. Industrial Management & Data Systems, 120(12), 2161–2209.
Chin, W. W., Marcolin, B. L., & Newsted, P. R. (2003). A partial least squares latent variable modeling approach for measuring interaction effects: Results from a Monte Carlo simulation study and an electronic-mail emotion/adoption study. Information Systems Research, 14(2), 189–217.
Chin, W. W., & Newsted, P. R. (1999). Structural equation modeling analysis with small samples using partial least squares. In R. H. Hoyle (Ed.), Statistical strategies for small sample research (pp. 307–341). Thousand Oaks, CA: Sage.
Cochran, W. G. (1977). Sampling techniques. New York, NY: Wiley.
Cohen, J. (1992). A power primer. Psychological Bulletin, 112(1), 155–159.
Cole, D. A., & Preacher, K. J. (2014). Manifest variable path analysis: Potentially serious and misleading consequences due to uncorrected measurement error. Psychological Methods, 19(2), 300–315.
Diamantopoulos, A. (2006). The error term in formative measurement models: Interpretation and modeling implications. Journal of Modelling in Management, 1(1), 7–17.
Diamantopoulos, A., & Riefler, P. (2011). Using formative measures in international marketing models: A cautionary tale using consumer animosity as an example. In M. Sarstedt, M. Schwaiger, & C. R. Taylor (Eds.), Measurement and research methods in international marketing (Advances in International Marketing, 22) (pp. 11–30). Bingley: Emerald.
Dijkstra, T. K. (2014). PLS’ Janus face—Response to Professor Rigdon’s “Rethinking partial least squares modeling: In praise of simple methods”. Long Range Planning, 47(3), 146–153.
do Valle, P. O., & Assaker, G. (2016). Using partial least squares structural equation modeling in tourism research: A review of past research and recommendations for future applications. Journal of Travel Research, 55(6), 695–708.
Faul, F., Erdfelder, E., Buchner, A., & Lang, A.-G. (2009). Statistical power analyses using G*Power 3.1: Tests for correlation and regression analyses. Behavior Research Methods, 41(4), 1149–1160.
Ghasemy, M., Teeroovengadum, V., Becker, J.-M., & Ringle, C. M. (2020). This fast car can move faster: A review of PLS-SEM application in higher education research. Higher Education, 80, 1121–1152.
Goodhue, D. L., Lewis, W., & Thompson, R. (2012). Does PLS have advantages for small sample size or non-normal data? MIS Quarterly, 36(3), 981–1001.
Grimm, M. S., & Wagner, R. (2020). The impact of missing values on PLS, ML and FIML model fit. Archives of Data Science, Series A, 6(1), 04.
Guttman, L. (1955). The determinacy of factor score matrices with implications for five other basic problems of common-factor theory. British Journal of Statistical Psychology, 8(2), 65–81.
Haenlein, M., & Kaplan, A. M. (2004). A beginner’s guide to partial least squares analysis. Understanding Statistics, 3(4), 283–297.
Hair, J. F. (2020). Next generation prediction metrics for composite-based PLS-SEM. Industrial Management & Data Systems, 121(1), 5–11.
Hair, J. F., Binz Astrachan, C., Moisescu, O. I., Radomir, L., Sarstedt, M., Vaithilingam, S., & Ringle, C. M. (2020). Executing and interpreting applications of PLS-SEM: Updates for family business researchers. Journal of Family Business Strategy, 12(3), 100392.
Hair, J. F., Black, W. C., Babin, B. J., & Anderson, R. E. (2019). Multivariate data analysis (8th ed.). London: Cengage Learning.
Hair, J. F., Hollingsworth, C. L., Randolph, A. B., & Chong, A. Y. L. (2017). An updated and expanded assessment of PLS-SEM in information systems research. Industrial Management & Data Systems, 117(3), 442–458.
Hair, J. F., Howard, M. C., & Nitzl, C. (2020). Assessing measurement model quality in PLS-SEM using confirmatory composite analysis. Journal of Business Research, 109, 101–110.
Hair, J. F., Hult, G. T. M., Ringle, C. M., & Sarstedt, M. (2022). A primer on partial least squares structural equation modeling (PLS-SEM) (3rd ed.). Thousand Oaks, CA: Sage.
Hair, J. F., Matthews, L., Matthews, R., & Sarstedt, M. (2017). PLS-SEM or CB-SEM: Updated guidelines on which method to use. International Journal of Multivariate Data Analysis, 1(2), 107–123.
Hair, J. F., Page, M. J., & Brunsveld, N. (2020). Essentials of business research methods (4th ed.). New York, NY: Routledge.
Hair, J. F., Ringle, C. M., Gudergan, S. P., Fischer, A., Nitzl, C., & Menictas, C. (2019). Partial least squares structural equation modeling-based discrete choice modeling: An illustration in modeling retailer choice. Business Research, 12(1), 115–142.
Hair, J. F., Ringle, C. M., & Sarstedt, M. (2011). PLS-SEM: Indeed a silver bullet. Journal of Marketing Theory and Practice, 19(2), 139–151.
Hair, J. F., Risher, J. J., Sarstedt, M., & Ringle, C. M. (2019). When to use and how to report the results of PLS-SEM. European Business Review, 31(1), 2–24.
Hair, J. F., & Sarstedt, M. (2019). Composites vs. factors: Implications for choosing the right SEM method. Project Management Journal, 50(6), 1–6.
Hair, J. F., & Sarstedt, M. (2021). Explanation plus prediction – The logical focus of project management research. Project Management Journal, 52(4), 319–322.
Hair, J. F., Sarstedt, M., Pieper, T., & Ringle, C. M. (2012). The use of partial least squares structural equation modeling in strategic management research: A review of past practices and recommendations for future applications. Long Range Planning, 45(5–6), 320–340.
Hair, J. F., Sarstedt, M., & Ringle, C. M. (2019). Rethinking some of the rethinking of partial least squares. European Journal of Marketing, 53(4), 566–584.
Hair, J. F., Sarstedt, M., Ringle, C. M., & Gudergan, S. P. (2018). Advanced issues in partial least squares structural equation modeling (PLS-SEM). Thousand Oaks, CA: Sage.
Hair, J. F., Sarstedt, M., Ringle, C. M., & Mena, J. A. (2012). An assessment of the use of partial least squares structural equation modeling in marketing research. Journal of the Academy of Marketing Science, 40(3), 414–433.
Henseler, J. (2017). Bridging design and behavioral research with variance-based structural equation modeling. Journal of Advertising, 46(1), 178–192.
Henseler, J., Dijkstra, T. K., Sarstedt, M., Ringle, C. M., Diamantopoulos, A., Straub, D. W., Ketchen, D. J., Hair, J. F., Hult, G. T. M., & Calantone, R. J. (2014). Common beliefs and reality about partial least squares: Comments on Rönkkö & Evermann (2013). Organizational Research Methods, 17(1), 182–209.
Hui, B. S., & Wold, H. (1982). Consistency and consistency at large of partial least squares estimates. In K. G. Jöreskog & H. Wold (Eds.), Systems under indirect observation, part II (pp. 119–130). Amsterdam: North-Holland.
Hwang, H., Sarstedt, M., Cheah, J.-H., & Ringle, C. M. (2020). A concept analysis of methodological research on composite-based structural equation modeling: Bridging PLSPM and GSCA. Behaviormetrika, 47(1), 219–241.
JCGM/WG1 (2008). Joint committee for guides in metrology/working group on the expression of uncertainty in measurement (JCGM/WG1): Evaluation of measurement data - guide to the expression of uncertainty in measurement. Retrieved from https://www.bipm.org/utils/common/documents/jcgm/JCGM_100_2008_E.pdf. Access date: 26 Feb 2021
Jöreskog, K. G. (1973). A general method for estimating a linear structural equation system. In A. S. Goldberger & O. D. Duncan (Eds.), Structural equation models in the social sciences (pp. 255–284). New York, NJ: Seminar Press.
Jöreskog, K. G., & Wold, H. (1982). The ML and PLS techniques for modeling with latent variables: Historical and comparative aspects. In H. Wold & K. G. Jöreskog (Eds.), Systems under indirect observation, part I (pp. 263–270). Amsterdam: North-Holland.
Kaufmann, L., & Gaeckler, J. (2015). A structured review of partial least squares in supply chain management research. Journal of Purchasing and Supply Management, 21(4), 259–272.
Khan, G., Sarstedt, M., Shiau, W.-L., Hair, J. F., Ringle, C. M., & Fritze, M. (2019). Methodological research on partial least squares structural equation modeling (PLS-SEM): A social network analysis. Internet Research, 29(3), 407–429.
Kock, N., & Hadaya, P. (2018). Minimum sample size estimation in PLS-SEM: The inverse square root and gamma-exponential methods. Information Systems Journal, 28(1), 227–261.
Lee, L., Petter, S., Fayard, D., & Robinson, S. (2011). On the use of partial least squares path modeling in accounting research. International Journal of Accounting Information Systems, 12(4), 305–328.
Lohmöller, J.-B. (1989). Latent variable path modeling with partial least squares. Heidelberg: Physica.
Manley, S. C., Hair, J. F., Williams, R. I., & McDowell, W. C. (2020). Essential new PLS-SEM analysis methods for your entrepreneurship analytical toolbox. International Entrepreneurship and Management Journal, forthcoming.
Marcoulides, G. A., & Chin, W. W. (2013). You write but others read: Common methodological misunderstandings in PLS and related methods. In H. Abdi, W. W. Chin, V. Esposito Vinzi, G. Russolillo, & Trinchera (Eds.), New perspectives in partial least squares and related methods (pp. 31–64). New York, NY: Springer.
Marcoulides, G. A., & Saunders, C. (2006). PLS: A silver bullet? MIS Quarterly, 30(2), iii–ix.
Mateos-Aparicio, G. (2011). Partial least squares (PLS) methods: Origins, evolution, and application to social sciences. Communications in Statistics–Theory and Methods, 40(13), 2305–2317.
McDonald, R. P. (1996). Path analysis with composite variables. Multivariate Behavioral Research, 31(2), 239–270.
Nitzl, C. (2016). The use of partial least squares structural equation modelling (PLS-SEM) in management accounting research: Directions for future theory development. Journal of Accounting Literature, 37(December), 19–35.
Nitzl, C., & Chin, W. W. (2017). The case of partial least squares (PLS) path modeling in managerial accounting research. Journal of Management Control, 28, 137–156.
Peng, D. X., & Lai, F. (2012). Using partial least squares in operations management research: A practical guideline and summary of past research. Journal of Operations Management, 30(6), 467–480.
Petter, S. (2018). "Haters gonna hate": PLS and information systems research. ACM SIGMIS Database: the DATABASE for Advances in Information Systems, 49(2), 10–13.
Rasoolimanesh, S. M., Ringle, C. M., Sarstedt, M., & Olya, H. (2021). The combined use of prediction-oriented approaches: Partial least squares-structural equation modeling and fuzzyset qualitative comparative analysis. International Journal of Contemporary Hospitality Management, 33(5), 1571–1592.
Reinartz, W., Haenlein, M., & Henseler, J. (2009). An empirical comparison of the efficacy of covariance-based and variance-based SEM. International Journal of Research in Marketing, 26(4), 332–344.
Rhemtulla, M., van Bork, R., & Borsboom, D. (2020). Worse than measurement error: Consequences of inappropriate latent variable measurement models. Psychological Methods, 25(1), 30–45.
Richter, N. F., Cepeda Carrión, G., Roldán, J. L., & Ringle, C. M. (2016). European management research using partial least squares structural equation modeling (PLS-SEM): Editorial. European Management Journal, 34(6), 589–597.
Richter, N. F., Schubring, S., Hauff, S., Ringle, C. M., & Sarstedt, M. (2020). When predictors of outcomes are necessary: Guidelines for the combined use of PLS-SEM and NCA. Industrial Management & Data Systems, 120(12), 2243–2267.
Richter, N. F., Sinkovics, R. R., Ringle, C. M., & Schlägel, C. (2016). A critical look at the use of SEM in International Business Research. International Marketing Review, 33(3), 376–404.
Rigdon, E. E. (2012). Rethinking partial least squares path modeling: In praise of simple methods. Long Range Planning, 45(5–6), 341–358.
Rigdon, E. E. (2013). Partial least squares path modeling. In G. R. Hancock & R. D. Mueller (Eds.), Structural equation modeling: A second course (2nd ed., pp. 81–116). Charlotte, NC: Information Age.
Rigdon, E. E. (2014). Rethinking partial least squares path modeling: Breaking chains and forging ahead. Long Range Planning, 47(3), 161–167.
Rigdon, E. E. (2016). Choosing PLS path modeling as analytical method in European management research: A realist perspective. European Management Journal, 34(6), 598–605.
Rigdon, E. E., Becker, J.-M., Rai, A., Ringle, C. M., Diamantopoulos, A., Karahanna, E., Straub, D. W., & Dijkstra, T. K. (2014). Conflating antecedents and formative indicators: A comment on Aguirre-Urreta and Marakas. Information Systems Research, 25(4), 780–784.
Rigdon, E. E., Becker, J.-M., & Sarstedt, M. (2019a). Factor indeterminacy as metrological uncertainty: Implications for advancing psychological measurement. Multivariate Behavioral Research, 54(3), 429–443.
Rigdon, E. E., Becker, J.-M., & Sarstedt, M. (2019b). Parceling cannot reduce factor indeterminacy in factor analysis: A research note. Psychometrika, 84(3), 772–780.
Rigdon, E. E., Sarstedt, M., & Becker, J.-M. (2020). Quantify uncertainty in behavioral research. Nature Human Behaviour, 4(4), 329–331.
Rigdon, E. E., & Sarstedt, M. (2021). Accounting for uncertainty in the measurement of unobservable marketing phenomena. In H. Baumgartner & B. Weijters (Eds.), Review of marketing research, forthcoming.
Rigdon, E. E., Sarstedt, M., & Ringle, C. M. (2017). On comparing results from CB-SEM and PLS-SEM: Five perspectives and five recommendations. Marketing ZFP, 39(3), 4–16.
Ringle, C. M., Sarstedt, M., Mitchell, R., & Gudergan, S. P. (2020). Partial least squares structural equation modeling in HRM research. International Journal of Human Resource Management, 31(12), 1617–1643.
Ringle, C. M., Sarstedt, M., & Straub, D. W. (2012). A critical look at the use of PLS-SEM in MIS Quarterly. MIS Quarterly, 36(1), iii–xiv.
Roldán, J. L., & Sánchez-Franco, M. J. (2012). Variance-based structural equation modeling: Guidelines for using partial least squares in information systems research. In M. Mora, O. Gelman, A. L. Steenkamp, & M. Raisinghani (Eds.), Research methodologies, innovations and philosophies in software systems engineering and information systems (pp. 193–221). Hershey, PA: IGI Global.
Rönkkö, M., & Evermann, J. (2013). A critical examination of common beliefs about partial least squares path modeling. Organizational Research Methods, 16(3), 425–448.
Rönkkö, M., McIntosh, C. N., & Antonakis, J. (2015). On the adoption of partial least squares in psychological research: Caveat emptor. Personality and Individual Differences, 87(December), 76–84.
Rossiter, J. R. (2011). Measurement for the social sciences: The C-OAR-SE method and why it must replace psychometrics. Berlin: Springer.
Russo, D., & Stol, K.-J. (2021). PLS-SEM for software engineering research: An introduction and survey. ACM Computing Surveys, 54(4), Article 78.
Sarstedt, M., Bengart, P., Shaltoni, A. M., & Lehmann, S. (2018). The use of sampling methods in advertising research: A gap between theory and practice. International Journal of Advertising, 37(4), 650–663.
Sarstedt, M., Hair, J. F., Cheah, J.-H., Becker, J.-M., & Ringle, C. M. (2019). How to specify, estimate, and validate higher-order models. Australasian Marketing Journal, 27(3), 197–211.
Sarstedt, M., Hair, J. F., Nitzl, C., Ringle, C. M., & Howard, M. C. (2020). Beyond a tandem analysis of SEM and PROCESS: Use PLS-SEM for mediation analyses! International Journal of Market Research, 62(3), 288–299.
Sarstedt, M., Hair, J. F., Ringle, C. M., Thiele, K. O., & Gudergan, S. P. (2016). Estimation issues with PLS and CB-SEM: Where the bias lies! Journal of Business Research, 69(10), 3998–4010.
Sarstedt, M., & Mooi, E. A. (2019). A concise guide to market research: The process, data, and methods using IBM SPSS statistics (3rd ed.). Berlin: Springer.
Sarstedt, M., Ringle, C. M., Cheah, J.-H., Ting, H., Moisescu, O. I., & Radomir, L. (2020). Structural model robustness checks in PLS-SEM. Tourism Economics, 26(4), 531–554.
Sarstedt, M., & Danks, N. (2021). Prediction in HRM research—A gap between rhetoric and reality. Human Resource Management Journal, forthcoming.
Sarstedt, M., Ringle, C. M., Smith, D., Reams, R., & Hair, J. F. (2014). Partial least squares structural equation modeling (PLS-SEM): A useful tool for family business researchers. Journal of Family Business Strategy, 5(1), 105–115.
Schneeweiß, H. (1991). Models with latent variables: LISREL versus PLS. Statistica Neerlandica, 45(2), 145–157.
Schuberth, F., Henseler, J., & Dijkstra, T. K. (2018). Confirmatory composite analysis. Frontiers in Psychology, 9, 2541.
Tenenhaus, M., Esposito Vinzi, V., Chatelin, Y.-M., & Lauro, C. (2005). PLS path modeling. Computational Statistics & Data Analysis, 48(1), 159–205.
Usakli, A., & Kucukergin, K. G. (2018). Using partial least squares structural equation modeling in hospitality and tourism: Do researchers follow practical guidelines? International Journal of Contemporary Hospitality Management, 30(11), 3462–3512.
Willaby, H., Costa, D., Burns, B., MacCann, C., & Roberts, R. (2015). Testing complex models with small sample sizes: A historical overview and empirical demonstration of what partial least squares (PLS) can offer differential psychology. Personality and Individual Differences, 84, 73–78.
Wold, H. (1982). Soft modeling: The basic design and some extensions. In K. G. Jöreskog & H. Wold (Eds.), Systems under indirect observations, part II (pp. 1–54). Amsterdam: North-Holland.
Wold, H. (1985). Partial least squares. In S. Kotz & N. L. Johnson (Eds.), Encyclopedia of statistical sciences (pp. 581–591). New York, NY: John Wiley.
Wold, S., Sjöström, M., & Eriksson, L. (2001). PLS-regression: A basic tool of chemometrics. Chemometrics and Intelligent Laboratory Systems, 58(2), 109–130.
Zeng, N., Liu, Y., Gong, P., Hertogh, M., & König, M. (2021). Do right PLS and do PLS right: A critical review of the application on PLS in construction management research. Frontiers of Engineering Management, 8(3), 356–369.
Suggested Readings
Chin, W. W. (1998). The partial least squares approach to structural equation modeling. In G. A. Marcoulides (Ed.), Modern methods for business research (pp. 295–358). Mahwah, NJ: Erlbaum.
Hair, J. F., Binz Astrachan, C., Moisescu, O. I., Radomir, L., Sarstedt, M., Vaithilingam, S., & Ringle, C. M. (2020). Executing and interpreting applications of PLS-SEM: Updates for family business researchers. Journal of Family Business Strategy, 12(3), 100392.
Jöreskog, K. G., & Wold, H. (1982). The ML and PLS techniques for modeling with latent variables: Historical and comparative aspects. In H. Wold & K. G. Jöreskog (Eds.), Systems under indirect observation, part I (pp. 263–270). Amsterdam: North-Holland.
Lohmöller, J.-B. (1989). Latent variable path modeling with partial least squares. Heidelberg: Physica.
Rigdon, E. E. (2012). Rethinking partial least squares path modeling: In praise of simple methods. Long Range Planning, 45(5–6), 341–358.
Sarstedt, M., Hair, J. F., Ringle, C. M., Thiele, K. O., & Gudergan, S. P. (2016). Estimation issues with PLS and CBSEM: Where the bias lies! Journal of Business Research, 69(10), 3998–4010.
Tenenhaus, M., Esposito Vinzi, V., Chatelin, Y.-M., & Lauro, C. (2005). PLS path modeling. Computational Statistics & Data Analysis, 48(1), 159–205.
Wold, H. (1982). Soft modeling: The basic design and some extensions. In K. G. Jöreskog & H. Wold (Eds.), Systems under indirect observations, part II (pp. 1–54). Amsterdam: North-Holland.
Author information
Authors and Affiliations
Rights and permissions
Open Access This chapter is licensed under the terms of the Creative Commons Attribution 4.0 International License (http://creativecommons.org/licenses/by/4.0/), which permits use, sharing, adaptation, distribution and reproduction in any medium or format, as long as you give appropriate credit to the original author(s) and the source, provide a link to the Creative Commons license and indicate if changes were made.
The images or other third party material in this chapter are included in the chapter’s Creative Commons license, unless indicated otherwise in a credit line to the material. If material is not included in the chapter’s Creative Commons license and your intended use is not permitted by statutory regulation or exceeds the permitted use, you will need to obtain permission directly from the copyright holder.
Copyright information
© 2021 The Author(s)
About this chapter

Cite this chapter
Hair, J.F., Hult, G.T.M., Ringle, C.M., Sarstedt, M., Danks, N.P., Ray, S. (2021). An Introduction to Structural Equation Modeling. In: Partial Least Squares Structural Equation Modeling (PLS-SEM) Using R. Classroom Companion: Business. Springer, Cham. https://doi.org/10.1007/978-3-030-80519-7_1
Download citation
DOI: https://doi.org/10.1007/978-3-030-80519-7_1
Published:
Publisher Name: Springer, Cham
Print ISBN: 978-3-030-80518-0
Online ISBN: 978-3-030-80519-7
eBook Packages: Business and ManagementBusiness and Management (R0)