
Abstract
The medical industry collects a huge amount of data, most of which is electronic health records. These data cannot be processed and analyzed using traditional statistical or data analysis methods because of the complexity and a volume of the data. So the knowledge discovery from raw clinical data is a big challenge for healthcare system. In this chapter we introduce the issue of data mining in healthcare, i.e. how to use the raw clinical data to ensure a systematic approach to health problems, highlight good practices, reveal inefficiencies, and improve healthcare efficiency. We identify the data sources used in healthcare, discuss its adequacy, interpretation, transformation and cleansing challenges. Also we consider the variety characteristics and specific capacities of methods, applied in the areas of data mining. Particular attention is paid to the diversity of Machine Learning and Artificial intelligence methods, analytical health data analysis models, its testing and evaluation capabilities.
You have full access to this open access chapter, Download chapter PDF
Keywords
1 Introduction
It is common, that business entities understand the importance of historical data and the role of analytics for exploring activities of a company or organization. A wealth of data on a variety of statistical and data mining techniques empowers to predict the future of a business or an enterprise, plan marketing and production strategies. Unfortunately, the amount of data collected does not yet ensure quality and value of analytical information to be provided to its owners. The “use of qualified data mining methods” would allow to obtain hidden information from the data and help to make the right decisions and predict prospects when there were uncertainties in real situations [1, 2].
Data mining is strongly based on classical statistical principles and general specific analytical techniques. However, their tasks are different. Data mining focusses on the applications domain- oriented goals of the performed analyses, whereas the classical data analysis methods are better understood and revealed by the data base, its properties, and key relationships. Thus, even the historical data-driven “black box” methods such as neural networks, swarm intelligence, and other machine learning methods are considered to be useful data mining methods to help predict the behaviour of analysed processes, although they do not enable to determine the nature or causal relationships of individual variables in the form of rules. From the point of view of classical statistics, such methods are considered to be ‘dirty’ ([3], p. 8). However, due to the abundance of practical applications, all these ‘dirty’ methods have taken their rightful place in the ranking among the classical methods.
The classical statistical methods strive to determine data structure by a predetermined model, while the data-driven models seek to discover structure from the acquired data. The first approach conforms to the Aristotle’s deductive search: first a model is chosen and evaluated how the explored situation fits the theoretical method. The data mining models are more in line with Plato’s inductive relationship of determining path-truth by gradually improving our approach based on the available information [2].
The healthcare data does not follow the predetermined structural requirements or processes, which are common for the business entities. The healthcare data is captured for big variety of purposes, starting from investigating health parameters (which are assigned to the precision medicine), it originates in the form of handwriting or voice records of doctors, or register visits and prescriptions. The variety of data sources and analytical goals makes the field of healthcare information analytics fragmented and unspecified by means of application of methods and evaluating their performance. The chapter analyses the characteristics of the data sources of healthcare domain and their enhancement due to the PCC approach, the solutions for their analytics, the general data mining process and considerations for building analytical models for healthcare.
2 Healthcare Data Sources
In general, the healthcare systems encompass the relationships among the individuals aiming to investigate their health status by employing the competences of medical personnel. This relationship is maintained by building complex web of interrelationships, which ensure all types of services, infrastructural support, financing, production of pharmaceutical and other material provision, as well as governmental and state-wide maintenance and control. There is no standard approach for implementing systems which could be able to reflect this complexity, therefore the healthcare systems worldwide are built and modified combining their unique settings, available budgets, best practices.
The information flows are emanating in each interaction of the healthcare system, making it natural to increasing pervasive application of information technologies. However, the human factor is strong and to high extent irreplaceable in all types of the interactions of the healthcare system which is created for people and driven by people. This makes it impossible to build the healthcare information system similarly to management information system concept as a “mirror of real processes”, designed to observe and monitor its performance and efficiency by exploring process and transaction data entirely in digital mode. The digitalization of healthcare information only partially captures and covers the areas, which enable data collection and processing for analysis, inference, forecasting, and expert insights.
Summarizing the discussion of previous chapters of the book, the broad four groups of data sources can be identified in the healthcare systems in general, where the group 4 correspond to the specific requirements for application of PCC:
- Group 1::
-
The intentionally collected exact measurements of healthcare parameters, such as heart rate, weight, blood structure, and other similar numeric indicators, visual information of X-ray, telemedicine information exchange, which have the established system of their measurement and application for healthcare processes, such as diagnostics, treatment, surgery, rehabilitation.
- Group 2::
-
Collecting health related data and factors, as well as the healthcare outcomes and expert knowledge for elaborating data driven models with the goal to assist experts in decision making and their professional work processes. These data are collected for processing and partially replacement or supplementing competences and expert knowledge of medical specialists.
- Group 3::
-
The healthcare economics data, such as census data, tax, budget, healthcare service and human resource cost and other information which influence performance and efficiency of the healthcare system. The design, evaluation and monitoring of the efficiency measures enable comparative evaluation and improvement of the healthcare systems in general, and their cost containment.
- Group 4::
-
Searching and identifying initially unknown factors, causalities and insights which could potentially determine the health status of person and its deviations. These data are collected from multiple sources, both structured and unstructured, and are processed by integrated intelligent analysis. In general healthcare systems this type of analysis has supporting role to the needs of health promotion, however, it becomes core need for applying the Person-centred care approach.
3 Data Mining Solutions in Healthcare
The level of application of the data mining, machine learning and AI methods in healthcare is varied: some of the methods are already widely applied, especially for the data of Group 1. Analysis of the healthcare system based of PCC approach reveals no only the conceptual change. The idea of person centeredness enables continuous involvement of person in the healthcare system by consistent and broad capturing information related to health status (without targeting specific diagnosis), also increases responsibility and awareness of the person by increasing his healthcare literacy, which leads to the necessity to capture the information which characterizes life style, as well as the emotional context, family and community involvement in person care, as well as resource availability, motivation, and other factors. The identification of important data, access to its sources and complexity of its processing is especially high for the data of Group 4, which determines current low, yet consistently increasing level of applying AI.
The variety of AI methodologies applied for healthcare data analytics, as discussed in the systematic review [4], discovered that 65% (244/378 publications) of the relevant publications focussed on analysis of structured clinical data, followed by unstructured imaging data (17%). This systematic review included publications o AI application in healthcare on the period 2000–2018. The ANN and deep learning networks were the major methods applied in the research works. The search of recent articles in Web of knowledge 2018–2021 revealed dramatic increase of AI application in healthcare, comparing to the results reported in Ben Israel et al. [4]. The search of Web of Knowledge during 2018–2021 for indexes: SCI-EXPANDED, SSCI, A&HCI, CPCI-S, CPCI-SSH, ESCI and topic (healthcare AND (“artificial intelligence”)) gave 1213 results, where 441 were assigned to computer science and health informatics disciplines. However narrowing the search to PCC approach by topic (healthcare AND (“artificial intelligence”) AND (“person centered”)) gave only one result, where the recurrent neural networks (RNN) were applied for questionnaire data. The search of Web of Knowledge for topic: (healthcare AND (“person centered”)) during 2018–2021 gave result of 247 publications, however only 12 of them fell in the categories computer science artificial intelligence or computer science cybernetics or computer science interdisciplinary applications or engineering biomedical or computer science theory methods or medical informatics or information science library science. It can be summarized that application of AI methods for the data sources corresponding to the PCC approach is in the initial stage of research.
The variety of machine learning and AI methods can be revealed by applying several principles: classification by their paradigms, such as supervised, unsupervised, reinforcement learning, deep learning, and ensemble methods. The more widely accepted approach is based on summarized representation of AI algorithms (methods), and their modifications. In Fig. 9.1 the summary of machine learning and AI methods reveals their symbolic mapping, variety and constant new developments of this area. The new developments have brought new titles of algorithms and new achievements in analytics. To name a few, the methods include Long short-term memory (LSTM), deep belief network (DBN). RPA (Robotic process automation), (https://www.guru99.com/robotic-process-automation-tutorial.html), and its enhancement in the AI area to Intelligent Process Automation (IPA), language processing GPT-3.
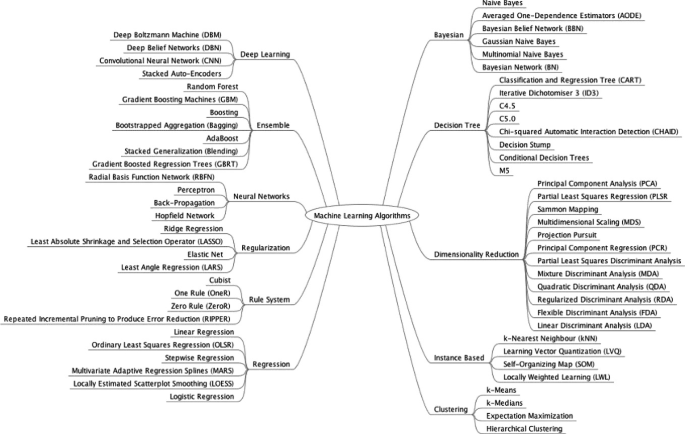
The machine learning algorithms (https://machinelearningmastery.com/how-to-implement-a-machine-learning-algorithm/)
We can consider the variety, characteristics and specific capacities of methods, generally applied in the areas of data mining, processing, analytics and computational intelligence, mainly defined as the areas of machine learning and Artificial intelligence (AI):
-
Classical statistical research methods (Regression, ANOVA, discriminant analysis);
-
Logistic and probabilistic regression; Classifiers and statistical learning methods.
-
Supervised and unsupervised learning methods (Neural networks and clustering)
-
Association rules
-
Decision trees
-
Fuzzy logic
-
Genetic algorithms and swarm intelligence.
Clearly, the application of these methods is not limited to healthcare tasks. They are very widely used in economics, finance, meteorology, marketing, industrial process management, and other domains [3, 5,6,7]. There are numerous cases, where the AI methods have broader application in the domain areas, which deal with the non-person related data. The industrial data has of lower sensitivity level and ethical risks for its processing, therefore in many cases it becomes pioneer domain for testing new AI methods. Successful application of the methods in various areas, as well as the tendency of rapid development of the modified and integrated solutions makes it possible to transfer the research to the medical domain. The recent achievements and solutions for cybersecurity, ethics, anonymity and others assist to more rapid AI application process in the healthcare domain.
In the following part we will present a general concept of the methods and illustrate their application in medical informatics, healthcare and person centred problem areas.
4 Development of Data Mining Process
Data mining in its broad sense refers to approaches and methods used for collecting and analysing sufficiently large amounts of testing data, allowing us to identify the significant relationships, trends and rules hidden in the data, and to apply the discovered regularities to new subsets of data with the same characteristics. The latter task—anticipating future prospects—is one of the most important tasks in data mining and is highly needed for application in various areas of healthcare data processing.
Application of data mining for solving healthcare tasks could enable doctors select best treatment plans, ensure the quickest healing process, increase patient satisfaction, or acquire better knowledge of their customers for its future application in healthcare processes. Many trends in patient behaviour or the development of health conditions only become apparent over time. Do the patients come back often, what health related habits they have to take into account, what offers and advice they are most interested in?
These are natural questions that any every healthcare service provider should know the answer to. In order to provide reliable answers to similar questions it is necessary to collect data about the patients, their health parameters, symptoms, features of diseases to be analysed for diagnostic, treatment and other purposes. The appropriate data mining methods have to be applied to analyse all relevant information. The essential assumption of data mining discipline is that past data encompasses useful information for the future. Data mining will help us to separate the meaningful signal from the noise, find the relationships between the variables, determine the trend characteristics of their change, empower with the inferential knowledge, assist decision making and forecasting.
Many data mining methods are designed for model building. A model is understood as an algorithm or set of rules that combines input variables with the output or target variables. The model should explain how a particular outcome may be determined by certain observable circumstances (input variables) and predict the outcomes in the same or in an analogous situation [8, 5]. For example, a model for predicting the outcome of the person illness the doctor should select and acquire for analysis a lot of the most relevant input variables, characterizing important symptoms and identifying diagnosis of the sick person, such as physical, chemical and structural characteristics of blood, muscles, brain, presence of other illnesses, life style habits, emotional status, etc.) and define their relationship to the target variables, such as health recovery level after treatment.
The process of model development by using data mining techniques generally combines the following steps [9]:
-
1.
Select data suitable for the analysis of the problems;
-
2.
Perform initial data analysis;
-
3.
Cleanse the data;
-
4.
Transform the data;
-
5.
Create a model;
-
6.
Check the model;
-
7.
Get results.
The steps of model development can be performed in any order. They can be used interchanging, and even repeated. The insights and knowledge which is discovered in later steps may require to repeat and take corrective actions in the previous ones. The Fig. 9.2 presents data mining model development process as a cycle containing of the tightly interconnected steps.

Application of data mining model development process
In the following sections the data mining model development process steps will be analysed in more details.
5 Data Sources
Data availability, its sufficiency and quality is essential for building analytical models of high reliability and precision. Data may be collected on-purpose and stored in the information systems for tracking financial operations, transactions, provision of services, or getting survey results on specific questions. Selecting, acquiring and managing data is a complex task:
-
The amount of data is growing exponentially, old data needs to be stored, new data are constantly emerging, making it difficult to find the data needed for each solution
-
Data records are scattered across different sources, stored by different methods and devices, and stored on different servers or processing systems.
-
Different formats, encodings and presentation options are used.
Data from internal data sources is usually stored in the company’s own databases, either in-house or cloud environments. Their content is addressing existing or potential customers, products, services and processes. The employees generate lots of information, which is in many cases not consistently documented or stored by the institution. It concerns competence and professional knowledge, concepts, thoughts, opinions, subjective evaluations of products and services, insights about competitors) which is often collected and maintained by the employees themselves. Part of the information related to operations and work practices, such as user-created rules, formulas, models are stored in the company's knowledge base.
The data sources, which cannot be managed or intentionally collected by the company for its specific purposes are generally referred as external sources. However, they may contain useful and influential data affecting the explored indicators. The examples of the external sources are databases of healthcare statistical information, civil registries, databases of legal documents, as well as the information coming in visual, audio, comment or recommendation forms form social networks, surveillance cameras and others. The monitoring and analysis of the external data sources is necessary in the stage of data selection for analytical purposes, as the available data may be not related or only partially related to the pursued objectives and problem areas.
The data can be captured and registered in the databases automatically or by the input of users, customers, or person respondents. In healthcare the data input automation can employ devices such as ambience or body sensors, observation cameras, magnetic resonance scanning and computerized tomography diagnostics devices. The manual input is widely applied as well due to the requirements for doctors and nurses to register observation and interview information with the patients, checking their personal information during admission, registering outcomes of the patient visit, including recommendations for treatment, pharmaceutical and rehabilitation purposes. The healthcare or governmental institutions may initiate collection of survey data, expert knowledge, observation materials.
Broad variety of technical and computational tools may be applied for capturing various kinds of data, its transformation and transfer for analytical purposes. The common situation of necessity to combine data sources of different formats and origins adds complexity to the data selection procedure, where specific environments, especially providing services of Big data scale, can be employed for preparing data in the forms which are ready for further processing.
The data selection process can imply technical difficulties for data acquisition. It also affects the data quality and the reliability of further analysis. The main drawbacks of data sets maybe summarized as a problem of “dirty data”, which means that the information may be not fully trusted, it may be not full, or can contain duplications and contradictions while interpreted in different contexts. The decision to apply low quality data for the data mining process bring loss [10].
The data management extent in the enterprises, healthcare, public, governmental institutions is pervasive and constantly growing. It has brought many regulations and requirements for data owners for ensuring data reliability, safety, integrity, recovery, accessibility, ethical, cybersecurity and others. Different domain areas and countries may apply specific and different legal requirements for this purpose. The medical data experiences influence of these kind of regulations as well, stating from protecting sensitive personal data, defining its sharing among healthcare institutions or providing rights of their editing, access via the user identification and authorization processes.
6 Tasks of Data Analysis
In order to select the data suitable for the analysis of the problem, we should first take into account the origin of the task we are solving. In general, the tasks may tackle:
-
Classification;
-
Evaluation;
-
Prediction;
-
Affinity grouping and association rules;
-
Clustering.
Classification is understood as the allocation of objects into the predefined classes. The classification task needs a precise explanation of the classes, and a training set covering pre-classified instances [5]. Classification operates with a discrete result, nominating or coding the identified classes. In healthcare, the diagnosis classification codes are used as a tool to group and identify diseases (such as cardiovascular, diabetes mellitus, flu), and other reasons for patient encounters, such as injuries or adverse effects of drugs. which enables to assign the most credible defined diagnosis into a code from a particular classificator. Decision tree, Neural networks, Nearest neighbour, Support Vector Machines are the main techniques and algorithms often used to solve classification problem [5].
Evaluation problem is built by selecting several input variables for estimating the solution of the problem, thus leading to the continuous numeric result, which generally falls into the interval [0,1]. This type of problem can be solved for estimating rating of patient 0 and 1, where 1 indicates a completely reliable parameter value, and 0 indicates the completely unreliable one. The physical fitness estimation is provided with the goal of obtaining overall health screening, including the level of cardiorespiratory form, the level of muscular system strength and endurance, or the level of flexibility. Regression analysis and neural networks can be used to solve evaluation tasks. This approach can also be used to estimate the time to an event (loss of a patient), where the survival analysis is applied.
Prediction is used to predict the future value of an output variable. This can be used for both classification and evaluation of the explored variable, only the time feature is added for relating available data in temporal sequence. We can check the accuracy of the forecast only after reaching the forecasted future and comparing the difference between the forecast and the actual value. Any classification and estimation techniques can also be used for forecasting by taking training data that contains the known values of the predicted variable. We can predict and forecast the number of patients to be admitted to the hospital during the coming month, the amount of the material resources to be ordered for use in the intensive care departments, the number of people who will get sick with flu during autumn season.
Affinity grouping denotes tasks where we aim to find objects or events that usually appear together. This grouping method is commonly used in diagnostics or observations for deriving insights and rules: it could evaluate if a particular coronary disease goes together with smoking, if the sleeping duration of less than 6 h daily and short-term stress is observed together with occupational burnout syndrome, does the majority of people buy prescribed medications together with self-selected vitamins. The method of association rules is often applied for affinity grouping tasks.
Clustering, unlike classification, segments objects into the previously unknown classes. Merging into clusters is performed based on the similarity of the objects to be merged. Similarity is determined by taking into account all selected characteristics of the object registered as a set of variables. Only a specialist conducting the study can determine the meaning of the resulting cluster according to the context emanating from the available input variables. It may include tasks of clustering people according to the different lifestyle habits (e.g. smoking, low physical activity) or their emotional characteristics to different segments and lead to the application of different rehabilitation tactics after their illness. Clustering by various complaints, ailments and pains can lead to recognizing segments of citizens with particular risk factors or excessive healthcare cost usage. The technique used for clustering is based on the estimating similarity of the grouped objects according to the selected metrics. Self-organizing maps method have recently become especially popular in solving clustering tasks.
The first three tasks of Classification, Evaluation and Prediction (Forecasting) make a category of the directed (supervised) data mining tasks. They always contain the goal variable (or known output) that we aim to classify, evaluate, or predict. Affinity grouping and clustering make a category of the undirected (unsupervised) data mining tasks [5]. In these cases, the input data set has no goal variable. Our objective is to find general regularities that are not directly related to a specific variable (Fig. 9.3).

Classification of data mining tasks
Once the research task has been set, it is necessary to decide what data would be needed to obtain significant results. It is beneficial to have a larger number of variables at the beginning of the data mining process, and only then refine research by selecting the most needed ones. What data are important and how much of it is needed can be decided by the expert researcher, taking into account the importance of the problem, the possibilities and cost of data collection, the subject area studied and the required accuracy of the final result.
Generally, the efforts are directed to collect as much data as possible. Only in this way can sufficient accuracy of the developed model be ensured. When there is too little data, the outcomes of the research can be ineffective or perhaps even completely pointless. If the efficiency of the model developed with a larger sample significantly bigger than using a smaller sample, it means that a smaller sample is certainly insufficient for the elaborated model. If the difference between the efficiency levels is insignificant, we can use a smaller amount of data for applying the model. The problem of data set size is important, a study using a large sample may require significantly more computing time and costs for data acquisition.
The selected prediction or forecasting technique of data mining aims to characterize future by past data, therefore it is important to have data for quite a long past period. Most of the past data has similar behaviour related to specific days of the week, weekend and holiday effects of seasons of the year, which are described as seasonality component. In general, it is recommended to have data for at least 4–6 historical seasons, but in specific cases more adjusted data requirements may be applied.
For some data mining tasks, the number of variables available for the research can be quite low, and it can negatively influence the performance of the data driven data mining methods. In these cases, the derived variables can be created, which present the summarized characteristics of data, adding value for the research. From the patient record database consisting of the information on each patient visit, we can calculate the frequency of visits, the age at particular occurrence of illnesses, the deviation from recommended body mass index at particular age, or average number of days at hospital. Thus adding new features for analysis, and providing overall picture of the aspects included to the research problem area can help better understanding the research problem.
7 Adequacy of the Data
Before creating a model, it is very important to perform data analysis to determine the adequacy of the data we collect for the task at hand. First of all, it is helpful to explore different visualisations of the data, draw a histogram of each variable, calculate the most important numerical characteristics, enabling to reflect trends, anomalies, or potential groupings. The initial exploring of data allows to detect incorrect data coding, illogical data instances, or inadequate data spread along the explored variable range.
It should be noted that the data would maintain the distributions and proportions within existing study area. If the survey is conducting for reflecting opinion of the region, it should be ensured that the survey covers a relevant proportion of respondents by age groups, gender, the ratio of urban to rural population, or the percentage of married people does not differ much from the statistical characteristic of the region.
It is always necessary to check whether the specific values of the variables meet the prescribed limits or whether the interdependence of the variables corresponds to reality. Given that the unemployment rate of some the country is 9%, a similar number of unemployed should be expected among our respondents.
The in-depth knowledge of data may be helpful and important in the cases of values, which may change their meaning over time. In the case of ratings, the rules for assigning the highest category may have experienced modifications, therefore the same rating “A” may mean different thing in different time periods [11]. In 1998, the U.S. National Institutes of Health and the Centres for Disease Control and Prevention brought U.S. definitions in line with World Health Organization guidelines, lowering the normal/overweight cut-off from BMI (Body mass index) 27.8 to BMI 25. The decision reclassified 29 million U.S. person, previously healthy, to overweight [12].
Data Cleansing
At this stage, the data need to be carefully reviewed for any coding errors, missing values or formatting mistakes in the data set, that could severely hamper the application of a particular data mining method need to be corrected. Neural networks are particularly sensitive to data errors. Decision trees and classification techniques are less sensitive to data cleanliness [13].
A common need in this stage is to decide about the data records that have non-existent, missing values. Several approaches can be applied: firstly, the records with the missing values may be not included, but then the data file may become insufficient, the deviation by proportion and number of records from real situation can occur. Replacing non-existent values with a similar mean-median or median has risk of distorting the real situation, if the existing values do not reflect the mean value of the collected data set. It is proposed to take into account the applied data mining method and the problem to be solved when choosing the method of analysis of non-existent values.
Serious problems arise when the target variable is categorical, and may acquire many values. Such types of variables are the education levels, possible cities of residence, zip code, and similar multi-valued characteristics. In this case, classification or prediction is quite difficult because some of the acquired values may lack information to describe them due to lack of records with this data value. An attempt should be made to pre-group the values of such variables or replace them with values of interest to us. In this way, the diversity of all education levels could be changed into primary, secondary and high.
Sometimes there are variables with several values that are very different from all the others. This difference can reach tens or hundreds of times. The inclusion of such values in the study can severely skew the result. Analysing the resources, available for treatment of the retired patient the statistics of Lithuania indicates differences among the minimal and maximal monthly pension approximately 9,09 times, and among the EU citizens the difference in even more crucial: as of 2018, Luxembourg recorded by far the highest level of annual median equalised net income among older people (aged 65 years or more), at 35 101 PPS (purchasing power standard), making the difference to lowest range countries, namely Lithuania, Latvia, Romania and Bulgaria, average income for older people (5749 PPS) (Eurostat, 2018).When examining such variables, it is advisable to transform such a variable by replacing each of its values with a logarithm, or even to abandon the exclusive records, if the records were occasional, and their inclusion is not necessary for the problem, e.g. proportional representation of the explored countries.
Data Transformation
Data cleansing is followed by the step of data preparing for analysis. Many data mining methods do not have the ability to work with particular data fields. Thus, they may need to be transformed into an understandable format or replaced by a variable of duration. Sometimes it is enough to replace a temporal variable with a categorical variable. Let’s say we have information about the date of birth of a school child. In many types of problem, such as evaluating physical activeness (PS) the most informative transformation may be sufficient to use a derived categorical variable to categorize patient by age: Preschool-Aged Children (3–5 years), Children and Adolescents (6–17 years), instead.
It is advisable to seriously consider what additional variables may be needed before starting model development. Various derived indices and percentage comparison of variables are very useful in research. Here are some examples:
-
Body mass index = Body weight (kg)/(Height (m))2
-
Life Expectancy Index (GTI) = (Life Expectancy-25)/60
-
PE = Price/Profit
It is not recommended to use the variables expressed by the frequency. It is better to replace them with a relative frequency or a percentage.
8 Building Analytical Models
This is the most important step in data mining. Its application depends on the specific method we use. In the following sections, describing the individual methods, we will present the essential characteristics and application of the modelling algorithms. In the cases of directed data mining tasks, the training set is used to explain the behaviour of the outcome variable depending on the input variables. This type of interpretation may be done applying neural networks, regression analysis, genetic algorithms, decision trees, or other methods capable to model the outputs by the input data set.
While solving the undirected data mining problems, the developed model must determine the relationships and dependencies between the input variables and express them through the dependency rules or by clustering the variables [14].
Data mining techniques are often classified according to the nature of the method used. There is a distinction between the supervised and unsupervised learning modes. The supervised learning is understood as a method which explores relationships and dependencies among data arranged as variety of input variables and the known output parameters. The unsupervised learning methods enable to draw conclusions only from the training data without knowing the output variables.
Examples of supervised learning are: Classification tasks; Applications of regression analysis; Time series forecasting; Various optimization tasks.
Unsupervised learning methods could include: Factor and principal components analysis; Clustering tasks; Interoperability rules.
The new models and the improvements of existing algorithms is constantly emerging in both classes.
9 Model Testing
In order to check whether the created model properly describes the observed situation, we should know, as precisely as possible, what we are aiming for, what precision and accuracy of the results do we need, what is the sensitivity and flexibility of the model and the possibilities to adapt to the changed conditions. It is clear that the answer to these questions depends on the type of model developed. Let’s say models related to human disease or high costs require increased reliability.
The efficiency of the directed data mining models is tested by using a set of test data which was not used for model development. In the classification and forecasting tasks, the accuracy of the model is measured by the error rate-percentage of incorrectly classified or predicted records. In the evaluation tasks, accuracy is understood as the difference between predicted and observed results. The overall accuracy of such models is measured by the mean error of the individual estimates. Since the average between the predicted and observed values is always equal to 0 (deviations of the sign to be distinguished outweigh each other), the average of the differences from the square deviations is usually taken [15].
The standard error of the estimate can be calculated by the formula:
where MSE denotes Mean Squared Error, ri—the observed value, pi—forecasted or predicted value, and n—number of observations. The lower value of MSE means more accurate results provided by the mode.
MSE has several main drawbacks. Firstly, this measure has high sensitivity to presence of even small number of values with big deviations. It can happen that even one anomalous values of the data set may result to misleading final results. The drawback of MSE can be solved by applying MAE-Mean Absolut Error:
However, the MAE evaluation of error is not often applied due to computational inconvenience. Another drawback of the MAE is the higher rate of the absolute value of error, which can be eliminated by square root of the MSE. In this way we get the error evaluation method SD-Standard Deviation:
It is more difficult to evaluate the precision of the undirected methods. In these tasks the most important outcome is its power to provide relevant description of various characteristics of the explored problem. The most optimal model can be understood as a sufficiently small number of rules, able to provide most complete explanation of the behaviour of the model. The measure which can express efficiency of the model is MDL-minimum description length and is defined as number of bits necessary to code all rules defining the mode. This measure can be used to compare several sets of rules among themselves, and to select the best one according to smaller MDL.
10 Evaluation of the Data Analysis Results
As the data mining processes are highly sensitive to the quality and amount of the analysed data, it may happen that the developed model is able to accurately describe the future situation, but its practical implementation could take unfeasible amount of time or require inadequate costs. In this case, it can be considered whether it is worthwhile for us to try to implement this model in practice. Value of the solution, its costs and time are the indicators that determine the expediency of applying the model and the possibility of practical application of the results. Particular care should be taken in evaluating the results for using diagnostic, treatment, rehabilitation resources, including human resource, as well as pharmaceutical medication selection, as all such costs are included in the total cost of the healthcare institution.
Unfortunately, the reviewed steps in the data mining study do not ensure the satisfactory investigation process. It is highly probable that the developed model raises more questions than it provides answers. That could indicate a valuable situation, that the data mining efforts have helped to uncover new previously unforeseen relationships, or discover particularly sensitive characteristics of the available data. In this case the improvements of the model can be achieved by acquiring new set of data, modifying, integrating or choosing new methods for analysis. Consequently, the new level and breakthrough can be achieved for preparing advanced solutions to the problem.
11 Conclusion
The data mining and artificial intelligence methods demonstrate vast potential for analysis in the areas of generating large amount of data, both structured and unstructured. However, the problems of pattern recognition, knowledge discovery from healthcare data are still in their initial stage, mostly oriented to structured measurement data, and narrow number of data mining methods. There are no defined procedures which methods are best fit for the analytical tasks. Introduction of basic principles of data mining and main artificial intelligence techniques, discussion of building, verifying and testing the data mining models will allow healthcare professionals to realise the importance and significance of Data Mining, Machine Learning and Artificial Intelligence methods for knowledge extraction from health data.
References
Larose, D.T.: Data Mining Methods and Models, IEEE Computer Society Press, p. 344, (2006). ISBN-13 978–0–471–66656–1
Nisbet, R., Elder, J., Miner, G.: Statistical Analysis & Data Mining Applications. Elsevier, Canada (2009)
Pregibon, D.: Data Mining. Statistical Computing and Graphics 7, 8 (1997)
David Ben-Israel, W., Jacobs, B., Casha, S., Lang, S., Won, H.A., Ryu, M., de Lotbiniere-Bassett, D.W.: The impact of machine learning on patient care: a systematic review. Artif. Intell. Med. 103(101785), 2020. ISSN 0933–3657. https://doi.org/10.1016/j.artmed.2019.101785
Berry, M.J.A., Linoff, G.S.: Mastering Data Mining. Wiley, New York (2004)
Edelstein, H., A.: Introduction to data mining and knowledge discovery, 3rd edn. Two Crows Corp, Potomac, MD (1999)
Han, J., Kamber, M.: Data Mining: Concepts and Techniques. Morgan-Kaufman, New York (2000)
Adamo, J.M.: Data Mining for Association Rules and Sequential Patterns. Springer-Verlag, New York Inc (2001)
Dunham, M.H.: Data Mining: Introductory and Advanced Topics, p. 315. Prentice-Hall, Pearson Education Inc. (2003)
Engelbrecht, A.P.: Computational Intelligence an Introduction, University of Pretoria South Africa, 288 p. John Wiley & Sons, Ltd (2002). ISBN 0–470–84870–7
Pyle, D.: Data Preparation for Data Mining. (1999)
CNN: Who's fat? New definition adopted. CNN. (1998). www.cnn.com/HEALTH/weight.guidelines. Archived from the original on November 22, 2010. Retrieved 2010–04–26
Verikas, A., Gelžinis, A.: Neuroniniai tinklai ir neuroniniai skaičiavimai.(In Lithuanian language) – Kaunas: Technologija, 2008. 241 p. ISBN 978–9955–591–53–5
Negnevitsky, M.: Artificial intelligence: Aguide to intelligent systems. Harlow, England: Pearson (2002)
Krikščiūnienė, D., Sakalauskas, V.: Intelektiniai modeliai marketingo sistemose Monograph. Vilnius, Vilniaus universiteto leidykla, 384 p. (2014)
Incomes for older people. Eurostat https://ec.europa.eu/eurostat/statistics-explained/index.php?title=Ageing_Europe_-_statistics_on_pensions,_income_and_expenditure. Accessed 10 Jan 2021
Acknowledgements
This publication is based upon work from COST Action “European Net-work for cost containment and improved quality of health care-CostCares” (CA15222), supported by COST (European Cooperation in Science and Technology)
COST (European Cooperation in Science and Technology) is a funding agency for research and innovation networks. Our Actions help connect research initiatives across Europe and enable scientists to grow their ideas by sharing them with their peers. This boosts their research, career and innovation.

Author information
Authors and Affiliations
Corresponding author
Editor information
Editors and Affiliations
Rights and permissions
Open Access This chapter is licensed under the terms of the Creative Commons Attribution 4.0 International License (http://creativecommons.org/licenses/by/4.0/), which permits use, sharing, adaptation, distribution and reproduction in any medium or format, as long as you give appropriate credit to the original author(s) and the source, provide a link to the Creative Commons license and indicate if changes were made.
The images or other third party material in this chapter are included in the chapter's Creative Commons license, unless indicated otherwise in a credit line to the material. If material is not included in the chapter's Creative Commons license and your intended use is not permitted by statutory regulation or exceeds the permitted use, you will need to obtain permission directly from the copyright holder.
Copyright information
© 2022 The Author(s)
About this chapter

Cite this chapter
Kriksciuniene, D., Sakalauskas, V. (2022). Overview of the Artificial Intelligence Methods and Analysis of Their Application Potential. In: Kriksciuniene, D., Sakalauskas, V. (eds) Intelligent Systems for Sustainable Person-Centered Healthcare. Intelligent Systems Reference Library, vol 205. Springer, Cham. https://doi.org/10.1007/978-3-030-79353-1_9
Download citation
DOI: https://doi.org/10.1007/978-3-030-79353-1_9
Published:
Publisher Name: Springer, Cham
Print ISBN: 978-3-030-79352-4
Online ISBN: 978-3-030-79353-1
eBook Packages: Intelligent Technologies and RoboticsIntelligent Technologies and Robotics (R0)