
Abstract
The chapter describes the key role that sensor data play in the DataBio project. It introduces the concept of sensing devices and their contribution in the evolution of the Internet of Things (IoT). The chapter outlines how IoT technologies have affected bioeconomy sectors over the years. The last part outlines key examples of sensing devices and IoT data that are exploited in the context of the DataBio project.
You have full access to this open access chapter, Download chapter PDF
Keywords
1 Introduction
Sensing devices have been introduced in order to bridge the gap between the physical and the digital world. In fact sensors are responsible for gathering and responding to physical stimulus originating from the environment. Different sensors respond to different environmental input signals such as light, heat, motion, humidity, pressure, sound, etc. Sensors translate the input signal to a digital one, so that it can be easily displayed, stored or transmitted over networks and processed in a more sophisticated way.
Gartner [1] defines The Internet of Things (IoT) as “a core building block for digital business and digital platforms. IoT is the network of dedicated physical objects that contain embedded technology to communicate and sense or interact with their internal states and/or the external environment. IoT comprises an ecosystem that includes assets and products, communication protocols, applications, and data and analytics”. Sensors are at the core of IoT systems and along with sensor connectivity and network they collect the information to be analyzed by an IoT application.
According to Ref. [2], at the start of 2019, the Internet of Things (IoT) remains a critical enabler helping organizations achieve their digital transformation goals. Alongside cloud, analytics, and mobile investments, IoT remains a top priority for organizations as they make technology decisions. Worldwide spending on the Internet of Things (IoT) is forecast to reach $745 billion in 2019, an increase of 15.4% over the $646 billion spent in 2018, according to a new update to the International Data Corporation (IDC) Worldwide Semiannual Internet of Things Spending Guide. IDC expects worldwide IoT spending will maintain a double-digit annual growth rate throughout the 2017–2022 forecast period and surpass the $1 trillion mark in 2022.
2 Internet of Things in Bioeconomy Sectors
With emergence of the Internet of Things (IoT), a hype in the proliferation of use and application of sensors in almost every vertical domain is being witnessed. One of the domains that has been taking advantage of sensor data is agriculture [3]. As smart machines and sensors crop up on farms and farm data grow in quantity and scope, farming processes will become increasingly data driven and data enabled [4]. The development of highly accurate embedded sensors measuring the environmental context inside farms has led to the enablement of precision agriculture [5]. Precision agriculture enables smart farming, which includes real-time data gathering, processing and analysis, as well as automation of the farming procedures, allowing improvement of the overall farming operations and management, and more data-driven decision making by the farmers. In smart farming, IoT extends conventional tools (e.g., rain gauge, tractor, notebook) by adding autonomous context-awareness by all kind of sensors, built-in intelligence, capable to execute autonomous actions or enabling their execution remotely. These smart devices provide the required data to drive real-time operational decisions. Real-time assistance is required to carry out agile actions, especially in cases of suddenly changed operational conditions or other circumstances (e.g., weather or disease alert) [4]. Farming is highly unpredictable, due to its large dependency on weather and environmental conditions (eg. rain, temperature, humidity, hail), unpredictable events (e.g. animal diseases, pests), as well as price volatility in agricultural markets. Combining and analyzing data streams provided by sensors in real-time, can help in more informed decision-making and enable fast reaction to changes and unpredictable events. For example, by combining sensor data about soil fertility, with web services for weather forecasting, better decisions could be made about more precise irrigation and fertilization of the crops. Sensor data can also be used to enable real time monitoring of agrifood parameters, such as pH, temperature, earth's moisture or oxygen flow.
With the aid of sensors connected to internet, it is possible to continuously monitor different crops and parcels, even if they are remotely located, as well as to predict and control yields and food quality. Georeferencing is another important aspect that allows agricultural machinery to accurately fill the daily needs of different crop types, without or with minimal human intervention [5]. Livestock management is following the IoT trends as well, with farmers in Australia being obliged to affix passive RFID ear tags to their cattle and to report movements between farms to an online national database [6]. RFID devices are very common and are used to track the geographical position of individual animals or items such as packages, pallets, shipping containers, or trucks, which are stationary or in movement during distribution.
3 Examples from DataBio
Within the Databio pilots, several key parameters have been monitored through various sensors. Sensor data have been collected along the way and made available in order to support the project activities. Especially, IoT sensor data is exchanged most commonly via wireless telecommunications technologies (i.e. ZigBee, Cellular), using various protocols (i.e. MQTT, Websocket) and data formats (i.e. JSON, binary). In DataBio the following sensor data categories are in use:
-
IoT agro-climate/field sensors measuring crop status (ambient temperature, humidity, solar radiation, leaf wetness, rainfall volume, wind speed and direction, barometric pressure, soil temperature and humidity).
-
IoT control data in the parcels/fields measuring sprinklers, drippers, metering devices, valves, alarm settings, heating, pumping state, pressure switches, etc..
-
Machinery data associated with the operation of tractors, UVs and other actuators (fuel consumption, position, temperature, operation, etc.) conducting use case specific tasks in the field.
-
Contact sensing data speeding up techniques which help to solve problems.
-
Vessel and buoy-based sensor data for numerical measurements, typically of hydro acoustic, sonar and machinery data (Fig. 3.1).
Fig. 3.1 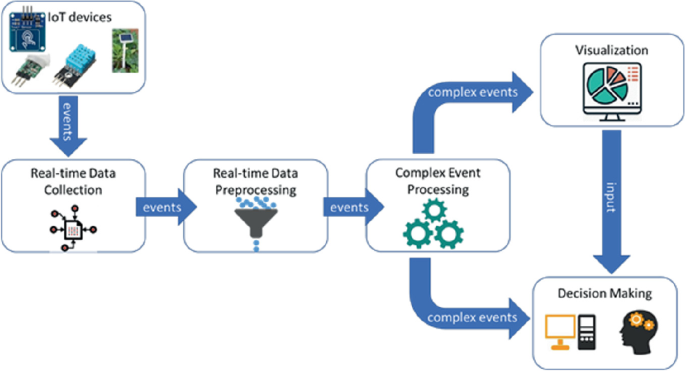
Data flow for real-time IoT data processing and decision-making generic pipeline

3.1 Gaiatrons
Gaiatrons, designed and built by NEUROPUBLIC, are agro-climate IoT sensor stations involved in a number of agriculture pilots providing critical in-situ information for DataBio. Gaiatrons are telemetric autonomous stations which collect data from sensors installed in the field that monitor several atmospheric and soil parameters (air temperature, relative moisture, wind direction and velocity, rain, leaf wetness, soil temperature and moisture, etc.). They have reached an adequate maturity for outdoor operation (industrial grade) and have data exchange and control capabilities. Gaiatrons are considered “power starving” systems. They are energy-autonomous and remain in sleep mode for extended periods of time in order to minimize their energy consumption needs. They can connect to other stations and to cloud systems using different wireless connection technologies (GPRS, UHF). Gaiatrons are specially designed for providing exact fit to the operational requirements asked from modern smart farming infrastructures. Dense installation network under the canopy, large scale deployment, low operation cost and mobility are some of these operational requirements in order for Gaiatrons to be viable and commercially successful (Fig. 3.2).

Gaiatron station for in-situ agro-climatic monitoring
3.2 AgroNode
AgroNode is a radio based data logger device intended to be used in any scenario where sensor data is collected. AgroNode is used for online measuring of physical phenomena directly in terrain. The device interoperates with a wide spectrum of digital sensors and due to the modularity of architecture, it can be modified for a variety of data transmission technologies—GPRS, LoRa, Sigfox, NB-IoT. It is able to permanently save sensor measurement data and/or make them accessible online. Due to solar power, life span is from device point of view unlimited it has also a battery backup. AgroNode is designed and built by the Lesprojekt company and utilized in many projects and measuring campaigns in agriculture, forestry, water management, meteorology etc. (Fig. 3.3).

AgroNode unit
3.3 SensLog and Data Connectors
SensLog is a cloud-based sensor data management component that is receiving, storing, processing and publishing sensor data [7]. SensLog is storing data in its own relational data model based on the ISO Observations and Measurements standard [8] and extended to functionalities for sensor network metadata and system of alerts. A NoSQL version of the SensLog data model was tested during the DataBio project [9]. The SensLog interface provides receiving and publishing of sensor data in various formats. The main interface is a proprietary REST API with JSON data encoding [10]. The core services of OGC Sensor Observation Service 1.0.0 [11] are providing a standardized interface for data publication.
SensLog is defined as a fully cloud-based environment. All components were developed as microservices, which in turn means independent components. The main objective is to separate all systems from each other. The software is designed to be deployed as a Docker container and managed by Kubernetes orchestrator which allows scaling each component easily. The individual microservices were written by modern constructs of the Java language using the Spring framework. SensLog environment contains 3 types of microservices (Fig. 3.4).
The first service group is connectors and feeders representing the data layer. The Data connector was created as a self-configured modular application. The main task is to integrate different data sources into the SensLog system. These data sources can be another system API, static files, databases, etc. Each module represents a data source that fetches raw data that is pushed to public APIs of SensLog-processing via HTTP. The Feeder component gets data directly from individual sensors. Each wireless telecommunications technology has its implementation.
Next micro service is the Processing component, which collects data from the first group. Data is authenticated, validated and saved to the data store. The Processing group provides a proprietary API with JSON data encoding optimized for pushing data to the Data storage.
The last service group consists of Provider and Analytics components. The Provider publishes access to stored data via public API which can be used for end-user applications such as client and visualization applications, smart device apps, etc. The Analytics component is prepared for real-time and batch processing of data stored in the Data warehouse.
The architecture of the SensLog environment can be seen in the following Fig. 3.4.

SensLog environment architecture
3.4 Mobile/Machinery Sensors
The need of telemetry in mobile agricultural machinery including tractors and combined harvesters can be seen from different points of view. The authors in this chapter represent the producer view, particularly the Zetor tractor producer.
-
Design and reliability aspects during the development. Tractors and other agriculture machines are difficult mechanical products which need to fulfill many mandatory safety, ecological, reliability and technical standards. The design of a new product, e.g. a tractor, takes many years. In order to speed up the design process, innovative technologies are used to make the process process cheaper and more efficient. An example of such technology is telemetry that can be used for:
-
Remote and real time observation of reliability tests.
-
Remote and real time observation of tractor CAN Bus communication, tractor control units analysis.
-
-
Commercial product for other markets. Telemetry developed as a support for design and development phases can be very easily adopted for other commercial exploitation. The main two areas include:
-
Telemetric products for farmers. This type of telemetry is supporting work on the farm and farming functionality. It has a huge potential when implemented on a farm with a bigger number of tractors and is used for organization of work on the farm.
-
Telemetric products for tractor owners (e.g., banks). This is a relatively new functionality of telemetry. The reason for this functionality is that the owner wants to know what happened to the property in real time, in real position and whether it is well managed.
-
Machinery sensors and telemetry units can be useful not only for observing machinery in itself, but it can be used as a way to observe the status and conditions of fields. An example is yield prediction based on observations from yield sensors on combine harvesters [12].
References
Hype Cycle for Analytics and Business Intelligence. (2019). Hare J and Schlegel K Gartner report # G00369713 published on July 18, 2019.
MacGillivray, C. et al. (2019). Worldwide internet of things forecast update 2018–2022. Doc # US44755019 published in January 2019.
Ferreira, D. et al. (2017). Towards smart agriculture using FIWARE enablers. In International Conference on Engineering, Technology and Innovation (ICE/ITMC) (pp. 1544–1551). https://doi.org/10.1109/ICE.2017.8280066
Wolfert, S., Ge, L., Verdouw, C., & Bogaardt, M.-J. (2017). Big data in smart farming—A review. Agricultural System, 153, 69–80.
Kamilaris, A. et al. (2016). Agri-IoT: A semantic framework for internet of things-enabled smart farming applications. In: Proceeding of the IEEE World Forum on Internet of Things (WF-IoT). https://doi.org/10.1109/WF-IoT.2016.7845467
Taylor, K., et al. (2013). Farming the web of things. Intelligent Systems, 28(6), 12–19.
Kepka, M. et al. (2017). The SensLog platform—A solution for sensors and citizen observatories. In J. Hřebíček, R. Denzer, G. Schimak, & T. Pitner (Eds.), Environmental software systems. Computer science for environmental protection. ISESS 2017. IFIP Advances in Information and Communication Technology, Vol. 507. Springer, Cham. https://doi.org/10.1007/978-3-319-89935-0_31
International Organization for Standardization. (2011). ISO 19156:2011 Geographic information—Observations and measurements (p. 46).
Dadhich, P., Sadovykh, A., Bagnato, A., Kepka, M., Kaas, O., & Charvát, K. (2018). Sensor-based database with SensLog: A case study of SQL to NoSQL migration. In: Proceedings of the 7th International Conference on Data Science, Technology and Applications (DATA 2018). SCITEPRESS—Science and Technology Publications, Lda, Setubal, PRT (pp. 239–244). https://doi.org/10.5220/0006909202390244
SensLog API. https://www.senslog.org/api/v1/
06-009r6 OpenGIS sensor observation service. Open Geospatial Consortium (2006). https://www.opengeospatial.org/standards/sos
Řezník, T., Jedlička, K., Lukas, V., Čerba, O., Kepka, M., Leitgeb, S., & Charvát, K. (2017). Yield potential cloud computing and applications based on sentinel, landsat and MODIS data. Remote Sens Basel (MDPI AG, Switzerland). ISSN 2072-4292.
Author information
Authors and Affiliations
Corresponding author
Editor information
Editors and Affiliations
Rights and permissions
Open Access This chapter is licensed under the terms of the Creative Commons Attribution 4.0 International License (http://creativecommons.org/licenses/by/4.0/), which permits use, sharing, adaptation, distribution and reproduction in any medium or format, as long as you give appropriate credit to the original author(s) and the source, provide a link to the Creative Commons license and indicate if changes were made.
The images or other third party material in this chapter are included in the chapter's Creative Commons license, unless indicated otherwise in a credit line to the material. If material is not included in the chapter's Creative Commons license and your intended use is not permitted by statutory regulation or exceeds the permitted use, you will need to obtain permission directly from the copyright holder.
Copyright information
© 2021 The Author(s)
About this chapter

Cite this chapter
Rogotis, S., Fournier, F., Charvát, K., Kepka, M. (2021). Sensor Data. In: Södergård, C., Mildorf, T., Habyarimana, E., Berre, A.J., Fernandes, J.A., Zinke-Wehlmann, C. (eds) Big Data in Bioeconomy. Springer, Cham. https://doi.org/10.1007/978-3-030-71069-9_3
Download citation
DOI: https://doi.org/10.1007/978-3-030-71069-9_3
Published:
Publisher Name: Springer, Cham
Print ISBN: 978-3-030-71068-2
Online ISBN: 978-3-030-71069-9
eBook Packages: Biomedical and Life SciencesBiomedical and Life Sciences (R0)