
Abstract
The purpose of this chapter is to help the reader understand the complexities of modern urban systems before diving deeper and exploring these concepts in more detail in the subsequent chapters. This chapter describes the main definitions of societal metabolism and briefly introduces some concepts. It also shows how the theoretical models of flows of energy and material can be translated to elements of everyday life. The reader will be introduced to elements of societal metabolism analysis. The chapter contains multiple visuals and proposes several examples and inferences from real-life applications to help clarify the definitions and elements presented. This should help better understand the showcased theoretical notions, and make it easier for the reader to transfer or translate them to any context. In addition, the reader will be acquainted with the rationale and the concepts that are in the background of the SUSTAIN simulation and the incorporated board game.
Access this chapter
Tax calculation will be finalised at checkout
Purchases are for personal use only
References
Barragán-Escandón, A., Terrados-Cepeda, J., & Zalamea-León, E. (2017). The role of renewable energy in the promotion of circular urban metabolism. Sustainability, 9(12).
European Commission. (2017). European urban mobility. Policy context. Brussels: Directorate-General for Mobility and Transport, Directorate Investment, Innovative & Sustainable Transport, Unit B4—Sustainable & Intelligent Transport.
Fisher-Kowalski, M., & Hütter, W. (1999). Society’s metabolism: The intellectual history of materials flow analysis, part II, 1970–1998. Journal of Industrial Ecology, 2(4).
Pincetl, S., Bunje, P., & Holmes, T. (2012). An expanded urban metabolism method: Toward a systems approach forassessing urban energy processes and causes. Landscape and Urban Planning, 107, 193–202.
Stenmark, A., Jensen, C., Quested, T., & Moates, G. (2016). Estimates of European food waste levels. Stockholm: FUSIONS Project.
United Nations. (2015). World urbanization prospects: The 2014 revision. New York: Department of Economic and Social Affairs, Population Division.
United Nations. (2019, April 30). Our common future: Report of the world commission on environment and development. Retrieved from http://www.un-documents.net/ocf-02.htm#I
United Nations Development Programme. (2019). Sustainable development goals. Retrieved from https://www.undp.org/content/undp/en/home/sustainable-development-goals/goal-11-sustainable-cities-and-communities.html
World Population Clock. (2018). Retrieved December 2018, from current world population. Growth rate: https://www.worldometers.info/world-population/#growthrate
Author information
Authors and Affiliations
Editor information
Editors and Affiliations
Appendix
Appendix
1.1.1 Image Sources
-
Fig. 1.
Potsdam Institute for Climate Impact Research. https://www.pik-potsdam.de/research/transdisciplinary-concepts-and-methods/research/research-areas/metab (accessed February 2019)
-
Fig. 2.
Worldometers, based on UN data. https://www.worldometers.info/world-population/#pastfuture (accessed February 2019)
-
Fig. 3.
UN Food and Agriculture Organisation. http://www.fao.org/land-water/outreach/graphs-and-maps/en/ (accessed February 2019)
-
Fig. 4.
FAOSTAT. http://www.fao.org/faostat/en/#data/FBS/visualize (accessed February 2019)
-
Fig. 5.
Enerdata Global Energy Statistical Yearbook. https://yearbook.enerdata.net/total-energy/world-consumption-statistics.html (accessed February 2019)
-
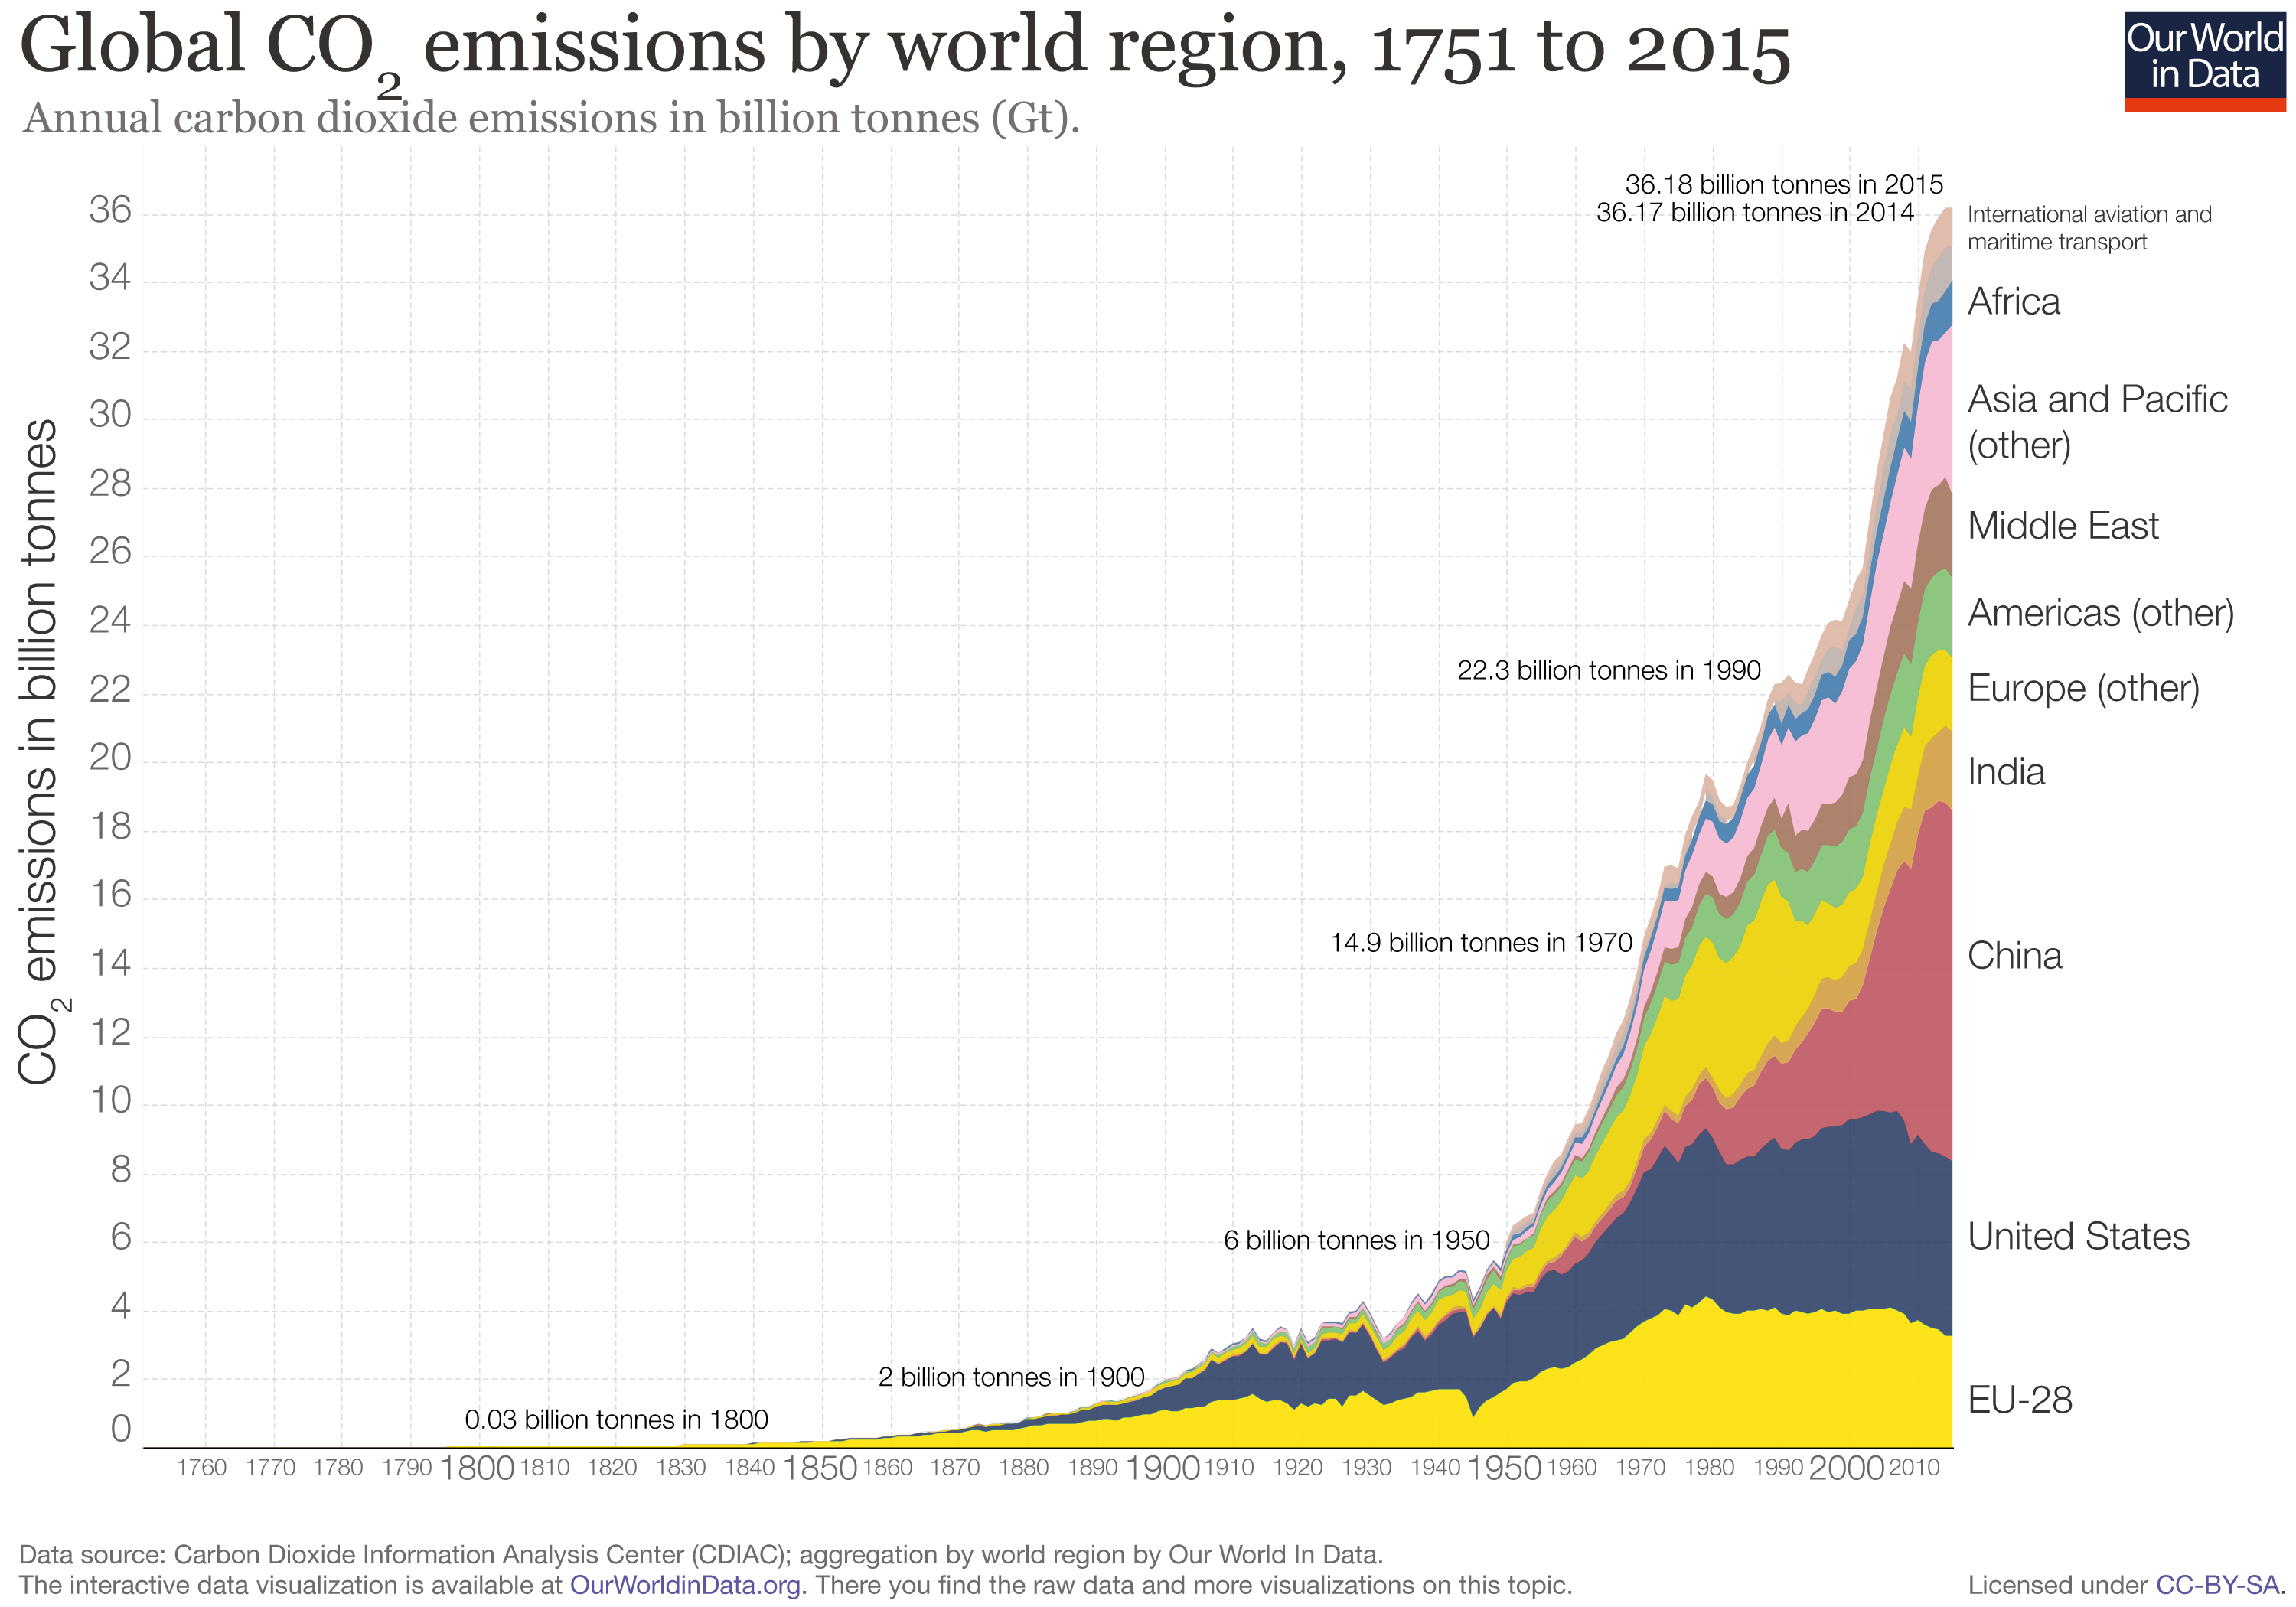
Fig. 6.
Our World in Data. https://ourworldindata.org/uploads/2017/04/Global-CO2-emissions-by-region-since-1751.png(accessed February 2019)
-
Fig. 7.
Trading Economics. https://tradingeconomics.com/world/forest-area-percent-of-land-area-wb-data.html (accessed February 2019)
-
Fig. 8.
Lance Commission on Health and Climate Change. https://www.thelancet.com/action/showFullTextImages?pii=S0140-6736%2815%2960854-6 (accessed February 2019)
-
Fig. 9.
Science Advances. https://advances.sciencemag.org/content/1/5/e1400253/tab-figures-data (accessed February 2019)
-
Fig. 10.
Community College of Rhode Island. http://faculty.ccri.edu/lmfrolich/Microbiology/MetabolismOverview.htm (accessed February 2019)
-
Fig. 11.
Cooperative Research Centre for Water Sensitive Cities. https://watersensitivecities.org.au/content/mimicking-nature-urban-metabolism-frameworks-guide-decision-making-maximise-water-efficiency/ (accessed February 2019)
-
Fig. 12.
PBS Learning Media. https://www.pbslearningmedia.org/resource/syslit14-sci-sys-stockflow/stocks-and-flows/#.Wy-3oi17Gu4 (accessed February 2019)
-
Fig. 13.
Climate Interactive. https://www.climateinteractive.org/tools/climate-bathtub-simulation/ (accessed February 2019)
-
Fig. 14.
Colourbox. https://www.colourbox.com/vector/colorful-batteries-icons-and-symbols-of-battery-level-vector-5501950 (accessed February 2019)
-
Fig. 15.
Urban One. http://www.urbanone.com/resources/articles/leed-construction-waste-management-green-recycling-methods-for-reducing-carbon-footprint-by-jr-riddle (accessed February 2019)
-
Fig. 16.
Dairy Processing Handbook. https://dairyprocessinghandbook.com/chapter/designing-process-line (accessed February 2019)
-
Fig. 17.
Biopolus. http://www.biopolus.net/wp-content/uploads/2013/03/challenge_slider_new-011.png (accessed February 2019)
-
Fig. 18.
Original artwork.
-
Fig. 19.
Thinglink. https://www.thinglink.com/scene/832296461617070081 (accessed February 2019)
-
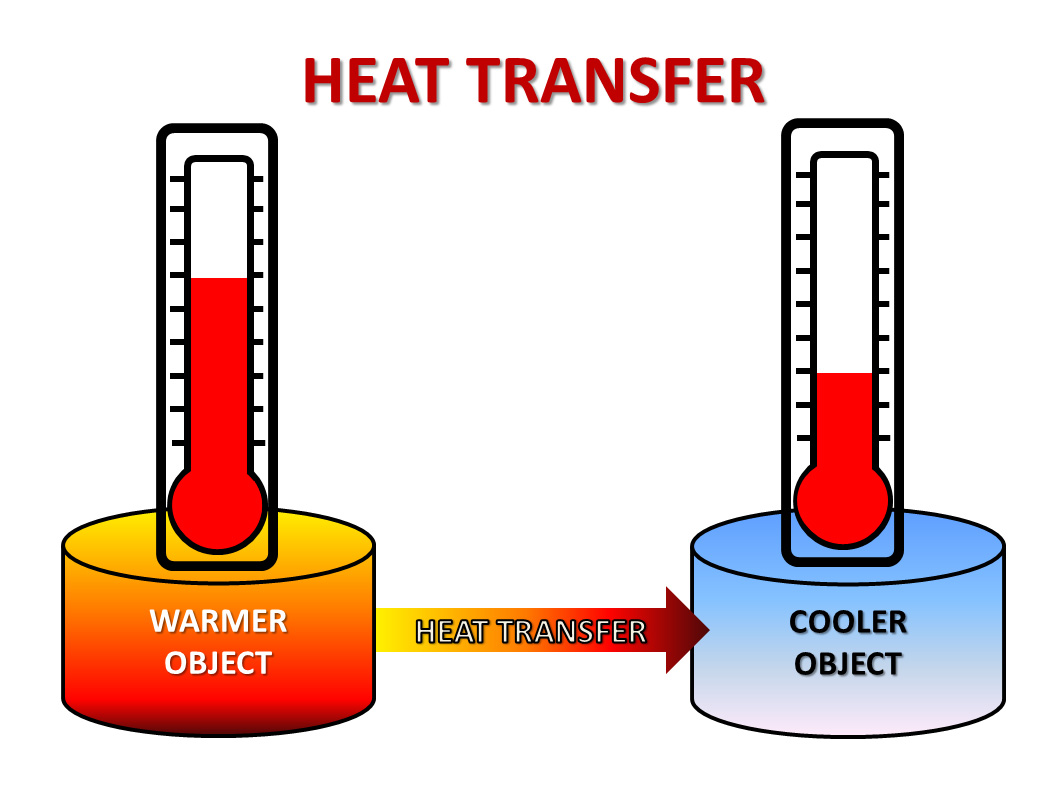
Fig. 20.
Climate Science Investigations South Florida. http://www.ces.fau.edu/nasa/images/Energy/HeatTransfer.jpg (accessed February 2019)
-
Fig. 21.
Physics and Radio-Electronics. http://www.physics-and-radio-electronics.com/blog/wp-content/uploads/2016/10/closedswicthbulbon.png (accessed February 2019)
-
Fig. 22.
Barragán-Escandón, A., Terrados-Cepeda, J., & Zalamea-León, E. (2017). The Role of Renewable Energy in the Promotion of Circular Urban Metabolism. Sustainability, 9(12).
-
Fig. 23.
A) Geyer, R., J. Jambeck, R., Law, K. L. (2017) Production, use, and fate of all plastics ever made. Science Advances 3(7):e1700782.
B) UNEP data on Global Alliance for Incinerator Data. https://www.no-burn.org/wp-content/uploads/article-pratibha-im2.png (accessed February 2019)
-
Fig. 24.
Helmholtz Centre for Environmental Research. https://www.ufz.de/index.php?en=36336&webc_pm=34/2017 (accessed February 2019)
-
Fig. 25.
Original artwork.
-
Fig. 26.
Original artwork.
-
Fig. 27.
UN Sustainable Development Goals. https://www.un.org/sustainabledevelopment/sustainable-development-goals/ (accessed February 2019)
-
Fig. 28.
Vu The Tran, Eklund, P.W., Cook, C. (2013) Evolutionary simulation for a public transit digital ecosystem: A case study. MEDES, 29-31October 2013, Neumünster Abbey, Luxembourg. https://www.researchgate.net/publication/287177501_Evolutionary_simulation_for_a_public_transit_digital_ecosystem_A_case_study (accessed February 2019)
-
Fig. 29.
Kindling. https://kindling.xyz/next-systems/systems-thinking-complex-world/ (accessed February 2019)
-
Fig. 30.
Original artwork.
-
Fig. 31.
SD Action. http://sdaction.kytt.org (accessed February 2019)
-
Fig. 32.
Circular Economy Lab. http://circulareconomylab.com/circular-economy-framework/ (accessed February 2019)
-
Fig. 33.
Food Drink Europe. https://circulareconomy.fooddrinkeurope.eu (accessed February 2019)
1.1.2 List of Links
- 1.
- 2.
- 3.
- 4.
- 5.
-
6.
https://yearbook.enerdata.net/total-energy/world-consumption-statistics.html
-
7.
https://ourworldindata.org/wp-content/uploads/2017/04/Global-CO2-emissions-by-region-since-1751.png
- 8.
-
9.
https://tradingeconomics.com/world/forest-area-percent-of-land-area-wb-data.html
-
10.
https://www.thelancet.com/action/showFullTextImages?pii=S0140-6736%2815%2960854-6
-
11.
http://advances.sciencemag.org/content/1/5/e1400253/tab-figures-data
-
12.
http://faculty.ccri.edu/lmfrolich/Microbiology/MetabolismOverview.htm
- 13.
-
14.
https://www.aau.at/en/social-ecology/research/social-metabolism/
- 15.
- 16.
- 17.
-
18.
https://www.pbslearningmedia.org/resource/syslit14-sci-sys-stockflow/stocks-and-flows/#.Wy-3oi17Gu4
- 19.
-
20.
https://www.climateinteractive.org/tools/climate-bathtub-simulation/
- 21.
- 22.
- 23.
-
24.
http://www.sobebodymind.com/body-mind-fundamentals/metabolism/
-
25.
http://www.biopolus.org/wp-content/uploads/2013/03/challenge_slider_new-011.png
- 26.
- 27.
-
28.
http://www.physics-and-radio-electronics.com/blog/wp-content/uploads/2016/10/closedswicthbulbon.png
- 29.
-
30.
https://www.cmcc.it/article/urban-metabolism-and-flows-of-energy-and-materials-in-cities
- 31.
- 32.
- 33.
-
34.
https://www.sciencedaily.com/releases/2017/10/171017110028.htm
- 35.
- 36.
-
37.
https://www.un.org/sustainabledevelopment/sustainable-development-goals/
- 38.
-
39.
http://kindling.xyz/next-systems/systems-thinking-complex-world/
- 40.
- 41.
- 42.
- 43.
- 44.
- 45.
- 46.
- 47.
- 48.
- 49.
-
50.
http://www.wrap.org.uk/about-us/about/wrap-and-circular-economy
- 51.
- 52.
-
53.
https://www.aps.org/policy/reports/popa-reports/energy/transportation.cfm
- 54.
- 55.
- 56.
- 57.
- 58.
-
59.
https://www.romania-insider.com/pumping-life-small-romanian-town-reducing-food-waste/
- 60.
Rights and permissions
Copyright information
© 2021 The Author(s), under exclusive license to Springer Nature Switzerland AG
About this chapter

Cite this chapter
Ciobanu, N., Onofrei, C. (2021). Societal Metabolism: A Brief Introduction. In: Papathanasiou, J., Tsaples, G., Blouchoutzi, A. (eds) Urban Sustainability. Springer Texts in Business and Economics. Springer, Cham. https://doi.org/10.1007/978-3-030-67016-0_1
Download citation
DOI: https://doi.org/10.1007/978-3-030-67016-0_1
Published:
Publisher Name: Springer, Cham
Print ISBN: 978-3-030-67015-3
Online ISBN: 978-3-030-67016-0
eBook Packages: Business and ManagementBusiness and Management (R0)