
Access this chapter
Tax calculation will be finalised at checkout
Purchases are for personal use only
Notes
- 1.
If the tails of the distribution are “too heavy,” as is the case with the Cauchy distribution, then μ will not exist. In such cases, the Wilcoxon test will still be valid for tests concerning \( \tilde{\mu } \).
- 2.
There are pathological examples in which the set A is not an interval of θ values, but instead the complement of an interval or something even stranger. To be more precise, we should really replace the notion of a CI with that of a confidence set. In the cases of interest here, the set A does turn out to be an interval.
Author information
Authors and Affiliations
Corresponding author
Supplementary Exercises: (49–58)
Supplementary Exercises: (49–58)
-
49.
In a study described in the article “Hyaluronan Impairs Vascular Function and Drug Delivery in a Mouse Model of Pancreatic Cancer” (Gut 2013: 112–120), hyaluronan was depleted from mice using either PEGPH20 or an equal dose of a standard treatment. The vessel patency (%) for each mouse was recorded.
PEGPH20
62
68
70
76
Standard
24
29
35
41
Use a rank-sum test (as did the article’s authors) to determine if PEGPH20 yields higher vessel patency than the standard treatment at the .05 level. Would you also reject the null hypothesis at the .01 level? Comment on these results in light of the fact that every PEGPH20 measurement is higher than every standard-treatment measurement.
-
50.
The article “Long Telomeres are Associated with Clonality in Wild Populations of … C. tenuispina” (Heredity 2015: 437–443) reported the following telomere measurements for (1) a normal arm and (2) a regenerating arm of 12 Mediterranean starfish.
Normal
11.246
11.493
11.136
11.120
10.928
11.556
Regen.
11.142
11.047
11.004
11.506
11.067
10.875
Normal
11.313
11.164
10.878
12.680
11.937
11.172
Regen.
11.484
11.517
10.756
10.973
11.078
11.182
It is theorized that such measurements should be smaller for regenerating arms, because the above values are inversely related to telomere length and longer telomeres are associated with younger tissue. Use a nonparametric test to see if the data supports this theory at the .05 significance level.
-
51.
Physicians use a variety of quantitative sensory testing (QST) tools to assess pain in patients, but there is concern about the consistency of such tools. The article “Test-Retest Reliability of [QST] in Knee Osteoarthritis and Healthy Participants” (Osteoarthritis and Cartilage 2011: 655–658) describes a study in which participants’ responses to various stimuli were measured and then re-measured one week later. For example, pressure was applied to each subject’s knee, and the level (kPa) at which the patient first experienced pain was recorded.
-
a.
Pressure pain measurements were taken twice on each of 50 patients with osteoarthritis in the examined knee. The Wilcoxon signed-rank test statistic value computed from this paired data was \( s_{+} \) = 616. Use a two-sided, large-sample test to assess the reliability of the sensory test at the .10 significance level.
-
b.
The same measurements were made of 50 healthy patients, and the resulting test statistic value was \( s_{+} \) = 814. Carry out the test indicated in part (a) using this information. Does the pain pressure test appear reliable for the population of healthy patients?
-
a.
-
52.
Adding mileage information to roadside amenity signs (“Motel 6 in 1.2 miles”) can be helpful but might also increase accidents as drivers strain to read the detailed information at a distance. The article “Evaluation of Adding Distance Information to Freeway-Specific Service (Logo) Signs” (Transp. Engr. 2011: 782–788) provides the following information on number of crashes per year before and after mileage information was added to signs at six locations in Virginia.
Location
1
2
3
4
5
6
Before
15
26
66
115
62
64
After
16
24
42
80
78
73
-
a.
Use a one-sample sign test to determine whether more accidents occur after mileage information is added to roadside amenity signs. Be sure to state the hypotheses, and indicate what assumptions are required.
-
b.
Use a signed-rank test to determine whether more accidents tend to occur after mileage information is added to roadside amenity signs. What are the hypotheses now, and what additional assumptions are required?
-
a.
-
53.
The accompanying observations on axial stiffness index resulted from a study of metal-plate connected trusses in which five different plate lengths—4 in., 6 in., 8 in., 10 in., and 12 in.—were used (“Modeling Joints Made with Light-Gauge Metal Connector Plates,” Forest Products J. 1979: 39–44).
i = 1 (4 in.):
309.2
309.7
311.0
316.8
326.5
349.8
409.5
i = 2 (6 in.):
331.0
347.2
348.9
361.0
381.7
402.1
404.5
i = 3 (8 in.):
351.0
357.1
366.2
367.3
382.0
392.4
409.9
i = 4 (10 in.):
346.7
362.6
384.2
410.6
433.1
452.9
461.4
i = 5 (12 in.):
407.4
410.7
419.9
441.2
441.8
465.8
473.4
Use the Kruskal–Wallis test to decide at significance level .01 whether the true average axial stiffness index depends somehow on plate length.
-
54.
The article “Production of Gaseous Nitrogen in Human Steady-State Conditions” (J. Appl. Physiol. 1972: 155–159) reports the following observations on the amount of nitrogen expired (in liters) under four dietary regimens: (1) fasting, (2) 23% protein, (3) 32% protein, and (4) 67% protein. Use the Kruskal–Wallis test at level .05 to test equality of the corresponding μi’s.
1
4.079
4.859
3.540
5.047
3.298
4.679
2.870
4.648
3.847
2
4.368
5.668
3.752
5.848
3.802
4.844
3.578
5.393
4.374
3
4.169
5.709
4.416
5.666
4.123
5.059
4.403
4.496
4.688
4
4.928
5.608
4.940
5.291
4.674
5.038
4.905
5.208
4.806
-
55.
The article “Physiological Effects During Hypnotically Requested Emotions” (Psychosomatic Med. 1963: 334–343) reports the following data (xij) on skin potential in millivolts when the emotions of fear, happiness, depression, and calmness were requested from each of eight subjects.
Blocks (subjects)
1
2
3
4
Fear
23.1
57.6
10.5
23.6
Happiness
22.7
53.2
9.7
19.6
Depression
22.5
53.7
10.8
21.1
Calmness
22.6
53.1
8.3
21.6
5
6
7
8
Fear
11.9
54.6
21.0
20.3
Happiness
13.8
47.1
13.6
23.6
Depression
13.7
39.2
13.7
16.3
Calmness
13.3
37.0
14.8
14.8
Use Friedman’s test to decide whether emotion has an effect on skin potential.
-
56.
In an experiment to study the way in which different anesthetics affect plasma epinephrine concentration, ten dogs were selected, and concentration was measured while they were under the influence of the anesthetics isoflurane, halothane, and cyclopropane (“Sympathoadrenal and Hemodynamic Effects of Isoflurane, Halothane, and Cyclopropane in Dogs,” Anesthesiology 1974: 465–470). Test at level .05 to see whether there is an anesthetic effect on concentration.
Dog
1
2
3
4
5
Isoflurane
.28
.51
1.00
.39
.29
Halothane
.30
.39
.63
.38
.21
Cyclopropane
1.07
1.35
.69
.28
1.24
6
7
8
9
10
Isoflurane
.36
.32
.69
.17
.33
Halothane
.88
.39
.51
.32
.42
Cyclopropane
1.53
.49
.56
1.02
.30
-
57.
Suppose we wish to test
- H0::
-
the X and Y distributions are identical versus
- Ha::
-
the X distribution is less spread out than the Y distribution
The accompanying figure pictures X and Y distributions for which Ha is true. The Wilcoxon rank-sum test is not appropriate in this situation because when Ha is true as pictured, the Y’s will tend to be at the extreme ends of the combined sample (resulting in small and large Y ranks), so the sum of X ranks will result in a W value that is neither large nor small.
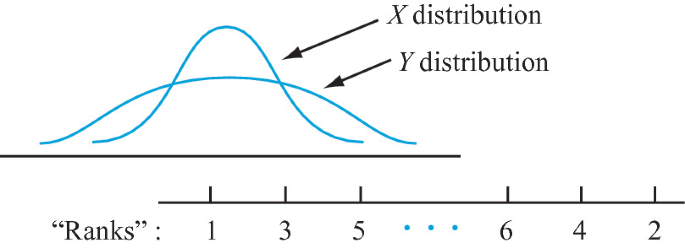
Consider modifying the procedure for assigning ranks as follows: After the combined sample of m + n observations is ordered, the smallest observation is given rank 1, the largest observation is given rank 2, the second smallest is given rank 3, the second largest is given rank 4, and so on. Then if Ha is true as pictured, the X values will tend to be in the middle of the sample and thus receive large ranks. Let W′ denote the sum of the X ranks and consider rejecting H0 in favor of Ha when w′ ≥ c. When H0 is true, every possible set of X ranks has the same probability, so W′ has the same distribution as does W when H0 is true. Thus c can be chosen from Appendix Table A.13 to yield a level α test. The accompanying data refers to medial muscle thickness for arterioles from the lungs of children who died from sudden infant death syndrome (x’s) and a control group of children (y’s). Carry out the test of H0 versus Ha at level .05.
SIDS
4.0
4.4
4.8
4.9
Control
3.7
4.1
4.3
5.1
5.6
-
58.
The ranking procedure described in the previous exercise is somewhat asymmetric, because the smallest observation receives rank 1 whereas the largest receives rank 2, and so on. Suppose both the smallest and the largest receive rank 1, the second smallest and second largest receive rank 2, and so on, and let W″ be the sum of the X ranks. The null distribution of W″ is not identical to the null distribution of W, so different tables are needed. Consider the case m = 3, n = 4. List all 35 possible orderings of the three X values among the seven observations (e.g., 1, 3, 7 or 4, 5, 6), assign ranks in the manner described, compute the value of W″ for each possibility, and then tabulate the null distribution of W″. For the test that rejects if w″ ≥ c, what value of c prescribes approximately a level .10 test? [Note: This is the Ansari–Bradley test; for additional information, see the book by Hollander and Wolfe in the bibliography.]

Rights and permissions
Copyright information
© 2021 The Editor(s) (if applicable) and The Author(s), under exclusive license to Springer Nature Switzerland AG
About this chapter

Cite this chapter
Devore, J.L., Berk, K.N., Carlton, M.A. (2021). Nonparametric Methods. In: Modern Mathematical Statistics with Applications. Springer Texts in Statistics. Springer, Cham. https://doi.org/10.1007/978-3-030-55156-8_14
Download citation
DOI: https://doi.org/10.1007/978-3-030-55156-8_14
Published:
Publisher Name: Springer, Cham
Print ISBN: 978-3-030-55155-1
Online ISBN: 978-3-030-55156-8
eBook Packages: Mathematics and StatisticsMathematics and Statistics (R0)