
Abstract
The concept of Integrated Water Resource Management (IWRM) was established, back in the 1930s, to address “optimal” water management, mainly from a technical perspective, but also taking into account social goals, such as the fulfillment of basic needs and the total welfare of the population. The chapter provides a comprehensive overview of issues related to IWRM. After a discussion of the various economic dimensions of water, we establish a basic model to analyze the value of water under different social welfare objective functions, including the human right to water. The technical-economic model also addresses questions of eco-hydrology, water recycling, groundwater management, and water quality management. The chapter also addresses water allocation along rivers and water transfers between watersheds. The chapter includes exercises and suggestions for further reading.
You have full access to this open access chapter, Download chapter PDF
Keywords
- Water
- Integrated Water Resource Management (IWRM)
- Social welfare
- Recycling
- Quality
- and water transfers supply
- Demand
- Scarcity
- Technology
- Institutions
3.1 What Is Integrated Water Resource Management?
3.1.1 Approaches to IWRM
The Integrated Water Resource Management (IWRM) approach goes back to the establishment of the Tennessee Valley Authority (TVA) in the year 1933, which integrated the functions of navigation, flood control and power production (Biswas 2004). Further issues, such as erosion control, recreation and public health, were also addressed by the TVA (Mitchell 1990). The Secretary-General of the United Nations Organization (UNO) addressed the topic of IWRM in 1957. The UNO’s understanding of integration refers to supporting services needed to develop irrigated agriculture, but the coordination of different water-related functions was not part of this IWRM concept. This deficit was remedied at the Water Conference in Mar del Plata in 1977 where the necessity of coordination within the water sector was explicitly addressed. However, issues associated with high water demand and negative environmental impacts of irrigated agriculture were not approached sufficiently (Snellen and Schrevel 2004).
At the beginning of the 1990s, there were some observable shortcomings in traditional water management, like quality issues, overexploitation, ecosystem degradation or social concerns. Water problems also had become multidimensional, multi-sectoral, and multiregional and filled with multi-interests, multi-agendas, and multi-causes (Biswas 2004). To overcome these issues, four important guiding principles were determined during the International Conference on Environment and Water in Dublin in the year 1992 (Xie 2006). These principles (ecological, institutional, gender, economic) became well known as the “Dublin-Principles”, which are stated in the annex of this chapter.
The Dublin Guiding Principles represented an important input for the Agenda 21, which was agreed upon the United Nations Conference on Environment and Development in Rio de Janeiro in 1992. Chapter 18 emphasized the need for an integrated approach to manage water resources by connecting different water services and providing good governance, appropriate infrastructure, and sustainable financing.Footnote 1
The present understanding of IWRM with its holistic approach is strongly based on the Dublin-Principles as well as on the Agenda 21 (Chap. 18) document. There are many definitions of IWRM, for instance, in the Agenda 21.Footnote 2 A well-cited definition of IWRM is the one made by GWP (2000):
IWRM is a process which promotes the coordinated development and management of water, land and related resources in order to maximize the resultant economic and social welfare in an equitable manner without compromising the sustainability of vital ecosystems.Footnote 3
IWRM cannot be seen as a blueprint or product for good water management, but rather as a paradigm with a broad set of principles, tools, and guidelines that must be tailored to the specific context of a country, region, or river basin in order to implement an efficient and effective water resource management. A basic set of principles is outlined in Box 3.1.
Box 3.1 IWRM principles
-
Integrate water and environmental management.
-
Follow a systems approach.
-
Full participation by all stakeholders, including workers and the community.
-
Attention to the social dimensions.
-
Capacity building.
-
Availability of information and the capacity to use it to anticipate developments.
-
Full-cost pricing complemented by targeted subsidies.
-
Central government support through the creation and maintenance of an enabling environment.
-
Adoption of the best existing technologies and practices.
-
Reliable and sustained financing.
-
Equitable allocation of water resources.
-
Recognition of water as an economic good.
-
Strengthening the role of women in water management.
Source: IWA/UNEP (2002)
3.1.2 The IWRM Paradigm
The IWRM paradigm contains important key concepts of integration, decentralization, participation, and sustainability (Xie 2006). Due to the holistic view of the IWRM paradigm, there is a necessity for the integrated management of horizontal sectors that use or affect water resources, e.g., water supply, sanitation, agricultural use, energy generation, industrial use, or environmental protection. In addition to horizontal integration, vertical integration is also required to coordinate efforts between local, regional, national, and international water user groups and institutions (Xie 2006). The main aspects regarding natural system integration and human system integration are listed in detail in the chapter annex Sect. 3.13.2 (GWP 2000).
Besides the necessity of integration, there is also a need for decentralized decision-making and responsibility at the lowest effective management level, to increase awareness for local and regional problems. Hence, IWRM seeks to strike a balance between top-down and bottom-up management. IWRM also wants to strengthen community-based organizations and water user associations.
The consideration of sustainability, as a main part of IWRM, is not only restricted to ecological sustainability for protecting the natural system, but it also covers aspects of financial and economic sustainability. This means, for instance, that resource allocation decisions have to be based on the economic value of water. Therefore, water must be priced at its full costs (Xie 2006).Footnote 4
The three key policy goals of IWRM are Equity, Ecological integrity and Efficiency, which are known as the three’E’s (Postel 1992):
-
Equity: Water is a basic need and hence there is the basic right for everybody to have access to water of adequate quantity and quality.
-
Ecological integrity: Water in sufficient quantities with sufficient quality should persist in the environment. Water should be used in a sustainable way, so that the future generation will be able to use it in a similar way as the present generation.
-
Efficiency: Water must be used with maximum possible efficiency, because of its finite and vulnerable nature. Cost recovery of the water service should be attained. Water should be priced according to its economic value.
For supporting the application of IWRM principles in practice, the Global Water Partnership (GWP) has created a toolbox whose three main categories are an enabling environment, institutional roles, and management instruments (GWP 2000, 2004):
-
Enabling environment refers to securing the rights and assets of all stakeholders and protecting public assets. This category involves the general framework of national policies, legislation, and regulation.
-
The institutional roles involve the consideration of a whole range of formal rules and regulations, customs and practices, ideas and information, and interest and community group networks, which together provide the institutional framework or context within which decision-makers operate.
-
The management instruments, include operational instruments for effective regulation, monitoring, and supporting decision-makers.
3.1.3 A General Framework for IWRM
For transferring the IWRM paradigm into practice, the GWP (2004) recommends an IWRM planning cycle, which is illustrated in the chapter annex. In summary, the complexity of the water cycle and interdependencies within the water sector and other sectors (e.g., food sector, electricity sector) require specific methods for integrating environmental, social, and economic issues at the level of watersheds. The paradigm of IWRM provides us with the necessary interdisciplinary tools, which come from natural water science (e.g., hydrology, geohydrology, meteorology), engineering, and social sciences like political science, sociology, and economics. Often these methods, such as optimization models or decision supportive systems, etc., utilize mathematical models as a necessary prerequisite to capture complexity. Mathematically based hydro-economic models, which can be seen as a tool of IWRM, often work with simulation or optimization models and node-link networks to replicate the spatial distribution of important system elements like natural water bodies (e.g., sea, lake, aquifer, river section, etc.), artificial water bodies (e.g., canals, etc.), infrastructure (e.g., wells, dams, pipelines, pumps, purification plants, etc.), human/artificial impacts in the water system (e.g., point of use, point pollution source, non-point pollution source). Box 3.2 gives an example for a numerical-based hydro-economic model, which is extensively used, among other applications, to establish an IWRM approach in California (Fig. 3.1).
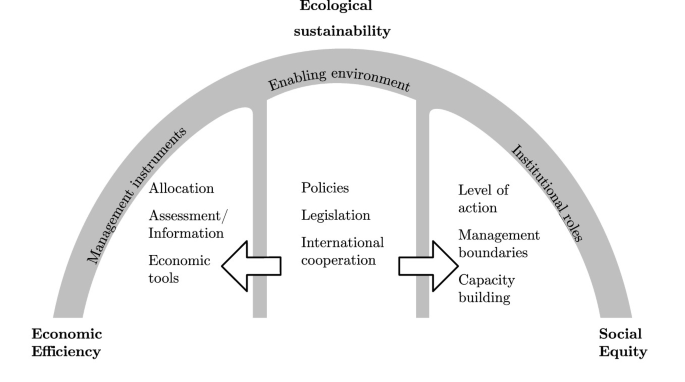
Source GWP (2000)
General framework of IWRM.
Box 3.2 The CALVIN Model
The CALVIN model is a numerical-based economic-engineering optimization model for water management in California. It was developed at the University of California in Davis. The data set contains a wide range of monthly parameters over the decades. The model is applicable to a variety of policy, operations, and planning problems. CALVIN manages water infrastructure and demands throughout California’s intertwined water network to minimize net scarcity and operating costs statewide. Some model applications are
-
Water markets,
-
Capacity expansion in the water supply,
-
Consequences of climate change,
-
Severe sustained drought impacts and adaptation, and
-
River restoration.
Source: Howitt et al. (1999), Lund et al. (2009)
The following sections introduce general but simple models that cover the major problems of IWRM step-by-step. Specific topics and economic tools of IWRM, such as the pricing policy and transboundary river management, are also addressed.
3.2 The Economic Dimension of Water
If water is scarce then inevitably the economic perspective toward water gains a particular importance. This has been stated in the aforementioned declaration of Dublin. Principle 4 states that
water has an economic value in all its competing uses and should be recognized as an economic good. [...] Managing water as an economic good is an important way of achieving efficient and equitable use, and of encouraging conservation and protection of water resources. (Xie 2006)
Emphasizing that water is an economic good does not imply this resource is exclusively a private good. Nor does it imply that water supply should be privatized. It simply implies that the water cycle must be managed as a nonabundant resource. The main difference of this kind of scarcity to other scarce goods, like e.g., precious old paintings or fossil fuels, is that scarcity is the result of a political decision not to overexploit the water cycle. The acknowledgment of scarcity follows from the adherence to the principle of sustainability. This statement is open with respect to the institutional implementation of the necessary management steps to assure sustainability and economic efficiency as well. In the following subsection, we analyze the various functions of the water cycle from an economic perspective.
3.2.1 Types of Environmental Goods
One could imagine that water is collectively owned by a society. There are many examples worldwide of collectively owned and managed watersheds. For instance, Ostrom (1990) reports from irrigation cooperatives in Spain and the Philippines where the allotment of irrigation water has been fixed within a collective institutional setting that contains conflict resolution mechanisms as well as monitoring systems. On the other hand, there exist market-based solutions like water market institutions in the southwest of the the USA or in Australia. There, water is often owned privately according to traditional property rights and sold in spot and forward markets (see Chap. 5). Hence, saying that water is an economic good should not be confounded with the notion of water as a private good. A private good is characterized by its rivalness and by the possibility of exclusion on the basis of property rights. For example, if farmer A irrigates his fields the same water needed is not available for farmer B (rivalness). But the usage of water by farmer A requires also that he is able to get hold of this water (exclusion of other users).
But water appears not only as a private good. Indeed, the water cycle assures the livelihood of people in a watershed by satisfying many different life-supporting ecosystem functions. For environmental economists, the ecosystem functions of the water cycle interact with functions from other natural resources (soil, nutrients, vegetation, etc.), i.e., input factors that produce the total ecosystem to the inhabitants of a watershed. These ecosystem services lead to societal benefits, as they create economic value. As an example, a wetland mitigates flood damages and, at the same time, can be used as a recreational area. Forests contribute to the recharge of groundwater and influence the microclimate through evapotranspiration in a favorable manner. From an economic standpoint, these life-support functions represent societal and economic values far beyond, e.g., the plain use value of water for irrigation or for the water supply of households respectively.
Some of the ecosystem services of water mentioned above appear as public goods. Public goods are characterized by the absence of rivalness and the non-applicability of exclusion. The local water cycle, for instance, sustains the microclimatic stabilization of the watershed which is the base of livelihood for the inhabitants. All members of that local population reap this positive ecosystem function (non-rivalness) and nobody can be excluded (nonexclusion). Or take the example of the flood protection capability of a forest habitat or from a wetland. Here again, the advantage accrues to all neighbors sheltered. Table 3.1 shows the classification of natural resources and their services into different types of economic goods. Each of these types will require a specific approach of management to assure an efficient and environmentally sustainable supply to society.
Take natural resources as private goods. Oil, gas, and timber, for example, are resources that are traded in markets. Indeed, they are private goods due to well-defined property rights and due to their rivalness. The case of club goods is rather similar: You pay for their services, but in contrast to the private good case your consumption does not reduce the consumption opportunity of your fellow club members.Footnote 5 Now take the case of open-access resources. Deep-sea fishery is a good example. Nobody can be prevented to cast for fish outside of the exclusive economic zone 200 nautical miles from the terrestrial baseline. Hence, there is no excludability while at the same time their fishing is rivaling. Natural resources or eco-services could also assume the property of a public good: Everybody will benefit from these services and nobody can be excluded from this benefit even if one does not pay for it. A very typical example is the rainforest’s capacity to absorb carbon.
Why is this classification important for economists? To explain the importance of these distinctions, let us take the example of the deep- sea fishery. The lacking excludability of fishing grounds leads to an overexploitation of fish populations. Too many trawlers are operating and do not take into account the effects of their fishing efforts on the fish population. Moreover, if one of the fishermen would be concerned about the future of fish stocks he not only would harm himself if he decided to fish less but also would not contribute to protecting the fish stock: The amount of fish he would abstain from fishing will be caught by his colleagues. Obviously, the unregulated free market is not a suitable institutional model for an efficient and environmentally sustainable fishery management system but, instead, it calls for public intervention. Similarly, the production of public goods should not be left to a market. In general, the supply of public goods through a market where each customer pays the same price leads to an under-provision of this good: As no customer can be excluded from consuming the good the provider is not able to make sufficient profits. Again, the free market solution would result in a dissatisfactory result, a situation sometimes interpreted as market failure.
3.2.2 Economic Dimensions of Water
The economic dimension of water use can further be specified by the classification presented in Table 3.2. The various types of water usage exhibit the economic dimensions of the water cycle. Different kinds of benefits arising from water use and various production structures in the four peculiar specifications call for different institutional frameworks to secure the specific water services to a satisfying extent.
Note that the notion of private good does not refer to an entitlement of owning a water resource privately. It refers only to its characteristics of being excludable and rival. The rules regarding how the user got hold of a certain amount of water are not specified so far. Perhaps she had paid for that water from a private supplier or the water had been allotted to her for free by a public agency. Or take the case of groundwater extraction. Perhaps the groundwater is under common property law, i.e., it is a common pool resource, owned by a community or municipality. Water extracted from a groundwater reservoir is a private good allotted to the members according to implemented rules. This could be accompanied by payments depending on the quantity of water retrieved or water could be obtained for free up to a certain limit (rationing). In this case, the financing of the necessary technical infrastructure (pipe, pumps, energy, etc.) has to be assured by local institutions, e.g., a municipality or a water cooperative.
3.3 Social Welfare, Scarcity, and the Value of Water
3.3.1 Fairness Criteria
As discussed above, the economic aspect of water management needs to be fully integrated into the concept of a sustainable water resources management approach.Footnote 6 Water use should not only respect the hydrological cycle and the boundaries of ecosystems but should also strive to use water in an efficient manner. Solving water scarcity problems by simply transferring water from one catchment area to another is not a sustainable approach as a rule. Integrated water resource management has to deal with the water demand side and the economic allocation of scarce water to users. Users are households, the industrial, and the agricultural sector. Water management activities refer not only to measures to enhance the efficiency of water use but also to specific rules that determine the allocation of water among users. These rules have to be institutionalized so as to make them effective.Footnote 7 This process must satisfy normative criteria or societal goals, namely, efficiency, social fairness, or equity and environmental sustainability. These criteria gain more and more importance in regions, where water gets increasingly scarce.
There exist various methods and model specifications to incorporate these goals into the management process. Let us explain the basic features with the help of an example. There are two farmers in an arid zone both exposed to water scarcity. Let us assume that the first farmer, F1, is more productive than farmer 2, F2. F1 produces an agricultural output—let us say alfalfa—according to a simple linear production function \(y_{1}= a_{1} w_{1}\), where \(y_{1}\) is the output of alfalfa, \(a_{1}\) denotes the water productivity, and \(w_{1}\) represents the amount of water used. Similarly, F2 produces the same crop according to the production function \(y_{2}=a_{2} w_{2}\) with a lower productivity than F1, i.e., \(a_{1}> a_{2}\). There is a sustainable water supply of \(\bar{W} \), which can be allocated to F1 and F2, i.e., \(\bar{W} =w_{1} + w_{2}\).
From a pure output view that respects the sustainability constraint \(\bar{W} \), the best water allocation maximizes total output \(y_{1}+y_{2}\). In this case, all the water should be allocated to F1 leaving nothing to F2. The farm of F2 will be shut down, and F2 would lose his revenue. But would this be just? The literature mentions various allocation principles, that go far beyond the usual efficiency criterion (Johansson-Stenman and Konow 2010).
-
1.
Accountability principle: This principle states that persons should be remunerated in proportion to their effort. Let us assume for a moment that both sites have the same productivity in terms of soil characteristics and geological properties. Hence, productivity differences could be traced back to different levels of effort (assuming that other reasons, like health, physical conditions, etc., are disregarded). The optimal water allocation would then prescribe to channel a certain portion of water to F1 and the residual to the farm of F2 depending on the relative efforts of both. One possible rule splits total output proportionally, i.e., the share of total output for farmer i is \(a_{i}/(a_{1}+a_{2})\). This, of course, requires suitable institutional arrangements to implement this rule. Specifically, effort must be observable.
-
2.
Efficiency principle: An efficient allocation implies that water is distributed according to the users’ productivities. In this case, all water goes to F1 and F2 receives nothing, which results in the highest aggregated output that can be achieved by the two farms together. This is indeed efficient in terms of maximizing total output given a certain amount of resources but the allocation seems to be at odds with fairness as nothing is left to F2. However, the economically efficient allocation, \(w_{1}= \bar{W}\) could lead to a fair outcome if redistributive instruments are available to secure fairness. In our case, the instrument consists of a transfer rule specifying how much of F1’s output, \(y_{1}\), should be transferred to F2. But how much output should be transferred if the productivity differences cannot be traced back to different effort levels? Before we deal with this issue it should be mentioned that a strong trade-off between efficiency and fairness exists only if no other management instrument than the water allocation itself is available. In the presence of other redistributive instruments, this trade-off might still exist but it is less severe.
-
3.
Basic need principle: According to the basic need principle, an allocation of water has to ensure that all members of a society survive in a decent way. In the case of the two farms, the water allocation is either such that all water goes to F1 except for the amount \(w_2\) that guarantees F2 an output sufficient to survive. Alternatively, all water goes to F1 while F1 is obligated to transfer a sufficient amount of output to F2. Again, the issue of whether the allocation is efficient or not depends on the availability of a transfer system. The transfer system might refer either to output or to water. Whatever transfer medium is chosen the basic need principle prescribes that all people have an entitlement to the provision of goods or resources so as to survive in a decent way. The basic need principle is especially important for developing countries.
-
4.
Strict equality: There is a long-lasting discussion in social philosophy on distributional justice. One egalitarian view is the concept of moral arbitrariness proposed by the philosopher John Rawls.Footnote 8 In modern societies, there is a broad agreement that the social product should not be distributed according to innate entitlements as in feudal times. But John Rawls also denies that justice can be secured by the institutionalization of equal opportunities as in the case of free markets, or free markets and supporting institutions to equalize opportunities for people from all social classes. All characteristics people cannot influence by themselves shall not be decisive for the distribution of produced income. If somebody is highly gifted and utilizes this advantage in a free market then the outcome will be unjust. The uneven distribution of innate endowments among all people is morally arbitrary and, hence, the productivity effects of these endowments shall be shared by the community as a whole. This leads to the conclusion that strict income equality is just. There is an exception: incentives. If a talented person is highly taxed then he might lessen his effort leading to less production. Here, John Rawls introduces the difference principle. The distribution of goods remains just if in the course of an income increase of a successful market participant the income of the most disadvantaged rises as well.

Source own illustration
Efficiency and fairness.
The four principles can be summarized with the help of Fig. 3.2. The production possibility line shows all possible combinations of output, \(\{y_{1},y_{2}\}\), as a function of the water allocation, W. The maximum potential output of F1, \(y_{1}^{max}\), is reached if the whole sustainable water supply, \(\bar{W}\), is allocated to F1, hence the output combination \(\left\{ y_{1}^{max},0\right\} \) satisfies the efficiency principle. The dotted line depicts all possible output distributions if a transfer system is available. In this case, the \(y_{1}=a_{1} \bar{W} \) will be distributed among F1 and F2 according to one of the fairness criteria. For strict equality we have point Et. Here, both farmers receive the same amount of agricultural output after the transfer has taken place. If one applies the accountability criterion, the output allocation is determined by proportional rule \(y_{i}=[a_{i}/(a_{1} + a_{2} )]y_{1}^{max} \). This allocation determines the proportion of both allocations, i.e., \(y_{2}= (a_{2}/a_{1})y_{1}\). The intersection of this array with the production possibility line (dotted line) is point P2 that defines the allocation for this case. Alternatively, the proportional rule can be applied to total water available, i.e., \(y_{i}=[a_{i}/(a_{1} + a_{2})]\bar{W}\), which leads to the array \(y_{2}= (a_{2}/a_{1})^{2}y_{1}\).Footnote 9 Which of the two rules should be applied depends on what the distributandum is, water or agricultural output. Points S and St indicate the distribution if the basic need principle is satisfied.
If the institutional framework does not permit a redistribution of goods, the consideration of a fair distribution is only possible with the help of water allocation. In this case, the production possibility line is given by the solid line in Fig. 3.2. The corresponding allocations are then given by the points E (strict equality), P1 (proportional allocation) and S (basic needs). The lines \(S_{2}\) and \(S_{1}\) are the respective lifelines of F2 and F1, i.e., the minimum outputs that are sufficient for survival. Moving from S to St illustrates the institutional efficiency gains that can be realized by introducing a transfer system.
The difference principle of John Rawls is visualized by the shift from E to, say, P2. If in the course of an institutional innovation transfers are introduced we could move from the strict egalitarian distribution E to P2 for instance.Footnote 10 In point P2 both incomes in terms of output quantities have increased relative to point E, therefore the difference principle is satisfied despite the deterioration of the income distribution among the users. The increase in income of F1 is accompanied by a rise in F2’s income. P2 is the allocation point where the accountability principle is satisfied. Here, total output, \(y_{1}^{max} \), is divided proportionally in shares of \(a_{i}/(a_{1}+a_{2}) \). If transfers are not possible, the accountability principle can only be applied to the water allocation. In this case allocation P1 will be chosen.
3.3.2 Social Welfare Function
3.3.2.1 Individual Utility Functions
In mathematical policy models, the optimal allocation is often derived from a social welfare function (SWF). Usually, these functions depend on the utility or the well-being of every single member of the community or society under consideration. In our simple case, the social welfare function could be written as \(SWF = G(y_{1},y_{2})\). The well-being of F1 and F2 is indicated by their incomes, \(y_{1}\) and \(y_{2}\), respectively. There are various specifications of this function that can be related to the fairness principles introduced above. The SWF most prevalent in economics and also in the IWRM literature is the so-called utilitarian social welfare function, according to which social welfare is simply the sum of the individual welfare of every single member of the society. Here, individual welfare is identified as an individual’s income and its consumption.
The optimal allocation of water is derived by maximizing the objective function represented by Eq. (3.1) while taking all the economic and hydrological constraints into account. This SWF adheres to the efficiency principle. What matters is the total sum of individuals’ well-being without any regard of the distribution of well-being. If we insert the farmers’ linear production functions into Eq. (3.1) and stick to a an ecologically sustainable solution the management’s objective is
Utilizing the Karush–Kuhn–Tucker (KKT) conditionsFootnote 11 we get the solution \(w_{1}^{*}= \bar{W}\) and \(w_{2}^{*}= 0\). All the water goes to F1 leading to consumption of \(y_{1}^{*}= a_{1}\bar{W}\) and \(y_{2}^{*}=0\).
However, as this allocation can hardly be termed fair, the program can be amended by additional constraints to include the various fairness principles. For instance, if we include the restriction of a minimum threshold for F2’s consumption quantities, i.e., \(y_{2} \ge s_{2}\), the program would lead to a water allocation such that point S, or point St in the case a transfer system is in place, will be reached. The allocations in points S and St satisfy the basic need principle. Or you believe in the principle of strict equality. Then, the additional constraint to be included in the maximization program is \(y_{1}= y_{2}\), which leads to a solution indicated by point E. In the presence of a transfer system, we must include \(a_{1} w_{1} - \tau = a_{2} w_{2} + \tau \) where \(\tau \) is the transfer from F1 to F2, yielding the solution in point Et. The adherence to strict equality can be expressed by a Social Welfare Function (SWF), which states that the well-being of society depends exclusively on the well-being of the most disadvantaged individual.
Maximizing this SWF leads, of course, to an egalitarian solution, as depicted by points E and Et in Fig. 3.2. This SWF represents Rawls’ difference principle, as the only criterion determining overall social welfare is the well-being of the poor. If in the course of an increase in income of the more advantaged, the income of the poor rises as well, social welfare has improved. The social improvement comes through the income increase of the poor, not through the increase of both incomes as in the case of the utilitarian SWF.
Thus far we have identified income or consumption as well-being. The allocation problem becomes more complicated if well-being is not directly expressed by income or consumption but by the utility these observable variables create. Thereby, the level of well-being does not follow consumption in a linear manner generally. Doubling consumption leads to less than doubling of the original satisfaction level.Footnote 12 Furthermore, this attitude toward consumption differs individually.
The level of satisfaction resulting from consumption can be expressed by means of a utility function that transforms consumption quantities into some utilitarian units of well-being or happiness.Footnote 13 Let us assume that the utility functions of F1 and F2, respectively, are
The heterogeneity of both farmers is indicated by the two parameters A and B, where we assume that \(A<B\). Thus, the more productive farmer F1 derives less utility from consumption than the less productive farmer, F2, does.Footnote 14
Similar to the production possibility frontier, we can construct a utility possibility frontier indicating all possible utility distributions that can be achieved by allocating water to F1 and F2. Recall that \(w_{2}= \bar{W} - w_{1}\), which is substituted in Eq. (3.5). Solving Eq. (3.4) for \(w_{1}\) gives \(w_{1}= (B_{1}/A)^{(1/\eta )}\) and inserting this expression for \(w_{1}\) into Eq. (3.5) yields
Equation (3.6) is the algebraic specification of the utility possibility frontier. Note that this frontier is derived under the assumption that transfers of output between both farmers are not possible. In Fig. 3.3, it corresponds to the lower of the two convex curves.
3.3.2.2 Allocation When Transfers Are Possible
If output transfers are assumed to be feasible the derivation of the utility possibility frontier consists of two steps. First, total output is maximized by allocating all water to F1, such that \(y_{1}^{max} = a_{1}\bar{W}\). Second, the (re-)distribution of utility from F1 and F2 can indirectly be accomplished by an output transfer, \(\tau \), such that
Solving Eq. (3.7) for \(\tau \) and inserting the expression into Eq. (3.8) yields the utility possibility frontier for the case that a transfer system can be established.
This function is also displayed in Fig. 3.3 (the upper convex curve). Both utility frontiers, which assume either the impossibility of output transfers or the availability of a transfer mechanism, present the maximum utility level of F2 given the utility level of F1.
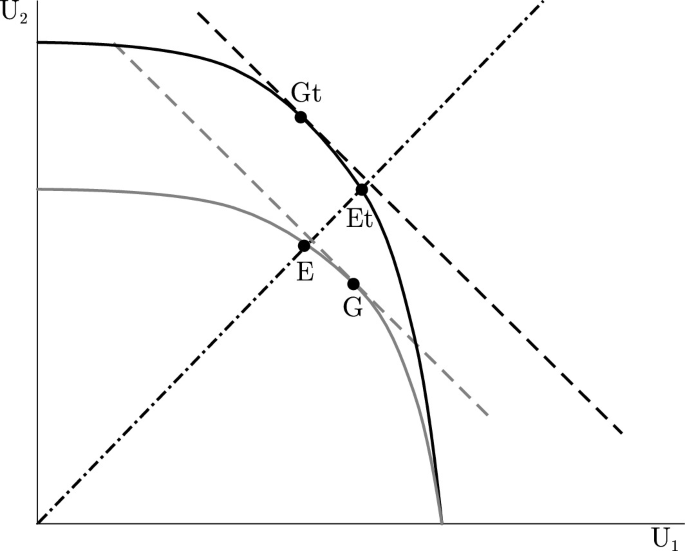
Source own illustration
Utility possibility frontiers with and without transfers.
The lower (light gray) possibility curve represents all utility distributions when transfers are not possible, thus F2 can only acquire utility by producing at his site. To do so, water has to be diverted from the more productive farmer F1 to F2. Hence, the choice of the utility distribution among both farmers cannot be separated from the choice of the “size of the cake”. However, if an output transfer system can be installed the issues of maximizing agricultural output and of output distribution can be separated.
Figure 3.3 plots as the first proposal the equal distribution of well-being. The 45-degree line through the origin shows this equal distribution. There is one intersection with each of the two utility possibility curves. The first one is E. Here, water has to be allocated such that both farmers are equally well off. Since no transfers are possible the water allocation has to solve both tasks, production efficiency and fair distribution.
The second intersection ist Et where equality of utility is ensured. Here, the issue of distribution can be separated from the water allocation. Since F1 is more productive than F2, all water gos to F1. However, the output is distributed such that equality of well-being is achieved. Since F1 derives less utility from consumption than F2 does, F1 requires more quantities consumed than F2 in order to achieve the same level of utility for both farmers. From \(U_{1}(y_{1}) = U_{2}(y_{2})\) it follows
and since \(A<B\) it follows that \(y_{1}>y_{2}\).
Of course, to perform this calculation we must be able to compare the utilities of both farmers, i.e., interpersonal comparability must be possible. This requires a certain degree of measurability of happiness or well-being. If this is given we can not only determine the optimal total output but also its distribution according to the utility created for both farmers. This must not necessarily be the equal well-being solution, which we just have discussed. This may also depend on other fairness principles to which the policy maker or the community adheres.
Dating back to Jeremy Bentham, a philosopher of the eighteenth century, the main goal of a free society should be to organize the economy such that it leads to the “Greatest happiness of the greatest number” (Bentham 2008, 393). Societal welfare is defined as the sum over all individual levels of well-being. The corresponding SWF is simply the utilitarian specification, as in Eq. (3.2). The income distribution matters only insofar as it contributes to achieving the goal of the greatest happiness of all members.
3.3.2.3 Resulting Water Allocation
Again, we have to distinguish between a system without and with transfer possibilities. In the case with no transfer, the optimal water allocation can be determined by maximizing the sum of utilities, i.e., \(U_{sum} = U_{1}+U_{2} \). Graphically, this will be achieved in Fig. 3.3 at point G southeast of E. Here, \(U_{sum}\) reaches the highest value possible in an allocation system without transfer.Footnote 15 The resulting benefit distribution is not equal. The amount of water is distributed in an inequitable way. F1 receives more than F2. This result depends on two countervailing effects. On one side, F2 should receive more consumption due to its higher marginal utility, on the other side F2 is less productive than F1. Hence, shifting more water to F2 decreases total well-being.Footnote 16 It can thus be seen that Bentham’s approach does indeed advocate inequality if it only leads to a maximization of aggregated well-being.
The corresponding water allocation point G is based on is calculated from the following program:
The exact determination of this allocation is not necessary here. It is sufficient to see that Bentham’s utilitarian approach subordinates the distribution of benefits to the criterion of aggregated welfare. As a result, the available water is allocated such that point G is realized.
In case of a system with transfer, we get a similar result. The Benthamian solution is determined graphically as in the first case. We move the line of the total benefit up to the right until we touch the outermost point Gt in Fig. 3.3. The algebraic solution is derived as follows: We start by allocating all water to F1 (see program Eq. (3.12)) and maximize total utility with respect to a transfer variable:
From the optimality condition \(U'_{1}(..)= U'_{2}(..)\), we can derive
Since \(A<B\), it follows from Eq. (3.13) that \(y_{1} = \left( a_{1} \bar{W} - \tau \right) < \tau = y_{2}\). Contrary to the allocation under strict equality, F1 gets less income than F2, simply because farmer F1 is less effective in terms of generating well-being through his low valuing of consumption. Thus, point Gt is northwest of point Et. If one compares both solutions, the egalitarian and the utilitarian in Fig. 3.3, one can observe that in point Gt total utility is maximized, whereas in Et total utility is below its maximum value. The utilitarian criterion is achieved at the expense of that member of society who derives less utility from consumption.Footnote 17 If one adheres to the concept of moral arbitrariness this approach is not convincing. If the intensity of consumption pleasure is innate, then it is collectively owned by the society. Hence, the marginal utility of income attached by nature to the members of the society does not imply an entitlement to more consumption. As such, equating marginal utilities so as to maximize the SFW is morally not convincing in the view of supporters of an egalitarian standpoint.
From a practical viewpoint, it is important to note that distributional issues can be separated from efficiency problems only as far as the society is equipped with the necessary institutional capacities to solve distributional requirements with instruments other than the allocation of inputs and products. In our example, irrespective of the distributional principles the water allocation was chosen by directing the whole water available to farmer F1. Many integrated water management models start from this separability assumption focusing solely on the allocation of water and other inputs while leaving distributional issues to social and distribution policy. If water is used for different purposes, e.g., as input for agricultural products and as a consumption good for households the separation of distributional and allocational issues gets more complicated. Needless to say that the weighing of distributive and allocative issues is a major challenge in the specific institutional environment, and that solutions must be tailored specific to the context, too.
3.3.3 Allocation with and without Water Scarcity
So far it was assumed that no abstraction costs incur to both farmers. Without costs, the use of water could be infinite if it was not constrained by the upper bound \(\bar{W} \). If such a constraint cannot be implemented, water will be overused. However, if abstraction costs are present water overuse can be prevented or at least lessened. To analyze the relation among water utilization, abstraction costs, and sustainability thresholds, we include abstraction costs in our two-farmer model. Furthermore, it is assumed that production of the agricultural product can be captured by the production functions depicted in Eqs. (3.14) and (3.15).
Instead of assuming that one farmer is always more productive than the other, we now introduce production functions with decreasing marginal products. For simplicity both farmers differ only with respect to \(a_{i}\), where \(a_{1}>a_{2}\). Costs of water abstraction denominated in agricultural products are determined by the cost functions in Eq. (3.16), where F denotes the fixed cost and c the marginal cost of abstracting water.
Disregarding distributional issues, the goal is to maximize the aggregated output of agricultural products, i.e.,
leading to the optimality conditions
This allocation can also be achieved in a market economy, where farmers maximize their profits according to
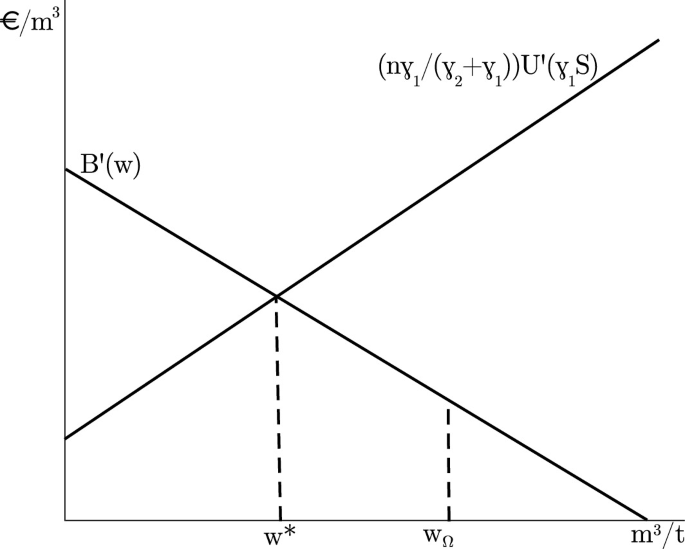
and a water treatment plant sells water under a price regulation scheme. The price scheme for both farmers is a two-part tariff consisting of a volumetric component q and an access fee M. The price regulation authority sets \(q= c\) and \(M=F/2\). From Eq. (3.19), it is obvious that the market equilibrium together with the water price regulation leads to the optimal allocation. Total amount of water used, \(w_{1}^{*}+w_{2}^{*}= W^{*}\), is determined in Fig. 3.4, where the total demand curve intersects with the constant marginal cost line. The intersections of the respective marginal product curves of each farmer with the marginal cost line yield the optimal allocation.

Source own illustration
Optimal allocation with and without water scarcity.
Since it is costly to abstract water, its use is finite. It remains to examine whether the optimal allocation, \(W^{*}\), lies above the sustainable boundary, \(\bar{W}\). In Fig. 3.4, two scenarios are depicted. The first scenario assumes that aggregated water use is less than the sustainability boundary leading to a water price of \(q=c\). The second scenario assumes that abstracting water is sufficiently cheap such that the aggregated water use of both farmers exceeds the sustainable boundary. In this case, the presence of abstraction costs does not protect the hydrological cycle sufficiently. Hence, a hydrological constraint must be introduced leading to the optimization program
This leads to the optimality conditions
where \(\lambda > 0\) is the respective Lagrangian of the constraint. This case is depicted in Fig. 3.4, where total water demand is constrained by the black line of \(\bar{W}\). As a result, the marginal products exceed marginal cost by the difference which is called scarcity rent.
Consider the respective market solution. The regulatory authority must increase the volumetric component of the water tariff to \(q= c + \lambda \) in order to push back total demand such that it does not exceed the sustainability threshold. Since the sustainable water supply is smaller than the amount of water that the economy would abstract, water is scarce and, as a consequence, the water price exceeds marginal costs, which yields a scarcity rent for the water supplier. Figure 3.4 shows the income of the water supplier due to the scarcity rent, which is represented by the shaded rectangular. There is a discussion about the distribution of the scarcity rent.Footnote 18 This rent income can be used to lower the access fee. But what should we do with residual (if there is one)? Some people suggest that this rent income should be taxed away and redistributed to the users. Or they take the existence of scarcity rents as an argument to claim that the water infrastructure must be owned publicly.
Box 3.3 What are the motives of the Dog in the Manger?
Alan Garcia, former president of Peru, complained that the country is poor despite its abundance of natural resources. According to the Human Development Index (HDI), Peru ranges at position 77 out of 187 countries. The HDI is an aggregated measure for the living conditions of a country with respect to life expectancy, access to knowledge and a decent standard of living. Alan Garcia identified political and cultural traits as the very source of this deplorable economic and social situation, which he referred to as the dog-in-the-manger-syndrome. The dog in the manger is a figure from a fable of the ancient storyteller Aesop. The beast lies in the manger full of straw and prevents other animals to take the straw from the manger. The very motive is a pure grudge, as the straw is useless to the dog. Translated into the Peruvian political environment, the dog can be seen as an analogy for poor peasants dwelling on small plots in the countryside without any access to agricultural technology and, at the same time, lacking the financial means to invest. In addition, property rights are informal thus making investments insecure. Whenever modern politicians tried to develop the traditional agriculture by consolidating the plots into plains accessible to agricultural technology, local uproar emanated, often well organized by local politicians. According to Alan Garcia, people were caught in a vicious circle of poverty and an ideological superstructure that left them in a habitual state of hostility toward modern development.
There were some attempts to modernize the agricultural sector by promoting privatization and land consolidation with the help of law amendments and even new laws. In 2009, the Peruvian parliament passed a water bill that put much emphasis on the efficient use of water. The water irrigation system of traditional agriculture was highly inefficient compared to modern technologies based on, e.g., drip irrigation. Therefore, a development framework plan was established up to attract large-scale agribusiness enterprises able to invest in efficiency-enhancing technologies. But there has been political resistance against this development agenda, which raises the question whether this opposition can only be interpreted as driven by the grudge of the dog in the manger. We can shed some light in this discussion with the help of our farmer model, thereby discussing the interrelation between water efficiency and income distribution.
Let us assume that there are n equally sized lots of land \(i = \{1,2,\ldots ,n\} \) that are cropped in a traditional manner. The water productivity \(a_{t}\) is equal across all lots (the subscript t refers to the traditional agricultural production). In addition, labor required per lot is \(l_{ti}= (1/b_{t}) y_{ti}\), where \(b_{t}\) is labor productivity which is also equal across all lots. Each peasant gets the same amount of water \(w_{t1}=w_{t2} \cdots = w_{tn}\), where \(\sum w_{ti} = \bar{W}\). Thus \(w_{ti} = \bar{W}/n, \, \forall i\). Recall that \(y_{ti} = a_{t} w_{ti}\). Then, total labor required for the total agricultural product is
where total output amounts to
We assume that in the outset there is no unemployment, i.e., the required amount of labor \(L_{t}\) equals the number of peasants or land laborers dwelling on the site. Production and income per peasant (laborer) is
where the right-hand side follows from Eqs. (3.22) and (3.23), indicating that peasants earn their productivity.
A big investment project is proposed covering all n sites. Water productivity will increase to \(a_{m} > a_{t}\) for all sites (The subscript m denotes modern agricultural technologies.). Consequently, output per site will increase to \(y_{mi} = a_{m}w_{mi}\). Since each lot is equally productive, the water is allocated in equal portions, i.e., \( w_{m1}=w_{m2}=\cdots =w_{mn}\), resulting in \(y_{m} = a_{2} \bar{W}/n \). Total agricultural output is \( Y_{m} = a_{m} \bar{W} > Y_{t} = a_{t} \bar{W} \). The question remains whether there is enough labor available to produce \(Y_{m}\). Assume that the new technology makes labor also more productive due to the capital intensive cultivation of the the land, such that
where \(b_{m} > b_{t}\). Both coefficients of the modern technology are higher, leaving the question whether the new technology is labor saving. Observations in many countries document that in the course of modernizing of the agricultural sector migration into cities can be observed, which indicates that agricultural technical progress is labor saving (Bhandari and Ghimire 2016). Therefore, we assume that \(L_{m} < L_{t} \).
It remains to analyze the total effect of technological progress in terms of poverty alleviation. Does the real income of peasants increase or decrease through modernizing agriculture?
Let us proceed with the analysis by introducing the investors: Profits of the investors are given by
where w is the real wage. The labor demand function of the agro-business firm can be derived by maximizing its profits with respect to L. Since the model is linear, the demand function is a step function as depicted in the following figure below. If \(b_{m} \ge w \), i.e., if labor productivity is not less than the real wage w, labor demand expands to \(L_{m}=(a_{m}/b_{m})\bar{W}\), which is the labor requirement to produce total output \(Y_{m}\), given a labor productivity of \(b_{m}\) and water availability \(\bar{W}\). If the real wage exceeds \(b_{m}\), labor demand vanishes because the innovation is not profitable. The labor supply function is represented by the kinked curve in the following figure.

If real wage is higher than s, which can be interpreted as the alternative real income of the peasants leaving the countryside for employment opportunities in the urban area, all peasants \(L_{t}\) want to stay employed in the agricultural sector. If we let both curves intersect, the equilibrium will exactly be equal to s, implying that the efficiency-enhancing technology leads to a drop in real income for the peasants from \(b_{t}\) to s. Then, indeed, efficiency and distributional goals contradict.
But there are some other countervailing effects that might ease the situation of land laborers. The increased production of agricultural output from \(Y_{t}\) to \(Y_{m}\) may lead to a decrease in the price for these products, thus increasing the urban real wage s. If the price decline is such that \(s > b_{t}\), the poverty of the peasants is reduced. The occurrence of profits for agro-business firms leads to an increase for real wage and hence to a welfare increase for the least advantaged. But even if s falls short of \(b_{t}\) it would be conceivable that poverty is reduced. If the poor peasants became shareholders of the firm their welfare would increase above \(b_{t}\). But this requires well-defined property rights allowing peasants to sell their sites in exchange for those shares. If property rights are not well defined and well protected by sustainable institutions, it may also happen that peasants are simply expropriated (the blue intersection point in the figure). The dog in the manger knows why he defies modernization.
In summary, the political discussion of modernizing traditional production structures in the agriculture of developing countries cannot be based solely on efficiency considerations. IWRM shall not neglect the redistributive effects of efficiency-enhancing measures.
Sources: Cohen and Weitzman (1975), Boelens and Vos (2012), Bhandari and Ghimire (2016)
3.4 Eco-Hydrology and the Management of Water as a Public Good
The water cycle provides not only water as a consumption good to consumers or as a productive input to firms but it is also indispensable for environmental services like the production of vapor that stabilizes the microclimate. Or take the ecological system of water and forests as an example. Forests produce ecosystem services like flood control, water filtration, or provision of habitats for various species, whereas in turn forests need land and water. The water cycle is a fundamental part of the whole eco-system. This ecological system consists of various natural cycles which are interlinked.Footnote 19 In addition to the hydrological cycle, we have the carbon-oxygen cycle that consists of a photosynthesis part, in which carbon dioxide is converted into oxygen, and the decomposition part, where organic molecules are separated into carbon dioxide and water. There is also a nitrogen cycle that is crucial for the growth and decay cycle of plants. On an ecological level, these cycles form the nutrient cycles where all the different living systems take place. From a more holistic IWRM viewpoint, these cycles are affected by the shaping of the local hydrological cycle and the way land use is organized. Some scientists, therefore, claim that all these interactions have to be included in a comprehensive policy approach.
A management system following this holistic integrated approach is called ecohydrology, a term introduced by Rodriguez-Iturbe (2000). It comprises the whole climate-soil-vegetation system. Thus, landscape planning and the management of water resources have to be closely linked. In this sense, IWRM goes far beyond the efficient provision of water for the private consumption of households or firms. The economic management of a river has not only to organize the abstraction of water but also to secure the water provision for the local ecosystem services. These services are sustained by assuring the viability of the various ecological cycles mentioned above. Also, these services include also more visible services, e.g., the provision of recreation in the form of, e.g., fishing, hiking, camping, or the mere presence of nature as an acoustical and visual environment that is part of the cultural landscape.
Under this perspective, we note that IWRM is much more than only managing some water flows for private use. From an economic perspective it turns out that water management, which takes these eco-services into account, considers water not only as a private but also as a public good. For instance, the stabilization of the microclimate by the water cycle is an ecosystem service that affects all inhabitants of a watershed (and beyond). In the following, we include this public good property of water into our IWRM approach. To do so we utilize our hydro-economic model introduced in Sect. 2.3.
Assume that there are two options for water management. Either water is abstracted for private purposes or water is retained for the ecosystem. To keep the analysis simple, we assume that the value of ecosystem services can be captured by a utility function \(U_{i}(E), i=\{1,2,\ldots ,n\}\) that depends on these services. i is the index of individual i and n is the size of the population living in the watershed. E are the ecosystem services, i.e., the parameter contains the whole interdependency between the water cycle, the vegetation, and the geological structure of the watershed.Footnote 20 E depends not only on policy instruments of the IWRM but also on other economic variables that influence the ecosystem shaping the landscape (e.g., soil sealing, agricultural vegetation, ...). In the following, we focus solely on the issue of allocating water to private purposes and to public services. We identify the green water, i.e., the evapotranspiration of the vegetation, as a public good, because all inhabitants are affected similarly by the vapor of green water. Thus, the utility function for ecosystem services depends on the evapotranspiration, ET, as depicted in Eq. (3.27).
The benefit of private water consumption is represented by a benefit function, \(B_{i}\),Footnote 21 that represents profits or benefit from water consumption
The hydrology can be captured by our linear dynamic mass equation
To keep the optimization procedure simple, we confine ourselves to a steady-state analysis, i.e., we assume that the local hydrological cycle is an equilibrium where \(dS(t)/dt = 0 \). Solving for S, we get
The equation shows that S depends on the water allocation to consumers, \(w_{i}\) with \(i=\{1,2,\ldots ,n\} \). To solve the IWRM problem, the definition of the social welfare function is required and presented in Eq. (3.31).
The management task is to maximize SWF with respect to \(w_{i}\) taking into account that private consumption reduces water available for the ecosystem (see Eq. (3.30)). It is a straightforward exercise to derive the optimality conditions for each individual:
where S is represented by Eq. (3.30). This set of equations reflects the Samuelson-rule that specifies how the optimal amount of a public good should be determined. The main point is that private marginal benefit should be equal to the sum of marginal benefits over all inhabitants, as one liter of private water consumption is associated with costs that stem from the marginal loss of ecosystem services for all inhabitants. Hence, both values must be optimally balanced. If we assume that all inhabitants are identical with respect to their valuation functions we can condense the set of equations into one figure. Notice that in this case Eq. (3.32) reduces to
where S is defined in Eq. (3.30) (Fig. 3.5).
Source own illustration
Optimal allocation of water as a public good.
The optimal water consumption is where both marginal valuation curves intersect. Inserting \(w^{*} \) into Eq. (3.30) yields the optimal stream of green water, ET, the optimal evapotranspiration, which interacts with all the other natural cycle mentioned above. As a result, a micro-climate is established that sustains environmental services leading to the well-being of the local human population. Depending on cultural traits and also on the population size, this intersection of marginal valuation curves can change over time, i.e., \(w^{*}\) can change and move to the right, for example. There is a certain viable range of \(\{ET,w\}\)-combinations the water management can choose. Landscapes can be shaped in many various ways depending on cultural traditions and, of course, the biological needs of the society. However, there are boundaries. Beyond these boundaries, irreversible changes in the ecology will take place. As a result, by transgressing these ecological tipping points, the regional ecological system might switch into a state hostile to human life, like a desert for instance. This boundary is depicted in Fig. 3.5 as \(w_{\varOmega } \). If water abstraction is higher than this tipping point, evapotranspiration decreases to an extent that triggers a complete change of the microclimate. The ecological system turns into a semiarid or arid zone with all the detrimental consequences for society.Footnote 22
3.5 Water Allocation and the Human Right to Water
3.5.1 Millennium Goal 7 and Sustainable Development Goal 6: Water
According to the United Nations Children’s Fund (UNICEF) and the World Health Organization (WHO 2019), more than two billion people in the world did not have access to safe drinking water, and another two billion people lacked access to basic sanitation in 2019. In 2010, the UN General Assembly declared the access to water, be it as drinking water or a medium for sanitation and hygiene, as a human right. Together with six additional goals, which range from halving the proportion of people living in extreme poverty to reducing the under-five mortality rate by two-thirds between 1990 and 2015, the Millennium Goal 7 called toFootnote 23
Halve, by 2015, the proportion of the population without sustainable access to safe drinking water and basic sanitation.
In 2015, these Millennium Development Goals were replaced by the Sustainable Development Goals consisting of 17 goals ranging from poverty and hunger eradication to strategies aiming at building peaceful and inclusive institutions. Goal 6 refers to clean water and sanitation, according to which universal access to safe and affordable drinking water should be ensured by 2030—quite an ambitious goal in the face of climate change leading to water scarcity, specifically in those areas of the world with the poorest inhabitants.
From the perspective of IWRM, the achievement of Goal 6 requires to tackle the access problem and, at the same time, to protect the catchment areas against an overutilization of water. Water scarcity translates into high water prices, which in turn brings about an optimal allocation of water use. This approach will only result in an optimal equilibrium if all market participants can afford the amount of water to cover their basic needs for a secure conduct of life. There is a broad literature on basic water needs, the lower range of which would be in the range of 15 liters per day and capita (lpd) (Reed et al. 2011). This lifeline is subdivided into various need types as displayed in Table 3.3.
In addition to water, households need a certain daily endowment of calories and nutrition as well. Therefore, poor households need a minimum income to survive in order to finance expenses that allow them to buy the subsistence basket of basic goods, containing water, food (nutrition), housing, and shelter. But often poor households do not earn enough money to secure this lifeline. It is rather obvious that price increases can affect these households in a very detrimental way. We, therefore, cannot trust in unregulated markets as institutions that secure efficiency. Classical welfare theory assumes that a market participant can make a living based on her income. Hence, the demand for goods is solely the expression of preferences following from taste and predispositions. In the case of poor households, we cannot assume that their demand for basic goods is the result of optimizing their demand according to these kinds of preferences. Often, the demand for goods is nothing else than the result of poverty management below the lifeline. The composition of food purchased is optimized with respect to calorie content. Hence, in this case, revealed preferences are based on survival strategies and not on taste.
This view coincides with social-psychological theories of need management. The famous Maslowian need hierarchy describes the stratification of human needs whose satisfaction is expressed in corresponding actions be it the demand for water and nutrition or supply of labor.Footnote 24 At the bottom is the satisfaction of physiological needs, followed by other needs such as security and social recognition. In our case, the satisfaction of physiological needs is essential. Needs at this level are undoubtedly legitimized by human rights. If markets do not guarantee their satisfaction the welfare theoretical criterion of efficiency or social optimality is irrelevant.
Take as an example the Pareto criterion economists often refer to: A reallocation of goods is said to be socially preferable to a given distribution of goods if it increases the welfare of one or more members of society without harming the well-being of others. This approach might be suitable for a middle-class society but not for an economy divided into poor people and members endowed with sufficient financial means to not only satisfy basis needs but also to buy those products and services which allow individual self-fulfillment at a higher level of the hierarchy of needs. For instance, increasing the welfare of the latter group by allowing good exchange between both classes does not increase social welfare. Here we want to refer to the Rawlsian social welfare function introduced in Sect. 3.4, where social welfare depends solely on the well-being of the poorest.
IWRM has to take into account this distinction between taste-driven consumer choices and revealed purchase behavior resulting from survival strategies. In this sense, poor households have to be included in the IWRM models that deliver allocation mechanisms that guarantee the subsistence level of drinking water, sanitation, and other basic goods and services in line with the Sustainable Development Goals.
3.5.2 Water Management for the Very Poor
In the following, we will deal with a water allocation model under the assumption that there are two categories of needs in the Maslowian hierarchy of households: physical needs and more advanced wants satisfying cultural needs. Both of these needs can be satisfied with the help of consumption goods. To keep the model simple, we restrict it to two fundamental inputs: water and nutrition. Of course, nutrition itself consists of various food products which we do not further subdivide. Let us begin with a household that has sufficient means to satisfy the first category and is also able to serve the satisfaction of cultural needs to a certain extent. The following figure identifies this household with budget line II and the respective indifference curve where the utility of the household is maximized (point O1). The corresponding budget line constraint is (see Fig. 3.6):
where w is water consumption and n nutrition.

Source own illustration
Risk management of the poor.
Contrary to the standard household model, we distinguish between consumption which satisfies the first layer of needs \(\{w_{s},n_{s}\} \) and additional consumption which serves the cultural needs, i.e.,
where \(w_{a}\) and \(n_{a}\) is excess demand beyond the subsistence levels \(\{w_{s},n_{s}\} \), i.e., water and nutrition intake to assure the satisfaction of physical needs. This excess demand can be water consumption for various other purposes than drinking, personal hygiene, cooking and cleaning, for instance, bath taking, cultivating a garden with flowers, etc. The same applies to nutrition. After having consumed the necessary calorie intake to survive, the preparation of food is a cultural need, too.
The optimal point O1 can be derived with the help of the standard maximization approach for households.
Figure 3.6 also depicts two further scenarios, which refer to the case that the households income does not suffice to cover the subsistence point S, i.e., the point where both goods can be purchased in an amount that guarantees the full coverage of the physical needs.Footnote 25 These are the areas C1, C2, and C3.
Here, a survival strategy is required. Poor households try to maximize their life expectancy or survival probability with the help of a household production function. This production function transforms the inputs water and basic goods into a certain health state, which can be expressed in, say, survival probability units. Similar to ordinary indifference curves derived from standard utility functions, iso-health lines can be defined with increasing survival probability to the northeast and decreasing life expectancy to the southwest. There are various possible shapes to draw these iso-health lines. We assume for simplicity that these lines follow from a linear-limitational interrelation. Let the corresponding survival function be
where \(a, b, g >0\) are parameters determining the slope and the position of the expansion path connecting all corner points for various iso-health lines. As water is more important than nutrition to survive for a certain time we have assumed that the expansion path intersects the abscissa at a positive \(w_{s}\)-value. The expansion path, i.e., the line connecting all corner points of iso-health lines shows how households react optimally if income decreases and/or relative prices change. Assume, for instance, that the budget line (II) rotates to the southwest because the price of water has increased (line Ia). Households try to maximize their health by maximizing \(S(w_{s},n_{s})\) subject to their budget line Ia, i.e., \( y = p_{w} w_{s} + p_{n} n_{s} \). The optimal need management then leads to point O2. As the water price increases more and more, the optimal point shifts to the southwest finally reaching the horizontal axis for budget line Ib. From there, the optimum point moves along the horizontal axis and towards the origin, i.e., the household tries to use all its income for buying water (see point O3).
The specification of the survival function needs more empirical investigation. Note, however, that the main point of this model does not rest on the precise structure of iso-health lines but on the viewpoint that the extremely poor can only choose their water and basic food southwest of the point S. Whatever quantities \(w_{s}\) and \(n_{s}\) are chosen by poor households, they cannot be interpreted as instruments used to maximize well-being in the sense of an optimal management of tastes and preferences that are relevant for the upper layers of the Maslowian hierarchy. They simply represent rational survival strategies.
3.5.3 A Water Market with Extremely Poor Households
Now we are able to construct the water demand curve of poor households beginning from a price that leaves the consumption bundle in the area of needs and preferences beyond pure survival. If \(p_{w}\) increases, finally demand will reach \(w_{s} \). From there on the water consumption decreases with increasing price ever further exhibiting an optimal survival strategy (expansion path \(S-O2-O3\)). The demand curve consisting of the two parts is drawn in Fig. 3.7 from left to right. A demand curve of a second household with a higher income is drawn from right to left. This household receives such a high income that he does not get into the critical survival zone.
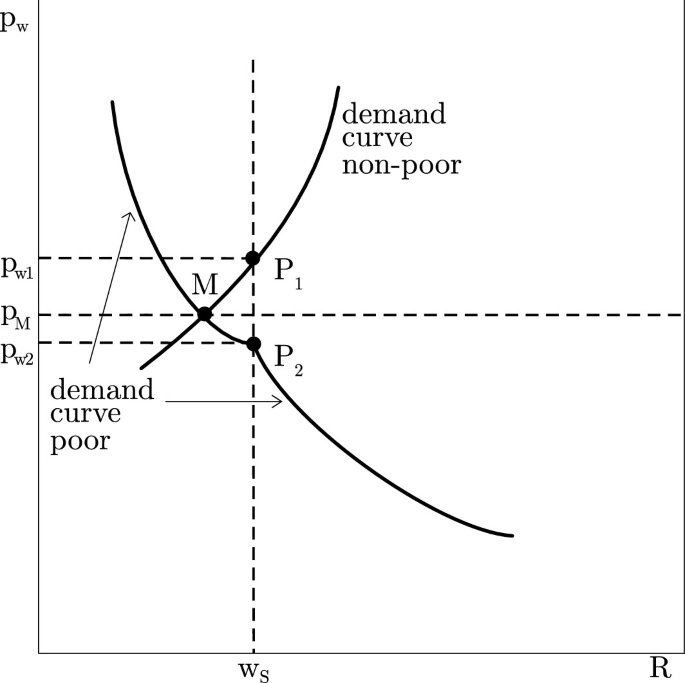
Source own illustration
A water market with extremely poor households.
Supply costs are not included so as to keep the figure clearly laid out. We simply assume that there is a certain amount of water (R) given. Hence, the equilibrium water price \(p_{M}\) equilibrating demand supply (point M) is a scarcity rent. In this equilibrium point, demand and supply are equal. The water available is allocated to both households according to their marginal willingness to pay (demand curves). However, the equilibrium does not result in a social optimum.Footnote 26 Obviously, the poor household operates in the survival zone and, hence, the Sustainable Development Goals are not satisfied. The market mechanism transfers too much burden to the poor due to the scarcity of water.
There are various options to secure the lifeline of the poor. One option is to introduce price discrimination. In Fig. 3.7, the high-income water demand is charged with a higher price, \(p_{w1}\), and the poor households pay a lower price, \(p_{w2}\). This type of price discrimination can be achieved, for example, by an increasing block tariff structure which will be presented and analyzed in depth in Chap. 4. Theoretically, another option is to subsidize the poor directly. In this case, price discrimination can be abandoned and a unique market price can prevail since poor households receive a lump sum transfer that lifts their income such that they can afford the subsistence point S.
3.6 Water Recycling
3.6.1 Nomenclature of Water Recycling
Water scarcity, major driver for water reuse, has been called the challenge of the twenty-first century (Miller 2006). Before we look more closely on the different types of water reuse, let us define the terminology:
-
Wastewater reclamation is the treatment of wastewater to secure its reuse.
-
Water reuse is the use of that treated water for beneficial purposes like irrigation in agriculture or flushing of toilets in households.
-
Water recycling is water reuse where the treated water flows back into the same unit that has released the wastewater. The reused water can be utilized for the same purpose or for a purpose requiring a lower quality of water input. The former means, e.g., the reuse of treated water for drinking water (see Box 3.4) the latter refers for instance to the use of gray water for flushing toilets in households.
-
Gray water is wastewater from household activities, like laundry washing or bathing.
-
In contrast, black water is water from flushing toilets or from kitchen sinks with a high load of pathogens and organic content.
-
Direct reuse implies that treated water is carried through pipes to its following purpose, whereas indirect reuse joins nature up in-between.
-
Treated water is returned into the surface or groundwater from where it is withdrawn again.
-
From a technical and economic viewpoint, a distinction between centralized and decentralized water reclamation is crucial. The former refers to reuse devices on the household or firm level, whereas the latter refers to infrastructural networks connecting the various users.
Figure 3.8 depicts the various flows of wastewater release, reclamation modes and reuse for the residential and industrial sector. It shows that water reuse is also part of the water cycle.

Source own illustration
Water reuse.
Box 3.4 Water recycling in Singapore
Singapore is a highly urbanized city-state. The city is characterized by a very high population density. Hence, the water demand for this state can only be met by an area several times its size, if only conventional water resources are used. For becoming more independent from water imports from Malaysia, Singapore enforces the development of innovative water technologies, e.g., desalination, but also recycling of water. Reclaimed water is an important water source in Singapore which can be produced in an innovative way. Here, the wastewater is treated using membrane filtration and reverse osmosis. The generated freshwater, after all purification steps, meets the standards of potable water. This procedure of water supply management became known under the brand name NEWater. The predominant share of the reclaimed water is used in the industry sector mainly for non-potable applications. But about 1 percent of Singapore’s potable water requirement is covered with reclaimed water from the NEWater project, too.
Source: Tortajada (2012)
IWRM requires to consider all available options for water recycling. The various modes of reuse must be evaluated with respect to environmental repercussions and with respect to economic criteria. Water recycling is indeed one measure to enhance the efficiency of water use. On the other side, water reuse can also lead to environmental damages. For instance, the recycling of irrigation water into irrigation systems might lead to the salinization of the soil, thereby decreasing its fertility drastically. We will get to these kinds of quality problems in Sect. 3.10. The scheme in Fig. 3.8 depicts water reuse options in a rough manner. The civil engineering literature (such as Asano 1998) enlists a variety of reuse categories:
-
Agricultural irrigation is the largest use of reclaimed water in arid and semiarid regions. For instance, Israel currently reuses more than 65 percent of sewage water for irrigation (Friedler 2001).
-
Landscape irrigation plays an important role in industrialized countries. It refers to the irrigation of parks and other areas of recreational purposes.
-
Groundwater recharge belongs to the indirect mode of recycling. This kind of reuse is of high importance not only to increase the water supply but also to stabilize aquifers specifically to avoid the intrusion of salt water.
-
Non-potable urban reuses refer to water for fire protection, air conditioning and toilet flushing (decentralized reuse).
-
Last but not least wastewater can be purified such that it has a quality level of potable water. This is literally water recycling. Often this kind of reuse is connected with the strong resistance of people. Singapore is one exception where wastewater is purified and recharged into the freshwater distribution system (see Box 3.4).
3.6.2 Optimal Recycling
Water reuse, to whatever purpose, is part of IWRM. In its simplest form, water reuse follows from an optimal allocation procedure which takes into account return flows. Figure 3.9 shows a simple scenario for two users.
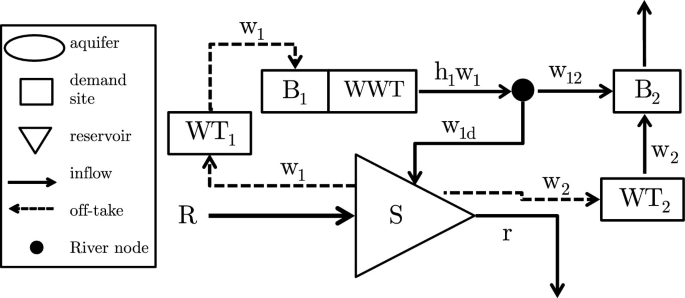
Source own illustration
A simple water recycling model.
User 1 uses water \(w_1\) from a river or lake and returns a portion \(h_1 w_1\). We assume that the quality of the returned water is such that the body of water, e.g., a lake or groundwater, maintains its environmental quality. The costs of necessary purification treatments (WWT) are included in the benefit function of user 1. Water \(w_{1}\) used by user 1 needs treatment (WT1) that is associated with costs, which are assumed to be c per unit. User 2 is located at the same water reservoir. She uses return flows from user 1, which is denoted by \(w_{12}\), and diverts \(w_{2}\) from the reservoir if she needs more than \(h_{1}w_{1}\). Notice that water withdrawn by user 2, \(w_{2}\), also have to be treated at costs c per unit of water. If user 2 does not use the whole amount of return flow from user 1 the residual, \(w_{1d}\), flows back into the water reservoir. To keep the model as simple as possible, we assume that user 2 returns no water. The respective dynamic balance for the water stock is
Substituting the definition of the residual flow
into Eq. (3.38) yields
The model allows for both direct and indirect reuse. Exclusive indirect reuse is present if \(w_{12}=0\) is true, which implies that all return flows flow back into the reservoir, i.e., \(w_{1d}=h_{1}w_{1}\). If treatment costs occur, indirect reuse will of course be minimized because direct use avoids the additional treatment costs that accrue to \(w_2\).
In the following, we derive the optimal allocation within our hydro-economic model. To concentrate on the allocational effects of the return flow, we disregard all the issues raised in the previous sections, i.e., fairness considerations or issues of poverty. We confine ourselves to the simple task of maximizing the aggregate benefit of both users. Let us assume that user 2 is relatively big compared to user 1, i.e., \(B^{'}_{1}(w) < B^{'}_{2}(w)\). The optimization program is
subject to Eqs. (3.39) and (3.40). To keep the analysis simple, we disregard fixed costs by assuming that these costs are covered by access fees.Footnote 27 Also we assume that water is not scarceFootnote 28 which allows us to skip Eq. (3.40).
The KKT conditions are as follows:
where \(\lambda \) is the Lagrangian to the constraint, which is given by Eq. (3.39). These conditions apply under the assumption that \(w_{1} > 0\) (else there would be no recycling in this model). Therefore, Eq. (3.42) applies with strict equality.
Figure 3.10 depicts the solutions for two cases. The first case (case I) refers to high water treatment costs, the second to relatively low costs (case II). The figure is drawn under the assumptions that the marginal benefits of both users are declining linearily with respect to water use, i.e., “\(B_{i}^{'}(w) = a_{i}-b_{i} w\), and that user 1 is “small” in comparison to user 2, i.e., \(B_{1}^{'}(w)< B_{2}^{'}(w), \forall w \ge 0\).
Before we take a closer look at these cases, let us first note that the waste of water, i.e., \(w_{1d} > 0 \), cannot be the result of the optimization program. It cannot be optimal to return a portion of clarified water \(h_{1} w_{1}\) into the reservoir and withdraw it later with additional treatment costs.Footnote 29

Source own illustration
Optimal water recycling.
3.6.2.1 Case I
Here we assume that the processing costs are very high. In order to make the importance of water recycling particularly visible, we also assume that without a technical infrastructure for water reuse, i.e., if the used water of user 1 cannot be transferred to user 2, none of the two users would take water from the reservoir. This case is depicted in the figure by the fact that the marginal cost line lies above both marginal benefits (\(c^{I} > a_{i}, i=1,2 \)).
In case I, it follows from the optimality conditions that the optimal allocation is characterized by the following compact rule (rule I)Footnote 30:
The weighted aggregated marginal benefits should be equated to the marginal treatment costs (see point I in Fig. 3.10). This equation is nothing else as the allocation rule for a public good. The water use of user 1, \(w_{1}\), exhibits the characteristics of a public good which serves twice as an input, the first time for user 1 and then the second time for user 2 diminished by factor \(h_{1}\). Point I in Fig. 3.10 is identified by equating the aggregated marginal benefits of both users of \(w_{1}\) to marginal treatment costs.
3.6.2.2 Case II
If treatment costs are very low case II, which is represented by the two points II in Fig. 3.10, applies. The corresponding optimal allocation rule is (rule II):
User 1 diverts \(w_1\). She equates her marginal benefit to marginal treatment costs related to the effective water use per liter, i.e., \((1-h_{1})\) (see the left one of the two points II in Fig. 3.10). User 2 is allocated the return flow of \(h_1 w_1\) and supplements her water consumption such that \(B'_{2}(h_{1} w_{1} + w_{2}) = c^{II}\). Therefore, total water use of user 2 is \(h_{1}w_{1} + w_{2}\) (see the right one of the two points II in Fig. 3.10). This rule is very well known from hydro-economic models that include return flows. Notice that this rule only applies if marginal water treatment costs are relatively low. Otherwise (case 1), we have to apply the rule for water as a public input (rule I).
Both rules are cost dependent special cases of the optimality conditions as derived in Eqs. (3.42)–(3.45), which are the result of a hydro-economic model optimizing aggregate benefits of both users.
3.6.3 Markets for Recycled Water
Let us take case II (low treatment costs) and assume that the institutional implementation of rule II should be accomplished by introducing a water market system, as depicted in Fig. 3.11.Footnote 31 Each user buys freshwater from the water treatment plants for a uniform price, \(p_{1}\). In addition, there is a market for recycled water, in which user 1 offers treated water whereas user 2 is on the demand side. The price in water market 2 is such that supply is equal to demand.
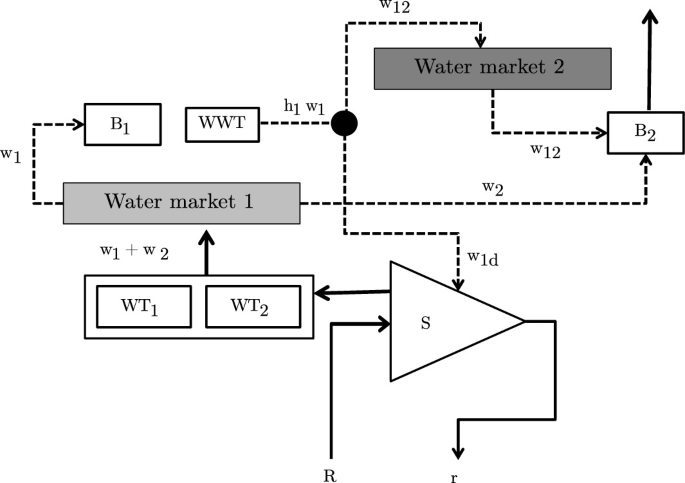
Source own illustration
Water recycling in two water markets.
Let us assume that both markets operate under perfect competition or, alternatively, that a regulation authority sets prices close to a competitive market. Thus, both water treatment plants will offer water for a price equal to the marginal treatment costs, i.e., \(p_{1}=c^{II}\).
User 1 buys water in market 1 and, at the same time, offers treated water in market 2 by solving the following optimization:
Assuming that user 1 buys and sells water the KKT conditions are
Merging both KKT equations yields
User 2 has the option to buy water in both markets, hence the corresponding optimization program is
We have assumed that \(p_{1}=c^{II}\) is so low that user 2 buys water in both markets (\(w_{2}>0 \,\text{ and }\, w_{12}>0\)). Then the optimal water demand in both markets follows the rule:
If prices were to differ, the user would only operate in one of the two markets. Thus, in this scenario both prices are equal.
Both market participants set their marginal benefits equal to the respective prices. In turn \(p_{1}\) is equal to marginal costs. If we put together this information by substituting prices in Eq. (3.51) by Eq. (3.53) and bear in mind that \(h_{1} w_{1} = w_{12} \) we get
which is simply the optimality rule for case II (cf. Eq. (3.47)). The implementation of two water markets is able to replicate the optimal allocation derived in the framework of a central planning approach.
With the same approach, we can show that the system of two markets would also secure optimality in case I.Footnote 32 This is interesting because user 2 should only buy recycled water in market 2 and it is interesting because the sequential use of water makes water almost a public good.Footnote 33 It is a standard result from microeconomic textbooks or introductions to public economics that the private provision of public goods leads to a misallocation. Why not here? Users consume water one after the other and two markets are implemented (instead of only one market). The treatment plant sells water only to user 1 and user 1 sells to user 2. If then only the treatment plant sells water in market 1 to both users then both users could not afford the water in case I since \(B_{i}^{'}(w_{i}) < c^{I}\) (see Fig. 3.10). This market result is not optimal. The reason is that we have one market missing. Inserting the second market allows to implement the optimal allocation for public goods. This is due to the hydro-technological situation implicitly endowing user 1 with property rights. He can sell the water used and treated or let it return to the reservoir S. But he will sell the water after usage to user 2. There will be a positive price less than marginal costs \(c^{I}\) that user 2 will accept.
Box 3.5 Ecological Sanitation
Ecological Sanitation (EcoSan) is a concept standing for a potential change in the paradigm of wastewater disposal. Wastewater has been regarded only as a problem for a long time, because it involves hygienic hazards and contains organic matter and eutrophying substances in the form of nitrogen and phosphorus. These substances cause problems in seas, lakes, and streams. Due to inadequate sanitation, wastewater causes serious water-related issues in many parts of the world (e.g., Sub-Saharan Africa), as it has in the past on central Europe (e.g., cholera epidemic in Hamburg in 1892 with 8,600 deaths). However, in the framework of EcoSan the wastewater is seen as a reusable substance that contains valuable components, such as nutrients (nitrogen, phosphorous), sulfur, potassium, magnesium, and many trace elements essential for fertile soils.
The main idea of the EcoSan concept is to close the nutrient loop between sanitation and related sectors (e.g., agriculture) and hence it is quite more than simply gray water reuse or rainwater use. Closing the loop enables the recovery of organics, macro and micronutrients, water, and energy contained in wastewater and organic waste and their subsequent productive reuse mainly in agriculture, or for other reuse options. The main advantages are as follows (Werner et al. 2009):
-
Promotion of recycling by safe, hygienic recovery, and use of nutrients, organics, water, and energy.
-
Conservation of resources (lower water consumption, chemical fertilizer substitution).
-
Preference for modular, decentralized partial-flow systems for more appropriate cost-efficient solutions.
-
Possibility to integrate on-plot systems into houses, increasing user comfort, and security for women and girls.
-
Contribution to the preservation of soil fertility.
-
Promotion of a holistic, interdisciplinary approach (hygiene, water supply and sanitation, resource conservation, environmental protection, urban planning, agriculture, irrigation, food security, small-business promotion).
This concept was applied in a number of pilot projects, for instance, in Lübeck-Flintenbreite, Germany, for 350 inhabitants. The installed system comprises a strict separation of blackwater (wastewater from the toilet), gray water and stormwater. Blackwater together with organic waste should be treated anaerobically (producing biogas for energy and heat production) (Langergraber and Muellegger 2005). Other exemplary early EcoSan pilot projects were implemented by the “Svanholm Community” in Denmark, the Ecological Village Björnsbyn in Sweden, Ås in Norway or the Solar-City Linz-Pichling in Austria (Fröhlich et al. 2003). In 2020, the start-up Finizio is planning to install a test equipment in the (German) city of Eberswalde (https://finizio.de/produkte/).
3.7 Water Allocation Along Rivers
3.7.1 Basic Model
A simple example of a river with two users is given in Fig. 3.12. The upstream user 1 and the downstream user 2 compete for the water resources and are able to generate net benefits, designated by \(B_1(w_1)\) and \(B_2(w_2)\), depending on the diverted water amounts, \(w_1\) and \(w_2\). Furthermore, the river is fed by two inflows from headwater areas, that are located upstream of the tapping points of user 1 and user 2, respectively. These inflowing water quantities are denoted by \(R_1\) for user 1 and by \(R_2\) for user 2. The amount of water that leaves the addressed river system, i.e., the outflow, is represented by variable r.
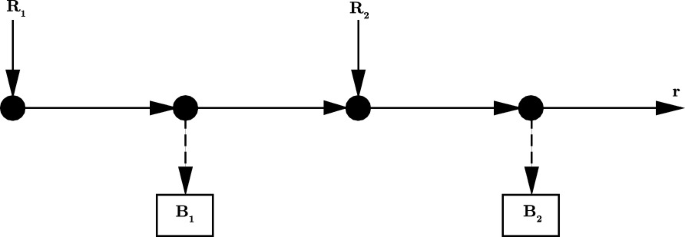
Source own illustration
Scheme of a simple river example with 2 consumers.
3.7.2 Two Cases of Upstream Behavior with Scarcity
Based on the IWRM approach, the objective to maximize net benefits in the total river basin is formulated as presented in Eq. (3.55).
Any consumer can divert at most those quantities of water that are available at the respective tapping point, thus the constraints are given by Eqs. (3.56) and (3.57)
Of course, if a minimum outflow quantity (\(r_0\)) of the addressed river system should be guaranteed, it is important to consider the additional constraints in Eq. (3.58), which ensures that the realized outflow r is equal or higher the obligatory minimum outflow \(r_0\). The realized outflow is the water amount which is left in the river by both users. Therefore, it results from the difference between the headwater inflows and the abstraction amounts which means that \(r=R_1 + R_2 - w_1 - w_2\). Therefore, we are able to formulate following condition for addressing the minimum outflow quantity:
Based on the model formulated here, which corresponds to a maximization problem with the objective stated in Eq. (3.55) subject to the constraints defined in Eqs. (3.56) to (3.58), the KKT conditions can be derived:
It is likely that water will be diverted from the river as much as possible by the users, so that all available resources in the river are abstracted completely. This means that the outflow of the addressed river system, r, must not exceed the required outflow level, \(r_0\), which implies \(r=r_0\). Furthermore, the usable amount of water, given by \(R_1 + R_2 - r_0\), has to be diverted entirely, thus the equality \(R_1 + R_2 - r_0 = w_1 + w_2\) holds. Based on these relations, it follows from the KKT conditions, that
-
if there exists a minimum outflow quantity (\(r_0>0\)), the Eq. (3.63) is binding which means that \(\lambda _r \ge 0\). However, Eq. (3.62) is certainly nonbinding and hence \(\lambda _2=0\).
-
if there exists no minimum outflow quantity (\(r_0=0\)), it would not make sense to set up the constraint (3.58) which implies that \(\lambda _r\) would not exist. This has to be noticed when we set up the KKT conditions.Footnote 34 Equation (3.62) is binding which means that \(\lambda _2 \ge 0\).
To conclude: if \(r_0>0\) it follows that \(\lambda _r \ge 0\) and \(\lambda _2=0\), while if \(r_0=0\) it follows that \(\lambda _r\) does not exist and \(\lambda _2 \ge 0\).
By addressing Eq. (3.60) it follows that
Therefore the formulated conditions reduce to Eqs. (3.65) and (3.66).Footnote 35
Based on the formulas displayed in Eqs. (3.65) and (3.66), it is possible to define optimality conditions for two different cases:
-
Case 1: The upstream user diverts the whole amount of water available at his/her tapping point, i.e., \(R_1 = w_1\), and hence \(\lambda _1 \ge 0\) and \(B_1'(w_1) \ge B_2'(w_2)\).
-
Case 2: The upstream user does not divert the whole amount of water available at his/her tapping point, but passes a limited amount to his/her adjacent downstream user, i.e., \(R_1 > w_1\) and therefore \(\lambda _1 = 0\) and \(B_1'(w_1) = B_2'(w_2)\).
The optimal case depends mainly on the headwater inflows further upstream of the the tapping points of the consumers. Figure 3.13 displays two scenarios, I and II, whereas both are subject to the same outflow requirements, such that \(r_0=r_0^{I}=r_0^{II}\), and they are restricted to the same amounts of useable water, i.e., \(R_1+R_2-r_0=R_1^{I}+R_2^{I}-r_0^{I}=R_1^{II}+R_2^{II}-r_0^{II}\). The amounts of useable water are represented by the lengths of the horizontal axes of both plots in Fig. 3.13. The diversions of water by both users are illustrated by the arrows segmenting the horizontal axes, respectively. The diversion of the upstream user \(w_1\) is illustrated from the left point of origin of the diagram to the right, while in contrast the diversion of the downstream user \(w_2\) is pictured from the right point of origin to the left.
Scenario I is characterized by the fact that the natural inflow before the upstream user 1 is low and the natural inflow before the downstream user 2 is high. This scenario is visualized in panel (a) of Fig. 3.13, where the inflow to user 1, \(R_1^I\), is located to the left of the intersection between the marginal benefit functions \(B_1'(w_1)\) and \(B_2'(w_2)\). Compared to scenario I, the opposite situation is defined in scenario II (see panel b) in Fig. 3.13.Footnote 36 The headwater inflow before the upstream user, \(R_1^{II}\), is located to the right of the intersection point between the marginal benefit functions \(B_1'(w_1)\) and \(B_2'(w_2)\) in the plot.

Source own illustration
Allocation of water in a river source under scarce conditions.
If the upstream user passed a limited amount of its inflows to the downstream user in scenario I, the situation would correspond to case 2 where \(w_1^{I} < R_1^{I}\). The water allocation of the downstream user depends on the one of the upstream user and is subject to \(w_2^{I} = R_1^{I}+R_2^{I}-w_1^{I}-r_0^{I}\). Based on the optimality condition for that case, marginal benefits of both users should be equal, i.e., \(B_1'(w_1^{I}) =B_2'(w_2^{I})\). This optimality condition cannot be fulfilled, because within the whole possible domain of \(w_1^{I} \in \left[ 0; R_1^{I} \right] \) the marginal benefit of the upstream user always exceeds the one of the downstream user, such that \(B_1'(w_1^{I}) > B_2'(w_2^{I}) = B_2'(R_1^{I}+R_2^{I}-w_1^{I}-r_0^{I})\).
Hence for scenario I, optimality can only be assured by case 1 in which the upstream user fully diverts the available water at his/her tapping point, therefore the optimal amount of water diverted by the upstream user is equal to the inflow to the upstream player, \(w_1^{I^*}=R_1^{I}\). In that case, the downstream user does not receive any water inflows from the upstream user. It follows that user 2 can divert the difference between the downstream headwater inflows and the necessary outflows, thus the downstream user’s optimal amount of diverted water is defined by \(w_2^{I^*} = R_2^{I}-r_0^{I}\). The required optimality condition of case 1 is fulfilled, because the marginal benefit of user 1 exceeds the one of user 2 for this allocation regime, i.e., \(B_1'(R_1^{I}) > B_2'(w_2^{I^*}) = B_2'(R_2^{I}-r_0^{I})\).
For scenario I, the inefficiency of case 2 compared to case 1 is also depicted on the left-hand side of Fig. 3.13. Any consumption level of user 1 that is below the level of available water, i.e. \(w_1^{I}=w_1^{I,f}<R_1^{I}\), would result in a higher consumption of the downstream user 2 relative to the optimal case. The corresponding welfare gains for user 2 are depicted by area B, while the corresponding welfare losses for user 1 are represented by the areas A and B. Hence, a deviation from the optimal water allocation would result in a loss of social welfare equal to area A.
In scenario II (relative high upstream inflows \(R_1\)), however, if the upstream user 1 diverts its total upstream headwater inflows (case 1), \(w_1^{II}=R_1^{II}\), the resulting marginal benefit of the upstream user 1 falls below the one of the downstream user 2, i.e. \(B_1'(R_1^{II}) < B_2'(w_2^{II}) = B_2'(R_2^{II}-r_0^{II})\), which is illustrated on the right-hand side of Fig. 3.13. This is a violation of the optimality condition, case 1 is, therefore, the nonoptimal case, while the optimal allocation can only be implemented in case 2. To realize an optimal allocation in the river basin, the quantity of water diverted by the upstream user 1, \(w_1^{II}=w_1^{II^*}\), ensures that the marginal benefits of the upstream and downstream user are equal, such that \(B_1'(w_1^{II*}) = B_2'(w_2^{II*}) = B_2'(R_1^{II}+R_2^{II}-w_1^{II*}-r_0^{II})\) holds. The optimal water diversion by the upstream user, \(w_1^{II*}\), is identical to the one implied by the intersection point between the two marginal benefit functions \(B_1'(w_1)\) and \(B_2'(w_2)\) in panel (b) of Fig. 3.13, and the resulting optimal diversion by the downstream user 2 is characterized by \(w_2^{II*} = R_1^{II}+R_2^{II}-w_1^{II*}-r_0^{II}\). If the upstream user diverts smaller amounts than optimal, where \(w_1^{II} = w_1^{II,f} < w_1^{II*}\), the downstream user can consume more water than in the optimal case, thus \(w_2^{II,f} = R_1^{II}+R_2^{II}-w_1^{II,f}-r_0^{II} > w_2^{II*}\).
The corresponding welfare effects are depicted on the right-hand panel in Fig. 3.13, while the welfare gains of downstream user 2, represented by area D, are much smaller than the welfare losses upstream user 1 incurs, displayed by the areas C and D. Hence there is a loss of social welfare equal to area C, if real upstream diversion falls below the optimal upstream extraction.
Similarly, if the upstream user 1 diverts more quantities than optimal, i.e. \(w_1^{II^*} < w_1^{II} = w_1^{II,m} \le R_1^{II}\), less amounts of water are available for the downstream user 2 compared to the optimal allocation regime, thus \(w_2^{II,m} = R_1^{II}+R_2^{II}-w_1^{II,m}-r_0^{II} < w_2^{II^*}\). The corresponding welfare losses for the downstream user 2 cover the areas E and F and thus outweight the corresponding welfare gains for the upstream user 1, which cover the area F. This results in a loss of social welfare equal to area E due to that kind of deviation from the optimal allocation regime.
3.7.3 Two Cases Without Scarcity in One Region
In the former analysis, water was assumed to be a scarce resource in a river basin and the useable amounts were completely diverted by the users. With respect to the allocation of the water resources, a trade-off exists between the users. The more water one user diverts, the less the other user is able to consume. This trade-off concerning the water resource is not relevant for the downstream user whose water supply is non-scarce/abundant, but if the useable amounts must not be entirely allocated among the users, the inequality \(R_1+R_2-r_0 \ge w_1+w_2\) will be a relevant constraint to the optimization problem. Therefore, the outflow from the river basin can exceed the minimum outflow requirements, i.e., \(r \ge r_0\). From the KKT conditions, displayed in Eqs. (3.59) to (3.63), it follows that \(B_2'(w_2)=\lambda _2=\lambda _r=0\) holds.Footnote 37 This implies for the optimal case that the downstream user has to consume at his/her saturation level, which corresponds to the null of its marginal benefit function, i.e., \(B_2'(w_2*)=0\). The user 2 chooses its optimal diversion, \(w_2^*\), in such a way that its marginal benefit becomes zero, i.e., \(B_2'(w_2^*)=0\). For user 1, it is possible to derive algebraic characterizations of the optimality conditions from the KKT conditions, which are displayed in Eqs. (3.67) to (3.68).
Similar to the situation with water scarcity, it is possible again to define optimality conditions for two different cases:
-
Case 1: The upstream user diverts the whole amount of water available at his/her tapping point, i.e., \(R_1 = w_1\), and hence \(\lambda _1 \ge 0\) and \(B_1'(w_1) \ge 0\).
-
Case 2: The upstream user does not divert the whole amount of water available at its tapping point, but passes a limited amount to its adjacent downstream user, i.e., \(R_1 > w_1\), and therefore \(\lambda _1 = 0\) and \(B_1'(w_1) = 0\).

Source own illustration
Allocation of water in a river source under non-scarce conditions.
Which of the two cases is suitable to implement optimality depends on the scarcity situation of the upstream user. Illustrative examples with two different scenarios are pictured in Fig. 3.14. In the plot for scenario I, depicted in panel (a) in Fig. 3.14, the intersection between the upstream headwater inflows, \(R_1^I\), and the marginal benefit function of the upstream user, \(B_1'(w_1)\), is characterized by a positive marginal utility for the upstream user. Hence water is scarce for the upstream user in case 1 I. If user 1 passes a limited quantity of water downstream, as in case 2, the possible domain of consumption will be \(w_1^I \in [0, R_1^I]\). The marginal benefit function, \(B_1'(w_1^I)\), does not become zero for any \(w_1^I\) of the defined domain. Hence there is a violation of the optimality condition for case 2 and it follows that case 1 should be the optimal one. In case 1, the upstream headwater inflows are fully consumed, i.e., \(w_1^{I^*}=R_1^{I}\). The optimality condition of case 1 is fulfilled because the marginal benefit of the upstream user is positive for this optimal consumption level, such that \(B_1'(R_1^{I}) \ge 0\).
In contrast to scenario I, water is not scarce for the upstream user 1 in scenario II, as displayed in panel (b) in Fig. 3.14, where the upstream headwater inflow, \(R_1^{II}\), is located to the right of the saturation point characterized by \(B_1'(w_1) = 0\) in the plot. If the upstream user 1 entirely diverted the upstream headwater inflows, as in case 1 with \(w_1^{II}=R_1^{II}\), its marginal benefit would be negative, which would violate the optimality condition of case 1. Limited quantities of upstream headwater inflows should, therefore, be passed downstream, hence \(R_1^{II} > w_1^{II}\) as in case 2, and user 1 diverts the water quantities in such a way that its marginal benefit becomes zero. The optimality condition of this case 2 is guaranteed to be satisfied due to the assumptions made, hence the optimal consumption, \(w_1^{II*}\), is identical to the null of the marginal benefit function, i.e., \(w_1\) such that \(B_1'(w_1^{II^*}) = 0\), which means that the user 1 diverts the amount of water equal to its saturation point.
A loss of consumer surplus for upstream user 1 would result if the upstream user deviated from the optimal amount to be diverted, so that \(w_1^{I,f} < w_1^{I^*}\) as well as \(w_1^{II,f} < w_1^{II^*}\). This loss is represented by the area A in Fig. 3.14. Similarly, a loss of consumer surplus for downstream user 2, illustrated by the areas B and C, will also occur if the diverted amount of user 2 falls below its saturation quantity. Both types of deviations from the optimal allocation generate losses in social welfare.
Box 3.6 The downstream externalities of harvesting rainwater
Rainwater harvesting is a technique for providing water that has been used since ancient times. For example, Roman cities were designed and built such that the inhabitants could collect rainwater for drinking and domestic purposes. But captured rainwater can also be used for irrigation in the agricultural sector or in urban areas to provide water for the non-potable uses like a toilet flushing. One distinct advantage of rainwater harvesting is that it can be shaped in a decentralized manner, e.g., simple roof water collection systems. But also bigger projects are conceivable. In the Global South, land surface catchment systems are implemented in many rural areas. They can be used for irrigation systems or simply as a method to recharge the local groundwater. Since the technique is rather simple, rainwater harvesting investments are an integral part of rural development programs. All in all, it seems to be a highly efficient method to provide people with more water without stressing the water cycle.
From a hydrological perspective, water harvesting is nothing else as reducing the water runoff in a catchment area. But there remains one problem: If the runoff is reduced, water users downstream may suffer from less water. Hence, there exists a downstream externality, which must be included in the calculation of integrated water resource management. The optimal allocation of water to the upstream users has to take into account the opportunity costs that arise from the lower water availability of downstream users. This can easily be inferred from Eqs. (3.56) and (3.57). If precipitation is included in \(R_{i}\), rainwater harvesting from upstream is equivalent to an increase of \(R_{1}\) and a reduction of the same size of \(R_{2} \).
Sources: UNEP International Environmental Technology Centre (2002), Boumaa et al. (2011)
3.8 Groundwater Management
3.8.1 A Simple Groundwater Model
Groundwater is a very important resource for covering water requirements in many regions of the world. In locations with sparse surface water resources due to the absence of lakes and rivers, groundwater is the only available resource. In regions with little water availability, groundwater is often used for agricultural purposes, mainly irrigation. The extraction of groundwater is an open-access problem, especially in those areas where water is quite scarce. This problem may arise due to a lack of institutions, a lack of non-enforceable water rights, a lack of legal allowance, or too high transaction cost for assessing the aquifer regulation. This open-access problem is characterized by
-
Non-excludable access to the aquifer: The access to groundwater resources is unregulated. Hence anyone can potentially extract groundwater from the aquifer.
-
Rivaling for the water resource: Water volumes that are extracted by someone can not be extracted or used by someone else.
There is a risk of overexploiting the groundwater resources because of the unlimited access in this specific institutional setting. This issue is quite relevant in many parts of the world, especially in regions where groundwater is the most important water source and which are characterized by a low water availability rate per capita, dry meteorological conditions like low precipitation rates combined with high potential evaporation, and big water consumers in the basin, e.g., the agricultural sector. The described open-access characteristics set incentives for overexploitation of groundwater resources, which is demonstrated with the help of the following algebraic model.
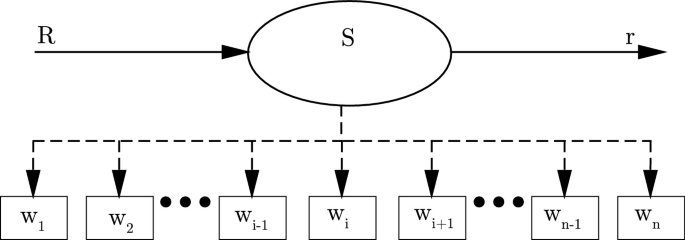
Source own illustration
Scheme of a simple groundwater model.
As depicted in Fig. 3.15, an aquifer with an exhaustible groundwater stock, declared as S, is assumed. This stock is fed by a certain natural inflow, denoted by R. Furthermore there is also a certain amount of water, represented by r, that leaves the groundwater stock due to a natural flow processes. For reasons of simplification, it is assumed that these natural flows are constant over time.
The aquifer is commonly used by n water extractors who may use the water for covering their own demand or sell it to water consumers. For this analysis, it is irrelevant whether an extractor sells or directly uses the water to satisfy their own needs. The amount of groundwater extracted from the aquifer is represented by the variable \(w_i\), where i is an element representing a specific groundwater extractor. The total amount of water extracted from the aquifer within one time period is equivalent to the sum of the amount extracted by each user:
Under the assumption that all extractors exhibit identical properties, the equation above simplifies to
The demand function aggregated for all consumers in the groundwater basin is given by the demand function in Eq. (3.71) with the demand function parameters a, defining the choke price, and b, determining the slope of the demand function.
The extraction process of withdrawing water volumes from the aquifer, \(w_i\), performed by extractor i causes costs described by the following cost function:
Extraction costs are not only influenced by the extracted water volumes, \(w_i\), but also by the size of the groundwater stock in the aquifer, S, because a smaller stock of water is accompanied by a lower groundwater table, hence higher pumping heights are observed resulting in higher monetary expenses for pumping. The scope of the impact that a water stock’s size has on the extraction cost depends on a level parameter, named \(\sigma \), that is defined such that higher levels of \(\sigma \) yield higher extraction cost sensitivities on the water stock S. Furthermore, there exists a cost function parameter, declared as c, that represents the theoretical cost rate if groundwater resources in the aquifer were completely exhausted.
Due to the previously explained similarity between the characteristics of groundwater resources and of open-access goods, it is credible to assume a zero profit condition for water extraction. This assumption seems to be quite plausible: As long as positive profits can still be realized, each (potential) groundwater extractor, who competes with other (potential) extractors for the limited and unregulated groundwater resources, has an incentive to enter the market or to increase its extraction volumes. Due to the increasing extracted water volumes (\(W\ \uparrow \)), the market price for extracted groundwater would decrease (\(p\ \downarrow \)). Hence, the marginal utility for the use of extracted groundwater decreases with increasing extraction amounts. Furthermore an increase in extraction costs can be also observed (\(C\ \uparrow \)), because it becomes more expensive to extract groundwater given a decreasing groundwater table in the aquifer. Consequently, the supplier is affected by falling profits if extraction amounts rise. This process would continue until positive profits are not realizable on the market, hence, under the previously stated assumptions, the price for water equals the average extraction cost (zero profit condition), as displayed in Eqs. (3.73) and (3.74).
Based on the approach explained above, the total water extraction from an aquifer can be determined by Eq. (3.75):
3.8.2 Dynamic Stock Balance for Groundwater
It is possible to set up the dynamic stock balance for the groundwater stock, which arises from the physical paradigm that all water volumes have to be balanced (hydrological cycle). This implies that inflows into the groundwater stock exceeding the water amounts outflowing from the groundwater stock will cause the groundwater table to rise, and vice versa. Consequently, the change in the groundwater stock \(\dot{S}(t)\) is equal to the difference between the in- and outflowing water volumes of the aquifer. Due to this relation, the groundwater stock in the aquifer can change over time and the parameter should be made time-dependent, such that S(t). Therefore, the amount of water extracted can also change over time, as depicted in Eq. (3.75), and should be written as W(t). The inflow into the groundwater stock is only determined by the natural inflow, R, which is, for reasons of simplification, assumed to be constant over time. The outflow from the groundwater stock contains two parts: On the one hand, it is determined by the natural outflow, r, which occurs due to flow processes and is assumed to be constant over time, and on the other hand it is also determined by the aggregated amount of water extraction by humans, W(t). This results in the following dynamic stock balance:
Plugging Eq. (3.75) into Eq. (3.76) yields an algebraic expression of the dynamic stock balance, denoted by \(\dot{S}(t)\).
The steady state is a specific situation in which the flows feeding and leaving the groundwater stock are balanced, i.e., \(W(t)=R-r\), and, therefore, the changes in the groundwater stock amount to zero for all time periods, i.e., \(\dot{S}(t) = 0\), which is also called the steady-state condition. Based on this assumption and Eq. (3.77), the size of the water stock, \(S^*\), which satisfies the steady-state condition, \(\dot{S}(t) = 0\), can be identified (see Eq. (3.78)).
A better understanding of the mechanism can be gained by formally proving the stability of the steady-state situation. If there exist a stable steady state, the groundwater stock, S(t), must converge against the steady-state stock, \(S^*\), in the long run, regardless of its deviation from the steady state, \(S(t) - S^*\).Footnote 38 Hence, Eq. (3.77) is reformulated, which results in Eq. (3.79).
By plugging Eq. (3.78) into Eq. (3.79), it is possible to derive a functional form of the dynamic stock balance, in which the temporal changes of the groundwater stock, \(\dot{S}(t)\), depend on deviations from the steady-state groundwater stock, \(S(t) - S^*\), such that
Based on Eq. (3.80), it can be proven that the steady state is a stable point to which the groundwater stock converges over time, because
-
If the groundwater stock is below the steady-state stock, which means algebraically \(\left[ S(t) - S^* \right] < 0\), the temporal change in the groundwater stock, \(\dot{S}(t) > 0\), is positive, hence the groundwater stock will increase over time.
-
By contrast, if the groundwater stock exceeds the steady-state stock, i.e., \(\left[ S(t) - S^* \right] > 0\), the groundwater stock will decrease over time because the temporal change in groundwater stock, \(\dot{S}(t) < 0\), is negative in this case.
By means of this stability analysis, it is possible to state that the groundwater stock, S(t), converges to the steady-state stock, \(S^*\), and therefore the latter can be described as the long-term groundwater stock. The higher the deviation of the current stock from its steady state, defined as \(\left| \left[ S(t) - S^* \right] \right| \), the higher is the temporal change in the groundwater stock, \(\left| \dot{S}(t) \right| \), which implies a faster convergence in direction of the steady-state stock \(S^*\).
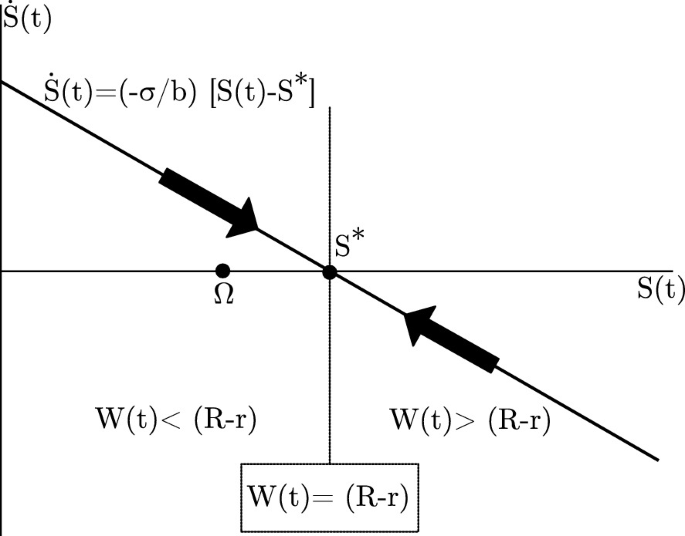
Source own illustration
Phase diagram of the dynamic stock balance.
The phase diagram of the dynamic stock can be found in Fig. 3.16. To calculate the steady-state stock, Eq. (3.78) is used as a starting point.
3.8.3 Hydrological and Ecologic Effects
After having studied the dynamic properties of the model, we would like to study the hydrological and ecologic effects of the open- access groundwater economy. To this end, we introduce a threshold value \(\varOmega \). This threshold value represents the height of the critical groundwater level. This results in two cases:
-
If \( S^{*} \ge \varOmega \quad \Rightarrow \quad b \cdot (R-r) - (a-c) > \sigma \varOmega \), the long-term water stock does not fall below the threshold value. Overexploitation does not occur in the addressed aquifer. The microclimate, the vegetation, and other hydrological functions remain stable. Notice, that this case does not occur due to a common water management oriented toward sustainability goals but simply because pumping costs are high. The water cycle and the environment is protected by the low productivity of the pumping technology.
-
However, if \( S^{*}< \varOmega \quad \Rightarrow \quad b \cdot (R-r) - (a-c) < \sigma \varOmega \), the noncooperative use of water would lead to a regional ecologic disaster. In the long run overdraft will occur and, as a result, detrimental repercussions on regional climate, soil quality, and the local hydrological cycle will set in. These effects may be irreversible in nature. In ecology one speaks of hysteresis. Even if at a later stage common efforts are made to reverse the destruction process, it may be too late, i.e., the original environmental state can no longer be regained.
The model-based analysis conducted in this subsection allows us to draw conclusions about scarcity issues, which can result from overexploitation of an aquifer whose access is not regulated or limited. The overexploitation risk does not hinge on the cost rate parameter, \(\sigma \), that characterizes the impact of the size of the water stock on the cost of extraction, but potential overexploitation relates to a multitude of other parameters. In the simple toy model presented in this subsection, the risk of overexploitation increases with the change of certain parameters as listed in Table 3.4.
3.9 Water Transfer Between Watersheds
3.9.1 Inter-basin Water Transfer Schemes
Infrastructure-based water transfer is a common instrument of water supply side management, which is applied in many regions of the world. The transfer is conducted by means of a water supply network containing pipelines, pump stations, tanks, etc. It is possible to differentiate between intra-basin and inter-basin transfers, or between intra-regional and interregional/international transfers if hydrological or political boundaries are addressed, respectively.Footnote 39 The water obtained by transfers represents an additional source of water supply in the regions importing water. This additional water source is often quite necessary in the region receiving water to close the regional gap between the obtainable amount of water from local sources and the local requirements for water supply. Climate change, which expresses itself through decreasing water availability and increasing risk of drought, and increasing water requirements, resulting from population and economic growth, may further exacerbate water scarcity in some regions of the world. Consequently, water transfers, as a means for mitigating the adverse consequences of water shortage, will presumably gain importance in the future. In some cases, water transfer may be a cheaper source than alternative water supply management measures, e.g., reclaimed water or desalination.
There are many large-scale water transfer schemes around the world, most of them implemented in North America, Asia, and Australia. Important ones are, for example, the California State Water Project, the Colorado River Aqueduct, the San Juan-Charma Project (all in the US), the Lesotho Highland Water Project in Sub-Saharan Africa, the National Water Carrier in Israel, the Telugu Ganga Project in India, the South-North Water Transfer Project in China, or the Goldfield Water Supply Scheme in Australia.
Water transfers affect the local ecology, especially in the water- exporting region, due to interference with the flow regime of the water body. Furthermore, there are also some economic effects that impact water consumers and suppliers in water importing and exporting regions. These economic consequences are explained in this subsection with the help of a simple but illustrative model. Note that inter-basin transfers are often criticized by environmental organizations because they may deliver much less benefits and more harm than anticipated, which is illustrated by the box in this subsection.
Box 3.7 Negative impacts of inter-basin water transfer
Inter-basin water transfers have been criticized by environmental organizations for several reasons. This is because, the development of inter-basin transfers has the potential to disturb the water balance in both the donating and the receiving region. In the past, certain inter-basin transfers have caused a disproportionate amount of damage to freshwater ecosystems in relation to the schemes’ benefits. Negative social as well as economic impacts, especially for the donor basin, can also occur. Inter-basin transfers may not be the most cost-effective way of meeting water demand in the receiving region. Furthermore, inter-basin transfers do not encourage users in the receiving region to use the water more effectively, to recycle wastewater or to develop new local water sources for supply. According to WWF (2007), the following negative impacts can be observed in certain cases of inter-basin water transfers:
-
Demand management in recipient basin is not sufficiently considered in preplanning for inter-basin transfer, leading to ongoing water waste.
-
Inter-basin transfers can become drivers for unsustainable water use in recipient’s basin-irrigation and urban water use, and create strong dependence on inter-basin transfer in the recipient community.
-
The proliferation of boreholes to access groundwater can lead to overexploitation of this resource, too.
-
Inter-basin transfers can become a catalyst for social conflict between donor and recipient basins or with government
-
Inter-basin transfers may not help the situation of the poor affected or displaced by it.
-
Governance arrangements for inter-basin transfers can be rather weak, resulting in budget blow-out or corruption
Source:WWF (2007)
3.9.2 Transfer from Water-Rich to Water-Scarce Regions
Assume a situation with one water-rich region, denoted by region 1, where water is available in abundant quantities, and one water scarce region, named region 2, where water occurs only in small amounts. Moreover, it is assumed that benefit is maximized in both regions.Footnote 40 A graphical depiction of this problem can be found in Fig. 3.17.
In both regions, the local water producers extract a specific amount of water from their regional territory, while these quantities are designated by the variables \(w_1\) and \(w_2\). The extraction of those water volumes is associated with total extraction costs of \(C_1(w_1)\) and \(C_2(w_2)\), respectively. To reduce shortage in the water-scarce region 2, region 1 exports water to the importing region 2, where the amount of transferred water is represented by z.Footnote 41 The transfer causes specific cost of \(\gamma \) monetary units per transferred water volume unit, hence, the total transportation costs are \(\gamma \cdot z\). The consumption level of region 1 and 2 are termed as \(w_1^C\) and \(w_2^C\), respectively. Extracted water volumes in region 1, which are not exported, are consumed in region 1, thus \(w_1^C=\left( w_1-z\right) \), whereas consumption in the water-scarce region 2 equals the amount of water extracted by the local producer and the imported volumes of water, i.e., \(w_2^C=\left( w_2+z\right) \). Hence, the consumption level in each region depends on the extraction in the region and the water transfer, i.e., \(w_1^C(w_1,z)\) and \(w_2^C(w_2,z)\). The corresponding benefits, which arise from water consumption in the regions 1 and 2, are \(B_1(w_1^C(w_1,z))\) and \(B_2(w_2^C(w_2,z))\), respectively. Based on the IWRM approach, the following objective function can be set up for the explained case:
The abstractable amounts in any region \(i \in \left\{ 1,2 \right\} \) are restricted by a regional-specific amount of maximum sustainable water extraction, denoted by \(w_i^{\text {SUS}}\) and defined in Eqs. (3.82) and (3.83), that may be determined according to locally varying ecological conditions, e.g., recharge rates, local precipitation, etc.Footnote 42
The residual KKT conditions are represented by Eqs. (3.84) to (3.88):
If we assume that water scarcity is not present in the water-exporting region, it follows that \(w_1 < w_1^{\text {SUS}}\) and hence \(\lambda _1 = 0\) due to Eq. (3.87). But the producer(s) in region 2 extract the maximum sustainable amount, therefore \(w_2 = w_2^{\text {SUS}}\) and hence \(\lambda _2 \ge 0\) because of Eq. (3.88).
Thus, the marginal benefit from consumption should equal the marginal cost of production in the water exporting region, i.e., \(B_1'(w_1^C) = C_1'(w_1)\), while the marginal benefit of the water importing region exceeds the marginal cost of production by the level of \(\lambda _2\), which is \(B_2'(w_2^C) = C_2'(w_2) + \lambda _2\). This shadow price, \(\lambda _2\), constitutes the additional social welfare in the water-scarce region 2 that would be generated if the maximum extractable quantity of water, \(w_2^{\text {SUS}}\), increased by one measurement unit.
If a water transfer is not feasible and cannot (or is not) realized due to technical, institutional, political, or other reasons, it is trivial to state that \(z=0\) and all the regions act self-sufficiently. In this case of self-sufficiency, the consumed amount is equal to the production level in the region, which means \(w_1^C=w_1\) and \(w_2^C=w_2\). We already know that the production and consumption amounts in region 1, which are depicted by \(w_1^A\) in Fig. 3.17, result from the intersection of the marginal benefit and marginal cost function, i.e., \(B_1'(w_1) = C_1'(w_1)\). However, in region 2, where water is scarce by assumption, consumption quantities are equal to the maximum sustainable extraction level of the region, \(w_2=w_2^{\text {SUS}}\).
If a transfer from the water-rich to the water-scarce region is realized, we assume that \(z \ge 0\). The transfer level z should at least be large enough such that the marginal benefit in the importing region 2 exceeds the marginal benefit in the exporting region 1 by the water transportation cost rate, i.e., \(B_2'(w_2^C) = B_1'(w_1^C) + \gamma \). The optimal regional volumes of water extraction and the optimal transfer are illustrated by \(w_1^*\), \(w_2^{\text {SUS}}\) and \(z^*\) in Fig. 3.17. The optimal consumption levels in the regions 1 and 2 are therefore \(w_1^C= w_1^* - z^*\) and \(w_2^C= w_2^{\text {SUS}} + z^*\), respectively, which are also illustrated in Fig. 3.17. In the following, we term the optimal consumption level in region 1 with \(w_1^* - z^*\) and the optimal consumption level in region 2 with \(w_2^{\text {SUS}} + z^*\).

Source own illustration
Transfer from Water-rich to water-scarce region.
Compared to the result obtained for self-sufficiency, the existence of transfers causes an increase of the water price in region 1 from \(B_1'(w_1^A)\) to \(B_1'(w_1^*-z^*)\), a rise in the quantity of extracted water from \(w_1^A\) to \(w_1^*\), and a decrease in the level of consumed water from \(w_1^A\) to \(w_1^* - z^*\). Hence, the surplus of consumers in that region is reduced by the area DH as a consequence of higher water prices and less water consumption, whereas the producers’ profits rise by the area CDH, as illustrated in Fig. 3.17. The loss of consumer surplus is compensated completely by an increase in producer surplus, and hence the area C outlines the additional social welfare gained in the water exporting region due to the implementation of water transfers.
In reverse to the effects of water transfers occurring in the exporting region, in which consumers lose and producers gain social welfare, in the water importing region water transfers lead to a decrease in water prices from \(B_2'(w_2^{\text {SUS}})\) to \(B_2'(w_2^{\text {SUS}} + z^*)\), and an increase in water consumption from \(w_2^{\text {SUS}}\) to \(w_2^{\text {SUS}}+z^*\) compared to the case of self-sufficiency. Water extraction is not affected by transfer as the maximum sustainable amount is already extracted under self-sufficiency. Consequently, consumers gain due to lower prices and higher consumption levels, and producers lose profits because they face lower prices. The graphical depiction can be found in Fig. 3.17, where the gain of consumer surplus is illustrated by the area LP, and the loss of producer profits is represented by the area L. Therefore, the triangle P represents the overall gain in social welfare due to water transfers in the water importing region. Furthermore, the generated revenues in the water importing regions, represented by area Q, are used to cover the total transportation cost of water, which is \(\gamma \cdot z^*\). The residual revenues from the water transfer, illustrated by areas RST, are used to cover the production cost of transferred water, i.e., areas ABF, to compensate the loss of producer profits from selling water to the consumers in region 1 in the self-sufficient case, which is area E, and to generate additional profits from selling exported water at increased prices, i.e., \(B_1'(w_1^*-z^*) - B_1'(w_1^A)\), which are areas CD. A summarizing overview of the impacts that an implementation of a water transfer scheme has on social welfare in both regions is given in Table 3.5.
3.9.3 Transfer Between Two Water-Scarce Regions
In contrast, if a situation was assumed where water resources are also quite limited in the water exporting region the water extraction may equal the sustainable water extraction rate, \(w_1 = w_1^{\text {SUS}}\). Additionally, because of the scarcity in the water importing region, the extraction rate in this region is equal to the sustainable extraction, \(w_2 = w_2^{\text {SUS}}\), which is equal to the former explained case. Compared to the previously explained scenario, the only alteration is the fact that the extraction amount in region 1 is restricted by the available water, i.e,. \(w_1=w_1^{\text {SUS}}\). Therefore, Eq. (3.87) is binding, this results in the fact that we assume \(\lambda _1 \ge 0\). Because of Eq. (3.84), the marginal benefit of consumption exceeds the marginal cost of water extraction in the water exporting region 1, i.e., \(B_1'(w_1^C) = C_1'(w_1) + \lambda _1\). The value of the shadow price \(\lambda _1\) shows the increase in benefits if sustainable extraction \(w_1^{SUS}\) was to theoretically be increased by one unit. All the previously described relations, \(B_2'(w_2^C) = C_2'(w_2) + \lambda _2\) as well as \(B_2'(w_2^C) = B_1'(w_1^C) + \gamma \), are still valid for this addressed scenario. Due to the assumption that the amount extracted in the region is known, \(w_1=w_1^{\text {SUS}} > 0\) and \(w_2=w_2^{\text {SUS}} > 0\), the values of the variables \(\lambda _1\) and \(\lambda _2\) can be calculated with Eqs. (3.84) and (3.85), respectively. Finally, the value of the optimal transfer \(z^*\) can be found from Eq. (3.86). Therefore, the consumption level in region 1 and 2 is \(w_1^C= w_1^{\text {SUS}} - z^*\) and \(w_2^C= w_2^{\text {SUS}} + z^*\), respectively. The scenario, in which water is scarce in both regions, is illustrated in Fig. 3.18.

Source own illustration
Water transfer between water-scarce regions.
It becomes obvious that producer surplus, consumer surplus, costs, welfare gains, etc. (for self-sufficiency and in the transfer case) are represented by the same areas as under the former scenario, where water was a non-scarce resource in the exporting region. Hence, distributional effects are similar for both explained scenarios in this section and are summarized in Table 3.5.
3.10 Water Quality Management
3.10.1 Water Pollution: An Unresolved Issue
Even in Europe, with its highly developed infrastructure, water pollution does prevail to a reckoned extent. The Synthesis Report 2015 of the European Environmental Agency adds the water quality issue to the list of environmental problems not yet abolished:
Much cleaner than 25 years ago, many water bodies are still affected by pollutants and/or altered habitats. In 2009, only 43% showed a good/high ecological status; the 10 points expected increase for 2015 (53%) constitutes only a modest improvement in aquatic ecosystem health.Footnote 43
Good water quality refers not only to drinking water but also to water as a medium for recreational purposes, like fishing or swimming, and as a habitat for a healthy ecological system. There are many different sources of pollution affecting the water body negatively, be it surface water or groundwater. The main polluters are the industry, with its chemical pollutants and hazardous substances, the agricultural sector, with its runoff of nutrients (carbon, nitrogen, phosphorus), the urban sector, with households discharging mainly nutrients and fecal substances, as well as the medical sector releasing pharmaceutical residues. All these substances pollute the water through various chemical and biological chains and, as a result, deteriorate the human livelihood.
The European Parliament has enacted various directives with the purpose of protecting water. Article 4 (b) of the Water Framework Directive states
Member States ensure, for surface water, the highest ecological and chemical status possible.
This goal shall be implemented with a regulation framework, which is established in Article 8, according to which
Member States shall ensure the establishment of programs for the monitoring of water status in order to establish a coherent and comprehensive overview of water status within each river basin district.
Achieving an effective water regulation is a complex task. While the regulation of piped drinking water and of cleared water from waste water treatment plants is manageable, other sources of water contamination are more difficult to regulate. Specifically, agricultural non-point pollution is difficult to monitor almost by definition. The sole introduction of water quality standards is not sufficient to secure the water bodies, and therefore indirect methods of regulation must be applied. For instance, regulation and monitoring of the use of various types of fertilizers and herbicides has to be established.
Of course pursuance of these goals and the implementation of proper regulation instruments entail costs. The European Water Framework Directive is rather explicit with regard to these costs (Article 9):
Member States shall take account of the principle of recovery of the costs of water services, including environmental and resource costs.
Box 3.8 Important parameters for identifying water quality
There exist various biological and chemical parameters to evaluate the quality of water and wastewater. For instance, the biological oxygen demand (\(\text {BOD}_5\)) or the chemical oxygen demand (COD) are important sum parameters corresponding to the concentration of organic substances in a certain water sample.
Total organic carbon (TOC), dissolved organic carbon (DOC), and particulate organic carbon (POC) are further parameters for organic bound carbon, which contains all organic substances. Nitrogen compounds are also important parameters for the evaluation of water quality. Industrial and domestic wastewater is characterized by high concentrations of reduced nitrogen (ammonium and ammonia, being NH\(_4\), and NH\(_3\), respectively). This form of nitrogen demands oxygen and is toxic to many aquatic and nonaquatic living organisms. The oxidation of reduced form nitrogen (ammonium and ammonia) is termed nitrification which is an autonomous biochemical process and also a treatment step in wastewater purification plants, where these reduced nitrogen compounds are oxidized to nitrite (NO\(_2\)) firstly and afterward to nitrate (NO\(_3\)). Nitrite is usually an intermediate in the nitrification process, however, it is a quite toxic substance. Nitrate is unwanted in potable water and it is also a nutrient in water bodies that causes the growth of algae, which is called eutrophication. This eutrophication can lead to the death of the aquatic livings in water bodies, hence if the concentration of nitrogen is sufficiently high it can be seen as a chronic toxic substance. Nitrate is usually emitted into water bodies by the agricultural sector because of fertilization (Sundermann et al. 2020). Nitrate can be degenerated into molecular nitrogen (N\(_2\)) during the denitrification process. Because of the harmful impact of nitrogen to water bodies, the denitrification process step should also be part of treatment in an adequate wastewater purification. Another nitrogen related sum parameter is the Kjeldahl-nitrogen which states the amount of nitrogen bound in organic substances plus ammonium. Like nitrogen, phosphorus is a nutrient that is usually the limiting factor for the growth of algae (eutrophication) in water bodies. In water, phosphorus occurs as ortho-phosphorus (salt of phosphoric acid) or as component in a nucleic acid (DNA, RNA).
A very essential physical–chemical parameter for evaluating the quality of water is the pH-value which impacts, for instance, the equilibrium of acids and bases and other chemical reactions in the water. The sensitivity of change of the pH-value, due to the addition of acids or bases, is represented by buffer capacities which are also water quality parameters.
The water hardness is a further chemical parameter which is quite important for many technical purposes and states the amount of dissolved calcium (Ca\(^{2+}\)) and magnesium (Mg\(^{2+}\)) ions in the water. Hardness of water has to be increased or decreased by specific technical processes, if the water is too soft or hard for the specific purpose, respectively.
Oxygen that is dissolved in water is the most important oxidizer for chemical processes in the water resource and impacts the kinds and composition of the aquatic livelihood. Further important physical water quality parameters are the turbidity, the electric conductivity, the temperature, the density, the viscosity, and sensory parameters (smell and flavor).
Microbiological parameters are very important indicators for pollution and for identifying the risk of water-related disease from the water source (hygienic reasons). There is a high number of various pathogens, germs, salmonellae, bacteria, etc., that can occur in water. Very important indicators for human-based pollution of freshwater sources are, for instance, the number of Escherichia coli, which is a bowel bacteria, and the number of enterococcus.
Source:Goncharuk (2014)
3.10.2 Water Quality Management
This section addresses the economic aspect of water quality. The water quality standards can be achieved with the help of an ecological-economic management approach. This requires deploying the tools of IWRM introduced in the preceding sections. In the following, we will present a simple water management model that includes some features of water quality regulation.
3.10.2.1 A Model of Water Quality
Figure 3.19 displays the relationship between quantitative water flows and the discharge of pollutants. The disk depicts a water body, be it groundwater or a surface water reservoir. This water body will be recharged by a flow, denoted by R, which is assumed to consist only of clean water. The water body of volume V is of mixed quality as it contains clear water, W, and a pollutant, Q, i.e., \(V=Q+W\). We assume that the reservoir is of equal quality, i.e., that the pollutant is evenly mixed in the water body, which is symbolized by the propeller. The water quality can be inversely defined with the help of the concentration of pollutants, \(\alpha _{Q}\).

Source own illustration
Quantity-quality cycle.
The whole economy living in the modeled watershed is regarded as a single user that utilizes a specific water quantity, where the amount of water used is indicated by w. This water is provided by a water treatment facility that takes the water from the water body in order to clean and disinfect the water and convey it to the users as drinking water. To keep the model simple, we do not capture the quantity balance of this treatment unit, i.e., we do not determine the volume of pollutants removed from the non-treated water. After usage, the water is discharged from the user as wastewater containing a certain amount of pollutants. We assume that all water is returned. The portion of pollutants is \(\hat{e} w \) where \( \hat{e}\) is the concentration of the pollutant in the wastewater. The wastewater is directed into a wastewater facility, where it is treated and purified.
The total volume of clarified water is therefore \((1+e) w \), where \(e, e \le \hat{e} \) is the pollution concentration after wastewater treatment. The residual, amounting to \((\hat{e}-e) w\), is sewage sludge, which will be dumped into a landfill. Finally, Fig. 3.19 indicates other modes of water use, namely, in-stream usage and other ecosystem services that are not explicitly modeled. The water regulation takes place in the form of a quality standard. The concentration of the pollutant shall not exceed a threshold, \(\bar{\alpha }_{Q}\), prescribed by a water authority.
The water quality of the reservoir depends not only on the performance of the waste water treatment (WWT) plant but also on the ability of the water body to self-purify, i.e., to dissolve the pollutants. This purification process is rather complex as it hinges on the water body itself, on local climate conditions and on the environmental surroundings. It is a natural process involving biological and chemical process that are interdependent and very difficult to model due to their nonlinear interconnections.Footnote 44 Here, it is sufficient to maintain the model linear just to get a basic understanding of these interdependencies. However, care must be taken when balancing pollutants and pure water.
The water leaving the WWT can be decomposed into pure water and the amount of pollutant which consists ofFootnote 45 \(e \cdot w \) additional discharge of pollutant and the pollutant already dissolved in the water at the time of abstraction, i.e., \( \alpha _{Q} w\), totaling an amount of \((e + \alpha _{Q}) w\) which is returned into reservoir where the pollutants are partially neutralized. This process can be represented in a resorption function.Footnote 46 We introduce an resorption function
The volume of pollutant in the water reservoir increases by the discharge of pollutants, \(e w + \alpha _{Q} w \), and decays with the rate \(\pi \) due to chemical and biological purification processes. In addition, the portion \(\alpha _{S}\) of the total runoff r, which consists of clean water and pollutants, decreases the stock of pollutants. In this simple model, \(\alpha _{Q} r\) is what hydrologists call advection, i.e., the transported mass of dissolved pollutants that is carried through a water body. Finally, one has to subtract the pollutant removed from the water body when the water of volume w is abstracted. This is the last item on the right side of the middle term \( -\alpha _{Q} w \).
Similarly, we can establish a dynamic relation for pure water
The last two terms cancel each other. The first represents the removal of pure water, the latter the redirection after the purification process of the water used. The volume of clean water increases with recharge, R, and decreases with evapotranspiration. Notice that the pollutant cannot evaporate by assumption. The absorption process decomposes the harmful pollutants to clean water. Thus, the balance equation includes this process with the term \(\pi Q(t)\). Finally, the run off is also carrying away clean water. Since the water body is assumed to be evenly mixed, this runoff can be captured by \((1-\alpha _{Q}) r\).
3.10.2.2 Policy Instruments
The analysis of the effects of various policy instruments to regulate the water quality requires dynamic optimization methods in order to satisfy the dynamic balance equations. These methods allow to derive optimal time paths of the relevant variables of the IWRM approach. Starting from given values of Q and W in the first time period, we can find optimal policy instruments, e.g., effluent charges or technology standards for the WWT plant for each point in time. In the long run, these variables would converge to constant values, which characterize the steady-state solution. For an introductory textbook, it is sufficient to confine the analysis to the steady state. Therefore, we assume that the hydrology of the watershed under consideration is in equilibrium at the outset of the analysis. Thus, setting \(\dot{Q} \) and \(\dot{W}\) equal to zero yields the equations
where the bar on \(\bar{\alpha }_{Q} \) represents the quality standard for the water body imposed by the water authorities (see Eq. (3.89)). The water quality management must assure that the quality standard for the water body is held. This can be achieved by regulating the clarified water \((1+e) w \). From Eq. (3.89), it follows
Inserting Eq. (3.95) into Eq. (3.94) yields
which inserted into Eq. (3.93) gives
The left-hand side is the net pollutant load consisting of the pollutant load \((e+\bar{\alpha }_{Q}) w \) leaving the wastewater treatment facility minus the abstracted load \(\bar{\alpha }_{Q} w \) that must not exceed a limit value \(\varPhi \) so as to secure the quality standard of the water reservoir \(\bar{\alpha }_{Q}\).Footnote 47 The determination of the limit value requires that the hydrological relationships are known. Equation (3.97) gives the water withdrawal constraint for w that guarantees that the quality standard of the water body is met.
3.10.3 Optimal Water Quality
3.10.3.1 Model
The water quality management seeks to meet the given quality standard, \( \bar{\alpha }_{Q}\), in an optimal way. Let us assume that the benefit of using water can be captured by the usual benefit function, B(w), with the usual properties. To keep the model simple, we neglect the water treatment assuming that the water quality of the reservoir is potable. However, waste water treatment has to be taken into account.
The costs for waste water treatment are summarized in the following convex cost function:
Costs increase with the amount of waste water to be treated. On the contrary, if the quality of cleared water released decreases, i.e., e increases, then costs decrease. Having introduced all relevant elements the optimization program can be stated
leading to the optimality conditions
Inserting Eq. (3.101) into Eq. (3.100) yields the equation
which can be utilized together with the constraint \(e w = \varPhi \) to determine the optimal values \(\{w^{*}, e^{*}\}\). Figure 3.20 depicts the optimality condition given in Eq. (3.102).

Source own illustration
Optimal water quality.
The \(NB_{i}\)-curves indicate the \(w-e\)-combination for constant benefit value, where \(NB_{1}< NB_{2} < NB_{3} \) (iso-benefit-lines).Footnote 48 The higher e for constant w, the lower the costs and, hence, the higher are benefits. This monotonicity does not apply for w because the benefit function is concave and the cost function is convex with respect to w. Thus for every e fixed there exists an optimal value \(\hat{w}(e)\) maximizing net benefit. The line \(FOC-w\) shows these values. Graphically, these optimal values are at the point where the iso-net-benefit lines have their minimum (points R, A and B for example).
The black line shows Eq. (3.97), i.e., the water quality constraint. The optimal value \(\{w^{*}, e^{*}\}\) can be found graphically: Increase net benefit as much as possible without violating Eq. (3.97). Obviously, this is point O.
3.10.3.2 Policy Instruments
The program defined by Eq. (3.99) is the reference point for the assessment of various policy options. These options can be evaluated with respect to their efficacy, i.e., their potential to secure water quality standards, and with respect to economic efficiency, i.e., their potential to assure the water quality standards economically. Three policy options are discussed, namely, technology standards, economic incentives, and water quality trading schemes.
To begin with the technology standard, the water authorities prescribe certain technology standards related to the quality of purified waste water released to the receiving waters. In our model, the clarified water \((1+e) w\) is returned into the water body. The authority requires from the WWT plant to deploy technological measures such that the pollutant per unit of water released does not exceed a concentration of \(\bar{e} \). To guarantee an overall water quality of \(\bar{\alpha }_{Q}\), \(\bar{e}\) must be set such that \(w ( \bar{e} + \bar{\alpha }_{Q}) = \varPhi \) (see Eq. (3.97)). This task requires a significant amount of information because the authorities have to anticipate how much water will flow through the water infrastructure given the technology standard.
The integrated water sector will maximize the net economic benefit for a given standard \(\bar{e} \):
The optimality condition is
From Eq. (3.104) the water quantity, \(\hat{w}\), can be derived as a function of \(\bar{e}\). The water authority sets the standard such that \(\hat{w}(\bar{e})(\bar{e} +\bar{\alpha }_{Q})=\varPhi \). Thus, the technology standard approach is effective in that it secures the overall water quality standard \(\bar{\alpha }_{Q}\). This is point R in Fig. 3.20. Here, the constraint (blue line) is satisfied and, at the same time, net benefit is maximized. However, if we compare this point with point O we see that that the allocation \(\{ \hat{w}(\bar{e}), \bar{e} \} \) is not optimal. The ecological constraint can also be met at O with higher net benefits. The concentration regulation leads to more water withdrawal \(\hat{w}(\bar{e}) > w^{*} \) that is too clean \(\bar{e} < e^{*} \).
A second management instrument is to employ economic incentive mechanisms. One instrument that provokes reactions from economic agents are prices. In our setting, effluent taxes serve as the price component. Let us return to the integrated water sector consisting of the water treatment (WT) plant and WWT facility and assume that the total load of pollutants, \((e + \bar{\alpha }_{Q}) w\), will be taxed.
The following net benefit function will be optimized by the water sector:
where \(\tau \) is the net effluent charge.Footnote 49 Contrary to the technology standard case, the water sector can decide on both variables, w and e. The optimality conditions are identical to those of the integrated water quality approach in Eq. (3.102) and \(w e =\varPhi \) if the authority sets \(\tau = \lambda \). Then the values \(\{w(\tau ), e(\tau )\} \) maximizing Eq. (3.105) are identical to the optimal solution \( \{w^{*}, e^{*}\}\). Of course, the water authority has to process huge amounts of information, rather similar to the technology standard case. The authority must observe the pollutant loads released by the WWT facility and, at the same time, the amount of pollutants withdrawn during water abstraction w.
But even if this information is available, the authority cannot fix the optimal effluent charge without knowing the benefit function and the cost function. Thus, a trial-and-error approach is required, such that the regulatory authority introduces an initial effluent charge based on the information available. If total effluents violate the water quality constraint, the authority increases the charge and repeats this procedure until the overall water quality standard is met. Obviously, this procedure cannot last too long, because a prolonged adjustment time could lead to indirect hydrological and ecological effects associated with severe damages to the environment.
There is also another caveat to mention. Our simple model does not take the very complex diffusion process of pollutants into account. In reality, one has to tackle with stochastic fluctuations and also with complex patterns of spatial distributions of effluents. As a result, effluent charges have to be spatially differentiated and also flexible in time. If this flexibility cannot be ensured a technology standard approach might be more efficient than setting economic incentives.
Some of the problems encountered in the framework of an effluent charge can be avoided with water quality trading schemes. Under this policy program, tradable permits are issued to effluent chargers. These permits can be traded leading to a market equilibrium. Effluent discharges are costly because they have to be covered by the permits bought. As a result, the water sector behaves like in the case of an effluent tax. However, the advantage of this policy framework could be that no interactive trial-and-error process takes place. The permit price adjusts to an equilibrium value guaranteeing that the criteria of efficacy and efficiency are satisfied. But water markets also have their specific problems. These will be addressed in Chap. 5. One of the few existing water quality trading schemes is described below.
Box 3.9 Water quality trading: The Hunter River Salinity Trading Scheme
The Hunter River Salinity Trading Scheme (HRSTS) was introduced by the Environmental Protection Agency of New South Wales (NSW-EPA), Australia, to regulate the salinity of the Hunter River. First, it was put in operation as a pilot in 1995 and later in 2002 legally established by a regulation act of the NSW-EPA. The Hunter River drains the largest catchment area in New South Wales. Along the river, a string of heterogeneous industries are located. There is an extensive agricultural sector consisting of wineries, dairy farming, vegetable cultivation and cattle farming. In addition, the Hunter valley counts over 20 coal mines (most of which are surface mines) and three power stations. The salinity of the river comes from natural sources like rocks and soil but also from the economic activities. The river water abstracted by the mines is pumped out and additionally charged with salt. Electricity generation needs water for cooling. Thereby water evaporates leading to a high salt concentration in the remaining water that is pumped back into the river. An increased salinity leads to economic and ecologic damages. Economic damages accrue to the agricultural sector as the water cannot be used for irrigation if the salt concentration exceeds a certain threshold. The ecologic damages were quite obvious. A too high salt concentration has detrimental effects on the ecologic system of the river as a habitat for many species. As a result, there was significant conflict between the various users of the river, specifically between the agricultural sector and the mining operators.
After a long time of fruitless clashes of interests, the NSW Department of Land and Water Conservation and the NSW-EPA introduced a system with dynamic and tradeable discharge permits. In contrast to other permit systems adopted in the context of global emissions, e.g., the EU-ETS, the system here had to be adapted to the specific hydrology of a river. It is important to keep the salinity of river under a threshold along its whole course. To do so, the regulatory authorities divided the river into three sectors: the upper, middle, and lower sector. For each sector, upper ceilings of salinity were determined. These ceilings depend on the flow intensity of the river. If the river has a low flow, no salt discharge is permitted. If the flow is high, then the permitted discharge is increased; this depends on the specific hydrological properties of the river sectors. The main goal of this spatially differentiated approach is to keep the salt concentration along the whole river within justifiable boundaries. To make the HRSTS work, a string of monitoring points along the river were deployed so as to enforce the regulation of salt concentration. Following figure shows how the concentration data is transformed to allowances for the dischargers.

Hunter river salinity trading scheme. Source NSW-EPA (2003) The river is divided in floating blocks that move with the flow of the river downstream. Each block is controlled with respect to its salinity which is measured by the waters electrical conductivity (micro-siemens per cubic centimeter). The allowed discharges per block are calculated on the basis of a hydrological model such that the electrical conductivity does not exceed the threshold value introduced by the authority. These allowed discharges vary with the hydrological conditions, e.g., the flow intensity of the river in the different river sectors. The allowances are distributed to dischargers as “discharge credits”. In total, there are 1000 discharge credits expressed as per mill. One credit equals one per mill of the allowed discharge in a block.
As an example take one of the blocks in above figure. Site A releases a certain amount of salt (measured in tons). As the river flows the block moves downstream and flows along site B which can also release a certain amount of salt and so forth. After the last site, the block has resumed 1000 per mil of the allowed discharge. What makes this scheme efficient is that the allotted discharge credits can be traded. We could imagine that site A does not exploit all of her credits but instead sells some of these to site B allowing B to discharge more than what was allotted to her. This trade takes place as long as the abatement costs of an additional ton of salt is lower at site A compared to site B. It is less costly to avoid one ton of salt discharge at site A than at site B. Hence, both sides can benefit from trade. The market equilibrium is reached when the marginal abatement costs of both dischargers are equalized. From an economic viewpoint, the market equilibrium sustains a discharge pattern along the river that minimizes total abatement costs of all dischargers.
If we gather the experiences of the past years one can state that the HRSTS is a success story. The average salinity of the Hunter river dropped considerably and the former conflicts between the different economic sectors have been solved within an effective institutional framework.
Sources: NSW-EPA (2003), Muschal (2006), Krogh et al. (2013)
3.11 Exercises
Exercise 3.1
Maximizing agricultural output with return flows
Assume a river basin with two riparians. If water management only looks after efficiency in the sense of maximizing agricultural output in the entire basin, then the more productive farmer should get all the water. However, this optimization rule is not correct when the return flow occurs. Let’s assume the upstream farmer F1 is less productive than the downstream farmer F2. However, a ratio of water diverted by F1 flows back in the water body and is afterward available for the downstream riparian F2. How should the policymaker allocate the available water of the river?
Let us assume that the available water in the river which can be diverted is given with \(\bar{W} = 100\) units (\(m^3\), or liters, or hectoliters). The productivity of farmer F2 and F1 is \(a_{1} = 0.75\) and \(a_{2}=1.0\), respectively. The fraction of returned water of F1 is \(h_{1}=0.5\) and that of F2 is zero (\( h_{2}=0\)).
There are two methods for finding the optimal allocation. Either the total amount of water is allocated completely to the riparian which has the highest productivity related to net abstraction, or an optimization problem is solved. We start with explaining the first method. The parameters \(a_1\) and \(a_2\) represent the productivity per abstracted water, hence \(\frac{a_1}{(1 - h_1)}\) and \(\frac{a_2}{(1 - h_2)}\) stand for the productivity per net-abstracted water.Footnote 50 By applying this approach
we come to the solution that the upstream riparian F1 is most productive per one unit net-abstracted water, because \(\frac{a_1}{(1 - h_1)}>\frac{a_2}{(1 - h_2)}\). Therefore, the upstream riparian should receive the total amount of available water which means, \(w_1 = \bar{W} =100\). Therefore, the agricultural output of riparian F1 is: \(a_1 \cdot w_1 = 75\). After the consumption of F1, the return flow \(h_1 \cdot w_1 = 50\) flows back to the river and is available for the downstream riparian F2. The downstream riparian diverts the amount of water which is available at its abstraction point, hence: \(w_2 = \bar{W} - w_1 + h_1 \cdot w_1 = 50\). Therefore, F2 is able to produce \(a_2 \cdot w_2=50\) agricultural products.
If the relations in a river basin are more sophisticated (e.g., more complex production functions), the first method may not work and the second method (solving an optimization problem) has to be applied. The optimization problem for maximizing the agricultural production in the basin has the following form:
The objective is to maximize the agricultural production in the basin, while the constraints limit the amount of water which can be diverted which is determined by the available amount at the abstraction point of the riparian. Based on the optimization problem, we can derive the Lagrangian:
and the KKT conditions (see Appendix A):
Inserting the numerical values gives
From Eq. (3.113), we can infer that \(\lambda _{2} >0\), for meeting the condition \(1 - \lambda _{2} \le 0\). Hence, by Eq. (3.115), we can infer that F2 uses all residual water, which means \(w_{2}=\bar{W} - (1-h_{1}) \cdot w_{1}\). Because of the fact that \(w_2 > 0\) and due to Eq. (3.113), we know that \(1 - \lambda _2 = 0\). Therefore, we can specify the level of \(\lambda _2 = 1\). Inserting this numerical value into Eq. (3.112) yields \(0.75 - 0.5 - \lambda _{1} \le 0 \), which means that \(\lambda _{1}>0\). Hence, by Eq. (3.114) we can infer that F1 diverts all its available water, \(w_{1} = \bar{W} =100\). Therefore, from Eq. (3.112) and the fact that \(w_1 >0\), we know that \(0.75 - \lambda _1 - 0.5 = 0\), which means that \(\lambda _1=0.25\). Furthermore, by inserting the facts that \(\lambda _2>0\) and \(w_1 = \bar{W}=100\) in Eq. (3.115) it is possible to find \(w_2 = 50\).
Exercise 3.2
Water demand with subsistence levels (Stone-Geary Utility Function)
One way to introduce life lines into the theory of households is the Stone-Geary utility function. The Stone-Geary utility function is often used in the empirical investigation of water demand in developing and emerging countries where the life line consumption plays a significant role. An example is given by Dharmaratna and Harris (2012).
where w is water and b is bread (nutrition), \(w_{s} \) (\(b_{s} \)) are the respective subsistence levels.
The respective demand functions can be derived by the usual maximization approach of a household utility function. The Lagrangian is
Notice, that due to the properties of the Stone-Geary utility function \(w > w_{s}\) and \(b > b_{s} \). Thus, the KKT conditions reduce to
By inspection of the first (or second) equation we see that \(\mu > 0\) and thus income is completely exhausted. Dividing Eq. (3.118) by Eq. (3.119) leads to
The budget constraint can be rewritten as
Inserting Eq. (3.121) into the budget constraint yields the demand functions for w and b, respectively. The demand function for w is
Specifically, the sensitivity with respect to a change of the water price is of interest. Let us first calculate the revenue a water supplier can collect, i.e.,
Differentiating the revenue with respect to the water price yields
Thus, a rising price always leads to an increased revenue. We know from basic microeconomic calculations that a rising revenue comes from a water demand elasticity less than unity. Hence, due to the subsistence level water demand is inelastic. Moreover, we can derive that the price sensitivity of water demand increases with income y and vice versa. This is intuitively clear. A rich household can escape a price increase by simply reducing water demand and consuming other goods. A poor household consumes water close to the subsistence level and, hence, cannot escape the price increase by simply substituting other goods for water.
Exercise 3.3
What is rain from an economic point of view?
A feature of the hydrological cycle is that the water cyclically changes its aggregate state: from blue water to green water and then back to blue water. We consider blue water as a private good or as a common property. In both cases, consumption is rival. But what about the rain? If blue water is rivaling in its use, what about the green water, the water vapor and the rain? What is your reasoned opinion?
The answer can be given with the help of an example from the agricultural use of rainfall. We look at farms in a region where it rains. The natural irrigation of the agricultural crops is apparently non-rivaling. Of course, the rain strength does not have to be uniformly distributed across the cultivation areas of farmers. What is decisive is rather the following: What one farmer uses does not affect the others consumption. In addition, it is difficult to exclude a farmer from the rain if he does not want to pay for it. All in all, rain is a public good. If the observation period is extended, this result may change. The rainwater, which does not enter the plants on the field, evaporates partly and partly seeps into the groundwater. It can also be carried away by rivers from the region to the seaside. When rain percolates after its journey through the earth’s surface, it becomes groundwater and it changes its economic property. The public good becomes a commodity whose consumption is rivaling. Now the question remains whether this water is a private good or a common property good. The answer to this question depends on the possibility to exclude those farmers from water use who are not willing to pay for it.
Exercise 3.4
The market for recycled water
In Sect. 3.6 we have discussed a system of two water markets (see Fig. 3.11). In market 1 treated freshwater from a surface water body or from groundwater is traded, while in market 2 recycled water which is properly treated is traded. Assuming two users (user 1 and user 2) and that markets operate under perfect competition, we can show that the market allocation is identical to the optimal allocation derived from Eq. (3.41) (see Sect. 3.6).Footnote 51
In our numerical example, user 1 operates either in both markets or neither of them as we will derive below. This user 1 is on the demand side in the freshwater market (market 1), because this he/she aims to purchase freshwater at this market. After the consumption of this freshwater, a certain share of user 1’s waste water could be recycled and offered by user 1 at the market for recycled water (market 2). Therefore, user 1 is at the supply side in market 2. User 2 is at the demand side of both markets, because this user is able to purchase freshwater in market 1 or to purchase recycled water in market 2. We assume the following benefit functions:
with w representing the respective consumption level of each user. User 1 consumes the amount purchased at the freshwater market (\(w_1\)), while user 2 consumes the amount which results from the sum of the water purchased at the freshwater market (\(w_2\)) and the purchased water from the market for recycled water (\(w_{12}\)).
Let us assume that the price in market 1 is fixed by a regulatory authority and set equal to marginal costs of water treatment, i.e., \(p_{1}=c = 80\). We further assume for simplicity that the recycling quota is \(h=1\), i.e., all water used by user 1 is recycled and offered at the market for recycled water (market 2).
User 1 maximizes net benefits according to Eq. (3.48) whereas user 2 maximizes net benefits defined in Eq. (3.52).Footnote 52
To derive the demand curves of both users and the supply curve for treated waste water of user 1, respectively, we specify the KKT conditions.
For user 1, we have
Inserting the given parameter values means
From Eq. (3.131), we can infer that user 1 will not demand water in market 1 (freshwater market) without reselling it in market 2. This comes from the fact that \(\lambda = 30 + w_1 >0\) for realizing \(50 - w_{1} - 80 + \lambda = 0\) (see Eq. (3.131)). Due to Eq. (3.133), the parameter \(\lambda \) only becomes positive, if \(w_{12}=w_1\).Footnote 53 So we assume that values are positive. Below we will see that this assumption is correct.
The KKTs of the optimization program of user 2 (see Eq. (3.52)) are
Inserting the given parameter values:
These two equations differ only in the two prices. If \(p_{1}=p_{2}=80\), both markets are equally good for user 2, which means that user 2 is indifferent in purchasing water from market 1 or market 2. For different prices, we have following resultFootnote 54:
Thus, if \(p_{2}> p_{1} \) there is no demand in market 2 and, hence, the market does not exist. This means that under this condition user 1 cannot sell its treated waste water and therefore withdraws from both markets for the given numerical values. If \(p_{2}= p_{1} = c = 80\) we know from Eq. (3.132) that \(\lambda = p_2\), and hence \(\lambda = p_1\). Inserting this relation in Eq. (3.131) leads to the follwing result:
From Eq. (3.133), we know that \(w_{12}=w_1 = 50\).
For user 2 it follows from Eq. (3.136)
which leads to \(w_{2} = -30\). This is a contradiction with the specification \(w_2 \ge 0\) (see Eq. (3.136)).
Thus, for an equilibrium in both markets we must have \(p_{1}>p_{2}\), which means that the price for recycled water is lower than the price for freshwater. In the following, we would like to calculate the price \(p_2\).
From Eq. (3.132), we know that \(\lambda = p_2\). Inserting this relation in Eq. (3.131), we can derive the supply curve of user 1 in the market for recycled water:
From Eqs. (3.136) and (3.137), we already know for the case \(p_1 > p_2\) that \(w_2 = 0\) and \(w_{12}>0\). This means that user 2 purchases only recycled water from market 2 since it is cheaper than buying freshwater in market 1. The demand for recycled water (\(w_{12}\)) can be derived from Eq. (3.137):
Please note, that the quantity supplied is equal to the quantity demanded, hence \(h_1 \cdot w_1 = w_{12}\). Equating supply (Eq. (3.140)) and demand (Eq. (3.141)) will yield the equilibrium market price:
If we insert the numerical values we get \(p_{2} = 65\). Recycled water with a price of \(p_2=65\) is, therefore, cheaper than freshwater which can be purchased for a price of \(p_1=80\). From the supply function in Eq. (3.140) of user 1, we can calculate the supply \(w_{12} = h_{1} w_{1} = 35\).
It remains to show that the market solution is identical to the optimal allocation of program (3.41). Simply insert the market solution \(h_{1}w_{1} = w_{12}= 35\) into (Eq. (3.42))—Eq. (3.45) for the assumed numerical values.Footnote 55 However, the requirement is to install a sufficient number of markets. In our case there must be two markets, one for freshwater and one for recycled water. Of course, there are some institutional intricacies. Usually piped water is offered by monopolies due to the cost advantages of a single supplier. The first welfare theorem is only valid if markets are fully competitive. Hence, to refer to the first welfare theorem is only legitimate if a regulation authority is able to control the price setting of water suppliers such that these prices are similar to those that result from a competitive market. We come back to this exercise in Chap. 4.
Exercise 3.5
Water allocation in a river
Assume there are two users who divert water from one river. The situation is illustrated by Fig. 3.21.

Source own illustration
Scheme of a river basin with 2 users.
The marginal benefit function of the upstream user 1 is
while the one of the downstream user 2 is:
The variables \(w_1\) and \(w_2\) represent the consumption levels of user 1 and 2, respectively. We also assume headwater inflows of \(R_1=50\) and \(R_2=50\). The goal is to calculate the optimal water allocation between the users where we maximize the benefit of the entire basin. The maximization goal is implemented by the objective function of the following optimization problem:
The constraints of the optimization problem restrict the amount of water which can be extracted. The extractable amount is limited by the water availability at the respective extraction points.
The following Lagrangian function can be set up on the basis of the optimization problem:
And therefore we can formulate the following KKT conditions:
We assume that both users consume water, i.e., \(w_1 \ge 0\) and \(w_2 \ge 0\), and hence
Furthermore we also suppose that water is scarce, which means that the available water amount will be consumed by both users completely, i.e., \(R_1 + R_2 = w_1 + w_2\). This means that Eq. (3.150) is binding and therefore we assume that \(\lambda _2 \ge 0\). Regarding user 1, we can distinguish between two cases:
-
User 1 extracts all its available water, i.e., \(w_1=R_1\). Therefore, we would assume that \(\lambda _1 \ge 0\) for this case because of Eq. (3.149). Hence, following optimality conditions result from the KKT conditions for this case:
$$\begin{aligned}&w_1 = R_1 \end{aligned}$$(3.151)$$\begin{aligned}&w_2 = R_2 \end{aligned}$$(3.152)$$\begin{aligned}&\lambda _2 = B_2'(w_2) \end{aligned}$$(3.153)$$\begin{aligned}&\lambda _1 = B_1'(w_1) - B_2'(w_2) \end{aligned}$$(3.154) -
User 1 leaves some amount of water in the river, i.e., \(w_1 \le R_1\). Therefore, we would suppose that \(\lambda _1 = 0\) because of Eq. (3.149). Hence, following optimality conditions result from the KKT conditions for this case:
$$\begin{aligned}&B_1'(w_1) = B_2'(w_2) \end{aligned}$$(3.155)$$\begin{aligned}&R_1 + R_2 = w_1 + w_2 \end{aligned}$$(3.156)$$\begin{aligned}&w_1 \le R_1 \end{aligned}$$(3.157)$$\begin{aligned}&\lambda _2 = B_2'(w_2) \end{aligned}$$(3.158)
Suppose we assume the second case (in which user 1 leaves water in the river), due to Eqs. (3.155) and (3.156) we can set up the system of equations:
The solution is: \(w_1=56\) and \(w_2=44\).
We already know from Eq. (3.157) that \(w_1 \le R_1\). Here we found the contradiction, because the amount extracted by user 1 exceeds its available water which is \(R_1=50\). Therefore, we cannot find the optimal solution on the base of this case 2.
Hence, we would like to check the first case where the upstream user extracts all available water. The extracted amount therefore is: \(w_1=50\) and \(w_2=50\), because of Eqs. (3.151) and (3.152). Hence, the marginal benefits are: \(B_1'(w_1)=25\) and \(B_2'(w_2)=10\). Therefore, it becomes obvious that the marginal benefit of the upstream user exceeds the one of the downstream, which in this case is required for optimality. The levels of the dual variables are \(\lambda _1=B_1'(w_1) - B_2'(w_2) = 15\) and \(\lambda _2=B_2'(w_2)=10\) (see Eqs. (3.153) and (3.154)), which means that the dual variables are nonnegative which is also required. Therefore, we can not find a contradiction, and hence this case leads to an optimal solution.
Assume that we have a situation in which the downstream headwater inflow decreases to the level of \(R_2=25\), due to for instance climate change, etc. If we suppose that the first case—in which the upstream user abstracts the total amount of available water—leads to the optimal solution as before, we find from the former explained optimality conditions (Eqs. (3.151) to (3.153)) that: \(w_1=50\), \(w_2=25\) and \(\lambda _2=B_2'(w_2)=35\). When applying Eq. (3.154), we calculate that \(\lambda _1=B_1'(w_1) - B_2'(w_2)=-10\). Therefore, \(\lambda _1\) is negative which contradicts the condition \(\lambda _1 \ge 0\) and hence this first case does not lead to the optimal solution.
If we assume the second case where user 1 leaves water in the river, we solve the allocation amounts by applying Eqs. (3.155) and (3.156):
which is: \(w_1=46\) and \(w_2=29\). Because of Eq. (3.158), we find that \(\lambda _2=B_2'(w_2)=31\) which is nonnegative, hence the condition \(\lambda _2 \ge 0\) holds. Furthermore, we also have to check Eq. (3.157) which is fulfilled because: \(w_1 = 46 \le 50 = R_1\). Hence, there exists no contradiction in this case, which means that this case leads to the optimal solution.
Exercise 3.6
Water transfers
Assume a situation with two regions, one with plentiful precipitation and non-arid conditions, while the second region is characterized by arid conditions. For preventing overexploitation in the arid region, the divertable water amounts are limited by \(w_2^{\text {SUS}} = 3\). The renewed volumes of water resources in the non-arid region are very high, which means that the amount of divertable water \(w_1^{\text {SUS}}\) also becomes quite high. Hence there is no scarcity in region 1. The demand function is equal in both regions and given by
The variable \(w_i^C\) represents the amount of water consumed in the respective region.
The water extraction causes costs in the non-arid region in accordance with the linear function:
To reduce scarcity in the arid region 2, water managers want to implement a water transfer scheme for exporting water from region 1 to region 2. The amount of transferred water is represented by the variable z. The transportation costs depend on the transferred amounts and are given by \(\gamma \cdot z\), with \(\gamma = 0.5\).
In contrast to Sect. 3.9, the marginal extraction cost function only occurs in the water-rich region 1 and has a horizontal shape (\(C_1'(w_1)=c_1=2\)). The following objective function has to be maximized to find the optimal water extraction amounts, the optimal water consumed as well as the optimal water transfer:
The amount of water consumed in the regions depends on the water extraction in the respective region as well as the transferred water amount:
Hence, we are able to substitute the variables \(w_1^C\) and \(w_2^C\) and can finally solve the following optimization problem:
The corresponding Lagrangian function to the optimization problem is
Now the KKT conditions can be set up:
We can assume that water is plentiful in region 1, hence \(w_1 < w_1^{\text {SUS}}\) and because of Eq. (3.171) we know that \(\lambda _1 =0\). However water is scarce in region 2 which means that water is extracted until its maximum possible limit (\(w_2 = w_2^{\text {SUS}} = 3\)) and hence it follows that \(\lambda _2 \ge 0\) due to Eq. (3.172). Furthermore, we assume that a transfer is may be realized (\(z \ge 0\)).
Addressing these assumptions, we can adjust the KKT conditions to Eqs. (3.168), (3.169), and (3.170):
The values of the three variables \(w_1\), z, \(\lambda _2\) can be solved with the three above Eqs. (3.173), (3.174) as well as (3.175). Therefore we find the following solution:
\(w_1 = 58.5\), \(w_2 = 3\), \(z=27.5\), \(\lambda _1=0\), \(\lambda _2 = 2.5\).
A contradiction cannot be found in the solution, hence these are the optimal values.
If we change the assumptions such that water is not abundant in the water rich region anymore, the extractable amount is limited by its maximum, for instance \(w_1^{\text {SUS}} = 8\) for fulfilling sustainability requirements in the region. It is quite obvious that the former assumption is not suitable for solving the problem, because the optimal water extraction in the water-rich region (\(w_1=58.5\)) would exceed the maximum amount of water extractable in this region (\(w_1^{\text {SUS}} = 8\)) and hence there would be a violation of constraint (3.165) (\(w_1^{\text {SUS}} \ge w_1\)).
Therefore, we assume an extraction at each region equal to the maximum level, which means that \(w_1 = w_1^{\text {SUS}} = 8\) as well as \(w_2 = w_2^{\text {SUS}} = 3\). Hence \(\lambda _1 \ge 0\) and \(\lambda _2 \ge 0\), because of equations (3.171) and (3.172), respectively. Similar to the assumption before, a transfer may be realized (\(z \ge 0\)). Entering the assumptions in the KKT conditions Eqs. (3.168), (3.169), and (3.170), we obtain the following adjusted conditions:
The unknown values of the three variables z, \(\lambda _1\), and \(\lambda _2\) can be calculated with the above Eqs. (3.176), (3.177) and (3.178).
\(w_1= 8\), \(w_2= 3\), \(z=2.25\), \(\lambda _1= 25.25\), and \(\lambda _2=27.75\).
A contradiction cannot be found in the solution, hence these are the optimal values.
Exercise 3.7
Rivalry of consumption in a lake basin
Suppose a lake (see Fig. 3.22) which is the only raw water source for three users, i.e., \(i=\left\{ 1,2,3 \right\} \). The total amount of extractable water is determined by the natural recharge rate of the sea and is given by \(R=8\).

Source own illustration
Scheme of a lake with 3 users.
The users 1,2, and 3 generate benefit from abstracting water from the lake related to the following function:
We assume that after the consumption of water, there is a return flow back into the river. The return flow factor \(h_i\) indicates the proportion of consumed water which flows back to the lake. The level of the return flow from user i, which is \(h_i \cdot w_i\), impacts the net abstraction of this user. The net abstraction of one user results from the difference between its abstraction (\(w_i\)) and its return flow back to the water body (\(h_i \cdot w_i\)), e.g., \(w_i - h_i \cdot w_i\) which is, therefore, \((1-h_i) \cdot w_i\). Hence, while the abstraction of user 1,2, and 3 are represented by the variables \(w_1\), \(w_2\) and \(w_3\), the net abstraction of user 1, 2, and 3 are \((1-h_1) \cdot w_1\), \((1-h_2) \cdot w_2\) and \((1-h_3) \cdot w_3\), respectively. We want to calculate the optimal water allocation to all users under the two cases that
-
the return flow factors are \(h_1=h_2=h_3=1\) (full return flows)
-
the return flow factors are \(h_1=h_2=h_3=0\) (no return flows)
Regardless of the level of the return flows, we can set up the following optimization problem for finding the optimal water allocation strategy in the basin:
Due to the objective, we want to maximize the total benefit in the entire basin. The constraints limit the extractable amount of water for each user. The extractable water of a specific user is determined by the natural recharge rate R and the sum of the net abstraction of the other users. Based on the optimization problem, the following Lagrangian function can be set up:
And hence, the following KKT conditions can be formulated:
Full return flows
In case of full return flows, which means that \(h_1=h_2=h_3=1\), the net abstraction of water from the lake is zero. Therefore, the consumption is non-rivalrous. The access to the lake is also non-excludable, hence the water in the lake could be classified as a public good. By inserting \(h_1=h_2=h_3=1\) in Eqs. (3.179) to (3.184), we can find the following expressions:
which can be generalized to the following form:
We know that we have to assume \(w_i \ge 0\).Footnote 56 Therefore it follows, that:
Based on this, we can distinguish between two cases:
-
The consumption is equal to the available water which is determined by the natural recharge rate R. If \(w_i=R\) it becomes obvious that we have to assume that \(\lambda _i \ge 0\). Therefore, it follows that \(B_i'(w_i) \ge 0\), which means that the marginal benefit have to be nonnegative.
-
Under the assumption that the constraint \(R-w_i \ge 0\) is nonbinding it follows that we have to assume that \(\lambda _i=0\). This means that we have a consumption level where the marginal benefit is zero, i.e., \(B_i'(w_i)=0\).
User 1 and 2 consume at the level where their respective marginal benefit levels are zero, hence \(w_1=6\) and \(w_2=\frac{14}{3} \approx 4.667\). However, user 3 abstracts the total amount of available water, hence \(w_3=R=8\). The marginal benefit of user 3 is \(B_3'(w_3)=4\).Footnote 57

Source own illustration
Optimal allocation in a lake basin if there are full return flows.
The situation in the lake with full return flows is illustrated by Fig. 3.23. The zero of the marginal benefit functions of user 1 and 2 are left from the water availability level \(R=8\), which means that there are no intersection points between these marginal benefit functions and the water availability \(R=8\). Therefore the amount of water consumed by user 1 and 2 are determined by their respective zero of marginal benefit, i.e., \(B_1'(w_1)=0\) and \(B_2'(w_2)=0\), and based on this we are able to get \(w_1^*\) and \(w_2^*\). Only the marginal benefit function of user 3 intersects the water availability \(R=8\), hence \(w_3^*=R\). This intersection point determines the marginal benefit level of user 3 which is \(B_3'(w_3)=4\).
No return flows
In case of no return flows, which means that \(h_1=h_2=h_3=0\), the net abstraction is equal to the abstraction. Therefore, the abstracted water amounts cannot be used by another user. Hence, the consumption is rivalrous. The access to the lake is still non-excludable as in the other case with full return flows. Therefore, the water in the lake can be classified as a common good.
By inserting \(h_1=h_2=h_3=0\) in Eq. (3.182) to (3.184), we can find the following expressions:
which can be generalized in the following way:
The term \(\sum _i{\left[ w_i\right] }\) is nothing else than \(w_1 + w_2 + w_3\) and stands for the total consumption level in the basin. From this general formulation, the following aspects become obvious:
-
if we assume that \(\lambda _1 \ge 0\), \(\lambda _2 \ge 0\) and \(\lambda _3 \ge 0\), all available water is consumed.
-
if we assume that \(\lambda _1=\lambda _2=\lambda _3=0\), not all of the available water is consumed in total in the basin. Hence, water is not scarce.
By inserting \(h_1=h_2=h_3=0\) in Eqs. (3.179) to (3.181), we are able to formulate
which is in a more general formulation:
The term \(\sum _{j}{ \left[ \lambda _j \right] }\) represents the sum of all dual variables, i.e., \(\lambda _1 + \lambda _2+\lambda _3\). Based on this formulation, we can distinguish between two cases:
-
If we assume that a riparian has no consumption, i.e., \(w_i = 0\), we know that \(B_i'(w_i) \le \sum _{j}{ \left[ \lambda _j \right] }\), which means that the choke price of the user i falls below the sum of the dual variables.
-
If we assume a consumption for user i, i.e., \(w_i \ge 0\), we know that \(B_i'(w_i) = \sum _{j}{ \left[ \lambda _j \right] }\), which means that the marginal benefit of the user i is equal to the sum of the dual variables.
Under the assumption that water is scarce (\(R = \sum _{i}{\left[ w_i \right] }\)), there may exist two kinds of users. Users for which consumption is assumed (\(w_k \ge 0\)) are denoted by k, while users for which consumption is not assumed (\(w_m = 0\)) are denoted by m. Ergo, one may state the following:
It becomes apparent that all consuming users should have an equal level of marginal benefit (see Eq. (3.186)). However, based on Eq. (3.187), the choke price of those consumers who do not consume must fall below the marginal benefit level of the consuming users.
This solution could be enforced, for instance, by pricing water. If water is priced, the users will consume in such quantities, that their marginal benefit becomes equal to the price level. Due to Eq. (3.186), we find out that the marginal benefit level of every consuming user should be the same, hence there should exist just one market price in the entire market. By pricing water, one could potentially exclude users from consuming. Hence, if a pricing policy is enforceable, water would not be a common good anymore, but a private good. If the market price for water exceeds the choke price of a specific user, this user would not consume any water from the resource. This is exactly the condition which is explained by Eq. (3.187).
There are two ways for finding the concrete solution of this optimization problem:
-
Solving the system of equations
-
Set the market demand function and find an intersection with water supply
Regarding the first approach, we may assume that all users consume and that water is scarce, hence: \(w_1 \ge 0\), \(w_2 \ge 0\), \(w_3 \ge 0\), \(\lambda _1 \ge 0\), \(\lambda _2 \ge 0\) and \(\lambda _3 \ge 0\). Based on this, we can define the following system of equations:
The solution is: \(w_1=\frac{10}{11}\approx 0.909\), \(w_2=\frac{42}{33}\approx 1.272\) and \(w_3=\frac{64}{11}\approx 5.818\)
The marginal benefits of the three users are: \(B_1'(w_1)=B_2'(w_2)=B_3'(w_3)=\frac{56}{11} \approx 5.091\).
For the second approach we have to define the marginal benefit (or demand function) of the entire basin which has to meet Eqs. (3.185) to (3.187). Please note, that the demand function is nothing else than the marginal benefit function, hence:
For finding the market demand function, we have to set up the inverse forms:
and sum up these inverse forms:
We use the term \(\max \left\{ 0, w_i(p) \right\} \) in order to address the condition of nonnegativity for \(w_i\). If the price p exceeds the choke price, the term \(\max \left\{ 0, w_i(p) \right\} =0\), while if the price p falls below the choke price, we get \(\max \left\{ 0, w_i(p) \right\} =w_i\). Therefore, we are able to set up following distinction of cases:
When setting this function equal to the water availability \(w_M(p)=R=8\), we get a price of \(p=\frac{56}{11}\approx 5.091\).Footnote 58 By inserting this price in the individual demand functions we get:
\(w_1=\frac{10}{11} \approx 0.909\), \(w_2=\frac{42}{33} = 1.272\) and \(w_3=\frac{64}{11} = 5.818\).

Source own illustration
Optimal allocation in a lake basin if there are no return flows.
This situation in the lake with no return flows is illustrated by Fig. 3.24. The market demand function can be set up by the summation of the marginal benefit functions of the users 1, 2, and 3 in the horizontal direction. The intersection of this market demand function with the water availability \(R=8\) determines the price for water, i.e., \(p^*=5.818\). Based on this market price and the respective marginal benefit functions of the users, the social-optimal usage of each users, symbolized by \(w_1^*\), \(w_2^*\) and \(w_3^*\), can be found.
3.12 Further Reading
In Sect. 3.1, we have already listed some literature sources on the IWRM. In addition, there are a number of other papers on IWRM which are worth reading from different perspectives: Hoekstra (1998) provides a comprehensive overview of the social perspectives of water allocation that goes beyond economic approaches. Grafton et al. (2019) view the integrated water resource management from a governance perspective; a reform process called the Water Governance Reform Framework (WGRF) is proposed.
Justice aspects are not included in many economic textbooks. Especially in the case of water, we do not believe that we can limit ourselves to questions of efficient allocation. Water is more than a private good. But which justice criteria should be taken into account in the allocation and distribution of resources? Johansson-Stenman and Konow (2010) give a structured overview of the interdisciplinary literature. In this context, the work of the philosopher John Rawls (1971) is particularly important with respect to the allocation of goods; this is where the principle of difference, which is based on the concept of moral arbitrariness, is developed and founded. Sandel (2009) dedicates a separate chapter to Rawls in his work on justice. This book takes particular account of social-philosophical approaches that are relevant to economics. In the center of the chapter on Rawls are the four theories of distribution justice: feudal system, free market with formal equality (libertarianism), free market with fair equality (meritocratic), and Rawls’s difference principle (egalitarianism).
But how can a fair distribution of goods be determined? This is about the psychological and socio-philosophical foundation of the utility function. Roemer (1996) examines the question of how utility (happiness) can be measured and whether and how they can be compared between people. It takes into account the subtle question of what the consequences are for a just allocation of goods when certain resources are inalienable (e.g., talents).
Alan Garcia was a controversial president of Peru, ideologically very close to neoliberalism. The fable of the dog in the manger and its connection with the rural population was considered as polemical, as Boelens and Vos (2012) have reported. However, it is worth the exact analysis of his arguments. It turns out that the question of distributional impacts of productivity-enhancing investments depends not only on the ownership structure but also on other income options of the rural population. Here, our model uses essential elements from Cohen and Weitzman (1975), who have studied the effects of the enclosure process in England of small landholdings within common land into larger farms with private entitlements.
The human right to water is rarely addressed in the economic literature on water allocation. At the very most, the requirement of access to water as a restriction is included in the usual allocation models. Our approach explicitly includes the hierarchization of needs into the IWRM model, i.e., to place basic nutrition and water in their life-sustaining function before other consumer goods. The notion of hierarchies of needs goes back to the beginnings of utility theory: Georgescu-Roegen (1954) has written an idea-historical outline in which the concept of the irreducibility of wants is introduced as the foundation of the hierarchy of needs. Seeley (1992) extends utility theory to the Maslow triangle. Hoekstra (1998) provides a comprehensive overview of the social perspectives of water allocation that goes beyond economic approaches.
A classic contribution to water allocation along rivers is Ambec and Sprumont (2002). However, not only efficiency aspects are important, but also distribution rules that can be applied to cooperation gains. Ambec et al. (2013) analyze different distribution rules and examine them with regard to their robustness if the water supply unexpectedly decreases. This problem is particularly virulent in international water treaties and is addressed in Chap. 6.
Not only surface waters but also groundwater reservoirs are overused worldwide. The consequences are manifold. Koundouri (2004) gives an overview of how an economic approach can reconcile the use and hydrological constraints. She also deals with the difference between the use of groundwater as a common pool resource and as a co-operatively managed resource. In addition, not only are groundwater reservoirs being overused, but the interdependence of groundwater and surface waters caused by the infiltration processes means that the flow of rivers reaches ecologically critical limits. De Graaf et al. (2019) examine these relationships and conclude that the negative ecological effects of groundwater abstraction occur long before the reservoirs are overexploited. Jakeman et al. (2016) make a similar diagnosis and advocate an integrated management approach. This implies “thinking beyond the aquifer”. Surface waters and aquifers should be considered in an overarching approach (conjunctive use). Pulido-Velazquez et al. (2016) develop complex hydro-economic models that derive a sustainable and economically optimized conjunctive use of surface and groundwater storage.
Simply pumping water from one catchment area to another can certainly not be considered a result of integrated water management. A variety of ecological and social effects must be taken into account. Gupta and van der Zaag (2008) develop a system of criteria against which transfer projects should be evaluated. The different effects at the donor and at the recipient catchment areas have to be distinguished. With the help of this evaluation scheme, they examine transfer projects in India. Tian et al. (2019) develop a complex hydro-economic model that not only assesses the hydrological, ecological and social impacts of water transfer projects, but also determines optimal water allocations. The approach takes into account random fluctuations in the water supply and derives measurements for the reliability and resilience of transfer networks.
Water quality problems are only marginally addressed in this textbook, though they are of paramount importance for integrated water resource management. Olmstead (2009) gives a very instructive overview of the economic dimension of water quality regulation and analyzes various policy instruments. The literature contains a large number of articles dealing with various aspects of water quality. Zhu and van Ierland (2012) develop a hydro-economic optimization model, in which both quantity and quality problems are considered, Shortle (2013) reports on the experiences with quality trading and D’Arcy and Frost (2001) deal with the problems of diffuse pollutant inputs.
3.13 Chapter Annex: Integrated Water Resource Management
3.13.1 The Dublin Principles
Four important guiding principles were determined during the International Conference on Environment and Water in Dublin in the year 1992 with over 500 participants representing 100 countries and 80 international and nongovernmental organizations (Xie 2006). These principles are:
-
Principle No. 1 (“Ecological”): Freshwater is a finite and vulnerable resource, essential to sustain life, development, and the environment. Since water sustains both life and livelihoods, effective management of water resources demands a holistic approach, linking social and economic development with the protection of natural ecosystems. Effective management links land and water use across the whole of a catchment area or groundwater aquifer.
-
Principle No. 2 (“Institutional”): Water development and management should be based on a participatory approach, involving users, planners, and policy-makers at all levels. The participatory approach involves raising awareness of the importance of water among policy-makers and the general public. It means that decisions are taken at the lowest appropriate level, with full public consultation and involvement of users in the planning and implementation of water projects.
-
Principle No. 3 (“Gender”): Women play a central part in the provision, management, and safeguarding of water. This pivotal role of women as providers and users of water and guardians of the living environment has seldom been reflected in institutional arrangements for the development and management of water resources. Acceptance and implementation of this principle require positive policies to address women’s specific needs and to equip and empower women to participate at all levels in water resources programs, including decision-making and implementation, in ways defined by them.
-
Principle No. 4 (“Economic”): Water has an economic value in all its competing uses and should be recognized as an economic good. Within this principle, it is vital to recognize first the basic right of all human beings to have access to clean water and sanitation at an affordable price. Past failure to recognize the economic value of water has led to wasteful and environmentally damaging uses of the resource. Managing water as an economic good is an important way of achieving efficient and equitable use, and of encouraging conservation and protection of water resources.
3.13.2 Integration in IWRM
It is important to bridge components of the natural systems, like availability and quality of resources, as well as characteristics of human systems, which are fundamentally determined by resource use, waste production, and resource pollution. The main aspects regarding natural system integration and human system integration are listed in detail below (GWP 2000):
-
Natural system integration
-
Integration of freshwater management and coastal zone management: Requirements of coastal zones have to be considered in upstream freshwater management
-
Integration of land and water management: Land use influences the distribution and quality of water. Furthermore, water is a key determinant of the character of ecosystems.
-
Distinction between “green water” and “blue water”: Water that is directly used for biomass production and “lost” in evaporation is termed “green water”, while “blue water” is the flowing water in surface and subsurface water bodies.
-
Integration of surface water and groundwater management: An infiltration of water from groundwater bodies to surface water bodies and vice versa can occur.
-
Integration of quantity and quality in water resources management: Aspects of generating, abating, and disposing of waste products have to be addressed.
-
Integration of upstream and downstream water-related interests: Conflicts, interests, and trade-offs between upstream and downstream stakeholders using water resources have to be identified and balanced out
-
-
Human system integration
-
Mainstreaming of water resources: The analysis of human activities have to involve the understanding of natural systems, its capacity, vulnerability, and limits.
-
Cross-sectoral integration in national policy development: Water policy must be integrated with economic policy. The economic and social policy needs to take into account water resource implications.
-
Macroeconomic effects of water developments: Water resource projects can have macroeconomic impacts (e.g., employment).
-
Basic principles for integrated policy-making: Assess macroeconomic conditions of effects before realizing investment; weight expected (external) costs with (external) benefits of a policy; awareness of trade-offs in short-term and long-term
-
Influencing economic sector decisions: Decisions impact water demands, availability, and quality.
-
Integration of all stakeholders in the planning and decision process: Involvement of the stakeholders in the management and planning of water resources to deal with conflicting interests between stakeholders.
-
Integrating water and wastewater management: Water is a reusable resource, hence wastewater flows can be a useful additional resource.
-
3.13.3 Implementation of IWRM
Based on the GWP, the three main pillars for implementing IWRM in practice are an enabling environment, institutional roles, and management instruments (GWP (2004)):
-
The enabling environment
-
1.
Policies—setting goals for water use, protection, and conservation.
-
2.
Legislative framework—the rules to follow to achieve policies and goals.
-
3.
Financing and incentive structures—allocating financial resources to meet water needs.
-
1.
-
Institutional roles
-
4.
Creating an organizational framework—forms and functions.
-
5.
Institutional capacity building—developing human resources.
-
4.
-
Management instruments
-
6.
Water resources assessment—understanding resources and needs.
-
7.
Plans for IWRM—combining development options, resource use, and human interaction.
-
8.
Demand management—using water more efficiently.
-
9.
Social change instruments—encouraging a water-oriented civil society.
-
10.
Conflict resolution—managing disputes, ensuring sharing of water.
-
11.
Regulatory instruments—allocation and water use limits.
-
12.
Economic instruments—using value and prices for efficiency and equity.
-
13.
Information management and exchange—improving knowledge for better water management.
For transferring the IWRM paradigm into practice, the GWP (2004) recommends an IWRM planning cycle which is illustrated by Fig. 3.25. The IWRM planning cycle contains the following elements (see GWP 2004):
-
6.

Source GWP (2000)
IWRM planning cycle.
-
Establishing Status and Overall Goals: The urgent water resource issues seen in a national context. Chart the progress toward a management framework in which issues can be addressed and agreed, such that overall goals can be achieved. Check if international agreements with the neighbors present potentials or constraints to developing a feasible management framework.
-
Build Commitment to Reform: The political will is a prerequisite for a well-functioning IWRM framework. Building or consolidating a multi-stakeholder dialogue ranks high on the list of priority actions. The dialogue needs to be based on knowledge about the matter of subject and creating awareness is one of the tools to establish this knowledge and to enable participation of the broader population.
-
Analyze GAP: Given the present policy and legislation, the institutional situation, the capabilities and the overall goals; gaps in the IWRM framework can be analyzed in the light of management functions required by the urgent issues.
-
Prepare Strategy and Action Plan: Map the road toward completion of the framework for water resource management and development as well as related infrastructural measures. A portfolio of actions will be among the outputs, which will be set in the perspective of other national and international planning processes.
-
Build Commitments to Actions: Adaptation of the action plan at highest political levels is key to any progress; full stakeholder acceptance is essential for implementation. The long-term financial commitment is a prerequisite for taking planned actions to implementation.
-
Implement Frameworks: Taking plans into reality, the enabling environment, the institutional roles, and management instruments have to be implemented. Changes have to be made in the present structure; building of capacity and capability also taking into account necessary infrastructure development.
-
Monitor and Evaluate Progress: Progress monitoring and evaluation of the process inputs; Choosing proper descriptive indicators is essential to the value of the monitoring.
Notes
- 1.
Chapter 18.3 of Agenda 21 states:
The widespread scarcity, gradual destruction and aggravated pollution of freshwater resources in many world regions, along with the progressive encroachment of incompatible activities, demand integrated water resources planning and management. Such integration must cover all types of interrelated freshwater bodies, including both surface water and groundwater, and duly consider water quantity and quality aspects. The multi-sectoral nature of water resources development in the context of socioeconomic development must be recognized, as well as the multi-interest utilization of water resources.
- 2.
A review about IWRM definitions is given by Jonker (2007).
- 3.
See Box 2 on page 22 in GWP (2000).
- 4.
Full cost accounts for the cost of withdrawing and delivering water as well as the opportunity cost plus the cost associated with economic and environmental externalities.
- 5.
Strictly speaking, this case applies only if no congestion occurs.
- 6.
See, for instance, The Dublin-Principles of the International Conference on Water and the Environment (ICWE) in Dublin, Ireland, 1992 (GWP 2000).
- 7.
That is the reason that some experts prefer to speak of water governance instead of water management, which highlights the societal character of the management process.
- 8.
- 9.
This follows from the sharing rule \(w_{i} = a_{i}/(a_{1}+a_{2}) \bar{W}\) and, hence, \( y_{i} = (a_{i}^{2}/(a_{1}+a_{2})) \bar{W}) \). Thus, \( y_{2}= (a_{2}/a_{1})^{2} y_{1}\).
- 10.
Of course, one can also select other points on the dotted line that lead to a change in the distribution ratio.
- 11.
These conditions allow to determine the optimal choice of \(w_{1}\) and \( w_{2}\), see appendix A.
- 12.
The additional value of an additional unit of a consumption good or income decreases with an increasing level of consumption. This property is called diminishing marginal utility. It makes a difference in the valuation of a consumptive item, let us say a wristwatch, whether you already have three watches on your wrist or none.
- 13.
There exists an own branch of literature that discusses the philosophical foundation of utility functions and their application in order to derive policy options. There is also a discussion on how to fix the scale of the utility units. Some important contributions to this literature are enlisted in the bibliography of this chapter, see particularly the suggested textbook by Perman (2011), and Roemer (1996).
- 14.
Recall that \(a_{1} > a_{2}\).
- 15.
The line is defined as \(U_{2} = U_{sum}-U_{1}\).
- 16.
If we further increase the consumer productivity of F2, it could well happen that G would be northwest of E.
- 17.
In the figure, we can make another interesting observation if we compare point G with point Gt: F1 is worse off in the case of the transfer system than in an allocation system without transfer. Perhaps this is also one reason why there is sometimes resistance to institutional innovations.
- 18.
- 19.
An instructive description of the main ecological interdependencies can be found in O’Callaghan (1996).
- 20.
E can also be conceived as a multidimensional vector containing an array of ecosystem services.
- 21.
Notice that the costs of water abstraction are included in the benefit function so as to save on symbols.
- 22.
Of course, human can adapt to various climate systems. For instance, nomadic tribes have adapted to arid or desert like conditions. But this implies a very low population density and also a low living standard. We do not expand our policy discussion to include the choice of the population size.
- 23.
See http://www.un.org/millenniumgoals; specifically, one finds annual summaries that report on the progress made in the previous years.
- 24.
- 25.
Note that we can also assume that the full satisfaction of physical needs is an isoquant. This would be the case when both goods are substitutable in a certain range. In the following, we keep the figure simple by identifying this level solely with a point.
- 26.
We know from the first welfare theorem that a market equilibrium is socially optimal or Pareto-efficient. In the standard microeconomic model, the equilibrium of a market system guarantees that the marginal rates of substitutions of all market participants are equalized. However, if some of these participants are very poor, it follows that the marginal rate of substitution with respect to the health production function would be equal to the marginal rate of substitution of households who could afford a consumption bundle beyond the subsistence level. If we adhere to the Sustainable Development Goals, we can not infer from this efficiency condition that the market allocation is socially optimal simply by referring to the first welfare theorem.
- 27.
In Chap. 4 we will analyze tariff systems that also cover fixed costs in depth.
- 28.
All the following results apply also to the case where water is scarce.
- 29.
We can show this with the help of the KKT conditions. Assume, per contradiction, that \(w_{1d} > 0\) and, hence, \(\lambda = 0\) by Eq. (3.45). From Eq. (3.44), we have \(B_{2}^{'}(w_{12}+w_{2}) \le 0\) and, hence, \( w_{12}+w_{2} > 0\). Thus, we have from Eq. (3.43) \(B^{'}_{2}(w_{12}+w_{2}) - c < 0 \) wherefore \(w_{2}=0\). Hence, to meet Eq. (3.44) we have \(w_{12} >0\), and therefore by Eq. (3.44) \(B_{2}^{'}(w_{12}) = 0\). Since \(B_{1}^{'}(w)< B_{2}^{'}(w), \forall w \ge 0\) we get the result that \(w_{1} < w_{12} \). But this contradicts the constraint \(h_{1} w_{1}-w_{12} \ge 0 \) (see Eq. (3.39)). Hence, \(\lambda >0 \) and therefore \(w_{1d}=0\).
- 30.
This result can also be derived from the KKT conditions. We know that \(\lambda >0\) and that \(w_{2}=0\) (due to the high marginal treatment costs \(c^{I}\)). Hence, \(h_{1} w_{1}=w_{12} > 0\) and \(B^{'}_{2}(w_{12}) = \lambda > 0\) by Eq. (3.44). Therefore, we can substitute \(\lambda \) for \(B^{'}_{2}\) in Eq. (3.42).
- 31.
Many economists are quite skeptical about allocation rules from complex models if they are taken literally in the sense that they are prescriptions for the individual actors in the watershed. However, the derivation of allocation rules only serves as a benchmark. Economists then ask under which institutional provisions the actors would behave in such a way that these rules would be adopted.
- 32.
This case is covered in Exercise 3.4.
- 33.
If \(h_{1} =1\) then water is a complete public good.
- 34.
In case that there exists no minimum outflow quantity from the addressed river section (\(r_0=0\)) we are able to formulate the following KKT conditions:
$$\begin{aligned} B_1'(w_1) - \lambda _1 - \lambda _2 \le 0 \perp w_1 \ge 0 \qquad \qquad {(3.59)} \end{aligned}$$$$\begin{aligned} \qquad \quad \,\,\, B_2'(w_2) - \lambda _2 \le 0 \perp w_2 \ge 0\qquad \qquad {(3.60)} \end{aligned}$$$$\begin{aligned} \qquad \qquad \qquad R_1 - w_1 \ge 0 \perp \lambda _1 \ge 0 \qquad \qquad {(3.61)} \end{aligned}$$$$\begin{aligned} R_1 + R_2 - w_1 - w_2 \ge 0 \perp \lambda _2 \ge 0\qquad \qquad {(3.62)} \end{aligned}$$.
- 35.
It is assumed that \(w_1> 0, w_2 > 0\).
- 36.
In scenario II, the natural inflow before the upstream user 1 is high and the natural inflow before the downstream user 2 is low.
- 37.
In case that there exists a minimum outflow (\(r_0>0\)), Eqs. (3.61) and (3.62) are nonbinding and hence \(\lambda _2=\lambda _r=0\). In case that there exists no minimum outflow (\(r_0=0\)), we would not set up the constraint (3.58) and hence \(\lambda _r\) and Eq. (3.62) would not exist. Eq. (3.61) would be nonbinding and hence \(\lambda _2=0\).
- 38.
If the present level of groundwater stock is given by \(S_0\), the deviation from steady-state groundwater stock is \(S_0 - S^*\).
- 39.
The boundaries of the water basin are determined by a river basin or an aquifer basin. Intra-regional water transfers denote the transport within one region while interregional transfers refer to transfers from one region to another. International transfers describe water transfers between two states and, by definition, an international transfer is always an interregional transfer.
- 40.
The number of suppliers and consumers is irrelevant to this problem. A situation is assumed where the benefit is maximized. This means, for instance, that a monopolist is not able to use its market power to set the monopoly price for maximizing its producer surplus because of the local price regulation.
- 41.
In line with the terminology used in this subsection, this situation is referred to as a water transfer from region 1 to region 2.
- 42.
An extraction below the maximum sustainable extraction amount (\(w_i \le w_i^{\text {SUS}}\)) does not harm environment and/or (future) society and hence fulfills the intra-generation and inter-generation sustainability.
- 43.
Synthesis Report “The European environment—state and outlook 2015”, see www.eea.europa.eu/soer-2015/europe/freshwater.
- 44.
An introduction into water quality modeling can be found in Loucks and van Beek (2005).
- 45.
Notice that the water withdrawn from the reservoir w is mixed consisting of \(\alpha _{Q} w\) pollutant and \( (1-\alpha _{Q}) w \) pure water. Thus, we can decompose exactly, what portion of the redirected water is pure water and what pollutant, i.e. \((1+e)w = (1+e)[\alpha _{Q} w + (1-\alpha _{Q}) w] \). Multiplying yields \( \alpha _{Q} w + e \alpha _{Q} w + e w - e \alpha _{Q} w +(1-\alpha _{Q})w\). The first four items belong to the discharge of pollutant, reducing to \( (e + \alpha _{Q}) w \), whereas the last term is the amount of pure water returned to the reservoir.
- 46.
A resorption function mathematically describes the self-purification capacity of a water body.
- 47.
Notice that the denominator of the right-hand side must be positive. Otherwise, the steady-state solution would be negative which makes no sense. It can be shown that the denominator is always positive if the system of the two differential equations is stable. For the following analysis, these details are not important.
- 48.
The quadratic form is due to the fact that both the benefit function and the cost function are quadratic: \(B(w)= a w - (b/2)w^2\) and \(C(w,e) = m w^2 (E-e)^2 \) where a, b, m, and \(E, E > \hat{e},\) are constants.
- 49.
Recall that the net pollutant discharge is \( w (e + \bar{\alpha }_{Q}) - \bar{\alpha }_{Q}) w \).
- 50.
If the abstraction is represented by \(w_i\), the net abstraction is \(w_i - h_i \cdot w_i = (1 - h_i) \cdot w_i\), where \(h_i\) stands for the return flow factor (share of diverted water which flows back to the water body after consumption). Therefore, the net abstraction can be calculated by multiplying the term \((1-h_i)\) with the abstraction.
- 51.$$\begin{aligned} \max _{w_{1},w_{2},w_{12}} \left[ B_{1}(w_{1}) + B_{2}(w_{12}+w_{2}) - c (w_{1}+w_{2}) \right] \end{aligned}$$(3.126)
- 52.
User 1 buys water in market 1 and, at the same time, offers treated water in market 2 by solving the following optimization:
$$\begin{aligned} \max _{w_{1},w_{12}} \left[ B_{1}(w_{1}) + p_{2} w_{12} - p_{1} w_{1}\right] \quad \text {s.t.} \quad h_{1} w_{1} - w_{12} \ge 0\qquad \qquad {(3.48)} \end{aligned}$$User 2 has the option to buy water in both markets, hence the corresponding optimization program is
$$\begin{aligned} \max _{w_{2},w_{12}} \left[ B_{2}(w_{2} + w_{12}) - p_{2} w_{12} - p_{1} w_{1}\right] \qquad \qquad {(3.52)}. \end{aligned}$$ - 53.
- 54.
If \(p_2 < p_1\) it follows that \(\left[ a_{2} - b_{2} (w_{2}+w_{12} ) - p_{2} \right] > \left[ a_{2} - b_{2} (w_{2}+w_{12} ) - p_{1} \right] \). If we set \(\left[ a_{2} - b_{2} (w_{2}+w_{12} ) - p_{2} \right] = 0\), we know that \(\left[ a_{2} - b_{2} (w_{2}+w_{12} ) - p_{1} \right] < 0\). Hence, based on Eqs. (3.134) and (3.135), we are able to derive that \(w_2=0\) and \(w_{12}>0\), respectively.
For the contrary case of \(p_2 > p_1\) it follows that \(\left[ a_{2} - b_{2} (w_{2}+w_{12} ) - p_{2} \right] < \left[ a_{2} - b_{2} (w_{2}+w_{12} ) - p_{1} \right] \). If we set \(\left[ a_{2} - b_{2} (w_{2}+w_{12} ) - p_{1} \right] = 0\), we therefore know that \(\left[ a_{2} - b_{2} (w_{2}+w_{12} ) - p_{2} \right] < 0\). Based on Eqs. (3.134) and (3.135), we are able to derive that \(w_2>0\) and \(w_{12}=0\), respectively.
- 55.
The social planner maximizes the following objective function:
$$\begin{aligned} \max _{w_{1},w_{2},w_{12}} \left[ B_{1}(w_{1}) + B_{2}(w_{12}+w_{2}) - c (w_{1}+w_{2}) \right] \ \end{aligned}$$(3.41)$$\begin{aligned} \qquad \qquad \qquad \qquad \text {subject to: } h_{1} w_{1} - w_{12} \ge 0 \end{aligned}$$(3.39)The following KKTs result from the social planner problem:
$$\begin{aligned} B^{'}_{1}(w_{1}) - c + \lambda h_{1}&= 0 \end{aligned}$$(3.42)$$\begin{aligned} B^{'}_{2}(w_{12}+w_{2}) - c \le 0 \perp w_2 \ge 0&\end{aligned}$$(3.43)$$\begin{aligned} B^{'}_{2}(w_{12}+w_{2}) - \lambda \le 0 \perp w_{12} \ge 0&\end{aligned}$$(3.44)$$\begin{aligned} h_{1} w_{1} - w_{12} \ge 0 \perp \lambda \ge 0&\end{aligned}$$(3.45).
- 56.
Assume that \(w_i=0\), then the constraint \(R - w_i \ge 0\) is certainly not binding and hence it follows that \(\lambda _i=0\). Furthermore, we know from the assumption \(w_i=0\), that \(B_i'(w_i) - \lambda _i \le 0\) which means \(B_i'(w_i) \le \lambda _i\) and hence \(B_i'(w_i) \le 0\). Therefore, we know that the marginal benefit would be negative. However, the marginal benefit for a consumption level of zero is nothing else than the choke price of the demand function of user i. The choke price is generally positive. In this example, the choke prices of user 1, 2, and 3 are \(a_1=6\), \(a_2=7\), and \(a_3=8\), respectively. Therefore, we found a contradiction for the assumption \(w_i=0\) and hence the assumption \(w_i \ge 0\) is correct.
- 57.
Under the assumption that \(w_1=R=8\), the marginal benefit \(B_1'(w_1)=-2\) would be negative which is a contradiction with the condition \(B_1'(w_1) \ge 0\).
Under the assumption that \(w_2=R=8\), the marginal benefit \(B_2'(w_2)=-5\) would be negative which is a contradiction with the condition \(B_2'(w_2) \ge 0\).
Under the assumption that the consumption of user 3 is determined by the zero of the marginal benefit, i.e., \(B_3'(w_3)=0\), it follows that \(w_3=16\). This is a contradiction to the condition \(w_3 \le R\), with \(R=8\).
- 58.
By setting equal: \(8 = \frac{80}{3} - \frac{11}{3} \cdot p\), we get the price \(p=\frac{56}{11}\). The calculated price is within the allowed range \(0 \le p < 6\). Hence, this price is the optimal solution.
Regarding the other case: \(8=\frac{62}{3} - \frac{8}{3} \cdot p\), we get the price of \(p=\frac{38}{3}\approx 5.818\) which is outside the allowed range \(6 \le p < 7\).
For the case \(8= 16- 2\cdot p\), we find a price of \(p=4\) which is outside the allowed range \(7 \le p < 8\).
References
Ambec, S., & Sprumont, Y. (2002). Sharing a river. Journal of Economic Theory, 107(2), 453–462.
Ambec, S., Dinar, A., & McKinney, D. (2013). Water sharing agreements sustainable to reduced flows. Journal of Environmental Economics and Management, 66(3), 639–655.
Asano, T. (1998). Wastewater reclamation and reuse. Boca Raton: CRC Press, Taylor & Francis Group.
Bentham, J. (2008). A Comment on the commentaries and a fragment on government, vol. 2. Oxford University Press on Demand.
Bhandari, P., & Ghimire, D. (2016). Rural agricultural change and individual out-migration. Rural Sociology, 81(4), 572–600.
Biswas, A. K. (2004). Integrated water resources management: A reassessment - A Water Forum Contribution. Water International, 29(2), 248–256.
Boelens, R., & Vos, J. (2012). The danger of naturalizing water policy concepts: Water productivity and efficiency discourses from field irrigation to virtual water trade. Agricultural Water Management, 108, 16–26.
Boumaa, J. A., Biggs, T. W., & Bouwera, L. M. (2011). The downstream externalities of harvesting rainwater in semi-arid watersheds: An Indian case study. Agricultural Water Management, 98(7), 1162–1170.
Cohen, J. S., & Weitzman, M. L. (1975). A marxian model of enclosures. Journal of Development Economics, 1, 287–336.
D’Arcy, B., & Frost, A. (2001). The role of best management practices in alleviating water quality problems associated with diffuse pollution. Science of the Total Environment, 265(1–3), 359–367.
De Graaf, I. E. M., Gleeson, T., van Beek, L. P. H., Rens, S., Edwin, H., & Bierkens, M. F. P. (2019). Environmental flow limits to global groundwater pumping. Nature, 574(7776), 90–94.
Dharmaratna, D., & Harris, E. (2012). Estimating residential water demand using the stone-geary functional form: The case of sri lanka. Water Resources Management, 26(8), 2283–2299.
Fröhlich, A. P., Kraume, I., Lesouëf, A., Phan, L., & Oldenburg, M. (2003). Neue Sanitärkonzepte für die separate Erfassung und Behandlung der Teilströme Urin, Fäkalien und Grauwasser - pilotprojekt. In: Conference Wasser Berlin 2003.
Friedler, E. (2001). Water reuse an integral part of water resources management: Israel as a case study. Water Policy, 29–39.
Georgescu-Roegen, N. (1954). Choice, expectations and measurability. Quarterly Journal of Economics, 68, 503–534.
Goncharuk, V. V. (2014). Drinking water: Physics, chemistry and biology. Heidelberg: Springer.
Grafton, R. Q., Garrick, D., Manero, A., & Do, T. N. (2019). The water governance reform framework: Overview and applications to australia, mexico, tanzania, U.S.A and vietnam. Water, 11(1).
Gupta, J., & van der Zaag, P. (2008). Interbasin water transfers and integrated water resources management: Where engineering, science and politics interlock. Physics and Chemistry of the Earth, Parts A/B/C, 33(1–2), 28–40.
GWP. (2000). Integrated water resources management. Technical advisory committee (TAC) background paper no. 4. Stockholm, Sweden: Global Water Partnership.
GWP. (2004). Catalyzing change: A handbook for developing integrated water resources management (IWRM) and water efficiency strategies. Technical advisory committee (TAC) background paper no. 5. Stockholm, Sweden: Global Water Partnership.
Hoekstra, A. Y. (1998). Appreciation of water: Four perspectives. Water Policy, 1, 605–622.
Howitt, R. E., Lund, J. R., Kirby, K. W., Jenkins, M. W., Draper, A. J., Grimes, P. M., Ward, K. B., Davis, M. D., Newlin, B. D., Van Lienden, B. J., et al. (1999). Integrated economic-engineering analysis of California’s future water supply. Project Completion Rep.
IWA, UNEP. (2002). Industry as a partner for sustainable development: Water management. London: Beacon Press.
Jakeman, A. J., Barreteau, O., Hunt, R. J., Rinaudo, J.-D., Ross, A., Arshad, M., & Hamilton, S. (2016). Integrated groundwater management: An overview of concepts and challenges, Integrated groundwater management, pp. 3–20. New York: Springer.
Johansson-Stenman, O., & Konow, J. (2010). Fair air: Distributive justice and environmental economics. Environmental and Resource Economics, 46(2), 147–166.
Jonker, L. (2007). Integrated water resources management: The theory-praxis-nexus, a South African perspective. Physics and Chemistry of the Earth, 32, 1257–1263.
Koundouri, P. (2004). Current issues in the economics of groundwater resource management. Journal of Economic Surveys, 18(5), 703–740.
Krogh, M., Dorani, F., Foulsham, E., McSorley, A., & Hoey, D. (2013). Hunter catchment salinity assessment. Final Report. NSW Environment Protection Authority, Final Advice, vol. 1.
Langergraber, G., & Muellegger, E. (2005). Ecological Sanitation - a way to solve global sanitation problems? Environment International, 31(3), 433–444.
Loucks, D. P., & van Beek, E. (Eds.) (2005). Water resources systems planning and management. An introduction to methods, models and applications. Chapter 12. Paris and Delft: UNESCO Publishing.
Lund, J. R., Howitt, R. E., Medellín-Azuara, J., & Jenkins, M. W. (2009). Water management lessons for california from state-wide hydro-economic modeling. Center for Watershed Sciences University of California-Davis.
Miller, G. W. (2006). Integrated concepts in water reuse: managing global water needs. Desalination, 187, 65–75.
Mitchell, B. (Ed.). (1990). Integrated water management: International experiences and perspectives. London: Belhaven Press.
Muschal, M. (2006). Assessment of risk to aquatic biota from elevated salinity-a case study from the Hunter River, Australia. Journal of environmental management, 79(3), 266–278.
NSW-EPA. (2003). Hunter River Salinity Trading Scheme: Working together to protect river quality and sustain economic development. Sydney: NSW-EPA.
O’Callaghan, J. R. (1996). Land use: The interaction of economics, ecology and hydrology. London: Chapman & Hall.
Olmstead, S. M. (2009). The economics of water quality. Review of Environmental Economics and Policy, 4(1), 44–62.
Ostrom, E. (1990). Governing the commons: The evolution of institutions for collective action. In series: The political economy of institutions and decisions. Cambridge: Cambridge University Press.
Perman, R. (Ed). (2011). Natural resource and environmental economics, 4th edn. Harlow: Pearson Addison Wesley. OCLC: ocn704557307.
Postel, S. (1992). Last oasis: Facing water scarcity. New York: W.W. Norton.
Pulido-Velazquez, M., Marques, G. F., Harou, J. J., & Lund, J. R. (2016). Hydroeconomic models as decision support tools for conjunctive management of surface and groundwater, pp. 693–710. Integrated groundwater management. New York: Springer.
Rawls, J. (1971). A theory of justice. Cambridge: Belknap Press of Harvard University Press.
Reed, R. A., Godfrey, S., Kayaga, S., Reed, B., Rouse, J., & Fisher, J., et al. (2011). Technical notes on drinking-water, sanitation and hygiene in emergencies. Loughborough: Water, Engineering and Development Centre Loughborough University and World Health Organisation.
Rodriguez-Iturbe, I. (2000). Ecohydrology: A hydrologic perspective of climate-soil-vegetation dynamics. Water Resources Research, 36(1), 3–9.
Roemer, J. E. (1996). Theories of distributive justice. Cambridge: Harvard University Press.
Sandel, M. J. (2009). Justice: What’s the right thing to do?. New York: Farrar, Straus and Giroux.
Schwerhoff, G., Edenhofer, O., & Fleurbaey, M. (2019). Taxation of economic rents. Journal of Economic Surveys, 34(2), 398–423.
Seeley, E. (1992). Human needs and consumer economics: The implications of maslow’s theory of motivation for consumer expenditure patterns. The Journal of Social-Economis, 21(4), 303–324.
Shortle, J. (2013). Economics and environmental markets: Lessons from water-quality trading. Agricultural and Resource Economics Review, 42(1), 57–74.
Snellen, W. B., & Schrevel, A. (2004). IWRM for sustainable use of water: 50 years of international experience with the concept of integrated water management. In: Proceedings of the Netherlands Conference on Water for Food and Ecosystems, vol. 31.
Sundermann, G., Wägner, N., Cullmann, A., von Hirschhausen, C., & Kemfert, C. (2020). Nitrate pollution of groundwater long exceeding trigger value; fertilization practices require more transparency and oversight. DIW Berlin Weekly Report, 2020(09), 14.
Tian, J., Liu, D., Guo, S., Pan, Z., & Hong, X. (2019). Impacts of inter-basin water transfer projects on optimal water resources allocation in the hanjiang river basin, china. Sustainability, 11(7), 2044.
Tortajada, C. (2012). Water management in singapore. International Journal of Water Resources Development, 23, 227–240.
UNEP International Environmental Technology Centre. (2002). Rainwater harvesting and utilisation: An environmentally sound approach for sustainable urban water management. An introductory guide for decision-makers. Kobe: Global Development Research Centre (GDRC).
Werner, C., Panesar, A., Rüd, S. B., & Olt, C. U. (2009). Ecological sanitation: Principles, technologies and project examples for sustainable wastewater and excreta management. Desalination, 248(1), 392–401.
WHO. (2019). Progress on household drinking water, sanitation and hygiene 2000–2017: special focus on inequalities. Geneva: World Health Organization.
WWF. (2007). Pipedreams? Interbasin water transfer and water shortages. Zeist: WWF Global Freshwater Programme.
Xie, M. (2006). Integrated water resources management (IWRM) - introduction to principles and practices. In: Africa regional workshop on IWRM. Nairobi: World Bank Institute.
Zhu, X., & van Ierland, E. C. (2012). Economic modelling for water quantity and quality management: a welfare program approach. Water Resources Management, 26(9), 2491–2511.
Author information
Authors and Affiliations
Corresponding author
Rights and permissions
Open Access This chapter is licensed under the terms of the Creative Commons Attribution 4.0 International License (http://creativecommons.org/licenses/by/4.0/), which permits use, sharing, adaptation, distribution and reproduction in any medium or format, as long as you give appropriate credit to the original author(s) and the source, provide a link to the Creative Commons license and indicate if changes were made.
The images or other third party material in this chapter are included in the chapter's Creative Commons license, unless indicated otherwise in a credit line to the material. If material is not included in the chapter's Creative Commons license and your intended use is not permitted by statutory regulation or exceeds the permitted use, you will need to obtain permission directly from the copyright holder.
Copyright information
© 2021 The Author(s)
About this chapter

Cite this chapter
Meran, G., Siehlow, M., von Hirschhausen, C. (2021). Integrated Water Resource Management: Principles and Applications. In: The Economics of Water. Springer Water. Springer, Cham. https://doi.org/10.1007/978-3-030-48485-9_3
Download citation
DOI: https://doi.org/10.1007/978-3-030-48485-9_3
Published:
Publisher Name: Springer, Cham
Print ISBN: 978-3-030-48484-2
Online ISBN: 978-3-030-48485-9
eBook Packages: Economics and FinanceEconomics and Finance (R0)