
Abstract
International experience suggests that China’s next energy revolution will focus on energy quality instead of quantity. China’s rapid economic growth from the 1980s has been partly driven by substantial expansion of the energy system.
DRC Team Lead of Special Report 2:
Yang Jianlong from the Research Department of Industrial Economy, DRC of the State Council of China.
Shell Team Lead of Special Report 2:
Martin Haigh, Senior Energy and Climate Change Advisor, Shell International B.V.
Contributors:
Philip Gradwell and Cameron Hepburn from Vivid Economics; Ren Xianfang from Shell China; Duan Hongbo and Liu Ying from the University of Chinese Academy of Sciences; Mo Jianlei and Ji Qiang from the Institutes of Science and Development, Chinese Academy of Sciences; and Li Zhenyu from the Petrochemical Research Institute, CNPC.
You have full access to this open access chapter, Download chapter PDF
1 From Quantity to Quality: International Experience of Energy Demand Revolutions
International experience suggests that China’s next energy revolution will focus on energy quality instead of quantity. China’s rapid economic growth from the 1980s has been partly driven by substantial expansion of the energy system. However, even if China’s economy continues to grow, the country’s energy demand will be unlikely to maintain the same growth rate in the future. In international experience, energy consumption per capita tends to be stable when GDP per capita stands at a higher level, as shown in Fig. 1. Types of energy use and fuel choice tend to change with economic growth when energy demand is stable. If China follows a path similar to international experience, the country’s energy demand will not grow in quantity, but shift focus to energy use and the quality of the fuels chosen.

Note 13th FYP = 13th Five-Year Plan (2016–20); PPP = purchasing power parity; INDC = intended nationally determined contributions. Source International Energy Agency, World Energy Balances (2016)
No need for energy demand growth in quantity when GDP per capita reaches a moderately prosperous level.
Energy demand tends to be stable when GDP stands at a higher level, which can be explained by the changes in how energy is used. Specifically, these patterns may result from changes in energy service demand (for example, travel mileage per capita) and/or improved conversion efficiency from energy to energy services. To illustrate this point, it is necessary to break down the energy intensity of GDP as follows:
Economic service intensity
Economic service intensity is the result of complex interactions between exogenous (uncontrollable) and endogenous (controllable) factors. As income rises, consumers demand increasingly more energy services (such as kilometres travelled, tonnes of steel produced, quality of lighting, etc.), which are largely related to specific needs or situations. However, even at a given income level, the travel mileage of rural residents tends to be longer than that of urban residents. Hence, if social development is accompanied by accelerated urbanisation, then even if the economy grows, the total demand of transport services may fall. This shows that by influencing endogenous factors, policymakers can guide service demand and ultimately steer the development of energy demand. However, other exogenous factors, such as geography, climate or culture, can also influence service demand, but these cannot be controlled by policymakers. It is therefore important to identify the exogenous and endogenous factors of energy service demand, for they allow policymakers to better predict and guide how energy demand develops with economic growth.
Energy conversion efficiency
Energy conversion efficiency is mainly determined by technology, and technology development is influenced by the price of energy and new equipment, regulatory standards, consumer behaviour and underlying trends in technology improvement. By breaking down energy intensity into energy services and conversion efficiency, the analysis can focus on the pure demand-side impacts of service demand before considering subsequent dynamic effects between technological progress and changing demand. Meanwhile, there are fuel-specific characteristics, which are irrelevant to service intensity and conversion efficiency but are needed by consumers. Although all fuels are energy carriers, they can be differentiated by the two dimensions of quality—cleanliness and flexibility.
Economic growth enables our society to prioritise energy cleanliness and flexibility, thus shaping the trend to high-quality energy carriers. In some cases (transport for example), this may result in improved conversion efficiency. If this trend in primary energy is not given sufficient attention, energy demand may be distorted, causing imbalance in the energy system.
If a study fails to consider the evolution from quantity to quality in energy service and carriers, forecasting errors may occur, which may lead to misleading policies. The Annual Energy Outlook published by the U.S. Energy Information Administration, gives a good example of such forecasting errors. The predictions in 1990 overestimated not only the future energy consumption level, but also the use of coal, a high-pollution fuel. Identification of the changing relationship between income and energy, and the preference of consumers for high-quality energy carriers, can help reduce these errors and improve decision-making (Fig. 2).

Note The dark line represents the predictions provided in the later versions of AEO. Source U.S. EIA, Annual Energy Outlook (1994–2014)
Predictions of US energy demand.
International experience suggests that China’s future energy demand may change by between +25% and −33% against the level of international experience as a result of the energy service demand intensity paths it follows. Assuming that conversion technologies are constant, by 2030, if the conventional energy service demand mode is followed, China’s energy demand will increase by 75% from the current level, as shown in Fig. 3. However, if the low service intensity path of international experience is taken, China’s energy demand will fall by 33%. In contrast, if the high service intensity path of international experience is followed, China’s energy demand will increase by 25%. This explains the important role of service demand in identifying China’s future energy demand path, and it highlights the possible impacts of policy interventions on energy demand.

Source Vivid Economics; International Energy Agency, Energy Technology Perspectives 2016
Changes in China’s 2030 energy demand.
Policy plays an important role in affecting service demand, especially for China’s future economic development. Impacts that can be changed by policy include those of population density on transport services, gross capital formation on industrial services, income inequality on building services, and urbanisation on agriculture energy services. These factors can explain why the difference in energy demand in the low and high service intensity paths is significant, when compared with China’s expected income level in 2030. This highlights the importance of current policies and their ability to impact long-term energy demand.
When both energy cleanliness and flexibility are considered, the fuel mix in buildings, for example, will change rapidly. As income increases, the buildings sector shifts rapidly from coal and biomass to electricity and natural gas, because these energy carriers are easy to use and do not cause local pollution. In other sectors, however, cleanliness and flexibility cannot be provided by the same energy carrier. In transport, the cleanest fuel today (electricity) has a lower driving range than molecular-based fuels (oil or in future, hydrogen) making it less flexible. Due to the absence of a dominant fuel, the energy carrier structure remains constant, unless new technologies eliminate the trade-off between cleanliness and flexibility, as shown in Fig. 4.

Source Vivid Economics
Not all sectors can see improvement in both the flexibility and cleanliness of energy carriers.
-
in buildings, it is possible to improve quickly both the flexibility and cleanliness of energy carriers;
-
in power generation, adopting gas and nuclear improves cleanliness without lowering flexibility, but renewable technologies require a trade-off between cleanliness and flexibility;
-
carriers in transport cannot improve simultaneously in flexibility and cleanliness with current technologies—future technologies may do this and eliminate the trade-off; and
-
in industry, the merit order of carriers varies by subsector—a single, representative line cannot be plotted.
Policymakers should understand these pattern changes and guide the formation of an energy system that accurately meets consumer demand, enables the efficient use of resources and restricts externalities like local air pollution or national energy security concerns. Lack of understanding of how energy demand will change and the factors causing these changes may result in an inefficient energy system that features oversupply, poor-quality fuels and an inability to achieve climate goals.
China’s transition to the new normal of slower economic growth will impact energy service and demand pathways across the entire economy, especially in industrial energy demand. Lower capital investment and less reliance on heavy industry, which previously drove economic growth, will sharply reduce the demand for industrial energy services like steel consumption, and potentially bring them back in line with international experience. However, it remains to be seen how much effort China will make to drive this change. Even if no specific policies are implemented, as China’s economy becomes more service-oriented and tangible investments peak, some regions may replicate Shanghai’s experience and see a natural peaking of industrial energy demand. The balance between industry and service-oriented economic development, and the proximity of regions to their peak capital stock (assets, plant and equipment that help with production), will determine the future level of China’s steel consumption, and therefore its level of industrial energy demand. In addition, China has experienced uneven development between its urban and rural areas. This imbalance is itself a critical determinant for energy service demand in buildings, especially at China’s current income levels, and should be understood by policymakers.
In the buildings sector, smaller housing and increasing urbanisation will drive the transition to higher-quality energy carriers. China’s high urban population density and relatively small housing floor areas will drive the transition to cleaner and more flexible fuels in buildings. As more and more rural areas are urbanised and energy access channels are expanded, the demand for high-quality fuels rather than high-quantity fuels may surge. Policymakers should ensure that investments in energy carrier supply networks match future consumer demand rather than current income levels, or their investments may restrict consumers’ energy choices or result in energy waste.
1.1 Energy Services
In this special report, energy service is defined as the final output used by consumers, such as lighting, steel products or travel mileage. By analysing the demand modes of these energy services instead of energy consumption itself, the changes in potential demand modes and efficiency can be separated.
Energy service demand may vary with income and structural factors. Some structural factors may be affected by policies, for example, capital investment and urbanisation; other structural factors, such as climate and culture, are the fixed endowments of a country. In general, energy service demand grows as consumer incomes increase, but this relationship is not necessarily stable and may even be reversed.
If structural factors in energy service demand are not considered, the predictions for energy demand may be inaccurate. Without understanding the changes in service demand modes and the drivers behind such changes, the forecasts and the policies based on them may rapidly lose their relevance.
Using historical data of international service demand, this study identifies common development trends, classifies them into high and low demand pathways, and identifies their potential drivers. The aim is to: (i) provide insights into how energy service demand changes as incomes increase; (ii) identify the range of demand in international experience; and (iii) determine how policies can impact future demand.
The methodology of this study includes the following steps:
-
(1)
collect global panel data (multidimensional measurements over time) on energy service demand, GDP and structural factors;
-
(2)
plot the mean line into the third-degree line of best fit through all data points (across all countries and periods);
-
(3)
split all data points into $5,000 GDP per capita tranches ($0–5,000, $5,000–10,000, etc.);
-
(4)
identify the high and low service demand pathways as the lines of best fit through the top and bottom quartiles of service demand across each $5,000 GDP per capita tranche;
-
(5)
highlight China’s current values (by province or city, if applicable) and third-party forecasts of China’s energy service demand in 2030;
-
(6)
identify the explanatory drivers of the variations in service demand; and
-
(7)
plot the lines of best fit through the data points that make up the top and bottom quartiles of each explanatory driver in each $5,000 GDP per capita tranche.
As indicated by the data analysis in international experience, energy demand comes mainly from four sectors. This study analyses the key service in each sector as a proxy indicator of the sector as a whole.
Transport: 28% of global final energy demand—excluding chemical feedstock.
-
Proxy indicator: Road passenger and freight make up 77% of transport energy demand (22% of total energy demand).
Industry: 35% of global final energy demand—excluding chemical feedstock.
-
Proxy indicator: Iron and steel production accounts for 28% of industrial energy demand (10% of total energy demand).
Buildings: 34% of global final energy demand—excluding chemical feedstock.
-
Proxy indicator: Lighting emissions are an effective instrument for measuring building energy services.
Agriculture: 3% of global final energy demand—excluding chemical feedstock.
-
Proxy indicator: Beef, pork and poultry account for 60% of agricultural energy demand (2% of total energy demand).
1.1.1 Transport
China needs policies that guide transport service demand. Overall, China’s transport service demand is very close to the average seen in international experience. Given this, and the fact that transport service demand, according to international experience, does not plateau until very high income levels are reached, it is likely that the expected 2030 demand level will not occur without guiding policies, as shown in Fig. 5.

Note 2DS = the IEA’s pathway representing a 2°C goal for limiting global warming; PPP = purchasing power parity. Source OECD; IEA, Energy Technology Perspectives; National Bureau of Statistics of China
Comparison of China’s transport model with international experience.
Population density is a key factor in travel mileage, so urban planning could be a means to limit transport service demand, without constraining people’s choices. In international experience, more densely populated countries have lower levels of road travel than scarcely populated countries at the same level of income. As Fig. 6 shows, transport service demand in South Korea and Finland differ greatly, despite their similar income levels. Should China wish to limit the growth of transport service demand, it could do so by increasing population density and urbanisation. Given current urbanisation patterns in Shanghai and Beijing, for example, this should be possible.

Note PPP = purchasing power parity. Source OECD; IEA
Higher population density can restrict transport service demand.
1.1.2 Industry
China’s demand for energy services in industry is higher than international levels, but there is uncertainty as to whether this trend will continue. China’s current steel demand is double that of the high path level of international experience. Given this fact, China needs to make great changes to get to the low path level. Even if no change is made, China’s steel demand will remain at the high end of international experience in 2030. However, steel demand in some provinces (Shanghai, for example) has peaked and started to decline. If such a trend is replicated in other provinces, China’s future steel demand may stabilise early and converge with international experience by 2030.
Gross capital formation can explain the difference between the high and low paths in international experience at the GDP per capital level of $30,000. This shows that China’s steel demand and related energy consumption may decrease with slowing investment in fixed assets—a process that may occur naturally as capital stock reaches saturation. Much of China’s infrastructure has already been constructed, so the need for more investment may decline in the coming years, as shown in Fig. 7.

Note Province-level steel demand is measured by gross fixed asset formation; PPP = purchasing power parity. Source World Steel Association; IEA; National Bureau of Statistics of China; PricewaterhouseCoopers (PwC)
China’s steel demand exceeds that of most countries.
Another important factor is whether China’s goal is to maintain its leadership in exporting heavy industry products or transition to a service-oriented economy. Just like China, South Korea’s economy is dominated by heavy manufacturing. South Korea has the world’s highest steel consumption per capita, as shown in Fig. 8. However, if China decides to build a service-oriented economy, as the UK did in the 1990s, demand for industrial services will decrease sharply. Such a shift in China’s industrial structure may impact future industrial energy demand. Some provinces in China may retain their export-oriented heavy industry, while others may switch to a service-oriented economy. How to balance these development options and how close each province is to its peak capital stock will determine China’s future steel demand and industrial demand for energy.

Note GCF (gross capital formation) = change in gross economic fixed assets; PPP = purchasing power parity. Source World Steel Association; IEA; World Bank
Physical capital investment is a key factor in China’s industrial energy demand pathway.
1.1.3 Buildings
The range of energy service demand for China’s buildings is wide even in 2030. In the low case, based on IEA’s 2DS scenario, China’s energy service demand for buildings may remain almost constant to 2030, which is not in line with historical experience. As most Chinese cities lie within general international experience, the deviation required for the 2DS case suggests changes in efficiency or economic activity. For example, in Alxa, Inner Mongolia, high secondary industry output causes GDP per capita to be extremely high, while building energy services remain low as income largely does not remain in the city. This is in contrast to Sanya, Hainan Island, where the nature of the tourism-dominated economy causes building energy services to be outside the range of most international experience at that income level (Fig. 9).

Note Light per arc minute index = light emissions per arc minute/(population density) ^0.5; China 2030, based on lighting energy consumption forecasts in IEA Energy Technology Perspectives; major oil producers are excluded due to flare; 2DS = the 2°C goal for limiting global warming; PPP = purchasing power parity. Source National Oceanic and Atmospheric Administration (NOAA); IEA; Socioeconomic Data and Applications Center (SEDAC); Beijing City Lab (BCL); Vivid Economics
China’s current building energy service demand is consistent with international experience.
Income inequality can restrict energy access and result in low energy service demand at a higher income level. In international experience, income inequality plays an important role in explaining the variation between the high and low pathways at a given income level. This is especially the case at China’s 2013 income level, where income inequality explains the 53% variation in high and low demand for energy services in buildings. If China’s development is accompanied by an increase in income equality, a higher level of building energy services should be provided than if income growth was unequal.
1.1.4 Agriculture
China’s agriculture energy service demand is consistent with that of most countries, with only very slight growth expected. The difference between the high and low paths in agricultural services is largely due to strong cultural factors—predominantly vegetarian countries such as India are unlikely to ever have high meat consumption, while in most South American countries meat makes up a high percentage of the diet. In absolute terms, China consumes a large quantity of meat (28% of global meat and 50% of all pork), but its meat consumption per capita is still lower than that in the high path of international experience. As predicted by the Food and Agriculture Organization of the United Nations (UNFAO), meat consumption will not change significantly by 2030, which may be due to a change in meat-eating behaviour. This can be seen in the recently revised dietary guidelines issued by the Chinese Nutrition Society to tackle the societal and health effects of excessive meat-eating.Footnote 1
Urbanisation enables substantial economies of scale for cold-storage supply chains, lowering prices for meat and increasing demand. Urbanisation helps centralise market demand, justifying the fixed capital expense of large cold-storage facilities that reduce transport costs for meat producers. The effect of urbanisation is more pronounced at lower levels of income: when disposable income is low, meat is a luxury and differences in price equate to large changes in consumption. At higher income levels, meat becomes a staple and is less sensitive to price movements. When GDP per capita is $30,000, the difference in meat demand between high and low levels of urbanisation accounts for only 17% of the variation between the high and low demand paths, whereas it accounts for 39% at China’s current income levels. It is important for China to understand the potential impacts on meat demand of further increases to its high urbanisation rate, but also the possible effects of rising income on attitudes towards meat-eating (Figs. 10 and 11).

Note Province-level meat consumption based on consumption data in 2011; PPP = purchasing power parity. Source Food and Agriculture Organization of the United Nations (FAO); IEA; National Bureau of Statistics of China; National Grains and Oil Information Center (NGOIC)
China’s meat consumption is consistent with international experience.

Note PPP = purchasing power parity. Source FAO; IEA; World Bank
Urbanisation and accompanying cold-storage supply chains are two key drivers of meat consumption.
1.1.5 Lessons from International Experience
As suggested by international experience, China’s energy service demand tends to go through structural change at its current level of GDP per capita. Figure 12 clearly shows that energy service demand changes over time: China is approaching levels of income where the relationship between GDP per capita and service demand begins to plateau. By identifying structural change and understanding the impact of policy on service demand, China’s decision makers can develop policies to guide service and energy demand, thus maximising benefits and avoiding wasted investment.

Note For buildings, transport and industry: 1 = service level per capita in the USA 2013; for agriculture, 1 = service level per capita in the USA 2011; P-km = passenger travel in km; PPP = purchasing power parity. Source IEA; National Oceanic and Atmospheric Administration; Food and Agriculture Organization of the United Nations; OECD; World Steel Association
Demand for key services develops differently with economic growth.
Transport demand tends to plateau at a very high level of GDP per capita, but large infrastructure projects like high-speed rail may enable China to follow a completely different pathway. International experience suggests that transport service demand increases almost linearly with income. Before applying this trend to China, it is necessary to understand China’s unique context. For instance, China has developed its high-speed rail network faster than any other country. Before April 2007, China had no high-speed rail; now it has more kilometres of high-speed rail line than the rest of the world combined. Such a high level of infrastructure development may increase transport service demand but may also decrease road transport demand and improve energy efficiency in the sector. It is therefore important to take China’s infrastructure into account when considering which service demand path to follow in the 2°C scenario. In addition, China’s historical experience suggests that large-scale deployment of infrastructure investment within a short time can gradually change service demand. For example, China has built many airports, creating a market for energy-intensive air travel. International experience might therefore not be a good predictor for future Chinese transport pathways, and policymakers should continually update their expectations as the infrastructure landscape changes.
China’s industrial energy demand is very high relative to international experience. Whether this trend will continue in the context of China’s new normal of slower economic growth is unclear. China’s current high levels of industrial service demand are largely driven by its heavy-manufacturing sector and significant levels of fixed capital investment. However, this growth model is widely believed to be unbalanced and unsustainable, so China’s new normal economy is shifting investment away from heavy industry to high value-added services. This indicates that industrial service demand will not continue on its previous growth trend. Shanghai’s transition to a service-oriented economy, and the associated fall in service demand, can act as a case study for other provinces in China. However, this process will not be uniform across the country. Some provinces may retain their export-oriented heavy industry, while others may move towards a service economy. How to balance these development options, and how close each province is to its capital stock peak, will determine China’s future steel consumption and its level of industrial energy demand.
China’s somewhat imbalanced urban-rural growth, due to the hukou residential registration system as well as relatively low expenditure on social services, has limited the demand for building energy services. China’s new normal economy highlights higher quality growth, which covers social equality to some extent. China’s rural areas will likely see the greatest change in development, as there is clearly capacity for welfare improvement and investment. This will not only increase social wealth, but also reduce the economic imbalance between urban and rural areas. The positive correlation between building energy service demand and the urban-rural imbalance indicates that China’s building energy demand may grow sharply.
Agricultural energy service demand will peak early, but it only accounts for a very small proportion of total energy use. China is at the income level where, in international experience, meat consumption growth begins to slow down. This, combined with the small share of global energy that agriculture accounts for, makes this sector a lower priority for policymakers. However, as urbanisation increases and the cold-storage supply chain it drives matures, meat consumption in rural areas will increase and counteractive policies will be needed. Cultural attitudes towards different meats may also bring unexpected changes to the energy system. Demand for beef, which accounts for only 8% of meat consumption in China, is currently being met by imports rather than domestic supply. Given China’s goal of reducing meat consumption and CO2 and methane emissions from the livestock industry, the supply and demand sides of meat may need to be addressed in the future.
1.2 Energy Carriers
Energy carriers are fuels that can be converted to provide a useful service, such as light or heat, or drive a physical process like powering a car. Common energy carriers are fossil fuels, electricity and biofuels such as wood. The quality of an energy carrier can be defined along two dimensions:
-
cleanliness: the ability to provide energy without producing local pollutants, measured in particulate matter (PM10) emissions; and
-
flexibility: the convenience and effectiveness of using the energy (in joules) carried by an energy carrier in a specific sector.
In international experience, as income increases consumers demand not only more energy but higher quality energy carriers. While relative prices are undoubtedly important in determining the carrier mix, even countries with large endowments of cheap, low-quality fuels, such as coal, tend to switch to higher-quality carriers as they develop. This indicates that rising incomes allow consumers to prioritise and pay for quality characteristics such as cleanliness and flexibility.
For some sectors, there is no single carrier that offers improvements along both quality dimensions. This has limited their transition to new carriers. In sectors where a single carrier offers improvements in both cleanliness and flexibility, such as electricity in the buildings sector, transitions occur quickly. In contrast, change is insignificant in sectors, such as transport, where, for all carriers, there are trade-offs between cleanliness and flexibility. However, it should be acknowledged that future technologies may eliminate existing trade-offs and so trigger future energy carrier transitions.
This section uses international experience to illustrate how shifts to high-quality carriers have occurred in different sectors and discusses potential pathways that China could take. The analysis shows that Chinese consumers are approaching income levels where cleanliness and flexibility are valued more than energy at the lowest possible cost. Policymakers should recognise these patterns of carrier demand. Many fuels have expensive supply chains and countries should avoid locking themselves into a dirty and inflexible carrier mix if consumer demand is about to shift to cleaner and more flexible fuels.
This study uses a consistent methodology to analyse the development of international energy carriers in four fields: buildings, power generation, transport, and iron and steel. The methodology comprises the following steps:
-
(1)
collect global panel data (multidimensional data on measurements over time) on energy carriers in different sectors;
-
(2)
for each sector, choose an appropriate definition of flexibility and identify fixed factors for cleanliness and flexibility for each energy carrier per joule of energy—as factors are fixed, technology is assumed to remain constant across time and countries;
-
(3)
calculate the values of cleanliness and flexibility for each sector, country and observation in time, and normalise them to the sample average value;
-
(4)
plot, as a third-degree line of best fit through all data points (across all countries and all time periods), the average line in a sector for each dimension of quality;
-
(5)
divide the data into $5,000 tranches and identify the top and bottom quartile data points for each dimension of quality;
-
(6)
plot the high and low path lines of best fit through the top and bottom quartile data points of energy carrier quality across each $5,000 income tranche; and
-
(7)
highlight China’s current values and third-party forecasts of China’s energy demand in 2030.
1.2.1 Buildings
In the buildings sector, excess air ratio is a proxy for the flexibility of an energy carrier. Excess air ratio is the amount of air above the stoichiometric air quantity ratio (the absolute minimum amount of oxygen required for complete combustion of the fuel) that is required for a fuel to burn effectively. It is used as a proxy indicator for the size of equipment needed to convert the carrier fuel into a useful energy service, such as heat. The most flexible energy carrier is the one that can be used without large equipment, as space is limited in buildings. According to this definition, electricity is flexible, while coal generally needs a large amount of excess air to combust to avoid emitting harmful carbon monoxide, making it difficult to use in buildings.
Because it is possible to improve both cleanliness and flexibility simultaneously in buildings, changes in the carrier mix have occurred rapidly. International experience shows that buildings have shifted quickly towards electricity and gas as incomes have risen. This is because electricity and gas are cleaner and more flexible than the other available energy carriers. The income-driven improvements in both aspects of carrier quality are clearly evident in Fig. 15. Belgium and the UK are examples of countries that have made rapid transitions to higher-quality fuels in this sector.
1.2.2 Power
Flexibility in the power sector is dependent on the capacity factor and the cost of transmission infrastructure for different methods of generation. A composite factor accounting for both the temporal and spatial flexibility of different generation methods is used as a proxy for the flexibility of carriers in the power sector:
The capacity factor is the ratio of a power plant’s actual output relative to its potential output if it were to run all the time. It captures temporal flexibility and is low if the installation cannot generate electricity consistently over time. The capacity factor is therefore small for variable renewables, such as solar and wind, but large for dispatchable technologies, such as gas-powered generation. To capture the value of having power when needed, missing capacity is priced at the lowest levelised cost of dispatchable electricity, which here is assumed to be gas. System costs represent the spatial flexibility of carriers and are proxied by how costly it is to move power generated from the plant to the transmission grid. Renewable technologies tend to perform relatively badly in terms of system costs, as they are spatially distributed and can require significant grid investments to distribute power. In contrast, most dispatchable technologies have small system costs.
In power generation, cleanliness can be improved without compromising flexibility, but it is impossible to improve the two quality dimensions simultaneously. As shown in Fig. 13, as incomes increase, the cleanliness of power generation gradually improves. This is mostly driven by the uptake of gas and nuclear generation capacity, which emit only a fraction of the pollutants of oil and coal generation. However, these improvements in cleanliness are not as fast-paced as in the buildings sector, as switching to cleaner carriers does not carry similar flexibility benefits. Even so, there are examples of very fast transitions. The adoption of the Messmer Plan in France in the 1970s and its rapid deployment of nuclear capacity is an example of such a rapid transition towards cleaner fuels.

Note The lower the value, the higher the cleanliness and flexibility—approaching 0 implies improvement. 2DS = the 2°C goal for limiting global warming; PPP = purchasing power parity. Source IEA; UK National Atmospheric Emission Inventory
Rising income can drive improvements in fuel quality when there are no trade-offs.
There is no clear relationship between power generation flexibility and income, but increased uptake of renewable energy or improvements in technology may change this. International experience shows that the flexibility of the carrier mix in power generation remains relatively stable as incomes grow. This is mainly because most energy systems are simply scaled up as incomes rise and because all dispatchable technologies offer similar flexibility. However, we do see a sudden drop in flexibility among countries that have adopted large volumes of renewable generation. This is the case with Denmark, which adopted significant amounts of wind generation in response to the oil crisis in 197 The variable nature of renewable power makes it costly to integrate into the power system, and consequently it has a flexibility factor that is an order of magnitude worse than that of dispatchable generation. This highlights the trade-off between cleanliness and flexibility that has limited the global uptake of renewables to date. However, should battery technology improve and eliminate trade-offs, it may lead to a rapid uptake of renewables by removing the flexibility issues of renewable generation. In contrast, if trade-offs remain but countries decide to take up renewables to improve cleanliness regardless, then flexibility may begin to trend downwards with increasing incomes, at a cost to consumers.
1.2.3 Transport
In transport, there is a clear trade-off between cleanliness and flexibility, which prevents shifts to other fuels. Fuel shifting has been almost non-existent in the transport sector since the 1960s, and petroleum continues to dominate transport energy use in all countries. While there has been a recent push towards cleaner energy carriers, particularly electricity, it cannot yet match the flexibility of petroleum with current technology. The best, modern electric cars can travel up to 350 km on a single charge, while the best diesel cars can reach more than 1,200 km on a single tank of fuel. Although electricity has a better conversion efficiency rate than any other carrier, the low energy density of a battery gives it one-tenth the flexibility of diesel, as shown in Fig. 14. The lack of recharging stations, compared to petrol stations, puts an additional constraint on undertaking long journeys with electric vehicles. Until technology improves to the point where this trade-off between different aspects of quality no longer has to be made, transport will likely continue to be a mono-fuel sector.

Source Next Green Car Ltd.; University of Birmingham (fuel data sheet) Staffell
Electric transport is less flexible than internal combustion engines.
Flexibility is difficult to define for the industrial sector, as different subsectors use fuels in different ways for different purposes. We derived flexibility factors in the industrial sector econometrically, using fixed-effect regression to compute the gain in gross value-added for each subsector from a 1% shift from coal to other energy carriers. However, the range of processes within each industrial subsector, and the potential for an energy carrier to be used as a feedstock rather than as a fuel source, means that a singular merit order cannot be identified for industry as a whole.
1.2.4 Iron and Steel
In iron and steel manufacturing, the largest industrial subsector in China, electric arc furnaces can, to some extent, improve cleanliness without sacrificing flexibility. Currently, there are two major steelmaking technologies: basic oxygen furnace (BOF), which uses molten iron as the raw material; and electric arc furnaces, which use scrap steel. If electricity is provided by coal-fired power plants, electric arc furnaces use around one-fifth of the coal of the BOF process to produce the same amount of steel. However, this assumes that scrap steel comes at no energy cost, whereas molten iron needs to be extracted using coke. In addition, the BOF process produces a large amount of particulate matter pollution, which needs careful collection and management. For primary steel production there is a trade-off between cleanliness and flexibility, whereas electricity can offer improvements along both quality dimensions for scrap steel.
1.2.5 Lessons from International Experience
International experience suggests that consumers switch to higher-quality energy carriers as incomes rise, and that technology improvements may trigger further shifts. With this in mind, it is possible to tailor the energy system to the preferences of future consumers, rather than locking it into a low-quality carrier that will ultimately reduce benefits. However, policymakers should understand the unique trade-offs for each sector, as these will likely lead to different rates of demand-driven carrier changes.
China is currently near the low path of both quality dimensions within the buildings sector, but the relatively high density of its urban areas may cause carrier mix changes to occur faster than international experience suggests. Both cleanliness and flexibility become more important in buildings as population density increases. As local pollution is a negative externality upon an entire area, a highly dense population might be willing to pay a higher price for clean energy carriers than rural societies. The high cost of land and relatively small living space, as shown in Fig. 15, will increase the value of a flexible fuel that can be more easily used in confined spaces. It is difficult to imagine a coal or wood heating system being used in the confines of future small urban households. The public demand for cleaner and more flexible carriers in buildings is, therefore, likely to increase as China continues its urbanisation, and policymakers should prepare for this.

China’s average home size indicates higher population density
Iron and steel production in China uses increasing amounts of electricity. The pressure this places on the power system may require planning. The large, dynamic loads of electric arc furnaces can reduce the quality of power for other consumers in the locality. To manage this, power stations should be located as close as possible to the electric arc furnace to minimise disturbances such as flickering. The recent uptake of electricity in iron and steel manufacturing has been fast, doubling between 2006 and 2014. It now accounts for 18% of total energy use in the steelmaking sector. If this trend continues, careful consideration will be needed on how to adapt the power grid to accommodate this increasing industrial demand for electricity.
China’s power generation is dominated by coal, but higher generating capacity and expertise in solar generation may lead to a cleaner but less flexible system. China is currently better than the average path of international experience in cleanliness within the power sector. Hydropower makes up 19% of generation, and while 73% of China’s electricity generation is currently provided by coal, it is still a cleaner carrier than heavy fuel oil which is used for power generation in some countries. China is expected to continue this improvement in cleanliness up to 2030, although seemingly at the expense of flexibility if scenarios by the International Energy Agency are to be believed.
Despite China’s deployment of high-speed rail, road vehicles still dominate energy consumption in transport and almost exclusively use oil. Until technology develops to the extent that long-distance journeys can be reliably made with alternatively fuelled vehicles, there is unlikely to be any large energy carrier transition in this sector. While China accounted for 46% of all electric vehicle sales in 2016, the sector has seen disappointing growth and represents only around 1.3% of total car sales.
1.3 Conclusions
The energy system is driven by energy demand, and energy demand itself is driven by consumer demand. For policies to remain effective, the shifting nature of consumer demand must be recognised and catered for. Investing in energy that is not demanded is a misuse of resources and may actively reduce welfare by limiting future consumer choices if networks are locked in patterns of demand.
Consumer demand is more complex than simply demand for the greatest quantity of energy at the lowest cost. International experience shows that rising incomes will change consumer demand for energy services and allow consumers to pay for higher-quality carriers that are cleaner and more flexible than existing fuels such as coal.
Consumer demand for energy tends to shift from quantity to quality as incomes increase, and China is likely to cross this inflection point in the near future. The shift from quantity to quality involves a plateauing of service demands and increasing use of higher-quality fuel carriers. Rapid changes are possible should the drivers of service demand undergo a large shift, or if technology developments facilitate universal shifts to higher-quality energy carriers within a sector.
Hence, future energy demand cannot be projected on the basis of one country’s historical patterns of consumption, but should be based on international experience, taking into account local characteristics. Historical experience is useful for identifying a baseline trend and a set of possible outcomes, but it should not be taken as an accurate predictor of the future. How local characteristics naturally develop or react to new policies will largely determine future consumer demand. China’s shift towards the new normal of slower economic growth will, for example, reduce the share of energy-intensive heavy industry and increase the rate of urbanisation in rural areas.
However, these demands can also be shaped by policy to ensure resources and energy are used efficiently or to limit externalities. Many factors can play a role in changing consumer demand and preferences. They include economic structure and investment, population density, equality of access, support networks for clean and flexible fuels, and support technology that enables universal improvements in energy quality. Nudging energy service demand can help mitigate long-term negative externalities such as climate change and enable a more desirable use of resources to improve efficiency without jeopardising benefits.
An efficient system can be adopted by taking into account changing service demand trends and the shift towards higher-quality fuels, and by using policy to shape demand. Policymakers should aim to design an energy system that will meet future consumer demand. However, they should also take advantage of the ways they can shape it to avoid irrational energy consumption, achieve climate targets and other long-term goals, and improve resource-use efficiency.
2 Model Building
2.1 Model Description
3E models provide an integrated view on energy, the economy and the environment. They combine an optimal growth model based on neoclassical economic theory and an infinitely lived agent (ILA) model that follows the Ramsey Rule. 3E models describe economic operations through investment, consumption and the accumulation of capital. They use the traditional top-down approach, while providing richer technical content.
Our 3E model examines how fossil and new energy fuels evolve into dominant fuels in a sequential manner, using a built-in logistic sub-model of policy. In addition to fossil energy, the technical objects studied include seven low-carbon or zero-carbon energy sources: nuclear, biomass, hydropower, solar photovoltaic, wind, geothermal and marine energy. This enables our model to cover more bottom-up modelling characteristics and explore the role of zero-carbon energy technologies in reducing carbon emissions.
Another advantage of this richer technical approach is that it helps endogenise energy technologies and describe dynamic technological progress with an empirical curve based on learning by doing. This will significantly reduce the uncertainty in model results caused by exogenous technological progress, thus improving the robustness of the model’s calculations. It must be noted that the model built for this section is a regional 3E integrated system model for a single sector—the energy industry. The specific model architecture and operation routes are shown in Fig. 16.

Note CUM = cumulative carbon emissions; ET = energy technology; NET = new energy technology
Block diagram of the optimal 3E integrated system model for growth.
The model assumes the existence of a forward-looking central planner who maximises society-wide utility by choosing the optimal path of decision variables, including investment and consumption. Utility here is measured mainly by consumption per capita (c), so the objective function of this model can be expressed as:
where:
L is population, and the utility discount factor is measured by time preference rate \( \sigma \), and
\( d_{\sigma } \) is the annual decrease factor.
2.1.1 Economic Sector
The production process of the model is mainly described by the Cobb-Douglas production function, constant elasticity of substitution (CES). The input factors include capital (\( k_{t} \)), labour (\( L_{t} \)), and energy (\( e_{t} \)), i.e.:
where:
\( y(t) \) represents output and \( \alpha \) represents the level of technological progress achieved by the combination of capital and labour. \( \beta \) describes automatic progress in energy technologies, including the improvement in energy efficiency from non-price factors. \( \gamma \) and \( \rho \) respectively represent the constant elasticity of substitution between the share of capital and energy, and the capital-labour combination and energy. The capital stock in a new period is expressed as the capital discount stock in the previous period plus new investments in the current period (\( i \)):
To enable the model to describe gross domestic product (GDP) as a two-way relationship between energy input and economic output, the study defines GDP as the difference between output and energy cost:
Energy cost is expressed as the product of energy input and composite energy price (\( pe \)), i.e.
In addition, the allocation flows of GDP mainly include investment, consumption, and imports and exports (when energy R&D is considered, total R&D expenditure should also be included):
where:
\( x \) and \( m \) respectively represent imports and exports. In light of China’s historical import and export conditions, the model also sets the lower limit of the share of exports in GDP (\( \theta_{1} \)) and the upper limit of the share of imports in GDP (\( \theta_{2} \)):
2.1.2 Energy Sector
The multiple logistic curves of policy intervention represent the core part of the energy module in the model. By building the logistic curves into the model, the study can enrich technical details of the traditional energy-economy endogenous growth model. It facilitates bottom-up analysis of how the substitution of new energy technologies for fossil fuels evolves. It also calculates the impacts of environment policies, like carbon tax and renewable energy subsidies, on economic and energy systems. The classic logistic model can be expressed as:
where:
\( s_{i} \) is the share of energy technologies in the market and \( a_{i} \) is the substitution parameter. Obviously, the model above cannot take into account the potential of various energy sources and the impact of policy incentives on the evolution of energy technologies. Hence, the model is further improved as:
and
On the left side of the model, the relationship between share and time is modified as the relationship between share and relative price pi, and pi is expressed by the price ratio between the reference technology (fossil energy technologies, such as coal) and the new energy technology. Such policy variables as the ad valorem rate of carbon tax \( \tau \) and renewable energy subsidy rate \( \eta_{i} \) are also introduced to ensure that the price ratio has reflected the impact of environmental policies on change of relative price. In addition to the impacts of price changes, the price ratio will also be affected by carbon tax and subsidy policies—when the carbon tax rate or subsidy rate increases, the relative price ratio will also increase, driving substitution of zero-carbon new energy for conventional fossil energy. Moreover, the market potential of various energy technologies can be expressed with the parameter Si, and therefore \( 0 \le s_{i} (t) \le S_{i} \le 1 \).
The finite difference equation tends to be easier for working out the numerical iterative solution than the continuous differential equation, so the study differentiates Eq. (11) into the following form.
The new energy cost in the model is mainly described by the empirical curve of learning by doing, i.e. the unit cost of each technology will decrease with its increased accumulated installed capacity:
where:
\( c_{i} (0) \) is the initial energy cost and \( kdg_{i} \) is the knowledge stock of technology \( i \) which is generally characterised by the cumulative installed capacity, i.e. the knowledge stock in a new period is the knowledge stock in the previous period minus outdated knowledge factors, plus the new installed capacity of the technology in the current period:
where:
\( \psi \) is the knowledge depreciation rate (also known as out-of-date rate). In Eq. (14), Parameter \( b_{i} \) is the learning index, and its relationship with the learning rate is:
Learning rate is generally defined as the rate of cost reduction induced by a doubling of cumulative production or installed capacity. In addition, the model’s treatment of fossil energy price change is relatively simple—it assumes that the future price of fossil energy will rise due to resource scarcity and an increase in uncertainty in energy imports; it then sets the annual average growth rate to define the fossil energy price change exogenously. Therefore, the composite price of each energy source can be obtained by weighting the share of the energy source in primary energy consumption, i.e.
Climate change is a global challenge, and there are many uncertainties in defining the impacts of regional carbon emissions on atmospheric concentrations and rising global temperature. What’s more, the environmental losses (especially non-market losses) are very difficult to measure accurately. Therefore, the model simplifies the environment module in the traditional integrated assessment model (IAM)—it only takes into consideration the man-made CO2 emissions from production activities and the cumulative emissions from natural net emission factors, excluding the feedback into production activities from the greenhouse effect caused by emissions. The emission equation is given below:
where:
\( emis(t) \) is man-made emissions, i.e. the product of fossil energy consumption and carbon emission factor \( \xi_{f} \), and \( s_{f} (t) \) is the share of fossil energy consumption:
where:
\( natem(t) \) represents the annual natural emissions from China’s landmass and ocean. Annually cumulative carbon emissions \( cumem(t) \) can be expressed as:
where:
parameter \( sr \) is the natural sinking rate of CO2.
2.2 Data Processing and Parameter Estimation
The model built in this section is a cross-period dynamic optimisation model for China. Starting from 2010, the model defines every five years as a period, and looks at the policies for 2015–50. According to the latest data from the National Bureau of Statistics (NBS) of China, by the end of 2010, China’s total population was 1.341 billion. Moreover, based on research on China’s future population by Men Kepei et al.Footnote 2 and predictions by the World Bank, China’s population is assumed to peak at 1.47 billion. Other key macroeconomic initial values and parameter values are given in Table 1.
In addition to such fossil energy sources as coal, oil and natural gas, the model also looks at seven non-fossil energy sources: biomass, nuclear, hydropower, geothermal, solar photovoltaic, wind and marine energy. The consumption of each energy source in the base year uses the coal equivalent calculation data in the China Statistical Yearbook 2011. See Table 2 for details.
It is difficult to obtain the initial energy cost. For easy quantitative calculation by the model, the study chooses the unit end-use cost of each energy source (RMB/tce). Fossil energy cost is the average of the coal price in China, the international crude oil price and the price of imported natural gas. The cost of using new energy technologies varies greatly due to their varying installed capacity, technological level and method of utilisation. Based on the estimated cost fluctuation of various renewable and new energy technologies by Anderson et al.Footnote 3 and Gerlagh et al. and in the Energy Report 2050 by the China Energy and Carbon Emissions Workstream, the study calculates the initial energy cost of each energy source as shown in Table 2.
In this model, wind energy is considered for power generation, without distinguishing between onshore and offshore wind power. Solar photovoltaic (PV) and marine energy are also considered for power generation only, but biomass and geothermal energy are considered for both power generation and non-electricity uses, with the focus on the latter. In addition, due to lack of official data on the systematic introduction of renewable energy, the data used in this study is estimated, based on the China Statistical Yearbook 2011, the Annual Report on Electricity Regulation 2010 and World Energy Resources 2010 published by the World Energy Council. As the share of renewable energy in China’s primary energy consumption is very small, the model results are insensitive to these initial data.
The substitution parameters and technical learning rate in the logistic model of policy are provided in Table 2. The substitution parameter in this model refers to the key parameters that affect substitution between energy sources. For the substitution parameter value, this study refers mainly to the research by Anderson et al. (2003) which discusses the non-linear behaviour of this model, and the relationship between the substitution parameter and the variance of relative price distribution, as well as the basis for the reference value. The substitution relationship between energy structure and technology is shown in Fig. 17. Learning rate is an important parameter representing new energy technology progress and cost evolution. McDonald and SchrattenholzerFootnote 4 made initial estimates of the technological progress rate of various energy technologies. Later, Kumbaroglu et al., Rout et al. and Rubin et al.Footnote 5 reviewed the estimates in their more recent research. In general, new technologies have greater potential to drive technological progress, and thus have a higher learning rate of 12.9–18.7%. The relatively mature technologies have a slightly lower learning rate of 9.8–12.9%. The basically proven technologies have relatively small potential for technological progress and accordingly have a lower learning rate of about 7%.

Relationship between energy structure and technical substitution
2.3 Baseline Results
From the simulation results, China’s economy will continue to grow in the future despite its slowing growth rate. Specifically, China’s economic aggregate will increase from $8.7 trillion in 2015 to $20.5 trillion in 2030 and about $43 trillion by 2050 (Fig. 18). However, it will be difficult for China to maintain its current growth rate. In fact, compared with the 8% average growth rate during the 12th Five-Year Plan (2011–15), average economic growth during the 13th Five-Year Plan (2016–20) is expected to decrease to around 6.6%, and decline further to 4% and 2.86% respectively in 2040 and 2050.

Note GDPGR = GDP growth
China’s macroeconomic development in the Baseline scenario.
To verify the reasonableness of the estimated economic development of this model, the study compares the relevant results with the predictions for China’s future economic development by research institutions, as shown in Fig. 19. Compared with the economic growth estimates provided by these research institutions, the model result stays around the midpoint. In particular, the Energy Research Institute of the National Development and Reform Commission (NDRC) provides a relatively optimistic prediction of China’s future economic development—it believes that China’s macroeconomy still holds a steady growth potential of 8% by 2020, and even in 2020–30, the average economic growth rate is expected to be 7.1%. Lawrence Berkeley National Laboratory also believes that China’s economy will maintain strong momentum by 2020, with an average growth rate of up to 7.8%. In contrast, the economic growth expectations of the International Energy Agency and Tsinghua University are lower—they predict China’s average GDP growth rate to be 5.5% and 6.2% respectively by 2030. Tsinghua University forecasts China’s economic growth expectation in three scenarios—Optimistic, Moderate and Pessimistic—in its research report. In this study, only the forecast in the Moderate scenario is used for comparison.

Note ERI = Energy Research Institute of the National Development and Reform Commission (NDRC); LBNL = Lionel Berkeley National Laboratory; IEA = International Energy Agency; Tsinghua University
Cross-study comparison of China’s economic expectations by 2050.
Figure 20 shows China’s future energy consumption and expected carbon emissions in our Baseline scenario. China’s total primary energy demand (TPED) will stay in a growth trajectory in the long term, although the rate of growth is slowing down. Energy demand will be 4.53 Btce in 2020 and 6.35 Btce in 2040, the latter double that of 2015. This is consistent with the research conclusion of He Jiankun (2013). China’s future CO2 emissions will peak at 3.17 gigatonnes of carbon (GtC), equivalent to 11.6 billion tonnes of CO2, by around 2040 in the Baseline scenario. This indicates that without policy interventions to reduce emissions, such as a carbon tax or carbon emissions trading, China’s goal of reaching a carbon emissions peak by 2030 will be difficult to achieve.

Note Gtce = gigatonnes of carbon emissions; TPED = total primary energy demand
Energy demand and carbon emissions path in the Baseline scenario.
2.4 Evolution of the Energy Structure and Development of Non-fossil Energy
Adjustments to the conventional energy system and the substitution of new energy technologies for fossil fuels depend largely on policy incentives. Our model, therefore, uses three incentive policy scenarios to encourage a shift to non-fossil energy technologies—Conservative, Moderate and Optimistic. This section will focus on the dynamic evolution of China’s future energy structure in those three scenarios, focusing on the long-term development path of the various non-fossil energy technologies.
Figure 21 shows the dynamic evolution of the energy structure in the Moderate scenario, which is expressed by demand for different energy sources. It is easy to see that coal remains the dominant energy source in 2050, despite its decreasing share of total primary energy demand. Even in 2050, coal’s share of total primary energy demand will be as much as 41.2%. The share of oil remains relatively stable—on the one hand, diminishing oil reserves determine its limited growth potential; on the other, the dependency of economic development on oil and the inertia of related industries prevent oil’s share of demand from being squeezed by new energy technologies. By 2050, the share of oil in energy demand will decrease by only 3.3% from 2015. Natural gas demand will grow substantially, from 260 Mtce in 2015 to 670 Mtce in 2030, and its share of energy demand will increase from less than 6–12%.

Note GtC = gigatonnes of carbon
Energy structure in the Moderate scenario.
In non-fossil energy technologies, hydropower and nuclear power will retain their dominance in China’s future non-fossil energy demand. By mid-century, the share of hydro and nuclear in total primary energy demand will reach 10.5% and 4.1% respectively (Fig. 22). Wind and solar PV will also achieve significant growth. In particular, wind power will gain strong momentum after 2025, with demand reaching 349 Mtce, or 5.3% of total primary energy demand (TPED), by 2050 (Fig. 22). Non-fossil energy’s share of TPED reaches 20% in the Moderate scenario, which suggests that the government can deliver its goal of non-fossil energy development by 2030 on schedule. By 2050, the share of non-fossil energy will rise to 27%. It should be noted, however, that the rapid increase in non-fossil energy is mainly due to conventional technologies like hydro and nuclear power, and that the combined contributions of non-hydro renewable energy remain low. For instance, by 2050, the share of non-hydro renewable energy in TPED will be 15.2%, and the share of non-hydro and non-nuclear renewable energy in TPED will be even lower at 9.4%.

Energy technology share path in the Moderate scenario
The development of each major energy technology (in terms of growth in its share of TPED) in different incentive policy scenarios is shown in Fig. 23. Wind and solar PV are the most sensitive to incentive policy, which suggests they have greater development potential in the future. In the prediction results, the share of wind power demand is 8.6% in the Optimistic scenario, 6.3% higher than in the Conservative scenario. Similarly, solar PV shows remarkable development in the Optimistic scenario, reaching 0.75% in 2030 and 1.59% in 2050. In contrast, the share of solar PV will be only 0.51% in 2050 in the Conservative scenario, a difference of more than 1% compared with the Optimistic scenario.

Note TPED = total primary energy demand
Impact of different incentive polices on the evolution of energy technologies.
Total non-fossil energy demand will grow rapidly. In the Moderate scenario, China’s goal of achieving a 20% share of non-fossil energy by 2030 will be delivered on schedule, and in the Optimistic scenario the figure will reach 22%. By 2050, the share of non-fossil energy in the Optimistic scenario will be 31.2%, about 4% and 8% higher than the Moderate and Conservative scenarios respectively. This is basically consistent with the predictions of He Jiankun.Footnote 6 Due to rising demand for non-fossil energy technologies, coal’s share of TPED will be continuously squeezed. Even so, coal will still make up more than 50% of demand in 2030 in the Conservative and Moderate scenarios. In the Optimistic scenario, coal’s share of demand will decrease to 49% in 2030 and 37.1% in 2050, which echoes mainstream opinion about the long-term decline in coal demand.
Finally, the study briefly analyses the impact of energy technology development on future carbon emissions, as shown in Fig. 24. Policy stimulates technology development, which in turn can generate significant impacts on carbon emissions. In the Optimistic scenario, technology development reduces total carbon emissions, especially in the later maturing stages of technologies. On the other hand, technology can help carbon emissions to peak early. Figure 24 shows that in the Optimistic scenario, although China’s goal of attaining a peak in carbon emissions by 2030 is not realised, the peak will be achieved around 2035 (at 3.06 GtC, equivalent to 11.2 Bt of CO2), which is earlier than the Conservative and Moderate scenarios.

Note GtC = gigatonnes of carbon
Impact of non-fossil energy technology on carbon emissions.
2.5 Energy Development and Climate Change: Optimisation and Choice of Policy
The significance of using policy to achieve specific energy and emission reduction goals has aroused extensive interest among researchers, both in China and abroad, especially with regard to scenarios on policy choice and policy cost evaluation. He JiankunFootnote 7 established the low-carbon scenario indicator system to determine if China’s CO2 emissions would peak on schedule in 2030. He identified two preconditions for delivering the peak carbon emissions goal on time. Policy scenario-makers have since identified other key factors relevant to achieving the peak CO2 goal. These include the transition from a high-growth to a slower growth economy, improvements in energy efficiency, progress in non-fossil energy technologies (nuclear power and renewables), deployment of carbon capture and storage (CCS), and the shift to a low-carbon lifestyle. With proactive policy packages, China’s carbon emissions from energy-related activities could peak by 2025 or even earlier. However, current emission reduction efforts are not enough to achieve the goals of peak carbon emissions and a 20% share of non-fossil energy by 2030. It is therefore necessary to introduce stronger policies and incentives to improve energy efficiency and renewable energy uptake and reduce carbon emissions.
2.5.1 Policy System Design and Basic Assumptions
Carbon pricing is a widely used policy across the globe to address the challenge of reducing carbon emissions. It is also an important policy option for China to help achieve the goal of peak carbon emissions by 2030. Carbon pricing includes carbon emissions permit trading via cap control and a carbon tax levied by price regulation. Theoretically, a balanced carbon market price is equivalent to the optimal carbon tax level, which means that carbon tax and carbon emissions trading can deliver the same policy effect under given conditions. Based on this assumption, carbon emissions are mainly controlled by introducing an endogenous (controllable) carbon tax in the model simulations of this report. A carbon emissions reduction policy alone provides limited incentives, especially in the short and medium terms. A relevant subsidy (ad valorem) is an essential policy option for driving the diffusion of new energy technologies. This study therefore considers a non-fossil energy subsidy as the second endogenous variable (after carbon tax) in the model optimisation process. These two variables allow us to analyse the impacts of coordinated and optimised policies on China’s intended nationally determined contributions target for the 2015 Paris Agreement.
The optimised endogenous (controllable) carbon tax path requires setting an exogenous (uncontrollable) carbon emissions cap (CAP). The CAP used in this study is set by mainly referring to the additional carbon emissions that could be allocated to China under the scenario of limiting global temperature rise to below 2°C. Raupach et al.Footnote 8 provide the carbon emission space allocation plan for all countries and regions based on the principles of fairness, historical emission inertia and mixing under the 2°C scenario. China’s cumulative carbon emissions will reach 105.55 billion tonnes by 2050 under the representative grandfather clause. Therefore, this study sets the estimated value as the exogenous CAP.
In the process of model optimisation, this study assumes that carbon tax revenues are always sufficient to compensate for the cost of subsidies, and that different policy mix options are realised by adjusting the ratio between cumulative carbon tax and subsidies throughout the entire simulation period (2010–50). When calculating the cumulative carbon tax and subsidies, this study follows international estimation practice and uses a discount rate of 5%, which is consistent with the capital depreciation rate used in the model. The cumulative carbon tax is the sum of the carbon tax on three fossil fuels (coal, oil and natural gas), and the cumulative subsidy is the sum of the subsidies for seven non-fossil energy technologies: biofuel, nuclear, hydro, geothermal, wind, solar and marine.
2.5.2 Analysis of INDC Target and Policy Optimisation
The policy optimisation results mainly reflect the impacts of optimised policy on the 2030 peak carbon goal and the non-fossil energy development goal.
When policy is optimised around the peak carbon and non-fossil energy development goals, the tax revenue from carbon pricing policy is far higher than the cost of non-fossil energy subsidies. As shown in Fig. 25, to achieve the 2030 peak carbon emissions goal, the ratio between cumulative carbon tax and subsidies needs to be more than 4:1. On the one hand, the policy does not need funding, other than the carbon pricing revenue to meet the cost of subsidies. On the other hand, the high ratio between cumulative carbon pricing revenue and subsidy costs is related to the 2030 peak carbon emissions goal. Generally, the higher the ratio between carbon pricing policy and subsidy policy, the greater the possibility of achieving peak carbon emissions early. For example, to reach peak carbon around 2025, the ratio between cumulative carbon pricing revenue and subsidies will be more than 5.5:1. Figure 25 shows that under the High and Low policy mix options, the goal of reaching peak carbon emissions by 2030 is possible—the difference is mainly in the peak level of emissions. In general, the stronger the carbon pricing policy, the lower the corresponding carbon emissions peak level. For instance, when the ratio between carbon tax and subsidies is 4.5:1 and 5.4:1, carbon emissions can peak around 2030 at 10.3 billion tonnes and 10 billion tonnes of CO2 respectively. Therefore, when assessing how to achieve peak carbon, optimal policies and the difference in peak level need to be taken into account.

The relationship between policy optimisation and peak carbon emissions
Comparatively speaking, the development of non-fossil energy is more significantly affected by subsidy policy than by carbon tax. As indicated in this study, the higher the share of subsidies in the policy mix, the faster the development of non-fossil energy technologies. As the carbon tax/subsidy ratio decreases, the share of non-fossil energy consumption steadily increases (Fig. 26). The figure shows that when the tax/subsidy ratio is higher than 5.5:1, the share of non-fossil energy in total primary energy demand is around 17% in China, but that when the ratio approaches 4.5:1, the share rises to around 20%. In particular, when subsidy policy strengthens and the ratio between cumulative carbon tax and subsidies is below 4:1, the share of non-fossil energy consumption will be higher than 22%. This indicates that to achieve the 2030 peak carbon emissions and non-fossil energy development goals at the same time, China should take carbon pricing and subsidy policies into account and coordinate delivery of the two goals.

The relationship between policy optimisation and the non-fossil energy development goal
In the context of policy optimisation, the relationship between the peak carbon emission and non-fossil energy development goals is shown in Fig. 27. This relationship can be analysed across two dimensions. On the one hand, the two goals conflict in most cases, i.e. the looser the controls on carbon emissions, the greater the possibility of delivering the non-fossil energy development goal, and vice versa. This is because loose carbon emissions control reduces the need for carbon pricing in the optimisation process, which strengthens the role of subsidies for the development of non-fossil energy in the policy mix. On the other hand, there is a potential synergy between the peak carbon and non-fossil energy development goals, in that the two targets can be achieved at the same time under certain policy mix options. In particular, when subsidy policy plays a sufficiently significant role, it not only drives non-fossil energy technology development and delivers the targeted share of non-fossil energy, it also compensates for the emissions reduction effect of carbon pricing policy, thus achieving an early peak in carbon emissions. Figure 27 shows that when the ratio between cumulative pricing and subsidy is low at 3.9:1, China’s CO2 emissions will peak early around 2025, while the share of non-fossil energy consumption will reach 22%.

The relationship between the peak carbon emission and non-fossil energy development goals
2.5.3 Analysis of Policy Choice and Macroeconomic Costs
The macroeconomic cost of energy and climate policies correlates significantly with the role of carbon pricing in the policy mix. As shown in Fig. 28, as the carbon tax/subsidy ratio increases, cumulative policy costs rise substantially (if the discount rate is 5%). When the ratio between cumulative carbon tax and subsidy is around 5:1, the cost of the policy mix is only 0.19% of GDP, but when the ratio is around 6:1, the cost rises to 0.77%.

Impact of policy choice on China’s macroeconomy under the energy and climate policy goals
However, when the role of subsidies in the policy mix increases (i.e. the carbon tax/subsidy ratio decreases), cumulative policy costs decrease sharply. In particular, when the ratio is lower than a certain threshold (4.7:1 for example), a policy mix of carbon pricing and subsidies will not be detrimental to China’s macroeconomic growth. As indicated in Fig. 28, when the ratio between cumulative carbon tax and subsidies is lowered to 4.66:1, the overall gains from that policy mix will amount to 0.27% of GDP, and when the ratio further decreases to less than 4:1, the gains will amount to 0.75% of GDP.
The reduction in CO2 emissions achieved by the carbon pricing policy comes mainly from a reduction in fossil energy consumption. This will undoubtedly have a negative impact on energy-driven economic growth, especially as fossil fuels dominate total energy consumption. However, as the subsidy policy takes hold and the incentive effects become increasingly evident, renewable energy technologies like wind and solar will mature and be deployed at scale, replacing fossil energy technologies to support and drive macroeconomic growth.
2.5.4 Proposals for Policy Choice
In the process of delivering the non-fossil energy development and peak carbon emission goals, conflicts and synergies coexist, depending on the policy mix options adopted. The stricter the emission controls, the more likely peak carbon emissions will be achieved on time. When carbon pricing plays a prominent role in the policy mix, the non-fossil energy development goal is more difficult to achieve. When subsidies play a large enough role in the policy mix, the non-fossil energy development and peak carbon emission goals can be realised on schedule at minimal cost. When the carbon emission reduction policy is well designed, the decarbonisation goal can be achieved completely at near-zero cost.
To ensure smooth delivery of the non-fossil energy and peak carbon emission goals by 2030, the Chinese government should take the interactive relationship between the two goals into consideration. The government should focus on choosing and optimising a policy mix of carbon pricing and subsidies. Understanding how the two goals interact will help determine the optimal policy mix and strategy to smoothly deliver the two goals. In so doing, any conflicts between the two goals should be minimised or avoided and their synergies harnessed. This requires the government to focus on the following two factors when developing support policies: first, a policy mix—in which carbon pricing and subsidies play a dominant and an ancillary role respectively—should be adopted; and second, the policy mix should be continuously refined until the optimal combination point is found, i.e. increasing subsidy policies without changing the dominant ancillary relationship between carbon pricing and subsidies. It is, therefore, inappropriate to reduce or cancel technology subsidies and rely only on carbon pricing to deliver China’s energy and climate goals when renewable energy technologies have not been commercially deployed at scale. Only when the carbon pricing and subsidy mix is fully optimised can the two goals be realised on schedule, and policy costs minimised and the benefits of the policy mix strategy harvested.
3 The Effects of the Energy Pricing Mechanism on China’s Medium- and Long-Term Energy Demand
3.1 The Evolution of Fossil Energy Prices in the Medium and Long Terms
3.1.1 Coal Market
As the most important primary energy source in China, coal plays a dominant role in the entire energy demand structure. As shown in Fig. 29, despite the reduction in coal consumption over the past five years and a decline in absolute terms in 2015 of 1.5%, China’s coal consumption in 2015 reached 1,920.4 Mtoe, which is 63.7% of the country’s total energy consumption. China is the world’s largest coal consumer, accounting for half of global demand in 2015. China’s coal market is, therefore, not limited to its own supply and demand, but affects the international coal market as a whole.

Source BP Statistical Review of World Energy (2016)
Evolution of China’s total coal consumption.
In light of current medium- and long-term economic development trends in China, both supply and demand in China’s coal market may undergo major transformations and be significantly affected by policy factors.
On the demand side, China’s economic development is now undergoing a major transition: economic growth is shifting from high speed to a new normal of medium to high speed, and future growth in total energy demand will slow down as the transition progresses. China is also under great pressure to address haze and other environmental problems, and this pressure will continue in the short and medium terms. China will also struggle to achieve its energy transition goals away from coal for 2020 and 2030. There is, therefore, limited potential for growth in coal demand in the medium and long terms.
On the supply side, there is severe overcapacity. In China’s ongoing structural reform of energy supply, a top priority is to cut excess capacity, mainly in the coal sector. As production is reduced, China’s short-term supply of coal will be tight, and prices are likely to rise. This was evident already in 2016. In the last quarter of that year, coal prices rose rapidly: the price of thermal coal doubled over the year as a whole, that of coking coal almost tripled, and coke prices quadrupled.
In summary, after four years of declining prices (Fig. 30), China’s coal prices in the short and medium terms are likely to rise as production is reduced to tackle overcapacity. In the medium and long terms, due to the transformation of China’s economy (the new normal of slowing growth), environmental problems and constraints on alternative energy sources, coal prices are not likely to grow significantly.

Source BP Statistical Review of World Energy (2016)
Price movements in the coal market of major countries and regions.
3.1.2 Crude Oil Market
Due to China’s fast economic growth in recent years, the country’s oil demand has grown rapidly from 224 Mt in 2000 to 559 Mt in 2015, an average annual increase of 6.3%. China’s oil consumption now accounts for around 13% of the world total, making it the world’s second largest oil consumer (Fig. 31). Owing to the limitations of China’s resource endowments, the country’s own oil production can hardly meet the needs of its rapid economic growth. With the growth in oil consumption, China’s dependence on oil imports has been increasing year by year. In 2015, China’s net oil imports were 328 Mt and its dependence on oil imports rose to 60.6% (Fig. 31). China’s future oil price movements will be closely linked, therefore, with world crude oil price trends.

Source BP Statistical Review of World Energy (2016)
Evolution of China’s oil consumption and dependence on oil imports.
World crude oil prices have soared since 2000, rising from $30/barrel (bbl) to $100/bbl in 2008. After the global financial crisis in 2008, crude oil prices plunged to $60/bbl, then quickly rebounded to a peak of $110/bbl in 2010 and remained high and volatile in 2013–14. In 2015, world crude oil supply and demand underwent profound changes, leading to plummeting crude oil prices in the short term (Fig. 32).

Source BP Statistical Review of World Energy (2016)
Crude oil spot prices in major countries and regions.
On the supply side, breakthroughs in unconventional oil and gas extraction technology (shale oil and gas) in the USA have greatly increased the country’s crude oil production, making it the world’s largest oil producer. Second, attempts by OPEC to limit production have had little impact on global oil supply, as its member states tend to focus on their own interests rather than those of the OPEC collective. As a result, oil-producing countries have maintained their production capacity, greatly driving up the world’s crude oil supply.
On the demand side, after 2014, three factors combined to make global oil demand lower than expected: China’s economic transformation, the weak economic recovery of Europe, and the failure of Japan’s economic stimulus policy to make a difference. In the end, as the US dollar became stronger, international oil prices are expected to drop in the medium and long terms.
To sum up, in the medium and long terms, world crude oil prices will remain low within a certain range, but they will be affected by changes in supply and demand and other uncertainties. In particular, the status of the world’s major economies (China, the EU and Japan) will determine future oil demand, while changes in US energy policies under the present administration, the production-limiting attempts of OPEC, and the complex geopolitical situation in the Middle East, will have a significant impact on future oil supply.
3.2 Technology Evolution and Cost Reduction in New and Renewable Energy
New and renewable energy has significant advantages over conventional fossil energy in reducing pollutants and greenhouse gas emissions, while increasing the diversity of energy supply and improving energy security. Therefore, all countries around the world are pinning great hopes on the development of new and renewable energy. Over the past 20 years, especially in the past decade, the world has seen considerable progress in renewable energy, particularly in solar and wind power, the installed capacity of which reached 2,300 GW and 4,350 GW respectively in 2015. In the past decade, China has made remarkable achievements in new energy development. The country’s installed capacity of wind and solar power was 440 GW and 1,450 GW respectively in 2015, accounting for 18.9 and 33.3% of the global total, making China the world leader in terms of installed capacity of wind and solar power (Fig. 33).

Source BP Statistical Review of World Energy (2016)
Development paths for installed capacity of renewable energy in China and the world.
Without taking the influence of other external factors into account, the cost evolution of the various energy technologies is the fundamental factor that determines energy demand. Other important factors are the relative competitiveness of energy sources and the evolution of the energy demand structure in the medium and long terms. Technology evolution and the cost reduction potential of a mature energy like conventional fossil fuels are relatively limited. Whereas new energy like renewables, especially wind and solar, which are in the early stages of development compared to fossil energy, still have great potential for technology evolution. The rapid development of renewable energy over the past decade has made cost reductions possible, which is evident in China and all over the world. In Fig. 34, the evolution of wind and solar PV generation shows that although costs differ across the world, this is due mainly to differences in investment costs, resource conditions and other factors. The average cost of onshore wind power generation decreased from $0.2/kWh in 1995 to $0.10/kWh in 2005 and $0.07/kWh in 2015, with an average cost reduction of about 65% over the 20-year period. The cost of utility-scale solar PV generation dropped more significantly, from $0.31/kWh in 2010 to $0.13/kWh in 2015, giving an average cost reduction of 58% over the five years.

Note LCOE = levelised cost of energy. Source International Renewable Energy Agency (2016)
Evolution of solar PV and wind power generation costs (LCOE).
The technological advances and cost reductions achieved in renewable energy over the past decade are mostly due to significantly lower investment costs, made possible by the learning effects of growing installed capacity. Future reductions in the cost of renewable energy generation will come from lower equipment and component costs, improvements in operating efficiency, and lower operations and maintenance costs. According to the International Renewable Energy Agency (IRENA), the potential for future reductions in renewable energy costs will remain significant, with a projected 26 and 35% reduction in onshore and offshore wind power levelised cost of energy (LCOE) by 2025. The reductions in solar power will be even greater: the LCOE of solar photovoltaic and solar thermal will fall by 43% and 59% respectively. Other new and renewable types of energy, including nuclear, biomass, geothermal, hydro and marine energy, also have potential for cost reductions.
3.3 Policy Factors Affecting Energy Prices
3.3.1 Renewable Energy Policy
Although China has made significant progress in non-fossil energy over the past decade, renewable energy is still not cost-competitive because the current pricing mechanism does not include the external costs of fossil energy use (resource depletion and environmental impact). In order to support the development of renewable energy, China has adopted several policy measures over the past decade. The Renewable Energy Law, introduced in 2005, has laid the foundation for the rapid development of renewable energy in China. Similarly, the renewable energy feed-in-tariff has improved the price competitiveness of renewable energy and increased the deployment of renewable energy technologies. As shown in Fig. 35, renewable energy consumption has increased rapidly since 2005. By 2015, the consumption of wind and solar power was 185.1 terrawatt-hours (TWh) and 39.2 TWh respectively, and the proportion of non-fossil energy in China’s total energy demand system reached about 12%.

Source BP Statistical Review of World Energy (2016)
Evolution of wind and solar power consumption in China.
Under the current renewable energy policy mechanism, demand for renewable energy by consumers and for renewable energy subsidies by generators is growing. The subsidy deficit has now become a major obstacle to the sustainable development of renewable energy in China. To solve this problem, the government has announced several cuts in renewable energy feed-in tariffs (Table 3). At the same time, China has raised the feed-in tariff surcharge level successively from RMB 0.002/kWh in 2006 to RMB 0.019/kWh in 2016 (Table 4). Nevertheless, renewable energy subsidies are still far from meeting real needs. By the end of 2016, the cumulative gap in renewable energy subsidies was close to RMB 60 billion, and the sustainability of the original renewable energy subsidy policy faced challenges. Therefore, China’s current and future renewable energy subsidy policies will undergo important transformations: (i) subsidies will be further reduced until their cancellation, while the transformation of the subsidy policy will be closely related to the technology and cost evolution of renewable energy in the future; and (ii) the future renewable energy quota trading mechanism and carbon trading scheme should boost future renewable energy development and become an important supplement to the renewable energy subsidy policy.
In addition, due to China’s power market system, the characteristics of renewable energy technologies and other factors, wind and solar curtailment remains a tough challenge in China. For example, in 2015, the rate of wind and solar curtailment was 15% and 12.5% respectively. Due to the economic slowdown and the decline in electricity demand growth, wind and solar curtailment in the first half of 2016 increased to 38.9% and 19.7% respectively. Wind and solar curtailment greatly reduces the economic benefits of renewable energy investment and weakens the sustainable development of renewable energy. Therefore, addressing wind and solar curtailment has been a top priority of renewable energy development in the 13th Five-Year Plan (2016–20) and will remain so in the medium and long terms.
3.3.2 Carbon Pricing Policy
Due to the strong connection between energy demand and greenhouse gas emissions, China’s climate policy will have a profound impact on the country’s energy demand. On December 12, 2015, 195 countries entered into an historic agreement on global climate change at the United Nations Framework Convention on Climate Change (UNFCCC) in Paris. Signatories to the Paris Agreement committed to strengthen the global response to climate change by keeping the increase in global average temperature to well below 2°C above pre-industrial levels and by striving to limit the increase to 1.5°C. On November 4, 2016, the Paris Agreement came into effect. It is the second legally binding climate agreement following the Kyoto Protocol of 1997, and provides an institutional basis for the global response to climate change after 2020.
China is the world’s largest emitter of greenhouse gases and plays a key role in combating climate change across the world. As a responsible developing country, China has made a positive contribution to the adoption and implementation of the Paris Agreement. Within the framework of the agreement, China submitted its ambitious intended nationally determined contributions (INDC). By 2030, China will: (i) reach peak CO2 emissions and make its best effort to achieve peak carbon earlier; (ii) lower CO2 emissions per unit of GDP by 60–65% from the 2005 level; (iii) increase the share of non-fossil fuels in primary energy demand to around 20%; and (iv) increase its forest stock volume by around 4.5 billion cubic metres from the 2005 level. This is the first time the Chinese government has set goals for its total carbon emissions, which is of great significance to advance the global response to climate change.
The carbon pricing mechanism is a market-based policy tool for reducing greenhouse gas emissions. It is a major institutional innovation in combating climate change that has been used in recent years by more and more countries and regions in their emission reduction practices. It is cost-efficient, environmentally effective and politically feasible to enact. According to the World Bank, by 2015, some 40 countries and more than 20 regions had adopted or planned to adopt carbon pricing instruments, including carbon trading schemes, covering 12% of global carbon emissions. Carbon pricing instruments are valued at close to $50 billion, and their scope and scale are expected to expand.
As a key measure to tackle climate change, China started to roll out a national carbon trading market in 2017 on the basis of seven pilot regional carbon trading schemes. The carbon market will be built in three phases. In phase 1, the IT system for data reporting, registry and trading will be built, which will take about a year. In phase 2, which will take another year or so, trial operation will start for the power generation industry. In phase 3, power generators will be able to transfer and trade carbon credits. The scope of participation will gradually extend to beyond the power generation sector, with more trading products and transaction types introduced.
The carbon pricing mechanism will influence future fossil energy demand—and thus the energy mix—by affecting the relative price competitiveness of fossil energy. For China, where coal consumption plays a dominant role, the implementation of carbon pricing is of great significance for the country’s future energy demand. Even if China’s adoption of clean coal technologies leads to fewer constraints on haze and other pollutants, in the present and in the medium terms—due to the various obstacles facing carbon capture and storage (CCS) technology—China is unlikely to have effective carbon solutions for coal at the end-use point. Therefore, when established, China’s national carbon market is likely to reduce the country’s consumption of fossil fuels, especially coal. The size of that reduction will be closely related to price trends in the carbon market.
The price trend and trading status of the seven pilot carbon trading markets are shown in Fig. 36 and Table 5 respectively. Due to their differences in economic development, carbon emission reduction goals and carbon market rules, the seven pilot schemes vary greatly in price, ranging from RMB 15 per tonne of CO2 (t/CO2) to RMB 60/tCO2. At the same time, the market price fluctuates significantly in some pilot markets, which to some extent reflects the difficulty of reducing emissions and the market participants’ varying predictions of what their future reductions will be. But on the whole, the current price level in the pilot carbon markets is generally low, and the impact on businesses’ emissions reduction is not very significant.

Source China Carbon Trading Network
Price trends in China’s seven pilot carbon markets.
It is likely that in the early years of the national carbon market, for the purpose of giving businesses time to learn and adapt to market rules, emission allowances will be relatively loose and the starting level of carbon prices will not be too high. However, as carbon emission reduction goals increase and the carbon market system improves, the carbon price level will rise, giving full play to the guiding and incentivising role of carbon pricing. According to McKinsey, Mo and ZhuFootnote 9 and estimates by the National Development and Reform Commission (NDRC), only a carbon price level of RMB 200–300/tCO2 can play a significant role in the development of low-carbon technologies and the transition to a low-carbon economy. National carbon market prices are, therefore, expected to rise after 2020 to enable carbon emissions to peak by 2030.
3.4 Effects of the Pricing Mechanism on Medium- and Long-Term Energy Demand
3.4.1 Effects of Future Fossil Energy Prices on Energy Demand
Based on the historical trend of fossil energy prices and the current status of the fossil energy market, we designed three scenarios—High, Business as usual (BAU) and Low—to analyse future fossil energy price trends in China’s energy, economy and environment (3E) model. The average annual growth rate of future coal, oil and gas prices will be 2%, 2.3% and 1.7% respectively in the BAU scenario, 3% for all three fuels in the high-price scenario, and 1% for all three fuels in the low-price scenario. The price trends in the medium and long terms are shown in Fig. 37 (Table 6).

Evolution of fossil energy prices in three scenarios
Figure 38 shows that, the evolution trend of fossil energy prices has a very significant impact on future total fossil energy demand. By 2030, energy demand in the BAU, low-price and high-price scenarios will be 77%, 98% and 48% higher respectively than in 2010. By 2050, the difference will be much greater: 1.67, 2.16 and 2.65 times respectively than in 2010. In the high-price scenario, the total energy demand growth trajectory will shift down significantly compared with the base case, with demand starting to plateau around 2040.

Evolution of total energy demand, energy mix and energy intensity for different fossil energy price paths
The price of fossil fuels can have either a significant or insignificant impact on the energy mix. In the BAU scenario, the share of non-fossil energy will increase from 8.6% in 2010 to 12.4% in 2030 and reach only 21.9% in 2050, which is a relatively insignificant transformation of the energy mix. In the low-price scenario, the substitution of non-fossil energy for fossil energy is small and therefore insignificant in terms of energy mix transformation. In the high-price scenario, however, the share of non-fossil energy will reach 19.7% by 2030, close to the Chinese government’s 2030 INDC goal, and 50.6% by 2050. This means that the price of fossil energy in this scenario does have a significant impact on demand and the energy mix in China. Reducing subsidies for fossil energy and maintaining high fossil energy prices can limit energy demand and help optimise and transform the energy mix in the medium and long terms.
China still has great potential for energy intensity reduction in the future. In the BAU scenario, energy intensity in 2030 will be 51.8% lower than in 2010, and the average annual rate of decline during 2025–30 will be 3.3%. In the high fossil energy price scenario, energy intensity in 2030 will be 58.2% lower than in 2010. Even in the low fossil energy price scenario, energy intensity in 2030 will be 46.8% lower than in 2010. This is due mainly to the improvement in energy efficiency caused by non-price factors, such as economic restructuring and technology advances.
3.4.2 The Effects of Non-fossil Energy Technology on Energy Demand
In addition to fossil energy prices, technology advances and the cost of non-fossil energy can impact future energy demand significantly. The cost reduction potential of new and renewable energy is closely related to progress in technology. Based on previous research, this study summarises progress in several power generation technologies, as shown in Table 7. The various studies identify some differences in learning parameters within the same technology; but between different technologies, the differences in learning are more significant. Overall, the learning potential of technologies like solar, wind, marine and geothermal is huge, while that of hydropower, nuclear power and biomass is small. Based on previous studies and analyses in the energy, economy and environment model, this report sets three non-fossil energy technology evolution scenarios (High, BAU and Low): the high technology evolution scenario implies that non-fossil energy technologies have great learning potential and their future cost reductions will be significant with their diffusion. The low scenario implies that non-fossil energy technologies are relatively mature and their learning potential and cost reductions are small.
Figure 39 shows the evolution of total energy demand and the energy mix in different non-fossil energy technology scenarios. For total energy demand in the short term, the changes in the three scenarios will be basically the same. In the medium and long terms, differences in the three scenarios will gradually materialise but will not be significant. Although there is great uncertainty in the evolution of renewable energy technologies, the simulation results show that even in the most optimistic and pessimistic technology evolution scenarios, the differences in energy demand are not significant, indicating technology’s limited impact on future energy demand. There are two possible reasons for this: (i) due to technological inertia, the learning effects of renewable energy usually take a long time to materialise, so their impact on energy demand is not evident in the short term; and (ii) since the share of non-fossil energy in China is relatively low, even if great progress has been made in non-fossil energy technologies, their impact on the cost of the entire energy system is small—it is therefore impossible for them to lead the evolution of the entire energy system in the short term.

Total energy demand, energy mix and energy intensity in different non-fossil energy technology evolution scenarios
In terms of the energy mix, the share of non-fossil energy in the three technology evolution scenarios does not differ greatly in the short term. In 2030, the share of non-fossil energy in the high, BAU and low scenarios will be 12.5%, 12.3% and 11.8% respectively. In 2050, the share will be 23.1%, 21.9% and 18.2% respectively, which is still a minor difference. The substitution of non-fossil energy for fossil energy will not be significant in the short term and its impact on the energy mix will be small. Similar results apply to energy intensity.
To summarise, in the absence of external policies, the impact of non-fossil energy technology advances on the evolution of the entire energy system will take a long time to materialise, and their impact in the short term will be limited. In the context of energy saving, emissions reduction and combating climate change, introducing additional policy mechanisms to regulate the future evolution of the energy system would be a logical step to achieving the energy transition and energy revolution goals.
3.4.3 The Effects of Energy Price Policy on Energy Demand
The above analysis shows that policy mechanisms are essential to control total energy demand and adjust the energy mix. This study introduces two policy mechanisms that affect energy prices in the energy, economy and environment (3E) model: carbon pricing (for fossil energy emissions) and non-fossil energy subsidies. Carbon pricing determines the price of fossil energy emissions and turns them into a cost, thereby reducing the price competitiveness of fossil fuels. Subsidies, on the other hand, increase the relative price competitiveness of non-fossil energy.
This study assumes that China’s national carbon pricing mechanism was introduced in 2015. We set three carbon price scenarios (high, medium and low: $90 per tonne of carbon (tC), $60/tC and $30/tC respectively), and assumed an average annual growth rate of 5% for carbon prices in the future. We based non-fossil energy subsidies on China’s current renewable energy subsidy policy. We set two scenarios (a price subsidy of 20% and 30% respectively) and assumed that the two policies were introduced in 2015. The future evolution of total energy demand, the energy mix and energy intensity are shown in Fig. 40.

Note S30 = subsidy 30%; BAU = business as usual; T30 = tax 30%; etc.
The effects of carbon pricing and non-fossil energy subsidies on total energy demand and the energy mix.
The implementation of carbon pricing policy will have a significantly negative impact on the future trend of total energy demand. As the initial carbon pricing level increases, total energy demand will decline. Specifically, by 2030, in the policy scenarios of $30/tC, $60/tC and $90/tC, total energy demand will be 5.3 gigatonnes of coal equivalent (Gtce), 4.9 Gtce and 4.6 Gtce respectively, which is 7.4%, 14.0% and 19.4% lower than the 5.7 Gtce in the BAU scenario. By 2050, in the policy scenarios of $30/tC, $60/tC and $90/tC, total energy demand will be 6.2 Gtce, 5.6 Gtce and 5.2 Gtce respectively, which is 11.9, 20.0 and 25.8% lower than the 7.0 Gtce in the BAU scenario.
It can therefore be seen that the effects of carbon pricing policies materialise in the short term and become significant over time. Unlike carbon pricing policies, renewable energy subsidies will increase total energy demand. However, comparison of the two policy mechanisms indicates that subsidy policies will have a less significant impact on total energy demand than carbon pricing policies. If both policies are introduced, total energy demand will be higher than in the pure carbon pricing scenario and lower than in the subsidy scenario. An important conclusion can therefore be drawn: If policymakers are concerned that the introduction of carbon pricing could result in significant negative impacts on energy demand, non-fossil energy subsidy policies can be introduced at the same time. This would increase demand for non-fossil energy and reduce that for fossil energy, ensuring smooth control of energy demand.
In terms of the energy mix, with the introduction of carbon pricing and non-fossil energy subsidy policies, the share of non-fossil energy will rise. Non-fossil energy subsidies will have a more significant impact on the energy system shift than carbon pricing. This is because the cost reduction of non-fossil energy technologies will be slow without proper policy support. While carbon pricing policies can inhibit fossil energy demand, the uptake of non-fossil energy can still be very challenging if no subsidy is introduced to reduce the cost of the technology. With a policy combining carbon pricing and new energy subsidies, fossil energy demand can be inhibited while non-fossil energy can be developed faster.
When both policy mechanisms are adopted, the impact on the energy mix is significant. The simulation results show that in the single policy scenarios, neither carbon pricing at $90/tC nor a subsidy of 30% is enough to achieve the 20% share of non-fossil energy goal by 2030. Whereas in the combined policy scenario, the joint effects of a carbon price of $30/tC and a subsidy of 30% puts the 20% share goal within reach by 2030. In the medium and long terms, the share of non-fossil energy can rise to 50% by 2050 in the combined policy scenario. This indicates that a combined policy mechanism is effective and necessary to achieve the energy revolution.
3.4.4 Analysis of China’s INDC
China’s intended nationally determined contributions (INDC) reflect its goal of reducing its carbon emission intensity by 60–65% by 2030. This study simulates the evolution trends of China’s future carbon emission intensity in different policy scenarios, as shown in Fig. 41.

Note BAU = business as usual; S20 = subsidy 20%; T30 = tax 30%, etc.
Evolution of China’s future carbon emissions intensity in different policy scenarios.
In the BAU scenario, where the emission reduction and energy efficiency efforts implemented through to the 12th Five-Year Plan (2011–15) are continued, without any additional policy measures, China’s future carbon emission intensity will decline by 63.4% between 2005 and 2030. Figure 41 shows that by continuing existing energy saving and emission reduction efforts, China will be able to reach the lower limit of the carbon intensity reduction goal by 2030. But additional emission reduction efforts will be needed to reach the upper limit of the carbon intensity reduction goal.
In the single policy scenario, where a non-fossil energy price subsidy of 20% is introduced, carbon emission intensity will decrease by 64.5% between 2005 and 2030. If the subsidy level is increased to 30%, carbon emission intensity will decline by 65.3%, reaching the upper limit of the carbon emission intensity reduction goal.
In terms of carbon pricing policy, when the carbon price level is $30/tC, carbon emission intensity will decrease to 66.7% in 2030, which also reaches the upper limit of the carbon emission intensity reduction goal. Carbon pricing policy will, therefore, play a more significant role in reducing future carbon intensity.
Achieving peak carbon emissions by 2030 is one of China’s INDC goals. To forecast the path to achieving this goal, this study simulated the evolution of China’s total future carbon emissions in different policy scenarios, as shown in Fig. 42.

Note BAU = business as usual; T30 = tax 30%; S30 = subsidy 30%; etc.
Evolution of China’s future carbon emission paths in different policy scenarios.
In the BAU scenario, where no additional policies are introduced, China’s carbon emissions growth will continue to 2040 and decrease slowly thereafter. In the single carbon pricing scenario, China’s carbon emissions curve will gradually decline. When the initial carbon price level is set at $30/tC, China’s carbon emissions will peak in 2035, remain stable for five years, before decreasing after 2040. When the carbon price level stands at $60/tC, China’s carbon emissions peak will not arrive significantly earlier, although the emissions path will be adjusted noticeably compared to the $30/tC scenario. Cumulative carbon emissions will also decline significantly by 2030 and 2050. When the carbon price is increased to $90/tC, China’s carbon emissions will peak around 2030 and maintain that level until 2035, and then decrease.
In the combined policy scenario of carbon pricing and non-fossil energy subsidies, the evolution of carbon emissions shows a significant difference compared to that of the single policy scenario. First, in the combined policy scenario, a lower carbon price level can make an early carbon emissions peak possible. Specifically, with a carbon price level of $30/tC and a non-fossil energy price subsidy of 30%, China’s carbon emissions peak in 2030 and maintain that level to 2035, before decreasing. Moreover, the carbon emissions curve in the combined policy scenario shows little difference to that in the single carbon pricing policy scenario in the short term. In the medium and long terms, however, a gap develops: carbon emissions in the combined policy scenario are significantly lower than those in the single carbon pricing policy scenario. This is due to less renewable energy in the short term and the path dependence effect (once a path is entered it is difficult to leave).
Finally, we can conclude from the policy scenarios the following: Given that China’s carbon policy goal is to reach peak carbon emissions by 2030 (with no specific peaking level target), China could have various carbon emission paths to choose from. Which carbon pathway China is to pick will to a large extend dictate the policy pathway in the future.
A larger share of the energy mix for non-fossil energy is an important component of China’s intended nationally determined contributions (INDC). This study plots the evolution of China’s future non-fossil energy share in different policy scenarios, as shown in Fig. 43.

Note BAU = business as usual; T30 = tax 30%; S20 = subsidy 20%; etc.
Evolution of China’s non-fossil energy development in different policy scenarios.
In the BAU scenario where carbon pricing and non-fossil energy subsidy policies are absent, the evolution of the non-fossil share of the energy mix is stable—even in 2045–50, its share barely reaches 20%. With the introduction of the carbon pricing and non-fossil energy subsidy policies, the share of non-fossil energy increases. This study finds that the impact of non-fossil energy subsidies on the energy mix is greater than that of carbon pricing. The study also finds that in the combined policy scenario, the cost of fossil energy use is pushed up by the carbon pricing policy, which limits fossil energy demand; on the other hand, the cost of consuming non-fossil energy is lowered by the subsidy policy, which increases non-fossil energy demand. The simulation results show that in the single scenario of $90/tC carbon pricing and the single scenario of 30% non-fossil energy subsidy, the share of non-fossil energy is 15.2% and 18.4% respectively, neither of which is sufficient to reach the goal of a 20% non-fossil energy share by 2030. However, in the combined policy scenario of $30/tC carbon pricing and a 30% non-fossil energy subsidy, the share of non-fossil energy reaches 20.1% by 2030, thus achieving the goal. When the carbon price level is increased to $60/tC and $90/tC, the share of non-fossil energy will rise to 21.7% and 23.1% respectively. In the single carbon pricing scenario, the share of non-fossil energy will be around 30% by 2050, while in the single non-fossil energy subsidy scenario, the figure will reach 40%. In the combined policy scenario, the share of non-fossil energy will exceed 50% and even reach 57.6% in the strictest combined scenario of carbon pricing and non-fossil energy subsidy.
3.4.5 Comparison of the Three INDC Goals and Analysis of Their Relationships
This section briefly summarises how China can achieve its three INDC goals of reducing carbon intensity, reaching peak carbon emissions, and increasing the share of non-fossil energy in the energy mix to 20%, all by 2030.
In terms of carbon intensity, no additional policy efforts are needed to reduce carbon intensity by 60% by 2030. However, to ensure carbon intensity reduction by 65%, additional policy efforts are required, such as a low carbon-pricing scenario ($30/tC) or a single policy of 30% non-fossil energy subsidy.
The goal of reaching peak carbon emissions by 2030 is not possible in the single non-fossil energy subsidy or low carbon pricing scenario. It can only be delivered on schedule in the high carbon pricing scenario ($90/tC) or the combined policy scenario of carbon pricing and non-fossil energy subsidy.
In terms of non-fossil energy development, even if the high carbon pricing policy of $90/tC or high price subsidy policy of 30% is implemented, the share of non-fossil energy in primary energy demand will still be lower than 20% by 2030. The goal of 20% non-fossil energy share can only be achieved in combined policy scenarios (for example, a combination of a $30/tC carbon price and a 30% subsidy).
The analysis above shows that the carbon intensity goal requires the least additional policy efforts and is easiest to achieve, whereas the goal of 20% non-fossil energy share requires the greatest effort and is the most difficult.
4 The Impact of Information Technology on Energy Demand
4.1 The Evolution of IT and Its Impact on Energy Demand
From the 1990s on, continuous innovation in information technology (IT) and rapid, sustained development of the IT industry drove the world into the information age and, lately, the era of digitalisation. IT and digitalisation will inevitably trigger great changes in energy supply and in the demand patterns of businesses and people.
4.1.1 Evolution of IT
Informatisation is the extent to which an economy or society becomes information-based. It is an evolutionary process. In industrial society, the creativity of individuals, efficiency of businesses and organisations and the competitiveness of countries were restricted in both time and space. In the age of information, technological innovation continuously improves information infrastructure and increasingly refines production and management in business.
Evolution from the Internet to big data is inevitable. Information technology created the Internet, breaking the temporal and spatial boundaries between production, living and exchange. The emergence of desktop and laptop computers makes the computer an indispensable tool in business and in people’s lives. With the rise of smartphones and tablets, mobility expands the Internet, providing a broader and more convenient channel for people to obtain information. The Internet of things (IoT) greatly accelerates the informatisation process with its application in multiple fields, including intelligent transport, environmental protection, government, public security, disaster forecasting, smart homes, personal health monitoring, lighting control and intelligence gathering. These advances push the world into the era of big data. A digital world parallel to the physical world is created around the behaviour of individuals and organisations. It is a world in which information is stored and analysed and information-based predictions made. This capability will further reshape how we live, produce and consume.
4.1.2 The Impact of IT on Energy Demand
IT has many impacts on energy demand.
First, IT affects energy demand. As big data scales up, more and more energy-hungry data centres are needed to process and store the data. To address the high energy consumption of big data management systems, new energy-efficient hardware, powered by new and renewable energy technologies, is needed.
Second, the impacts and opportunities generated by the deep integration of new-generation IT and energy technologies enable the Energy Internet: IoT, cloud computing, big data and the blockchain merge with renewable power generation, decentralised energy resources and the smart grid. By connecting various systems like transport, power and natural gas with the Internet information system, the Energy Internet can connect multiple energy carriers, such as electricity, heating, cooling and gas across the entire value chain, from production, transmission and storage to consumption. This will help increase the share of renewable energy production and supply, and eventually enable a harmonious energy supply ecosystem based on renewables and driven by IT. Some developed economies in Europe and the Americas have already prioritised the Energy Internet. For example, Germany has developed the E-Energy programme to create a new energy network of digital interconnection, computer control and monitoring across the entire energy supply system. Blockchain technology will also drive development of the Energy Internet, opening up new applications and business models in energy generation, transmission, distribution, use and storage, and reshaping energy consumption patterns.
4.2 The Impact of IT on Household Energy Demand Modes
Household energy consumption accounts for 10% of China’s total energy, the second largest category after industry. Residential energy consumption affects not only people’s lives and well-being, but the environment and China’s carbon emissions as well. With household energy consumption rising, especially in urban areas, and energy infrastructure improving, IT can play a crucial role in changing household patterns of energy consumption.
4.2.1 Changing Patterns in Household Energy Demand
The ubiquity of the Internet makes it easier for people to consume energy and spend more time at home. The more they are at home, the more energy they consume—for household appliances, heating or cooling, or for surfing the Internet to buy non-energy-related products and services.
In the Internet age, people can pay their energy bills and buy almost any product online, which makes consumption easier. In transport, the emergence of ride-hailing apps like Didi Chuxing makes it easier for people to get around.
If the Internet stage of informatisation makes people’s energy consumption more convenient, then the next stage—big data—makes it intelligent. Household energy management is easier and more efficient, and energy consumption greener.
The Energy Internet centres on the large-scale deployment of renewable energy, especially distributed renewable energy. Big data analysis and cloud storage are crucial support technologies that can accelerate the development of the Energy Internet. In recent years, tech companies like Google and Alibaba have made inroads into the intelligent building and smart home industry. The smart home industry is likely to undergo rapid growth in the coming years.
As the Energy Internet and smart home systems evolve, the problems that face conventional energy networks—such as overproduction, low scheduling accuracy, high energy transmission losses and poor grid connections for new energy—will be solved, thus optimising the energy system, saving energy and reducing environmental impact.
By harnessing energy demand and supply information, energy providers can implement a scheduling strategy to make energy flow efficiently. They can also personalise household energy demand based on the energy consumption information they have collected. Households in turn can gain a deeper understanding of their consumption behaviour from the data.
The Energy Internet will revolutionise energy demand and make household energy consumption intelligent. When Internet titans can extract more accurate and richer information from big data and accurately push that information to individuals in a relevant manner, the changes in people’s indirect energy consumption will no longer be limited simply to convenience.
4.2.2 Changing Patterns in Household Energy Consumption
In the era of big data, one-way energy consumption will change. The role of residents will shift from traditional energy consumer to energy consumer and provider, or prosumer. Energy consumption will not be a one-way relationship, dominated by energy companies, but a two-way interaction.
IT triggers change on a comprehensive scale. The energy supply, transmission and consumption system—supported by technologies like sensors, high-speed networks, mobile Internet, smart terminals, cloud platforms, big data processing and geographic information systems (GIS)—has evolved into a new IT-driven energy supply and retail ecosystem. In the existing energy supply and retail system, energy production and consumption are strictly separated. Energy transmission companies (State Grid, for example), are responsible for supply and demand adjustments through the one-way transmission-consumption approach. The Internet and big data extend the concept of the consumer beyond a mere end user to a partner across the entire value chain. As the Energy Internet evolves and the cost of information falls, both suppliers and consumers will have access to market information like supply and demand and the price of raw materials via the Internet. This opens the possibility of decentralised trading, driving the shift from centralised to decentralised resource optimisation and allocation. With continuous deregulation of the power retail sector, there surely will be more and more trading parties in the energy supply and retail ecosystem. In addition, the combination of different trading parties, decentralised users and diversified energy sources will also drive the emergence of new business models.
It will be increasingly difficult to differentiate producers from consumers in the energy demand network. Power retail companies, industrial parks, buildings and even individual residents will have access to this ecosystem, directly generating two-way and even multiple-route transmission in energy consumption. This will strengthen the position of people as energy consumers. With the Energy Internet, households can choose from different energy consumption options to achieve the same effect. They can build the smallest energy supply and demand subnetworks through information sharing to lower their energy costs. They can build supply and demand models, based on energy prices and their own patterns of demand. Broadly speaking, households will not only benefit from the effects of IT on their energy consumption, they will impact the entire energy ecosystem themselves. For example, an electric vehicle is an interface with the energy ecosystem. It can be used as a means of transport or as an energy storage device to counter energy fluctuations. In Germany, surplus power from rooftop solar PV systems can be fed into the grid.
It is evident that IT has and will continue to change household energy demand patterns. Currently, IT has made household energy use increasingly convenient and diversified. In the future, as information technologies like mobile Internet, the Internet of things, cloud computing, big data and blockchain are effectively integrated, household energy consumption will evolve from convenient to green and intelligent, and its role will shift from passive one-way consumer to active two-way prosumer. IT brings infinite possibilities to household energy consumption.
4.3 The Impact of IT on Business Energy Consumption
IT applications show that extensive deployment of modern information technologies can substantially improve the efficiency of capital, technology and manpower, reduce energy consumption and costs, generate new business models and drive business transformation, thus changing energy production and consumption patterns.
4.3.1 Changes in Business Energy Use in the Age of IT
In the initial stage of IT in business, IT’s impact on business energy consumption is mainly confined to energy management information systems to improve energy use and make energy savings. Its role is to improve the business efficiency of individual companies.
As energy resources decline and energy demand grows, the share of energy in a business’s operating costs gradually increases. To lower operating costs and sharpen competitiveness, businesses have taken numerous measures to make their use of energy more efficient. However, before IT was widely deployed by businesses in China, the country was confronted by various challenges, including very high economic growth, poor management, low use of IT software and automation technologies, and inefficient energy use. Poor management means incomplete energy saving-related measurement, statistics and assessment; low IT use; and severe loss and waste of energy. Businesses were therefore in urgent need of an integrated energy management and control system. The energy management information system that evolved with Internet technology met this need. Its continuous improvement and wide deployment are an effective means to improve businesses’ IT-based energy management and energy efficiency.
An IT-based energy management information system provides monitoring, analysis and control of energy use—water, electricity gas, etc. With such a system, businesses can: (i) develop an energy procurement strategy to meet their production needs efficiently and cost-effectively; (ii) monitor and analyse energy consumption in their production processes; (iii) make timely scheduling of water, electricity, gas and fuel based on changing production and operational parameters; and (iv) unlock energy saving potential based on energy consumption data and monitoring. According to Chen Yanfei of the China Petroleum Planning and Engineering Institute, with an energy efficiency management system, energy-intensive industries like petrochemicals can monitor, analyse and assess plant energy consumption. The system provides IT-based visual management of energy use, optimises energy consumption in the production process and improves plant energy efficiency.
For energy-intensive industries like iron and steel, non-ferrous metals, chemicals and cement, energy management information systems are especially important. Before these systems existed, businesses had to record energy use manually, which often led to incomplete and missing data. Data plays a vital role in delivering energy savings, so data errors or incompleteness cause many problems. Despite their desire to save energy, businesses often attempt to do so without an energy-saving strategy. Without such a strategy, there is a risk of investing in popular energy-efficient technologies without considering their suitability. With an energy management information system, businesses gain a better understanding of their energy consumption and can develop an energy-saving programme for the weaknesses identified, thus improving energy efficiency.
4.3.2 Changes in Business Energy Consumption in the Age of Data Technology
As information technology evolves, the Internet changes how people live, work and think, profoundly. In this process, the role of data evolves from simple recording and analysis to advanced applications. It gradually becomes the second language of humankind, driving civilisation to evolve from the era of information technology to the age of data technology (cloud computing, IoT, big data and mobile Internet). The effects of data technology on businesses’ energy consumption include intelligent energy management, IT-based energy efficiency and improvement of the entire energy use value chain.
Data technology enables intelligent energy management in business. The Internet, big data and cloud computing allow companies to set energy efficiency benchmarks for their operations and equipment, Businesses can analyse and compare their energy use data, automatically evaluate their energy efficiency and generate energy consumption reports. Functionalities like real-time monitoring, timely adjustment of parameters and automatic alarms signalling faults or excessive energy use can be set up along the value chain, from procurement to consumption, making smart energy management possible. Through its online energy consumption monitoring system, CNPC Offshore Engineering Company Limited (CPOE) has practical experience of the operation and benefits of smart energy management. Li Peng, head of CPOE, said, “With the online energy consumption monitoring system, we can understand our energy use level in real time, effectively controlling our total energy consumption and achieving cost reductions. It also helps us take economic and social benefits into consideration when making decisions.”
The age of data technology makes IT-based energy efficiency possible. Intelligent automation systems enable businesses to control their energy use and flexibility by using the right type of energy at the right time at a given site. For instance, in buildings, the central air conditioning system accounts for more than half of total building energy consumption. As buildings become bigger and standards improve, the number of mechanical and electrical devices increases sharply. This equipment is deployed throughout the building and on all floors. A decentralised management system, requiring local monitoring and operation on each floor, would require a lot of human operators. If modern computer technology and network systems are used to create a centralised energy management system to continuously monitor all mechanical and electrical equipment, energy consumption and staffing can be reduced by about 25% and 50% respectively.
The age of data technology can improve the entire value chain of an industry. By integrating information technologies like smart detection of operational problems, advanced data display graphics, wireless communications and network control, IT can optimise resource allocation and make energy scheduling between businesses possible. In the power industry, for example, IT can: (i) optimise combustion to reduce fuel consumption in conventional power plants; (ii) improve scheduling efficiency through automated dispatch in power transmission; (iii) ensure grid reliability and power quality by enabling life cycle management of power metering devices in distribution networks; and (iv) prevent power shortages by adopting time-of-use (TOU) tariffs based on power demand patterns in retail.
4.3.3 IT Optimises Business Energy Demand
The Energy Internet is a network of equal exchange between distributors and consumers that enables power to flow in two or multiple directions between participants. It uses advanced power electronics, IT and smart management to integrate distributed energy resources, energy storage facilities and loads of various types into a single system. The Energy Internet can effectively address the geographical mismatch between energy production and consumption in China, reduce renewable energy curtailment, and improve businesses’ energy use.
The Energy Internet can improve the efficiency of new power generation hugely. When operating separately, the output from distributed energy resources is random and intermittent. When fluctuating distributed generation is connected to a conventional grid, it threatens grid security and reliability. To eliminate this threat and safeguard the grid, the amount of intermittent solar and wind power in the grid has to be limited, which results in severe wind and solar curtailments (i.e. a large proportion of the energy generated is not used). The Energy Internet solves this problem by enabling small distributed energy networks and microgrids to: (i) meet local consumption needs first; and (ii) export surplus energy to the larger grid. This significantly improves the use and efficiency of renewable energy.
The Energy Internet also plays a critical role in smart energy storage. When there is a renewable energy surplus, pumped storage power plants and electric vehicles can store the surplus and release it when needed. Smart household appliances like washing machines, dishwashers and water heaters can be programmed to consume energy when demand and tariffs are low. These energy storage facilities and smart household appliances can form a virtual power plant to address peak demand by releasing more energy into the network and by consuming it at the optimal time.
4.4 IT Drives Change in Energy Consumption
Currently, China is faced with unreasonably high energy use and low energy use efficiency. The Energy Internet is highly promising and will be of great significance to change China’s energy consumption patterns, especially by making the shift from centralised to distributed energy production possible.
4.4.1 The Rapidly Evolving Energy Internet
First, the fast and large-scale development of cities, industrial parks, high energy-consuming companies and green buildings means there is an urgent need for the development of the Energy Internet.
Second, China is confronted with such challenges as unsustainable energy production, low energy use efficiency and conservative thinking in the energy industry. The Energy Internet can reduce wind and solar power curtailment and improve power output and asset utilisation through big data-based life cycle management and interaction between multiple energy sources and loads. By integrating big data analysis on user energy consumption, energy management, demand response and smart homes that can sell surplus power, energy use efficiency can be significantly improved. Ultimately, more renewables in the energy mix and better energy use efficiency will drive change in the energy system.
4.4.2 From Centralised to Distributed Energy Trading
According to Professor Zeng Ming, Director of the Research Center of Energy and Electricity Economy, North China Electric Power University, electricity will eventually become a traded commodity. In the age of the Energy Internet, the traditional consumer is both a producer and a consumer (prosumer). Consumers can produce power with their own distributed renewable energy system. More importantly, they can provide user-side load resources to participate in demand response through smart energy solutions. Consumers can be active in community demand-side response projects, and also be part of a virtual power plant. In addition, consumers can also sell power to the grid from their electric vehicle and energy storage facilities.
5 Changes in Conventional Fossil Energy Demand
5.1 Coal
5.1.1 Current Status and Trends in Coal Demand
According to the official website of the Ministry of Land and Resources of the PRC, by the end of 2014, China’s proven reserves of coal were 1,531.7 billion tonnes (Bt), third largest after the USA and Russia. In 2015, China’s coal production was 3.75 Bt, down 3.3% from 2014, and 47% of the world’s total coal production. China’s coal consumption in 2015 was 3.965 Bt, down 3.7% from 2014, and 50% of the world’s total coal consumption. Coal’s share of China’s primary energy use was 64% in 2015, far higher than the world average of 30%.
In 2014, China’s total coal consumption was 4.116 Bt. Coal consumption in major industries and processes is shown in Fig. 44.

Source National Bureau of Statistics of China
China’s coal consumption in 2014.
In 2014, thermal power generation was China’s largest consumer of coal at 1,845.25 Mt, 44.82% of the total. Coal consumption by end users and in coking was 1,160.44 Mt (28.19%) and 628.94 Mt (15.28%) respectively, while that used for heating and in oil refining and coal chemicals was 224.45 Mt (5.45%) and 23.30 Mt (0.57%) respectively. Losses from coal washing and preparation were 233.75 Mt, which is 5.68% of total coal consumption.
China’s annual coal consumption from 2000 to 2015 is shown in Fig. 45. Consumption increased year by year, rising from 1.357 Bt in 2000 to 4.244 Bt in 2013, an annual growth rate of 9.5%. Consumption then dropped to 4.116 Bt in 2014 and to 3.965 Bt in 2015. Due to China’s slowing economic growth and increasingly strict environmental policies, controlling coal consumption has become an important means to adjust primary energy demand. There is, therefore, only a slim possibility that coal consumption will increase in the future. China’s coal consumption is forecast to decline to 4.08 Bt in 2020 and to 3.6 Bt in 2030. This indicates that China’s coal consumption peaked in 2013.

Source National Bureau of Statistics of China
China’s annual coal consumption, trend and forecast.
In the future, China’s coal sector will make vigorous efforts to achieve technological breakthroughs and implement successful demonstration projects in safe, efficient and intelligent coal mining and in clean, efficient and intensive coal use, thus improving the sustainability of the coal sector. In the 13th Five-Year Plan (2016–20), China placed total energy consumption high on the agenda. As a priority in controlling total energy consumption, coal’s share of primary energy is targeted to decline below 60%, while research on the development of commercial coal and clean coal use standards will be accelerated.
China is the world’s largest consumer of coal, followed by the USA, India, the EU and Japan. In 2014, China’s share of world coal consumption was 50.6%, while that of the USA, India, EU and Japan was 11.7%, 9.3%, 7.0% and 3.3% respectively. According to the BP Statistical Review of World Energy 2016, world total coal consumption dropped by 1.8% in 2015, compared to an average growth level of 2.1% in 2005–14, and coal’s share of world primary energy consumption dropped to 29.2%, the lowest since 2005. In 2015, coal accounted for 64% of China’s primary energy consumption, far higher than the world average of 29.2%. In addition, the net decrease in world coal consumption in 2015 came from the USA and China, declining by 12.7% and 1.5% respectively.
5.1.2 Opportunities in Coal Demand
(1) Huge potential in clean coal power generation and combined heat and power
Strong demand for power and great prospects for clean coal power generation. Clean coal power generation is the safest, most cost-effective and environmentally friendly way to use coal. Electricity will be the fastest-growing energy source in the next two decades, in China and in other countries. China’s annual demand for power is forecast to grow by 4.9% and 2.3% respectively in 2010–20 and 2020–30. In 2013, China’s power demand per capita (3,936 kWh/person) was higher than the world average (3,293 kWh/person). A year later it had risen to 4,047 kWh/person. By 2020, China’s power demand per capita and household power demand per capita will reach 6,200 Wh/person and 1,400 kWh/person respectively. Compared with gas-fired power generation, nuclear and wind, coal-fired power generation is safer and more cost-effective. Thanks to continuous technological innovation in recent years, near-zero emissions from coal-fired power generation are possible in China. Coal therefore has great prospects as China’s dominant energy source in clean coal power generation.
Development of combined heat and power (CHP) will be accelerated in order to increase the share of centralised coal burning in total coal consumption Currently, China’s centralised coal burning accounts for 48% of total coal consumption. The extremely large number of coal-fired facilities that are not equipped with pollution control technologies is a key contributor to air pollution. Industry experts have forecast that by substituting electricity for coal, PM2.5 emissions in east and central China will decrease by about 12%, 20% and 28% respectively in 2015, 2017 and 2020, compared to 2010. In contrast, 99% of coal consumption in the USA is used to generate power, which makes centralised pollution control of coal burning possible. In the future, China needs to take several measures to significantly increase centralised coal burning, thus reducing emissions from coal burning.
(2) Modern coal chemicals will be a breakthrough in future coal consumption
Modern coal chemical technologies include coal-to-oil, coal-to-olefin and aromatics, coal-to-ethylene glycol, and coal-to-gas. Compared with traditional coal chemicals, modern coal chemical processes are more scientific and environmentally friendly and make higher-quality and higher value-added products. As a complement to petrochemicals, modern coal chemicals can bring the benefits of China’s coal resources into play, reduce dependency on oil imports and strengthen China’s energy security. China’s modern coal chemical industry has made impressive progress since the 1990s. Technologies have been successfully tested in demonstration projects and upgraded to industrial-scale production facilities. Major breakthroughs have been made in advanced coal chemical synthesis, domestic coal chemical technologies have been commercialised and catalysts developed—all in China. All these advances have laid strong foundations for a clean, efficient and economically viable modern coal chemical industry.
5.1.3 Optimal Paths for Coal Consumption
The cleanest and most efficient ways to use coal are in power generation, coal-to-oil and coal-to-gas. In terms of energy efficiency, using coal-fired electricity to power electric vehicles is more efficient (28.6%) than using coal-to-oil for oil-fuelled vehicles (19.2%) and coal gas for gas-fuelled vehicles (13.3%). In terms of vehicle operating costs, if the oil products, natural gas and electricity are priced at RMB 7.72 per litre, RMB 3.1 per cubic metre and RMB 0.68 per kWh respectively, the operating cost of oil-fuelled buses is the highest at RMB 524,100/year, followed by buses fuelled with compressed natural gas at RMB 355,600/year and electric buses at RMB 352,000/year. As China’s natural gas industry becomes increasingly market-oriented, higher gas prices will be inevitable. Therefore, using coal-fired electricity to power electric vehicles is the most cost-competitive option. In terms of safety, oil and natural gas pose higher safety risks in storage, transport and use, while power generation, transmission, distribution and consumption are relatively safe. This makes coal-fired electricity for electric vehicles the safest option.
Coal-to-electricity is the safest and most cost-effective and environmentally friendly way to use coal. To achieve the goals of the energy revolution, China should follow the coal-based and electricity-centred guiding principles of substituting electricity for poor quality coal and using higher quality coal cleanly and efficiently. Meanwhile, China should continue to develop modern coal chemical technologies, including coal-to-oil, coal-to-gas and coal-to-olefins.
Use efficient and ultra-low-emission coal-fired power generating plants at scale. China should speed up development of large coal power bases, especially 100 Mt coal bases and 10 GW coal-fired power generation bases, and long-distance large-capacity power transmission systems (the West-East and North-South power transmission projects). China should also allow private enterprise to develop large, clean coal-fired power plants in major load centres like the Beijing-Tianjin-Hebei region, the Yangtze River Delta and the Pearl River Delta in accordance with the environmental requirements of ultra-low emissions.
Build combined heat and power (CHP) and combined cooling, heat and power (CCHP) plants. CHP and CCHP plants achieve two objectives: (i) they significantly improve coal use efficiency and the economy of thermal power plants; and (ii) they can reduce emissions and pollution by replacing a large number of small coal-fired boilers used for heating. The non-power sectors should reduce their use of scattered coal and increase the amount of electricity in their energy consumption. The use of coal-fired industrial boilers in the iron and steel, chemical and building material sectors should be strictly controlled. Secondary energy should be supplied by centralised power plants. CHP and CCHP should be used in heating and cooling load centres like urban centralised heating areas and industrial parks.
After years of development, China’s modern coal chemical industry has made major progress in four areas. First, independent coal gasification technologies have been widely deployed. More than 100 locally manufactured gasifiers are in operation, including opposed multi-burner gasifiers, HT-L pulverised coal gasifiers and two-stage dry pulverised coal gasifiers. Second, significant breakthroughs have been made in advanced coal chemical synthesis. Specifically, many locally developed technologies have been commercialised, including direct coal liquefaction and catalysts, high/low temperature Fischer-Tropsch synthesis and catalysts, methanol-to-low-carbon-olefins and catalysts, and fluidised bed methanol-to-aromatics and catalysts. Third, critical equipment for the production of coal chemicals has been locally manufactured in China, including large air separators, methanol-to-olefins reactors and the main pump valves. Fourth, the development and deployment of treatment technologies for waste gas, wastewater and solid waste in coal chemical production has made great progress, with near-zero discharge of wastewater now possible.
There are also many obstacles to overcome in the modern coal chemical industry. These include high consumption of resources, especially water; high capital investment in plants; difficulties in, and the high cost of, treating waste gas, wastewater and solid waste; and high CO2 emissions. In recent years, sharply declining international oil prices have lowered the price of oil-based chemicals, severely restricting growth for modern coal chemical companies. In the context of China’s slower economic growth, resource conservation and environmental awareness, the Chinese government has introduced increasingly strict policies for the coal chemical industry to raise the access threshold. It should be remembered that China is still modernising its coal chemical industry. In-depth research and prudence are needed.
5.2 Oil
5.2.1 Current Trends in Oil Demand
China’s remaining oil resources are still abundant—the geological reserves of new proven oil resources were 1.118 Bt in 2015 and have exceeded 1 Bt for nine successive years. By the end of 2015, China’s cumulative geological reserves of proven oil resources reached 37.176 Bt, including economically recoverable reserves of 2.569 Bt, with the reserves to production ratio at 11.9. China sustained oil production at a level above 200 Mt for six successive years; oil production reached 215 Mt in 2015, increasing by 1.5% compared with the previous year. Oil consumption grows continuously—in 2015, China’s oil consumption reached 550 Mt, rising by 6.1% compared with the previous year, and dependency on oil imports stood at 60.6%. The share of oil in China’s primary energy consumption is also increasing—in 2015, oil accounted for 18.1%, rising by 0.7% compared with the previous year, yet far below the world average of 32.9%.
In terms of oil demand, petrol, kerosene and diesel consumption was 97.76 Mt, 23.35 Mt and 171.65 Mt respectively in 2014. Petrol and kerosene use increased by 4.4% and 7.9% respectively from the previous year, while diesel consumption grew by 0.14 Mt. Figure 46 shows the production and consumption data of oil and major oil products in China from 2000 to 2015. In that period, China’s oil consumption grew rapidly. Compared with 2000, oil consumption in 2015 increased by 142%, but oil production grew only by 31.6%. The production of major oil products increases on a yearly basis. Kerosene production in 2015 was 17.35 Mt higher than in 2010, reflecting an average annual growth rate of 11.31% over the six years. The average annual growth rate of petrol was 8.52%, while that of diesel was much lower at 3.18%. The consumption of oil products also shows a yearly growth trend—from 2010, the average annual growth rate of petrol, kerosene and diesel was 7.04%, 5.76% and 3.15% respectively. As the gap between oil consumption and production expanded, China’s dependency on oil imports reached 60.6% in 2015, which posed huge challenges in terms of oil supply security. Diesel production was slightly higher than consumption, and their growth rates were basically the same. In 2014, the production of petrol and kerosene was 12.83 and 31.95% higher than consumption, which is consistent with China’s current diesel-petrol ratio of consumption. The diesel-petrol ratio peaked in 2005 and 2007 at 2.26:1, dropping to 1.76:1 in 2014.

Source Ministry of Land and Resources of the People’s Republic of China
China’s production and consumption of oil and major oil products, 2000–15.
As China’s industrialisation accelerated from 2000 and vehicle sales increased rapidly, oil consumption maintained a strong average annual growth rate of more than 5.6%. After 2009, as a result of China’s lower economic growth, industrial restructuring and the development of oil alternatives, oil consumption growth slowed down. The average annual growth rate of oil consumption in 2010–15 was 3.9%, with volumes at 544 Mt in 2015 (Fig. 47). This pattern of ongoing, but decreasing, growth will continue. During the 13th Five-Year Plan (2016–20), the average annual growth rate of China’s oil demand is expected to decrease to around 2%. After 2020, as China enters the later stages of industrialisation, its oil demand growth will slow even more, dropping to around 0.8% between 2020 and 30, with volumes rising slowly to 610 Mt in 2020. In general, China’s oil consumption follows an S-shaped growth trend that is expected to peak around 670 Mt in 2025–30, then stay relatively steady, before declining in 2035–40.

China’s oil consumption growth rate
In the forecast period, there are some uncertainties in China’s oil demand, especially in the development of alternative fuels. Once major breakthroughs are made in electric vehicle technologies, the development of the EV industry will exceed expectations, which may result in oil consumption peaking earlier than predicted.
As China’s vehicle ownership and air transport sector grow, demand for oil products also increases. Oil will remain the dominant transport fuel for at least the next 20–30 years. Demand for diesel in China is historically weak and will peak around 170 Mt in 2015–20. Demand for petrol will grow rapidly and is expected to reach around 170 Mt in 2030. The rapid development of air transport will increase demand for kerosene, which is predicted to rise to 36 Mt and 58 Mt in 2020 and 2030 respectively. The diesel-petrol ratio of consumption will inevitably fall, to 1.3:1 in 2020 and 1.1:1 in 2030.
As reported in the BP Statistical Review of World Energy 2016, global oil consumption grew by 94.61 Mt in 2015, up 1.9% from 2014 and far higher than the average annual growth rate of 1% in the previous decade. The share of oil in global primary energy consumption was 32.9%, an increase of 0.3% on 2014. China is the world’s second largest oil consumer after the USA, accounting for 12.9% of the world total in 2015. India replaced Japan as the world’s third largest oil consumer, with an oil consumption of 207 Mt. China ranked first in terms of incremental oil demand, followed by India, at 38.342 Mt and 15.437 Mt respectively. India has the world’s highest year-on-year growth rate for oil demand at 8.1%, 1.8% higher than China and far higher than the USA at 1.6% and the EU at 1.5%. Japan registered the world’s largest decline in incremental oil demand growth at 3.9%, equivalent to a drop of 7.967 Mt.
The growth rate of global oil production exceeded that of global oil consumption for two consecutive years after 2014. Global oil production growth stood at 139 Mt in 2015, up 3.2% on the previous year, and the fastest annual growth rate since 2004. Oil production in Iraq and Saudi Arabia hit record highs, and oil production in OPEC countries rose to 1.9 Bt in 2015, exceeding the previous record high of 2012. The world’s largest oil producer, the USA, also achieved record growth in oil production in 2015—an increase of 49.795 Mt on the previous year. Although China’s oil production was 4.9% of the world total in 2015, this was an increase of 1.5% on 2014.
5.2.2 Opportunities in Oil Demand
Improvements in fuel quality accelerate. China implemented the China IV petrol quality standard in 2014 and the China IV diesel quality standard in 2015. Provinces including Beijing, Shanghai, Jiangsu and part of Guangdong, have implemented the China V fuel quality standards ahead of schedule. As of January 2016, China supplied China V petrol and diesel in 11 provinces and cities in north-east China, with supply to be extended across the country from January 2017. China’s National Energy Administration released a draft of the China VI petrol and diesel quality standard in June 2016, which was enforced across China on January 1, 2019. China has completed the fuel specification upgrade from China II to China VI In 14 years. But further upgrades are expected, with China VI (B) for petrol scheduled to take effect in 2023, which will possibly lead to further reductions in olefins and increases in octane number.
China needs to reduce its diesel-petrol ratio urgently. After 2000, China’s fixed investment in refineries maintained strong momentum. As diesel demand grew, the diesel-petrol ratio of consumption increased correspondingly, reaching a record high of 2.26:1 in 2005 and 2007. As a result, the diesel-petrol ratio of production was higher in most of China’s refineries. However, the diesel-petrol ratio of consumption declined from 2008, falling to 1.76 in 2014. Due to weak diesel demand and strong petrol demand, the diesel-petrol ratio of consumption is expected to drop continuously, making it harder to reduce the diesel production ratio. To this end, China’s oil refineries must take comprehensive measures to restructure, thus improving fuel quality and efficiency and optimising production.
The fuel saving potential of vehicles is huge. China has been striving to improve vehicle fuel economy to reduce fuel consumption. As a result, the vehicle fuel economy indicator has been significantly improved. China began implementing the passenger vehicle fuel economy standard in July 2005. Initially, a single vehicle fuel consumption limit was adopted. Now, there are two indicators of fuel consumption limit: by vehicle model and by the corporate average fuel consumption (CAFC)/Target CAFC (TCAFC). In accordance with the Passenger Vehicle Fuel Consumption Limits and the Evaluation Methods and Indicators for Passenger Vehicle Fuel Consumption, effective as of January 1, 2016, the average fuel consumption of new vehicles is to be reduced to 5 l/100 km by 2020. In addition, energy efficiency and new energy vehicles are clearly identified as a priority in the Made in China 2025 strategy, which states that the fuel consumption of new passenger vehicles (new energy passenger vehicles included) should be reduced to 4 l/100 km by 2025. In 2015, the average fuel consumption of China’s passenger vehicles was 7.97 l/100 km. There is, therefore, huge potential to reduce vehicle fuel consumption to achieve the targets.
5.2.3 Optimal Paths for Oil Consumption
Optimal paths for upgrading of fuel quality. The major difficulty in upgrading fuel quality from China IV to China V lay in reducing sulphur content from 50 to 10 μg/g, which could be effectively addressed through petrol and diesel hydrodesulphurisation or adsorptive desulphurisation. This ensured full implementation of the China V standard as scheduled on January 1, 2017. The major difficulty in upgrading fuel quality from China V to China VI lies in reducing olefins without changing the octane number. Meanwhile, the declining diesel-petrol ratio and growing demand for petrol should also be taken into consideration. Firstly, breakthroughs in series alkylation technologies should be made. Alkylation is the principal method for upgrading fuel quality from China V to China VI. To upgrade fuel quality, research on series alkylation technologies, including solid acid alkylation and ionic liquid alkylation, should be increased to secure early breakthroughs. Secondly, catalytic cracking should be given priority and advances in catalytic cracking technologies made to improve petrol yield, reduce olefins, increase octane number and boost propylene production. Through isomerisation and etherification of olefins in catalytic cracking light petrol, reduction of olefins while increasing octane number can be made possible. Thirdly, optimisation of refining-chemical integration should be enhanced and optimisation techniques like hydrocracking and catalytic reforming adopted to increase yields of high-octane petrol and low-cost raw materials for ethylene and aromatics. Fourthly, hydrogen costs should be lowered, as this largely determines petrol and diesel production costs.
The most important ways to reduce the diesel-petrol ratio include optimising oil refining units, improving production technologies, reducing diesel output and increasing the production of petrol. Specifically, the production of alkylated and isomerised fuels can be increased to improve the octane number and increase petrol output. Poor-quality diesel fuels like catalytic cracking diesel and recycled diesel can be converted into petrol components of high-octane number or aromatic hydrocarbon products, thus reducing diesel production. Integrated refining and chemical companies should reduce straight-run naphtha and properly increase straight-run diesel as the raw material for ethylene. In addition, diesel exports can be increased to release diesel overcapacity, and a national fuel pricing mechanism should be leveraged to gradually reduce the diesel-petrol ratio of production and promote diesel sales.
For example, a company with an integrated 10 Mt oil refining plant and 1 Mt ethylene plant, faced with reducing its diesel-petrol ratio and coping with slowing growth in demand for oil products, would need to shift production from diesel and petrol to high-grade petrol, aviation kerosene, clean diesel and low-cost chemicals. That is, it would need to shift its production focus from fuels to chemicals. A change like this takes time. Structural adjustments need to be speeded up during the 13th Five-Year Plan (2016–20) to allow more low-quality raw materials to enter ethylene cracking plants.
Given the current situation in China, the paths for vehicle energy saving can be categorised as technological and non-technological. Technological paths include improving the lubrication and cylinder fuel injection systems to raise the conversion efficiency of the internal combustion engine. The engine ignition system should be improved to boost engine stability, component service life should be increased to reduce the need for spare parts, and design modifications made to enhance fuel economy. Advanced energy-efficient technologies should be developed to improve the performance and fuel economy of hybrid electric vehicles, petrol and diesel engines, heavy-duty vehicles and engines, and diesel-fuelled saloon and light-duty vehicles. Non-technological paths include the provision of sufficient highway and transport facilities, on-demand production of vehicle models and oil products, and fuel-efficient driving, all of which can significantly reduce vehicle energy consumption.
5.3 Natural Gas
5.3.1 Current Trends in Natural Gas Demand
According to the Ministry of Land and Resources of the PRC, by the end of 2014, China’s proven reserves of natural gas were 4.9 trillion cubic metres. In the same year, China imported 33 billion cubic metres of gas, accounting for 55.5% of total gas imports. Most of these gas imports came from Turkmenistan, with a small amount from Uzbekistan, Kazakhstan and Myanmar. Imported liquefied natural gas (LNG) was 18.93 Mt (equivalent to 26.5 billion cubic metres), accounting for 44.5% of total gas imports. These LNG imports came mainly from Australia, Indonesia, Malaysia and Qatar.
In 2014, China’s apparent natural gas consumptionFootnote 10 stood at 186.89 billion cubic metres, including domestic gas of 130.16 billion cubic metres and imported gas of 59.13 billion cubic metres. China’s gas exports were 2.61 billion cubic metres. Total gas consumption by industry; households; transport, warehousing and postal services; wholesale, retail, accommodation and catering; and other sectors was 122.13 billion cubic metres (65%), 34.2 billion cubic metres (18%), 21.44 billion cubic metres (12%), 4.66 billion cubic metres (3%) and 4.4 billion cubic metres (2%) respectively (Fig. 48).

Source National Bureau of Statistics of China
China’s natural gas consumption in 2014.
China’s natural gas consumption was 46.7 billion cubic metres in 2005 and 106.9 billion cubic metres in 2010, jumping to 192 billion cubic metres in 2015. As China increases its efforts to reduce carbon emissions and control pollution, during a period of growing urbanisation, its demand for natural gas will gradually increase. China’s natural gas consumption is predicted to reach 290 billion cubic metres in 2020, equal to an average annual growth rate of 7.5%, and 480 billion cubic metres in 2030. The share of natural gas in China’s total energy consumption will increase from 5% in 2015 to 12% in 2030.
By sector, gas demand in mining will peak and then decline, while that of manufacturing will grow, sourced mainly from coal-to-gas. Gas demand in power generation and heating holds huge potential and could increase substantially in the future. Increased gas demand in transport will come mainly from vehicles fuelled by compressed or liquefied natural gas. Gas demand by households will maintain steady growth. Figure 49 shows the trends and forecasts for China’s natural gas demand over 30 years.

Source National Bureau of Statistics of China
China’s natural gas consumption, 2001–30.
China is one of the world’s largest natural gas consumers in terms of total consumption, but its gas consumption per capita is lower than comparable countries. In 2014, China’s gas consumption (187 billion cubic metres) ranked third in the world, but was only 25% that of the USA (759.4 billion cubic metres) and 46% that of Russia (409.2 billion cubic metres). However, China’s gas consumption per capita (137 m3/person) was only 5.8% that of the USA (2,382 m3/person), 4.8% that of Russia (2,845 m3/person) and 29.3% of the world average (467 m3/person). Even if China’s total gas consumption reaches 480 billion cubic metres and gas consumption per capita registers 350 m3/person in 2030, it would be no more than 75% of world average gas consumption per capita in 2014.
5.3.2 Opportunities in Natural Gas Demand
(1) High growth potential in transport
Compared with oil products, natural gas as a vehicle fuel delivers many benefits. It is safe, efficient, cleaner and low carbon. In 2000–14, natural gas consumption in China’s transport, warehousing and postal services sector increased from 880 to 21,440 million cubic metres, which is an average annual growth rate of 25.6%, a figure far higher than that of petrol (8.5%) and diesel (9.5%) in transport in the same period. The sector’s share of China’s total gas consumption increased from 3.6 to 11.5%.
In recent years, gas-fuelled vehicles have developed rapidly in China, mainly in compressed and liquefied natural gas (CNG and LNG). In 2000, there were only around 6,000 gas-fuelled vehicles registered in China. In 2010, there were 1.11 million units (1.10 million fuelled by CNG and 10,000 by LNG). By 2014, the figures had escalated to 4.595 million units (4.411 million fuelled by CNG and 184,000 by LNG), making China the leader in gas-fuelled vehicles with 20% of the world total. From the second half of 2014, the market turned due to China’s slowing economic growth, weak demand in transport, sharp decline in international oil prices and high natural gas prices. As China increases its efforts to prevent and control air pollution, development of gas-fuelled vehicles, especially freight vehicles and urban buses, will be fast-tracked. China’s gas demand in transport is expected to rise to 37 billion cubic metres in 2020 and 52.3 billion cubic metres in 2030.
(2) Rising gas demand in power generation
Compared to coal, gas-fired power generation delivers many benefits, including high energy conversion efficiency, strong peak shaving capacity, small gas turbine footprint, fast start and stop, large single unit capacity, safe and stable operation, and low emissions of pollutants and CO2. By the end of 2015, China’s installed capacity of gas-fired power generation was 66.37 gigawatts, accounting for only 4.4% of China’s total installed power generating capacity and 20% of the world average.
Affected by such factors as low levels of indigenously manufactured equipment, high procurement and maintenance costs, slow progress in power market reform and high gas prices, China’s gas-fired power generation is less cost-effective than coal, hydropower and nuclear power. Gas-fired power generation projects in China make only small profits at best. Others are loss-making, so the industry takes a wait-and-see attitude to assess those projects under construction or planned. In 2014, power generation accounted for 14.1% of China’s total gas demand, far below that of the USA (30.4%), the UK (38%), Germany (36%) and South Korea (44%). Given the environmental benefits of gas-fired power generation, the segment holds strong growth potential.
(3) Steady growth in household gas demand
In 2000–14, China’s gas pipeline capacity increased from 33,700 to 434,600 km, an average annual growth rate of 18%. As China’s long-distance gas transmission and urban gas distribution pipeline networks grew, gas demand by households rose just as rapidly. In 2000–14, household gas demand increased from 3.23 billion cubic metres to 34.26 billion cubic metres, averaging 18.4% annually, according to the National Bureau of Statistics of China. Gas demand per capita increased from 2.6 to 25 m3/person, with urban gas demand per capita rising from 7.0 to 45.7 m3/person. At the end of 2015, the total population of mainland China was 1.374 billion, of which 771 million were urban residents, 56% of the total. As more people move into cities, China’s urbanisation rate will reach 60% in 2020 and 70% in 2030, and the number of residents using gas will also grow. Household gas demand in China is forecast to rise to 48 billion cubic metres in 2020 and 62 billion cubic metres in 2030, about 13% of total gas demand in 2030.
5.3.3 Optimal Paths for Natural Gas Demand
(1) Optimal paths for gas-fuelled vehicles
By 2020, the number of gas-fuelled vehicles in China is expected to reach 10.5–11 million units, including 400,000–500,000 vehicles fuelled by LNG. Together, they will account for more than 5% of China’s total vehicle stock. The number of LNG service stations will amount to 4,500–5,000.
Gas-fuelled vehicles have significant environmental and cost advantages over petrol and diesel. The operating cost of natural gas transport fuel is lower than that of petrol and diesel. Compared with electric and other new energy vehicles, gas is a more mature technology. Gas-fuelled vehicles perform better, have a longer driving range and are safer.
Small gas-fuelled passenger vehicles like urban taxis and family saloons have lower operating costs, according to the China Automotive Technology and Research Center. The fuel cost of a CNG-fuelled taxi driving 350 km a day is only 45% that of a petrol-driven taxi (measured at the Beijing price level in March 2016). This amounts to a lower daily fuel cost of RMB 85, or RMB 30,000 per year over 350 days. Even though it costs up to RMB 10,000 to convert a small taxi from petrol to CNG, operating costs are much lower than those of petrol taxis.
LNG offers a long driving range and is more suitable for large trucks and urban buses. The price of an LNG-fuelled heavy-duty truck is RMB 80,000–100,000 higher than a diesel truck of the same horsepower. Given the price of LNG is only 50–70% that of #0 diesel of the same calorific value, the fuel cost of an LNG-fuelled heavy truck travelling 150,000 km per year is around RMB 140,000 lower than diesel, enabling the difference in purchase price to be recovered in less than a year.
(2) Optimal paths for gas-fired power generation
Constraints are holding back the development of gas-fired power generation in China. These include barriers to collaboration on critical technologies between China’s major gas-fired equipment manufacturers and overseas companies, a lack of locally developed gas-fired alternative technologies, uncoordinated gas supply and power generation, incomplete support policies and standards, and rising gas prices. And power plant design, construction, operation and maintenance, and safety management need to be improved.
To make gas-fired power generation sustainable, China should: (i) increase investment in innovation and develop core technologies, including gas-fired power generation equipment; (ii) unplug the management bottlenecks in the power and gas industries; and (iii) deepen power system and gas pricing reform, and allow the market to truly play the decisive role in resource allocation.
To summarise, due to technology and pricing constraints, there are still big uncertainties in China’s gas-fired power generation sector. However, with sufficient support from the government and breakthroughs in local development of core technologies, the sector has great growth potential in the future.
5.4 Accelerate the Integration of New Energy with Conventional Fossil Energy
In the vast country of China, the geographical distribution of fossil energy and new energy sources like solar, hydro, wind and biomass is uneven. Due to unbalanced economic development in east, central and west China, energy supply and demand in these regions vary greatly. Energy development should therefore be adapted to local conditions and local energy resources. National energy revolution policies should be implemented to diversify energy demand. And, energy consumption should consistently follow resource conservation and be clean, sustainable and efficient.
An integrated development system and cooperation platform for conventional and new energy should be established. Currently, conventional energy and new energy develop separately. A cooperation platform that gives play to their complementary advantages and delivers synergies is absent. For instance, the long-distance transmission of solar photovoltaic and wind power needs the infrastructure of coal power transmission networks. But due to higher energy costs and unstable output, as well as constraints from the power industry, it is difficult to connect new energy to the grid and deliver it to consumers. China, therefore, needs to build a flexible cooperation platform for different types of energy demand to speed up the integration of conventional and new energy.
Subsidy policies should be improved to drive the sustainable development of new energy. It will take a long time for new energy to replace fossil fuels, but the shift is already under way. The initial stages of new energy development are characterised by high capital investment, low returns and high production and operating costs, so national subsidy policies are needed. When new energy technologies mature and their costs fall to an acceptable level, new energy can be fully integrated in the energy market. New energy subsidy policies are indispensable, but they should be proper and reasonable, thus encouraging technological innovation and the sound development of the new energy sector.
6 Electrification of Energy Demand
International experience suggests there are three key factors that have historically driven electrification rates: technological progress, increased income and structural change.
Technological progress has been the most important driver of electrification, particularly in buildings. Assuming a continuation of historical technology trends, this driver could increase China’s electrification rate by 6 percentage points by 2050.
Income increases could raise China’s electrification rate by more than 5 percentage points by 2050, as consumers demand a higher quality energy carrier in terms of flexibility and cleanliness.
Given structural change affects electrification, a move to less power-intensive sectors implies lower electrification rates: an increased share of transport in energy use in China is expected to reduce the electrification rate by 3 percentage points by 2050.
In the future, decarbonisation will be a key driver of electrification, as the power sector can be decarbonised relatively easily and electricity used across end uses. Decarbonisation will increase electrification of the transport and buildings sectors, principally due to the uptake of electric vehicles and heat pumps. However, further electrification of industry is challenging due to technical constraints (Fig. 50).

Source International Energy Agency World Energy Balances
Electrification rates tend to increase with income, with China achieving rapid electrification over a short period of time.
China’s electrification rate could increase from 23% today to 32% by 2050 on the basis of historical experience of macroeconomic drivers, or to 40–48% indicatively as a result of future trends in decarbonisation. To achieve these high rates of electrification, policymakers may wish to implement a range of policy packages to overcome increased peak load variability, underdeveloped networks, investment and behavioural barriers, and innovation constraints.
6.1 Macroeconomic Drivers of Electrification
Technology, income and economic structure drive changes in electrification rates.
Technology effect: Common technology trends across countries over time have led to increased levels of electrification. A country today will be more electrified than a country in the 1990s with the same level of income. Technology could contribute 6 percentage points to China’s electrification rate by 2050.
Income effect: Level of electrification increases with income. A country with a higher income level will be more electrified than a country with a lower income level in the same period, all things being equal. Income could contribute 5 percentage points to China’s electrification rate by 2050.
Structural change: Differences in economic structure lead to different levels of electrification. A country with more energy use in an electricity-intensive sector, such as buildings, will have greater levels of electrification. Structural change will lower China’s electrification rate by 3 percentage points by 2050.
To estimate this, we use a fixed effect (within) model. This uses the panel dimension of the dataset to account for both entity and time fixed effects. Geology is an example of an entity fixed effect that varies across countries but not across time; and general electrification due to technological progress is an example of a time fixed effect that varies across time but not across countries. The time trend chart is generated by storing and plotting the time fixed effects. It shows the common electrification trend across time, controlling for income and entity fixed effects (i.e. country-specific factors such as latitude and geology).
Technological progress includes the introduction of new electricity-powered services, as well as the substitution of electricity for other energy sources. An economy reaching a given income level in 2015 can expect around 18 percentage points more electrification in buildings than an economy at that income level in 1960, due to technological progress in those 55 years. Transport has seen little technological progress in electrification over time, resulting in a statistically insignificant time effect.
Assuming historical trends in electrification from the 1960s will continue, and based on the China GDP forecast for 2050, China’s 2050 electrification rate will be similar to the electrification rate of select developed countries, but the electrification level of sectors will vary greatly (Figs. 51 and 52).

Source Vivid Economics
Technological progress has historically been the most important driver of electrification.

Source Vivid Economics
Sectors have different power intensities, which are expected to increase over time with new technology and higher incomes.
Structural change tends to shift activity to less power-intensive sectors, such as transport, as is likely to occur in China. There are two different electrification paths: one is for economic structure with a high share of industry, as in South Korea; and the other is for economic structure with a low share of industry, as in the UK.
In addition to technology, income and structure, a set of country-specific characteristics determines the potential for electrification, including urbanisation level, share of heavy industry, climate and resource endowment. For example, a highly urbanised and heavy-industry oriented country typically has a higher electrification level.
After controlling for technological progress and country-specific effects, the income effect on electrification is significantly reduced. An economy growing from $15,000 per capita to $40,000 per capita can expect to increase electrification by around 4 percentage points, when controlled for technological progress and country-specific effects (Figs. 53, 54 and 55).

Note IEA 2017 B2DS = International Energy Agency, Beyond 2°C Scenario (2017). Source Vivid Economics
Structural change tends to shift activity to less power-intensive sectors.

Source Vivid Economics
Country-specific characteristics affect the potential for electrification.

Source Vivid Economics
Income effect on electrification.
China’s electrification rate could increase from 23 to 32% by 2050, based on historical international experience of macroeconomic drivers. Increase in income leads to an increase in electrification of 5 percentage points, and technological progress adds another 6 percentage points. Structural change decreases electrification by 3 percentage points, as the share of energy use for transport (currently the least electrified) rises by 7 percentage points, whereas the share of industry (currently the most electrified) falls by 6 percentage points (Fig. 56).

Source Vivid Economics
China’s electrification rate could increase from 23 to 32% by 2050.
6.2 Decarbonisation Drivers of Electrification
Decarbonisation is expected to accelerate electrification and lead to somewhat higher overall rates. For example, the median of low-carbon scenarios analysed by the Intergovernmental Panel on Climate Change puts global electrification at 35% in 2050, compared to 30% for the median of high-carbon scenarios. This is because electricity can be decarbonised with relative ease compared to other energy carriers, and there are electricity alternatives to conventional technologies in transport, buildings and industry.
Transport
Transport has the greatest scope for electrification, with just 1% of transport energy powered by electricity in OECD countries. Infrastructure is key for light-duty vehicle electrification, while freight and air electrification are limited by technical constraints.
Light-duty vehicles: High costs to consumers and development of charging infrastructure, particularly fast charging stations in high-density urban areas, constrain uptake. Range anxiety remains a behavioural barrier. However, these constraints are expected to be lowered in the future.
Heavy-duty vehicles: Electrification requires major investment in either catenary lanes, costing $2 million per kilometre, or in expensive inductive charging infrastructure, which is lower efficiency and requires vast changes to the existing infrastructure.
High-speed rail: Limited to specific regions of high-population density; it also requires significant infrastructure investment in electric trains and train lines. Modal shift and behavioural barriers are key to unlocking the benefits of rail electrification.
Shipping: Limited potential for electrification, possibly limited to coastal shipping due to shorter distances.
Air: Limited potential in electrifying air transport unless major technology breakthroughs occur (Fig. 57).

Source International Energy Agency, Energy Technology Perspectives (2017), Bloomberg New Energy Finance (2017)
The share of passenger electric vehicles is expected to be more than 60% by 2050, due to falling battery costs.
6.3 Buildings
Water and space heating have the greatest potential for increased electrification, although they face cost barriers.
Lighting and appliances: There are no technical limits to electrification; both are already electrified in developed economies.
Air conditioning: There are few barriers to electrification; 75% of air conditioning in developed countries is electrified. Electricity demand is expected to increase with rising demand for air conditioning as incomes increase in hot, humid areas.
Cooking: Electric options exist with moderate barriers to further electrification. In rural areas biomass dominates cooking energy use; in non-rural areas electrification rates depend on the presence of competing gas networks.
Water heating: Key electrification technologies are electric water boilers and heat pumps, though high capital costs and competing gas networks keep uptake rates low.
Space heating: Electric options exist with high barriers to increased electrification. Technologies such as heat pumps are limited by latitude, existing consumer attitudes, available space, building envelope efficiency and large switching costs (Fig. 58).

Source IEA ETP 2017; GEA Energy pathways for sustainable development (2014); Greenpeace Energy Outlook 2015
Several decarbonisation scenarios suggest up to two-thirds of energy demand in OECD buildings could be electrified by 2050.
Industry
Electrification options exist for many medium- and high-grade industrial heat processes, though relative costs remain high.
Iron and steel: Electric arc furnaces hold significant potential for scrap-based crude steel production. In iron production, electrowinning (extracting iron from the ore through electrolysis), is still in its early stages of development.
Chemicals and petrochemicals: Electrothermal furnaces could potentially be used for a variety of petrochemical cracking processes, though it remains a marginal technology. Ammonia production through grid electrolysis is technically feasible.
Cement: Electrothermal dryers can be used for clinker calcination. While technically feasible, the extremely high heat requirements of clinker production make electrification of the process prohibitively high cost.
Pulp and paper: Electrothermal technologies, such as induction or electric arc furnaces, can be used in medium-heat pulp and paper drying processes. These technologies are increasingly cost-competitive.
Aluminium: Electrothermal dryers can be used for the bauxite reduction process, though technical availability is low. Production of fused aluminium oxides in electric arc furnaces by electrothermal fusion is commercially feasible, though it remains a marginal process.
Decarbonisation will raise electrification of transport and buildings due to electric vehicle and heat pump uptake, but industry options are limited.
In summary:
Transport
-
Passenger transport electrification will be driven by falling battery costs and increasing electric vehicle cost competitiveness.
-
Freight, shipping and air transport energy end uses are more difficult to electrify.
Buildings
-
Building electrification could increase from less than a quarter to more than half globally in a decarbonising world by 2050.
-
Progress depends on the diffusion of heat pumps and electric boilers for space and water heating and behavioural change away from fossil fuels.
Industry
-
Industry has limited scope for electrification.
-
Electric arc furnaces hold promise in steelmaking, but further R&D is necessary to support deployment.
-
However, technical limitations and low capital turnover rates limit scope elsewhere (Fig. 59).
Fig. 59 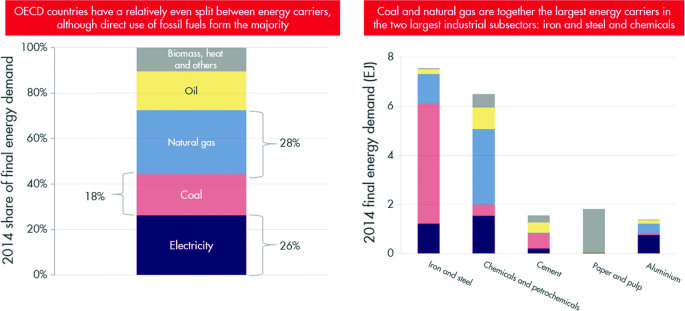
Source International Energy Agency, Energy Technology Perspectives, Beyond 2°C Scenario (2017)
Less than a third of OECD industry energy demand will be electrified in 2050, according to the IEA Beyond 2°C Scenario.

6.4 China’s Electrification Potential
China’s electrification rate could rise to 32% by 2050 given macroeconomic drivers, or to 40–48% given decarbonisation drivers.
-
Income effect: +5.5%
-
Technology: +6.4%
-
Structural change: −2.6%
Total electrification rate under macroeconomic drivers: 32.4%.
-
Decarbonisation in transport: +5 to 10%
-
Decarbonisation in buildings: +2.5 to 5%
-
Decarbonisation in industry: +?%
Total electrification rate under decarbonisation drivers: 40–48% (Fig. 60).

Note IEA 2BDS = International Energy Agency, Beyond 2°C Scenario. Source Shell International
China’s electrification rate could rise to 32% by 2050 given macroeconomic drivers, or to 40–48% given decarbonisation drivers.
6.5 Constraints and Policy Suggestions
Policymakers must consider a range of systemic and sector-specific constraints, such as increased peak load variability, underdeveloped networks, investment and behavioural barriers, and hurdles preventing innovation.
Seasonal and daily fluctuations in energy demand will increase in proportion to the uptake of electric vehicles, electric heating and renewable generation. Heightened peak load variability can be overcome with more grid interconnections and flexible markets. The policy responses include:
-
increase investment in energy storage technologies, such as batteries (although this is expensive and only technically feasible for short-term energy storage);
-
promote grid interconnections to facilitate a more flexible energy distribution system;
-
increase reserve electricity generation capacity to meet unpredictable daily demand peaks; and
-
adopt demand-tiered electricity pricing to discourage electricity use during peak periods and spur consumption during off-peak times.
A lack of support infrastructure for electrified technologies will depress the uptake of electrified products and reduce learning-by-doing cost reductions. Policy responses to network constraints include investment in charging networks and efficiency mandates:
-
direct support across the entire electric vehicle ecosystem, including maintenance, repairs and charging stations;
-
mandate electrified technologies in public buildings to build up technical know-how and facilitate the creation of a support network; and
-
implement building, industry and transport efficiency standards to ensure product uptake across the broadest set of consumers and businesses, which will reduce overall electricity demand and ease network pressure.
Investment and behavioural barriers: Investors may be unwilling to invest in electrified technologies due to uncertainty over investment returns on electrified products. Consumers may prefer gas or biomass options. Investment and behavioural barriers can be overcome through the following policies:
-
apply stable and consistent tax benefits and subsidies to consumers and suppliers across energy carriers;
-
maintain a credible electrification policy to mitigate investor uncertainty and spur investment;
-
build product networks to encourage the formation of liquid secondary markets for assets associated with electrified processes to reduce asset resale uncertainty; and
-
increase support for energy service companies to encourage heat pump uptake during building and industry retrofits.
In terms of innovation, private companies and individuals are often unwilling to invest resources in underdeveloped technologies. Innovation support is required to reduce technology costs and increase electrification in more challenging subsectors:
-
increase tax benefits and direct expenditure for research, innovation and demonstration;
-
develop R&D ecosystems and support learning by doing to facilitate technology transition from laboratories to product commercialisation; and
-
focus innovation support on areas with substantial electrification potential (shipping, heavy-duty trucks, aviation).
6.6 Conclusion
Electricity is almost a quarter of China’s final energy demand. China has already proved its capacity to electrify rapidly, and electricity could meet almost half of final energy demand by 2050. China’s electrification rates are comparable to many OECD economies.
As the country grows, with consumers demanding higher quality energy carriers, and technology and structural shifts drive further changes, historical experience suggests that driven by these macroeconomic factors, China’s electrification rate could increase from 23% today to 32% in 2050.
Decarbonisation will further drive the process. A high uptake of electric vehicles in transport and heat pumps in buildings could increase China’s electrification rate to 40–48% in 2050.
To achieve this, policymakers may wish to implement a range of policy packages to overcome increased peak load variability, underdeveloped networks, investment and behavioural barriers and innovation constraints.
Notes
- 1.
- 2.
Kepei Men, Lianyu Jiang and Hongting Zhu, China Population Projection Based on Two New Grey Models. Economic Geography, Volume 27 (6): pp. 45–49 (2007).
- 3.
Anderson, D. and Winne, S., Innovation and Threshold Effects in Technology Responses to Climate Change. Working Paper 43, Tyndall Centre for Climate Change Research, (2003).
- 4.
McDonald, A., Schrattenholzer. L., Learning Rates for Energy Technologies. Energy Policy 29, pp. 255–261, (2001).
- 5.
Rout, U.K., Blesl, M., Fahl, U., Remme, U. and Voß, A,. Uncertainty in the Learning Rates of Energy Technologies: An Experiment in a Global Multi-regional Energy System Model. Energy Policy 37, pp. 4,927–4,942, (2009).
Rubin, E. S., Azevedo, I. M. L., Jaramillo, P. and Yeh, S., A review of Learning Rates for Electricity Supply Technologies. Energy Policy 86, pp. 198–218, (2015).
- 6.
Jiankun He, China’s Energy Development and Response to Climate Change. China Population, Resource and Environment, Volume 21 (10): pp. 40–48, (2011).
- 7.
Jiankun He, CO2 Emission Peak Analysis: China’s Emission Reduction Goals and Policies. China Population, Resource and Environment, Volume 23 (12): pp. 1–9, (2013).
- 8.
Raupach, M. R., Davis, S. J., Peters, G. P. and R. W. Andrew, et al. Sharing a quota on cumulative carbon emissions. Nature Climate Change, 4: pp. 873–879, (2014).
- 9.
McKinsey & Company, Pathways to a low-carbon economy: Version 2 of the global greenhouse gas abatement cost curve. New York, McKinsey & Company, (2009).
Jian-Lei Mo and Zhu, L., Using floor price mechanisms to promote carbon capture and storage (CCS) investment and CO2 abatement. Energy and Environment 25(3/4), pp. 687–707, (2014).
- 10.
Apparent gas consumption is a country’s dry natural gas production plus imports minus exports.
Author information
Authors and Affiliations
Corresponding author
Editor information
Editors and Affiliations
Rights and permissions
Open Access This chapter is licensed under the terms of the Creative Commons Attribution 4.0 International License (http://creativecommons.org/licenses/by/4.0/), which permits use, sharing, adaptation, distribution and reproduction in any medium or format, as long as you give appropriate credit to the original author(s) and the source, provide a link to the Creative Commons license and indicate if changes were made.
The images or other third party material in this chapter are included in the chapter's Creative Commons license, unless indicated otherwise in a credit line to the material. If material is not included in the chapter's Creative Commons license and your intended use is not permitted by statutory regulation or exceeds the permitted use, you will need to obtain permission directly from the copyright holder.
Copyright information
© 2020 The Author(s)
About this chapter

Cite this chapter
Jianlong, Y., Haigh, M. (2020). Special Report 2: Research on China’s Energy Demand Revolution. In: China's Energy Revolution in the Context of the Global Energy Transition. Advances in Oil and Gas Exploration & Production. Springer, Cham. https://doi.org/10.1007/978-3-030-40154-2_3
Download citation
DOI: https://doi.org/10.1007/978-3-030-40154-2_3
Published:
Publisher Name: Springer, Cham
Print ISBN: 978-3-030-40153-5
Online ISBN: 978-3-030-40154-2
eBook Packages: Earth and Environmental ScienceEarth and Environmental Science (R0)